Embed Size (px)
Citation preview
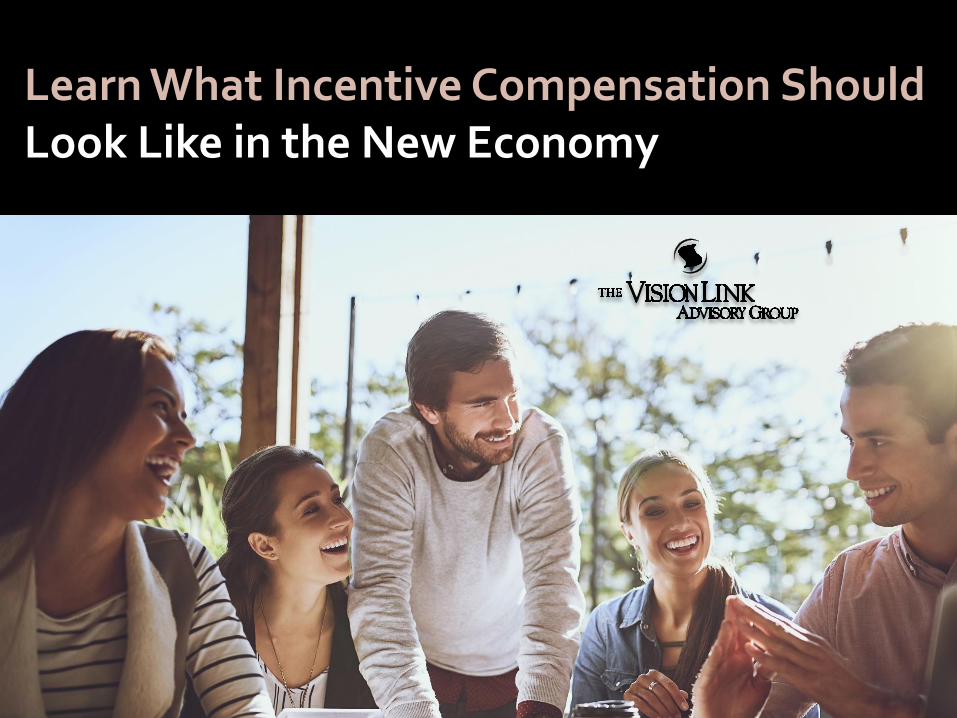
Learn What Incentive Compensation ShouldLook Like in the New Economy

22
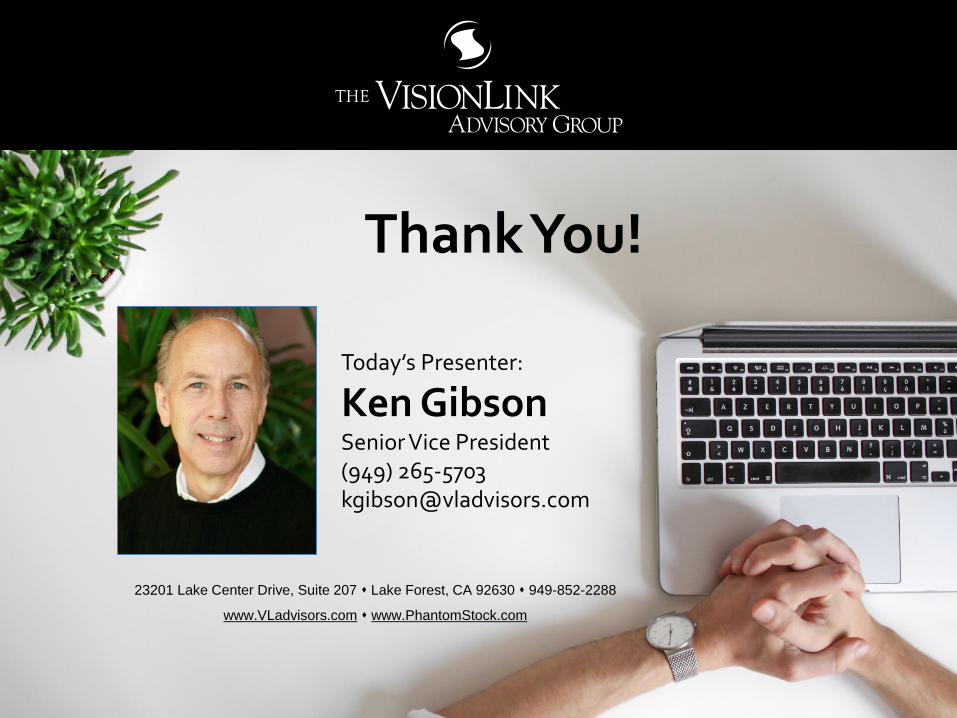
Today’s Presenter:
Ken GibsonSenior Vice President(949) [email protected]
23201 Lake Center Drive, Suite 207 ⬧ Lake Forest, CA 92630 ⬧ 949-852-2288
www.VLadvisors.com ⬧ www.PhantomStock.com

Learn What Incentive Compensation ShouldLook Like in the New Economy
44
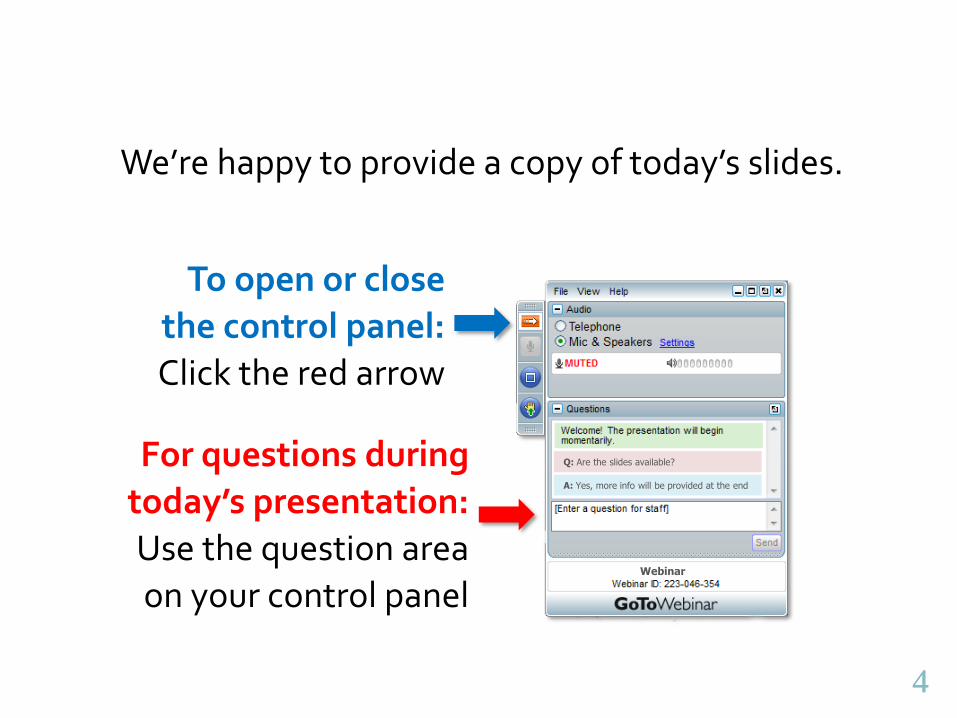
We’re happy to provide a copy of today’s slides.
To open or close
the control panel:
Click the red arrow
For questions during
today’s presentation:
Use the question area
on your control panelWebinar
Q: Are the slides available?
A: Yes, more info will be provided at the end

55
Take advantage of a one-half hourconsulting call with a VisionLinkprincipal at no charge.
Indicate interest on final survey.
Consultation Offer & Survey
Request a copy of our slides and complimentary
consultation.
We value your input.
66
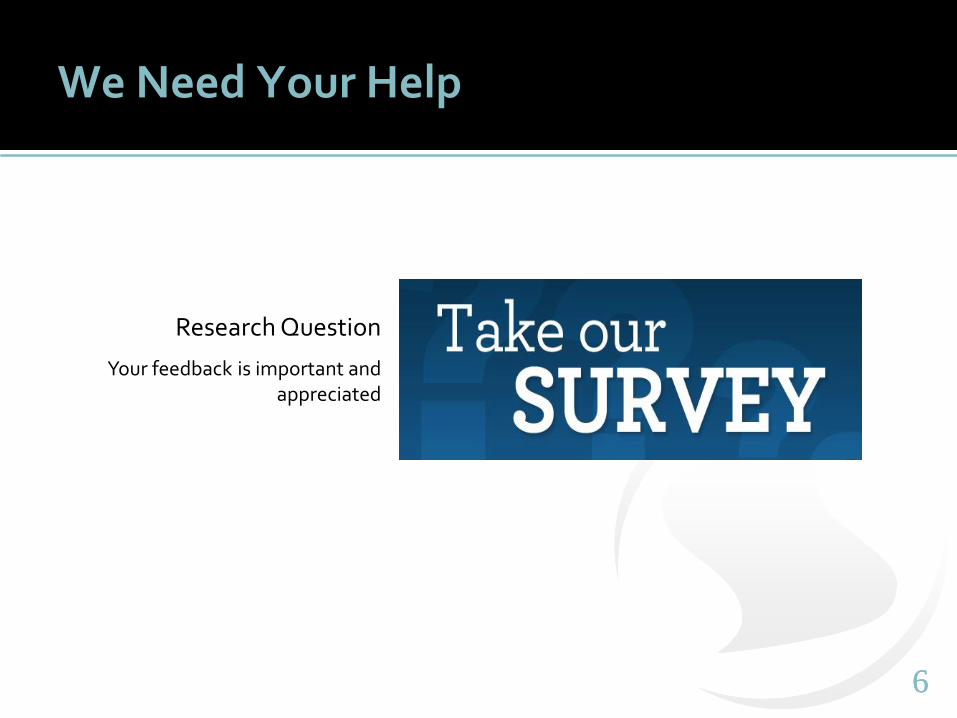
We Need Your Help
Research Question
Your feedback is important and appreciated

77
Post Webinar Intro
5 Minutes: Who We Are What We Do How We Do It
88
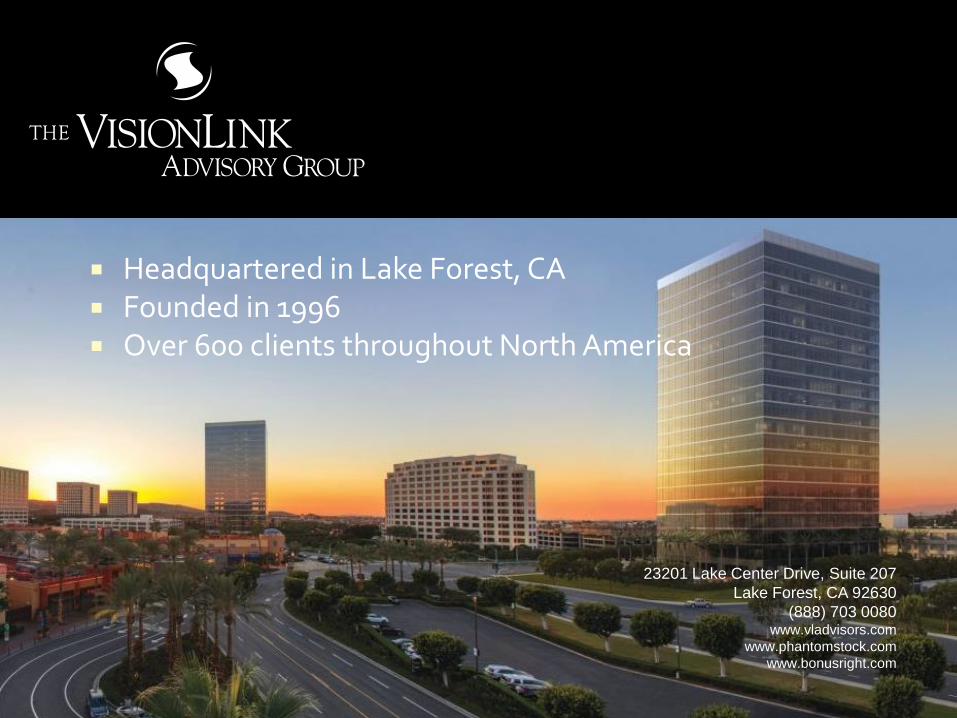
23201 Lake Center Drive, Suite 207
Lake Forest, CA 92630
(888) 703 0080www.vladvisors.com
www.phantomstock.com
www.bonusright.com
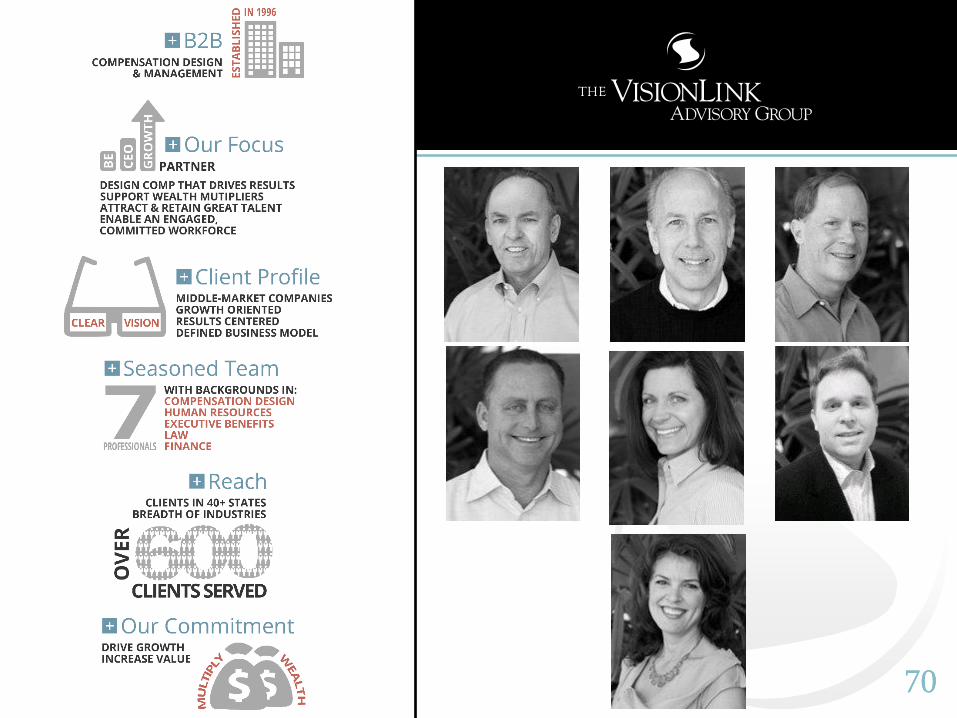
Headquartered in Lake Forest, CA Founded in 1996 Over 600 clients throughout North America
99
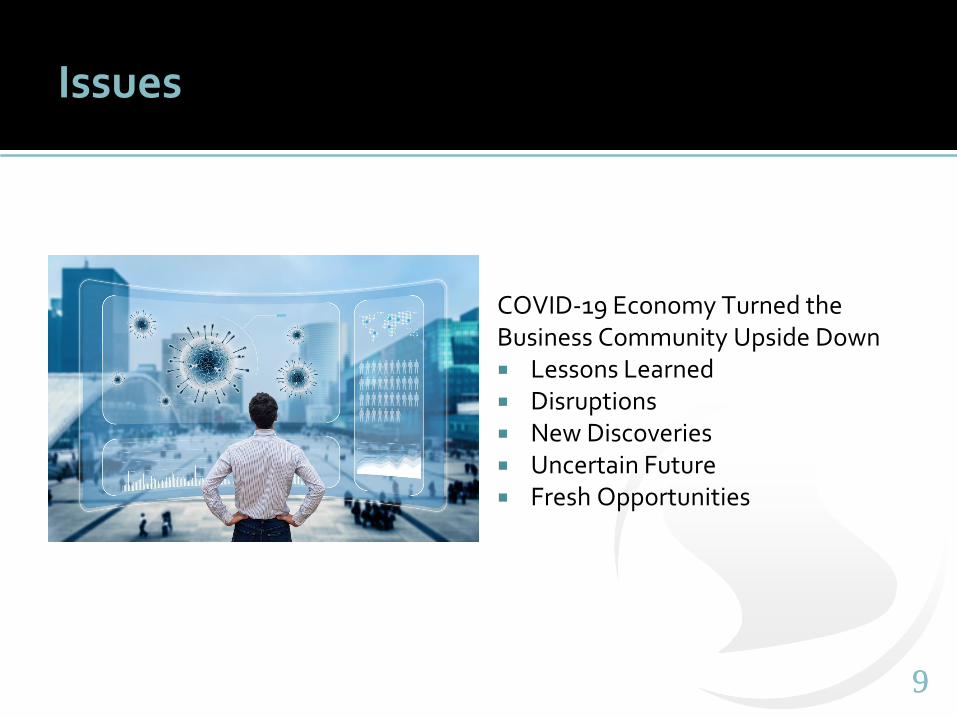
Issues
COVID-19 Economy Turned the Business Community Upside Down Lessons Learned Disruptions New Discoveries Uncertain Future Fresh Opportunities
1010
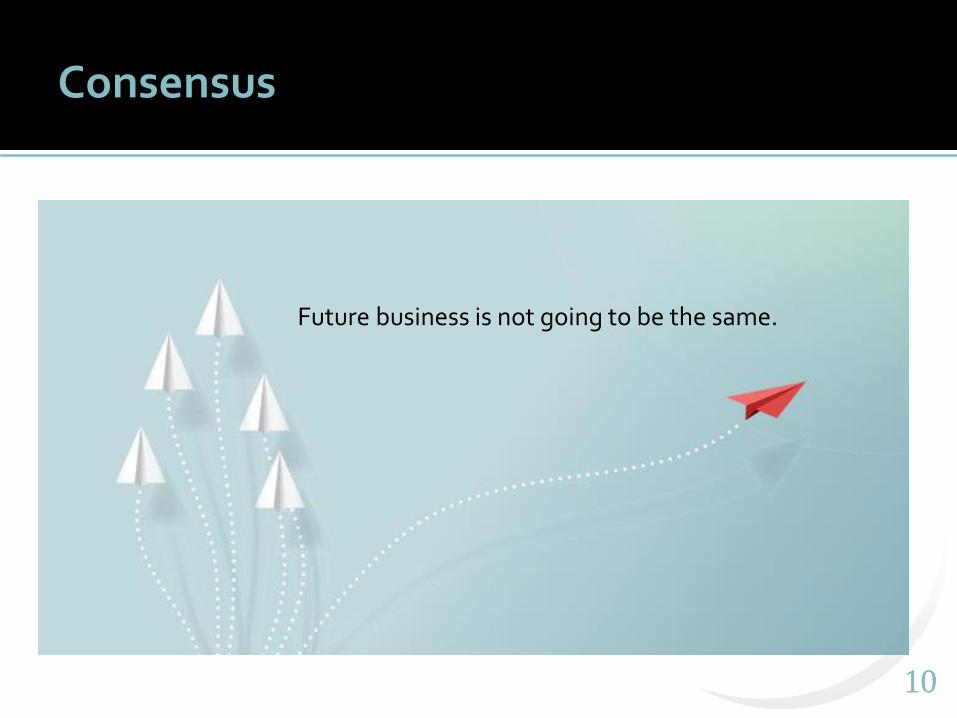
Consensus
Future business is not going to be the same.
1111
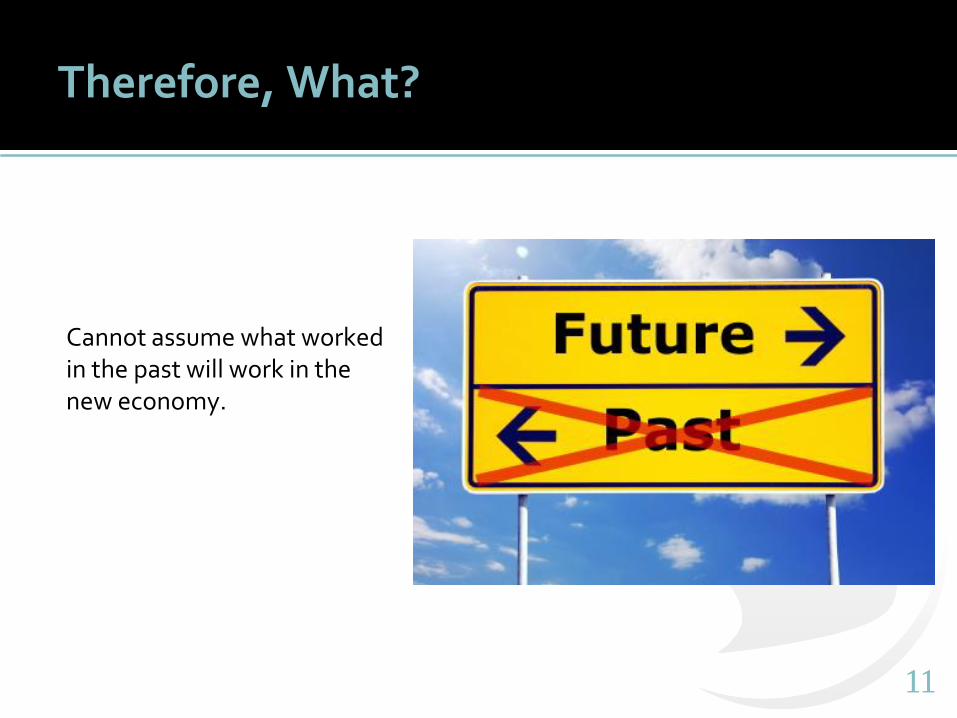
Therefore, What?
Cannot assume what worked in the past will work in the new economy.
1212
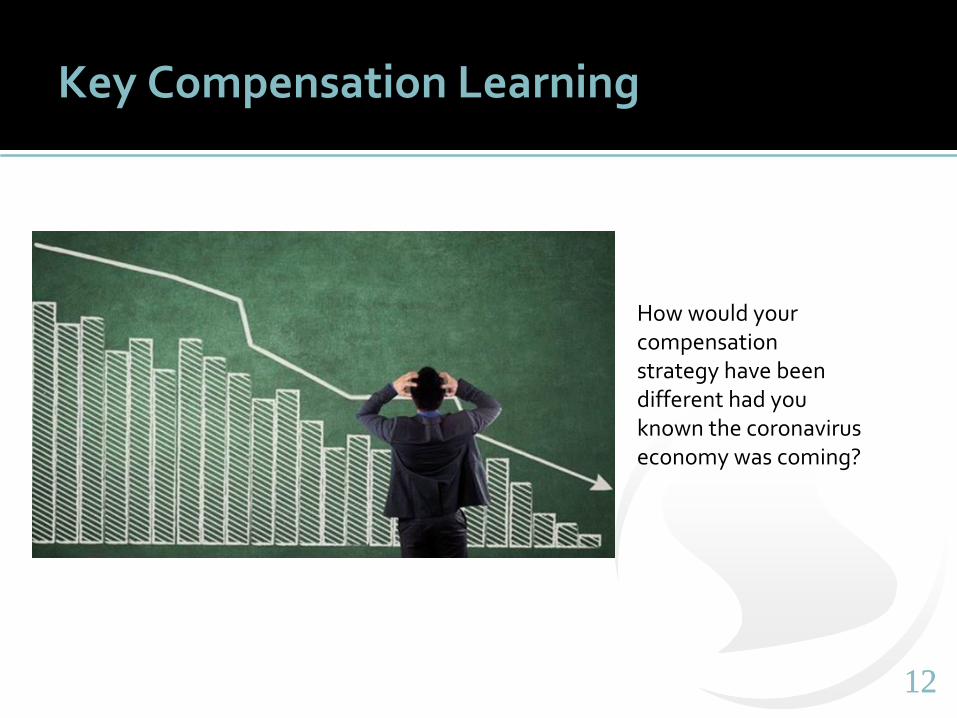
Key Compensation Learning
How would your compensation strategy have been different had you known the coronavirus economy was coming?

1313
Answer of Most Business Leaders
More flexibility Fewer high-cost
guarantees Better balance
between short & long-term rewards
1414
Let’s Define Some Terms
1515
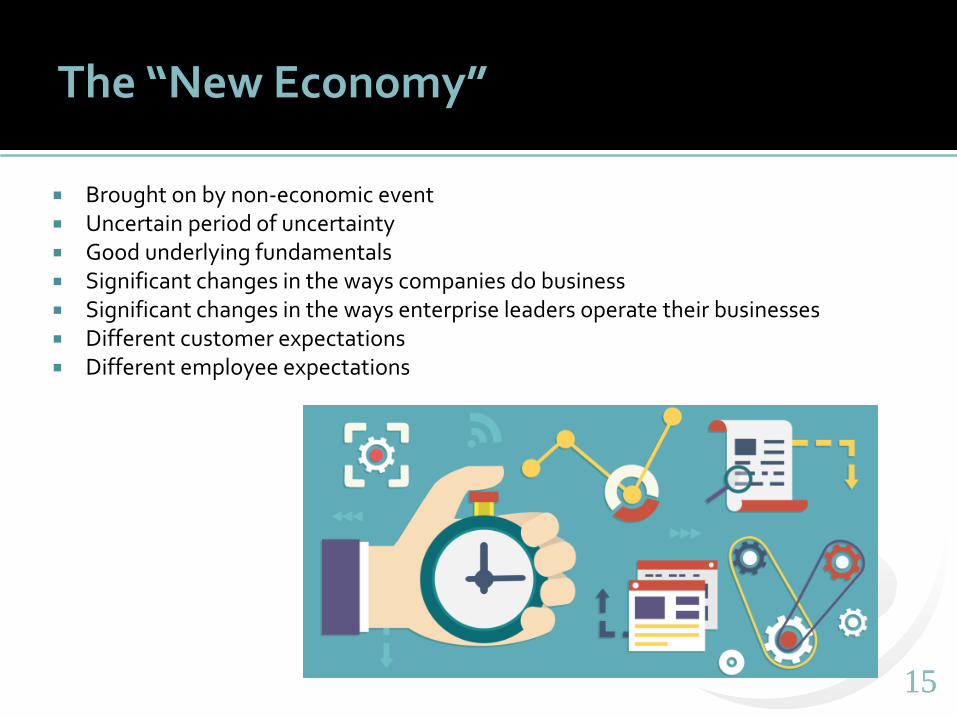
The “New Economy”
Brought on by non-economic event Uncertain period of uncertainty Good underlying fundamentals Significant changes in the ways companies do business Significant changes in the ways enterprise leaders operate their businesses Different customer expectations Different employee expectations
1616
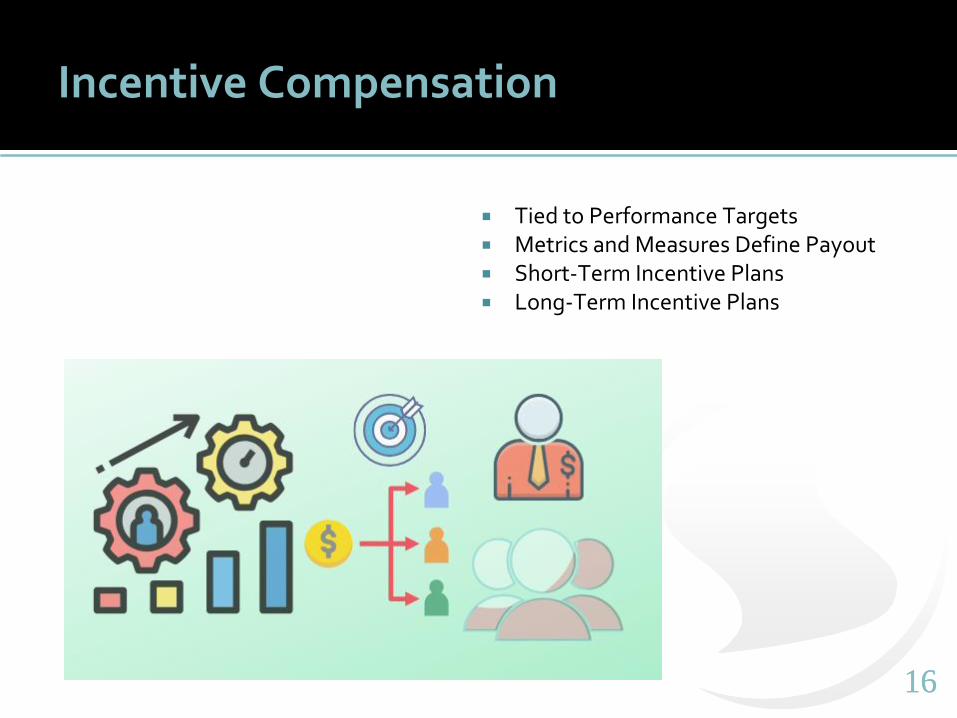
Incentive Compensation
Tied to Performance Targets Metrics and Measures Define Payout Short-Term Incentive Plans Long-Term Incentive Plans

1717
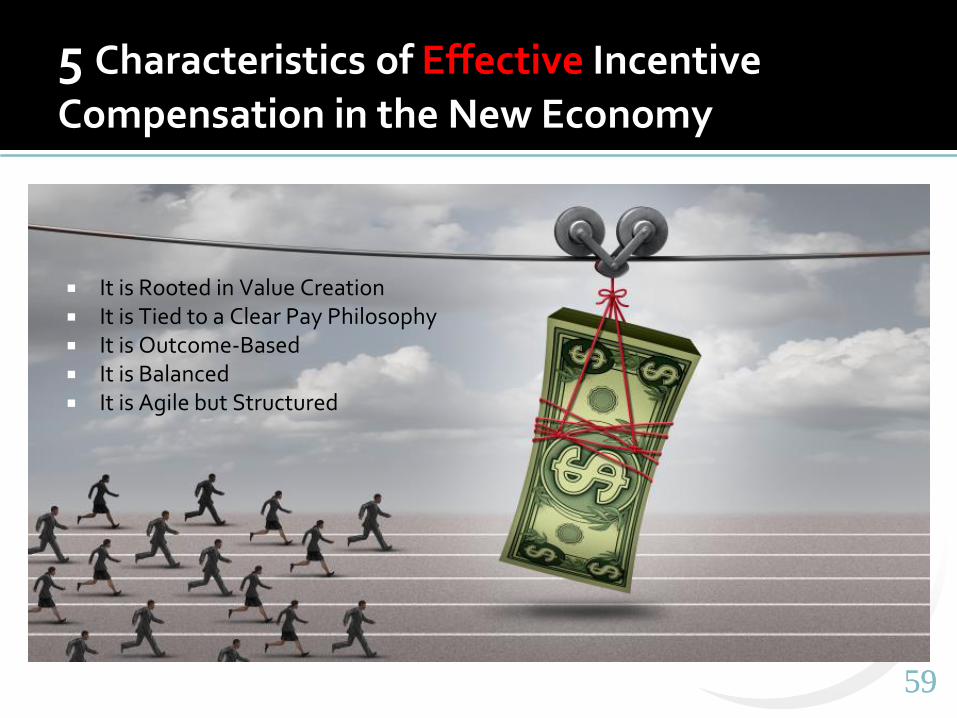
5 Characteristics of Effective Incentive
Compensation in the New Economy
It is Rooted in Value Creation It is Tied to a Clear Pay Philosophy It is Outcome-Based It is Balanced It is Agile but Structured
1818
1. IT IS ROOTED IN VALUE CREATION
1919
Case Study
19
2020
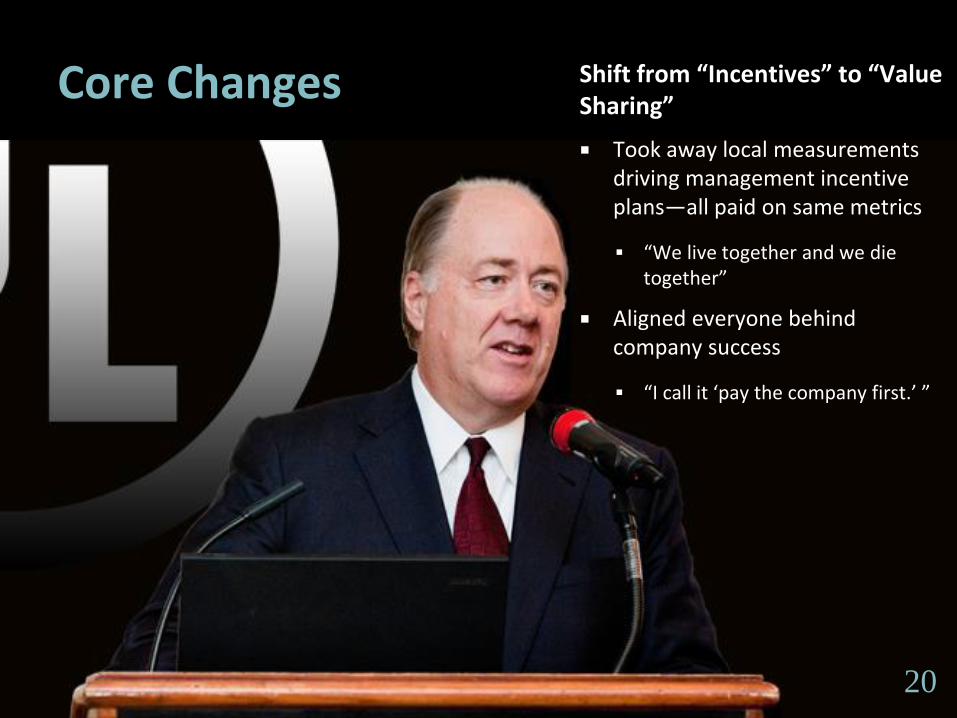
Core Changes Shift from “Incentives” to “Value Sharing”
Took away local measurements driving management incentive plans—all paid on same metrics
▪ “We live together and we die together”
Aligned everyone behind company success
▪ “I call it ‘pay the company first.’ ”
20

2121
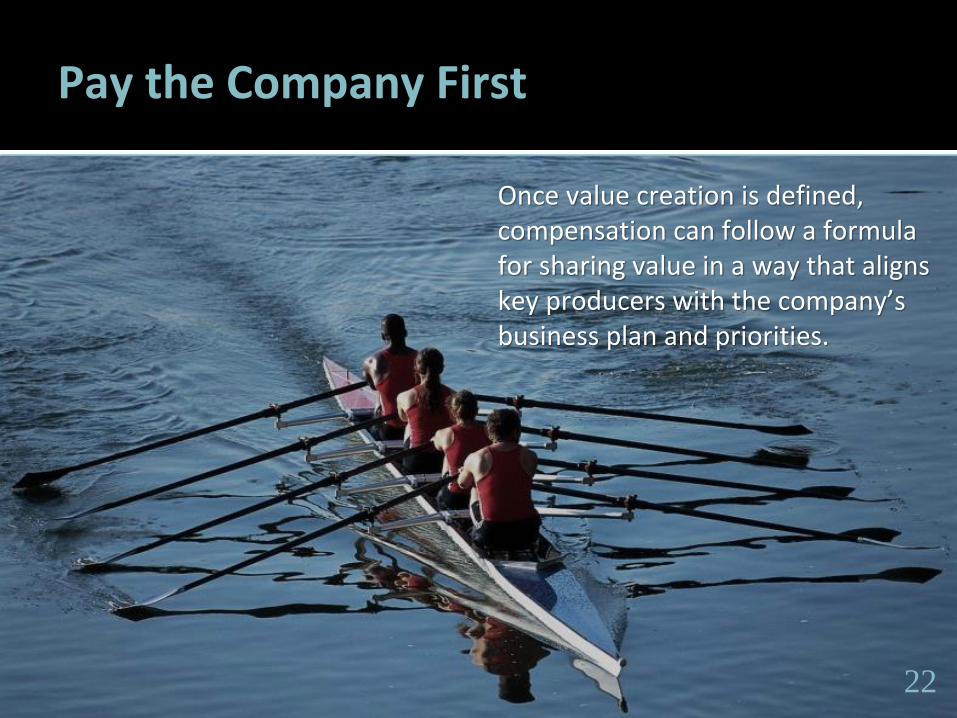
Pay the Company First
“Basically, up to the company’s operating profit target, all of the profits go to the company; and only after that target is met, do we start funding the incentive pool.”
Example: If UL’s target is $80 million-- 100% of first $80 million
in profit goes to company
The next $20 million goes to the incentive pool
From there on, 50/50 between company & incentive pool
2222
Pay the Company First
Once value creation is defined, compensation can follow a formula for sharing value in a way that aligns key producers with the company’s business plan and priorities.
22

2323
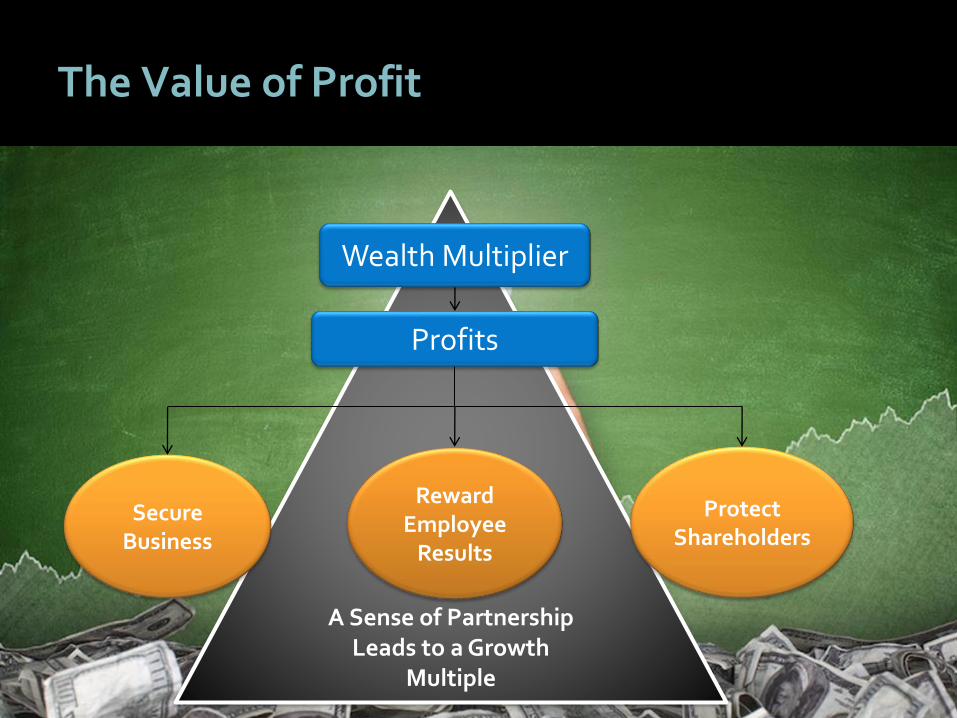
The Value of Profit
Wealth Multiplier
Profits
Secure Business
Reward Employee
Results
Protect Shareholders
2424
A Sense of Partnership Leads to a Growth
Multiple
The Value of Profit
Wealth Multiplier
Profits
Protect Shareholders
Secure Business
Reward Employee
Results
2525
2. IT IS TIED TO A CLEAR PAY PHILOSOPHY
2626
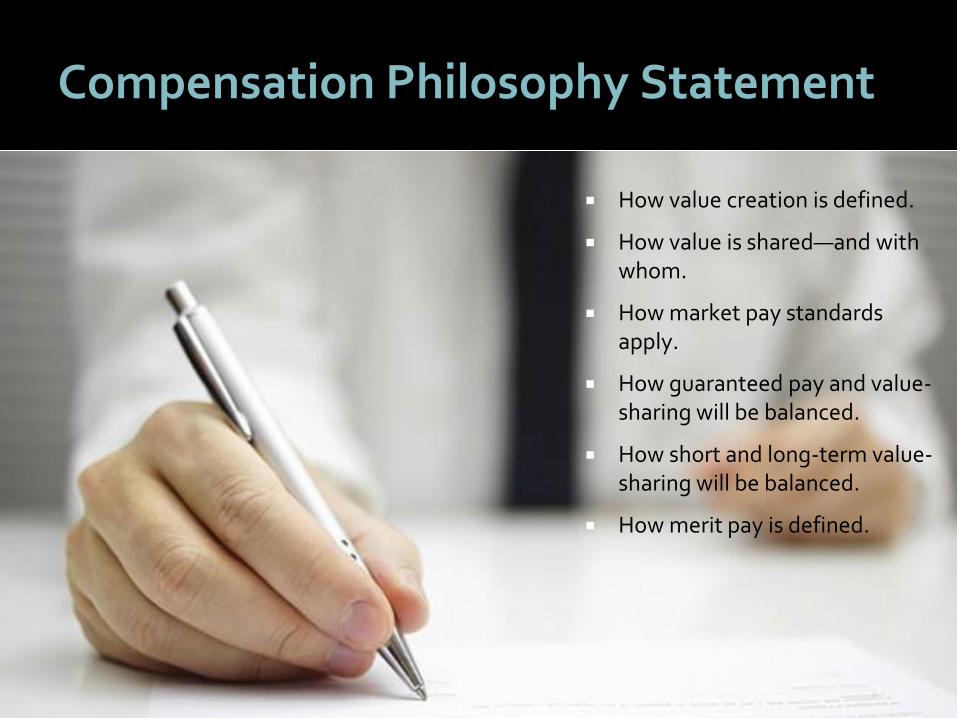
Compensation Philosophy Statement
How value creation is defined.
How value is shared—and with whom.
How market pay standards apply.
How guaranteed pay and value-sharing will be balanced.
How short and long-term value-sharing will be balanced.
How merit pay is defined.

2727
Key Areas to Focus On
Explore and refine “emergency” principles.
Determine priorities for cash and non-cash compensation, as well as benefits.
2828
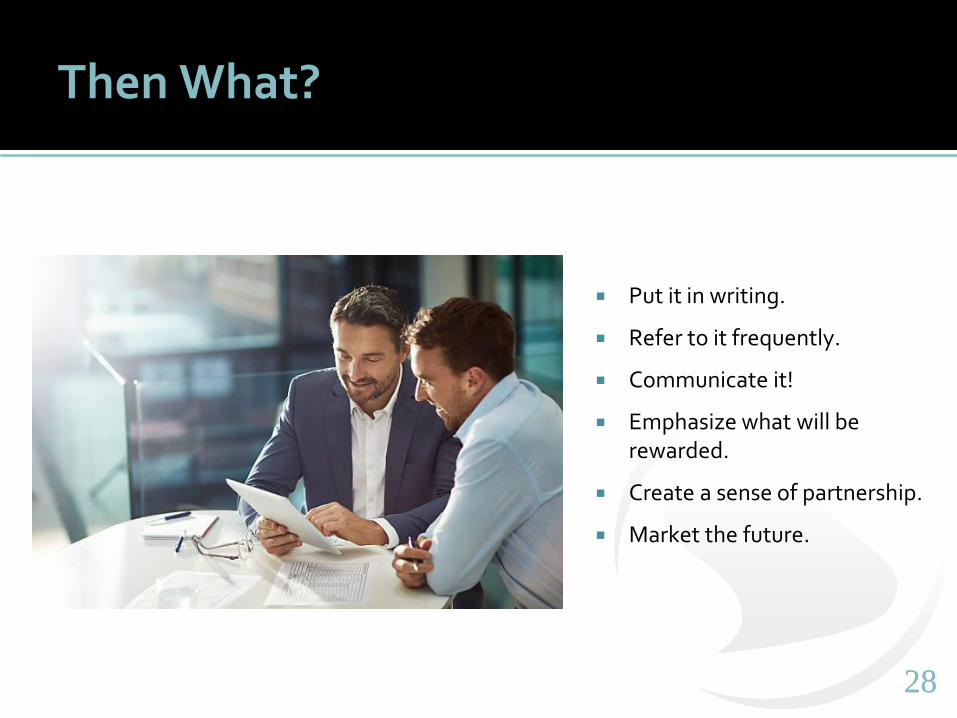
Then What?
Put it in writing.
Refer to it frequently.
Communicate it!
Emphasize what will be rewarded.
Create a sense of partnership.
Market the future.
2929
3. IT IS OUTCOME-BASED

3030
Outcomes, not Methods
"You cannot hold people responsible for results if you supervise their methods.“
(Stephen R. Covey)
30
"You cannot hold people responsible for results if you pay them for their methods.“
(VisionLink)
3131
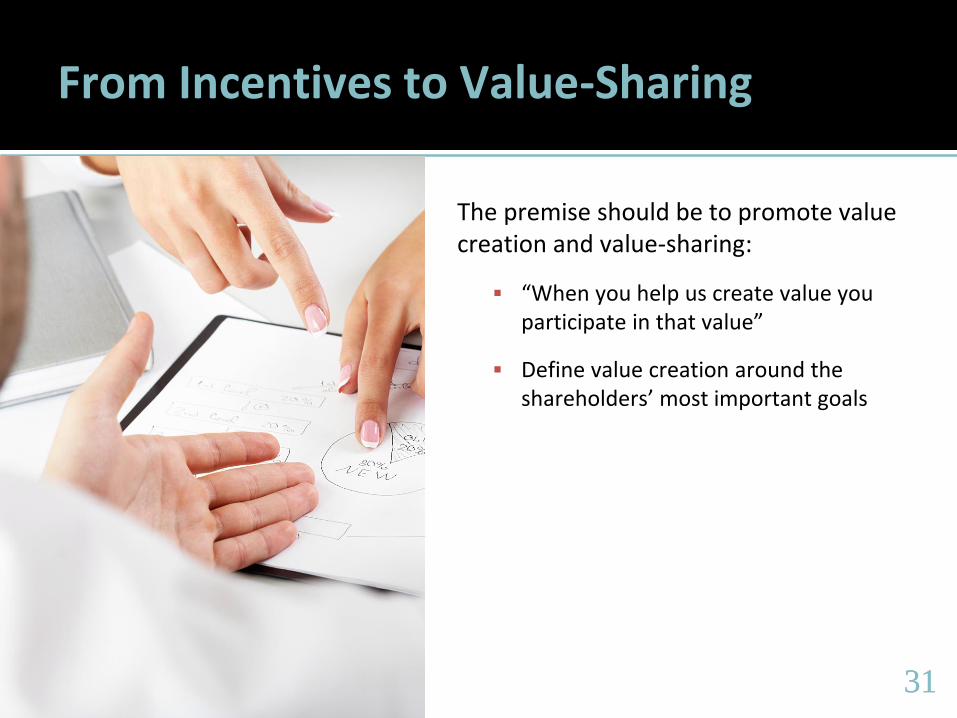
From Incentives to Value-Sharing
The premise should be to promote value creation and value-sharing:
▪ “When you help us create value you participate in that value”
▪ Define value creation around the shareholders’ most important goals

3232
Shareholder Priority
Sustainable and growing profitability
32

3333
Key Metric
Focus on One of These:
Profit
Increase in Profits (% or $)
(Sometimes: Revenue Growth)
33
3434
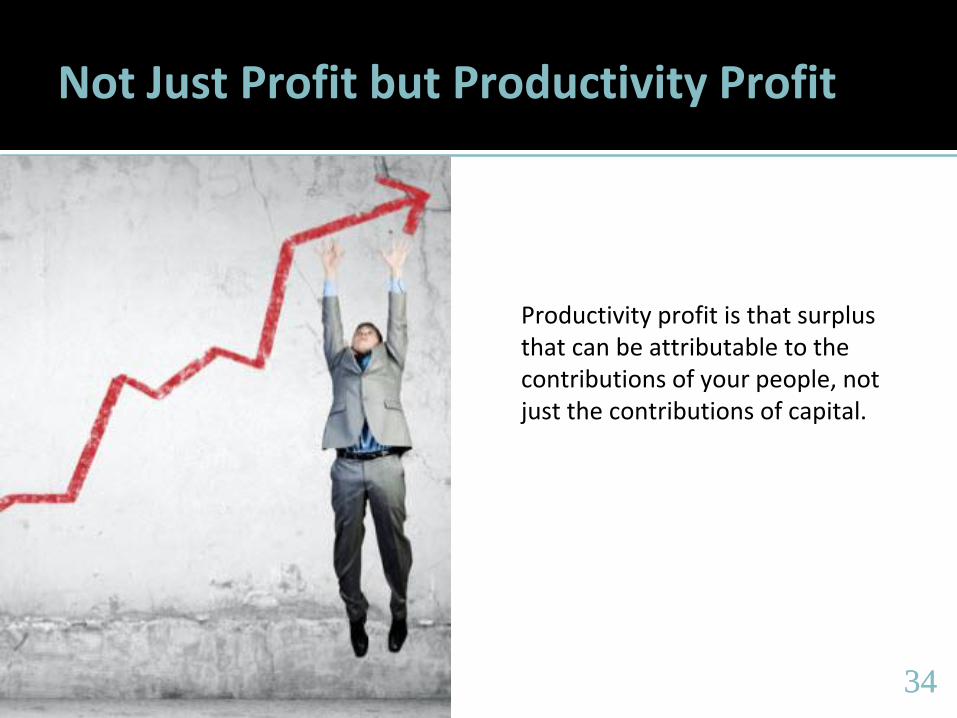
Not Just Profit but Productivity Profit
Productivity profit is that surplus that can be attributable to the contributions of your people, not just the contributions of capital.

3535
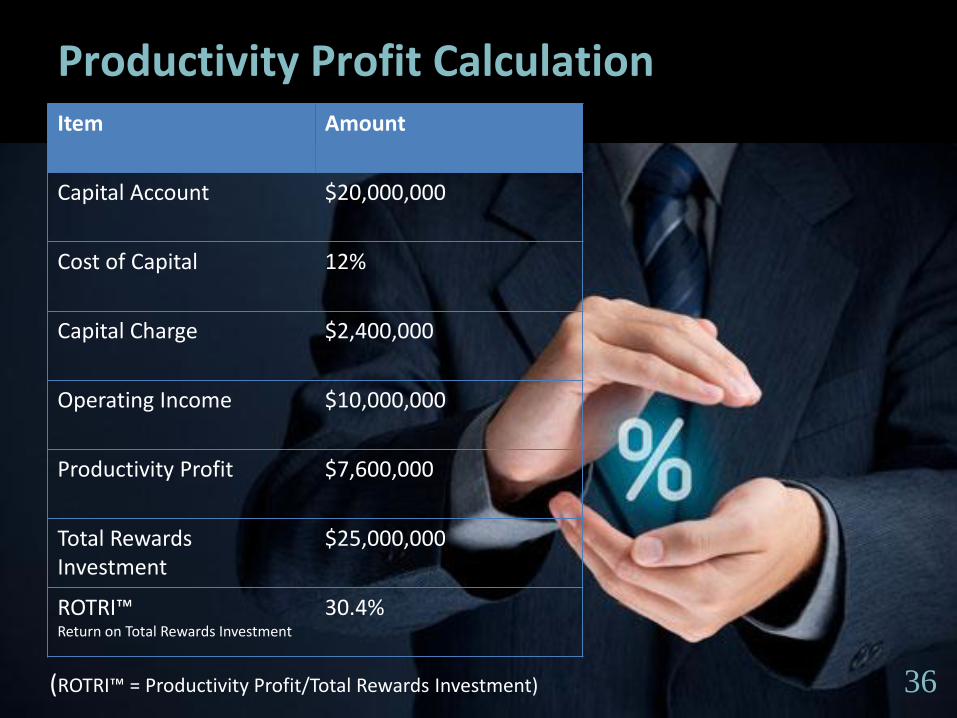
Make the Plan “Self-Financing”
Calculate Productivity Profit
3636
Productivity Profit CalculationItem Amount
Capital Account $20,000,000
Cost of Capital 12%
Capital Charge $2,400,000
Operating Income $10,000,000
Productivity Profit $7,600,000
Total Rewards Investment
$25,000,000
ROTRI™Return on Total Rewards Investment
30.4%
(ROTRI™ = Productivity Profit/Total Rewards Investment) 36
3737
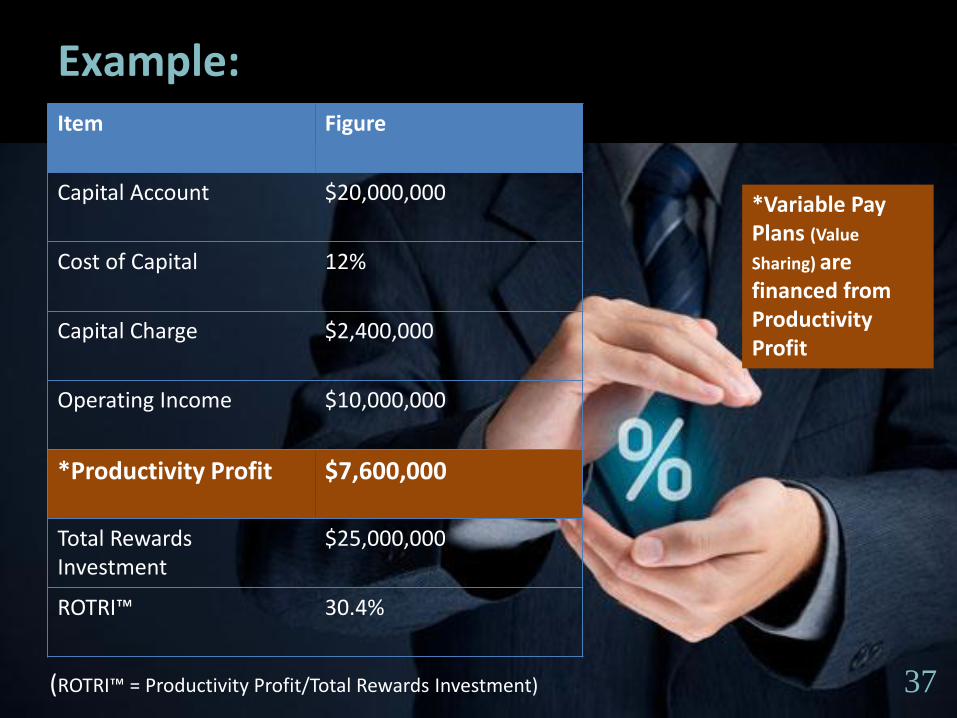
Example:Item Figure
Capital Account $20,000,000
Cost of Capital 12%
Capital Charge $2,400,000
Operating Income $10,000,000
*Productivity Profit $7,600,000
Total Rewards Investment
$25,000,000
ROTRI™ 30.4%
(ROTRI™ = Productivity Profit/Total Rewards Investment)
*Variable Pay Plans (Value
Sharing) are financed from Productivity Profit
37
3838
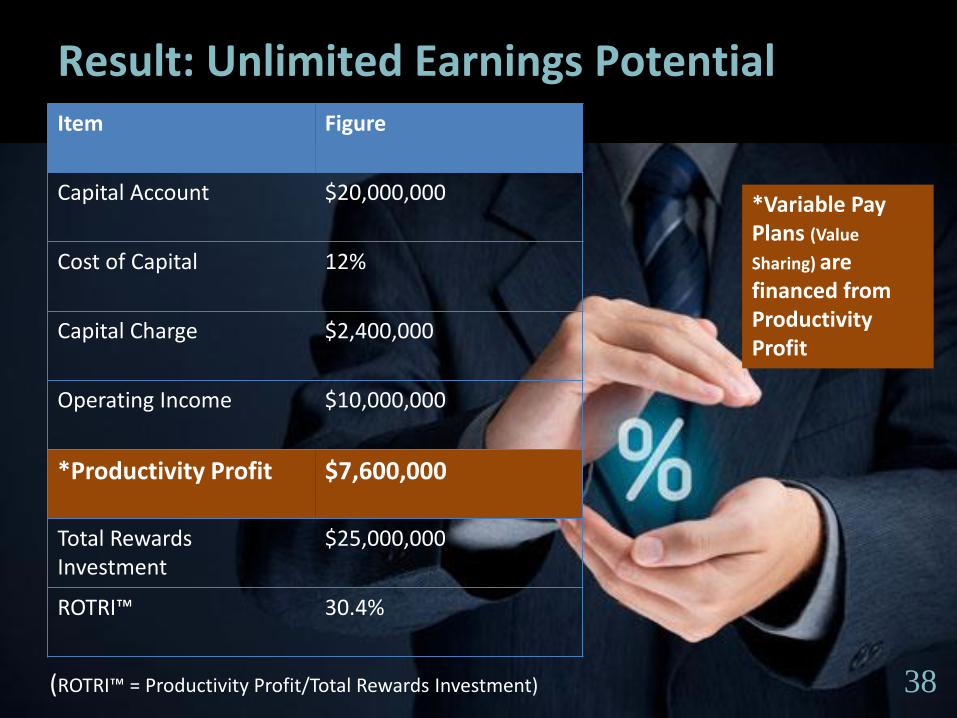
Result: Unlimited Earnings PotentialItem Figure
Capital Account $20,000,000
Cost of Capital 12%
Capital Charge $2,400,000
Operating Income $10,000,000
*Productivity Profit $7,600,000
Total Rewards Investment
$25,000,000
ROTRI™ 30.4%
(ROTRI™ = Productivity Profit/Total Rewards Investment)
*Variable Pay Plans (Value
Sharing) are financed from Productivity Profit
38

3939
4. IT IS BALANCED
4040
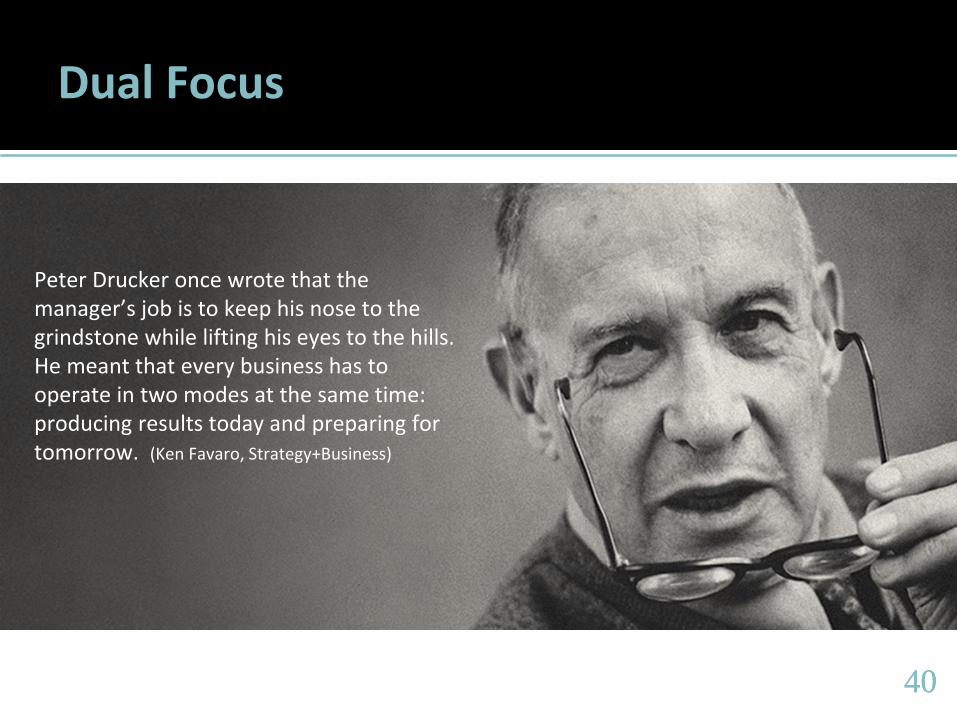
Dual Focus
Peter Drucker once wrote that the manager’s job is to keep his nose to the grindstone while lifting his eyes to the hills. He meant that every business has to operate in two modes at the same time: producing results today and preparing for tomorrow. (Ken Favaro, Strategy+Business)

4141
Solution: One Philosophy, Two Performance Periods
Wealth Multiplier Philosophy
We want all stakeholders to participate in the wealth multiple they help create.
Fair
Prudent

4242
Rewards Orientation
Short-Term rewards profit
Long-Term rewards business value increase

4343
9 Long-Term Value Sharing Alternatives
Stock Option
Performance Shares
Restricted Stock
Phantom Stock
Option
Performance
Phantom Stock
Phantom Stock Profit Pool
Performance Unit
Strategic Deferred
Compensation

4444
Grant Equity or
Not Equity?
Full Value or
Appreciation Only?
Yes
Appreciation
Stock Option
Full Value
Performance Based?
Yes
Performance Shares
No
Restricted StockNo
Reward for Value
Increase or Financial
Performance?
Value Increase
Full Value or
Appreciation?
Appreciation
Phantom Stock
Option
Full Value
Performance Based?
Yes
Performance
Phantom Stock
No
Phantom StockFinancial
Performance
Appreciation-
Performance Based or
Employee Directed?
Performance
BasedReward for Profit/Cash
Flow or Other Metrics?
ProfitsAllocation or
Objectives Based?
Allocation
Profit Pool
ObjectivesOther Metrics
Performance Unit
Employee Directed
Strategic Deferred
Compensation
4545
5. IT IS AGILE BUT STRUCTURED
4646
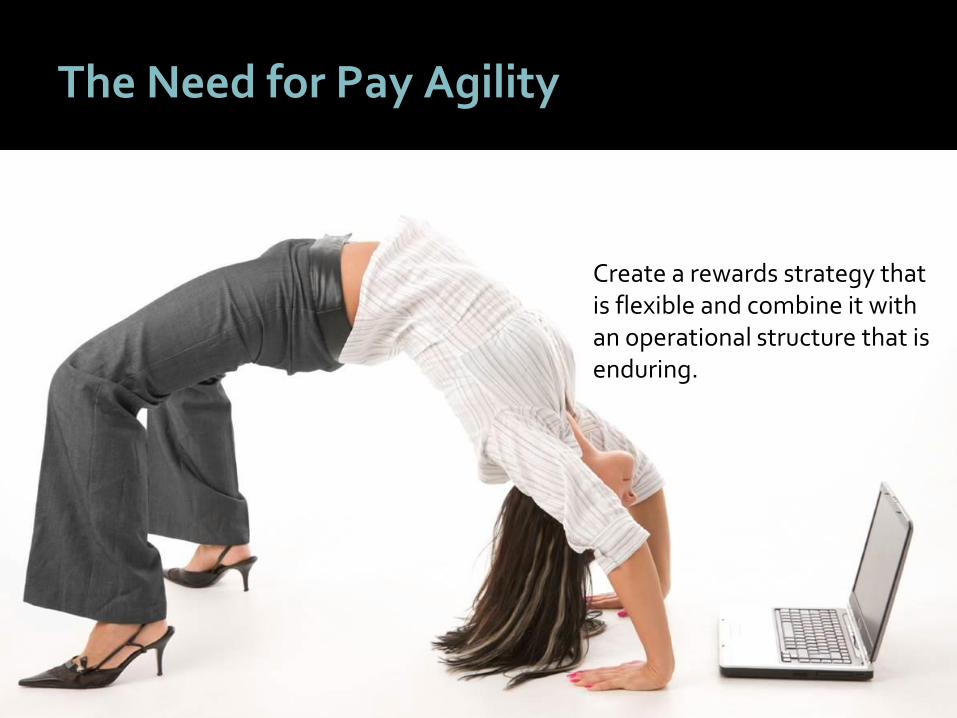
The Need for Pay Agility
Create a rewards strategy that is flexible and combine it with an operational structure that is enduring.

4747
Flexible but Enduring
Look at compensation strategy as you would an investment portfolio.
Individual pay components are your “asset classes.”
As things change, adjust weighting of each asset class.
4848
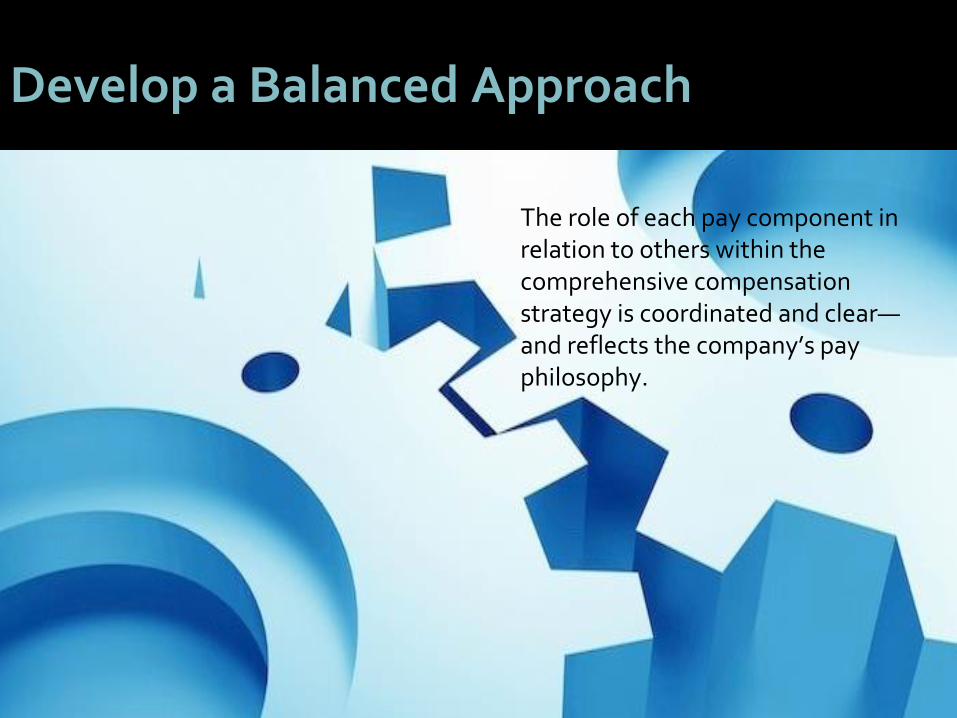
Develop a Balanced Approach
The role of each pay component in relation to others within the comprehensive compensation strategy is coordinated and clear—and reflects the company’s pay philosophy.
4949
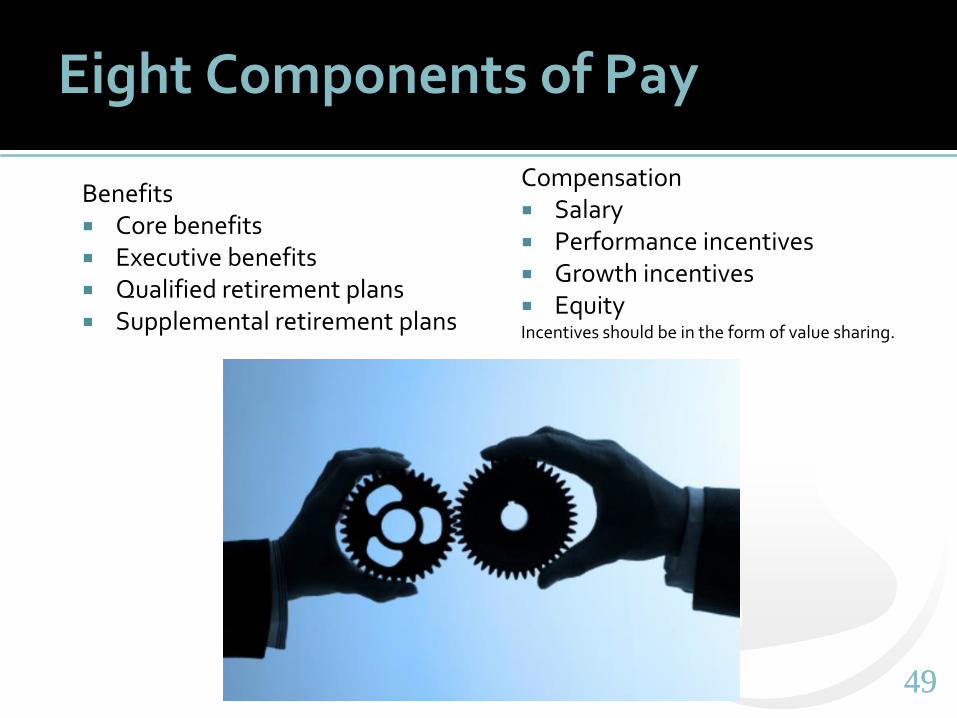
Eight Components of Pay
Benefits Core benefits Executive benefits Qualified retirement plans Supplemental retirement plans
Compensation Salary Performance incentives Growth incentives EquityIncentives should be in the form of value sharing.
5050
Salary
Performance Incentives
Sales Incentives
Growth Incentives
Core Health & Welfare
Plans
Executive Benefit Plans
Qualified Retirement
Plans
Nonqualified Retirement
Plans
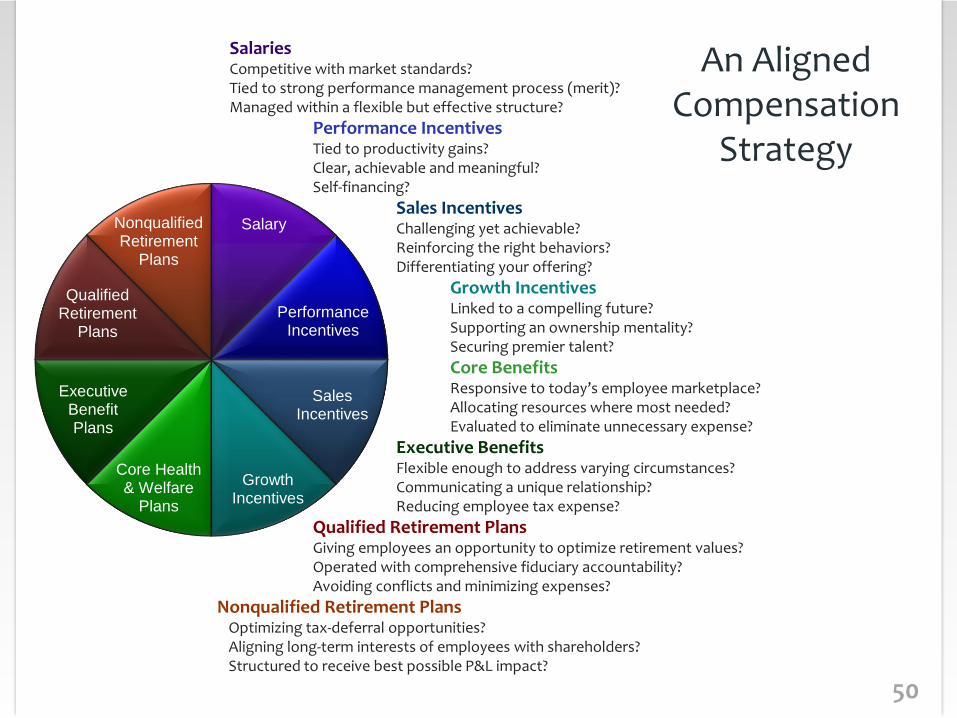
SalariesCompetitive with market standards?Tied to strong performance management process (merit)?Managed within a flexible but effective structure?
Performance IncentivesTied to productivity gains?Clear, achievable and meaningful?Self-financing?
Sales IncentivesChallenging yet achievable?Reinforcing the right behaviors?Differentiating your offering?
Growth IncentivesLinked to a compelling future?Supporting an ownership mentality?Securing premier talent?
Core BenefitsResponsive to today’s employee marketplace?Allocating resources where most needed?Evaluated to eliminate unnecessary expense?
Executive BenefitsFlexible enough to address varying circumstances?Communicating a unique relationship?Reducing employee tax expense?
Qualified Retirement PlansGiving employees an opportunity to optimize retirement values?Operated with comprehensive fiduciary accountability?Avoiding conflicts and minimizing expenses?
Nonqualified Retirement PlansOptimizing tax-deferral opportunities?Aligning long-term interests of employees with shareholders?Structured to receive best possible P&L impact?
An Aligned Compensation
Strategy
5151
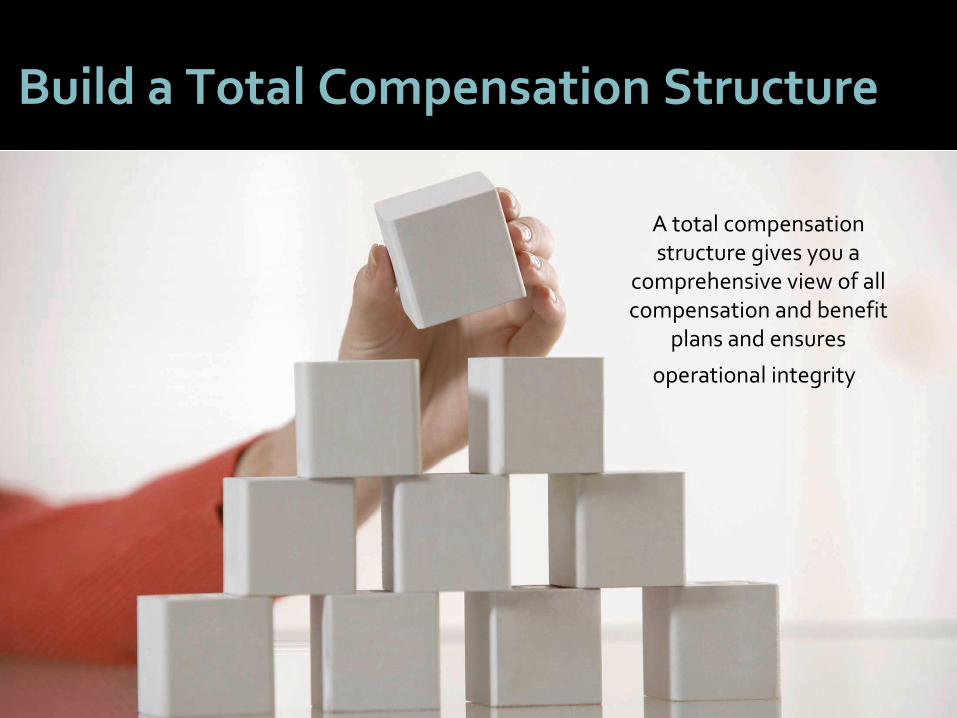
Build a Total Compensation Structure
A total compensation structure gives you a
comprehensive view of all compensation and benefit
plans and ensures
operational integrity.
5252
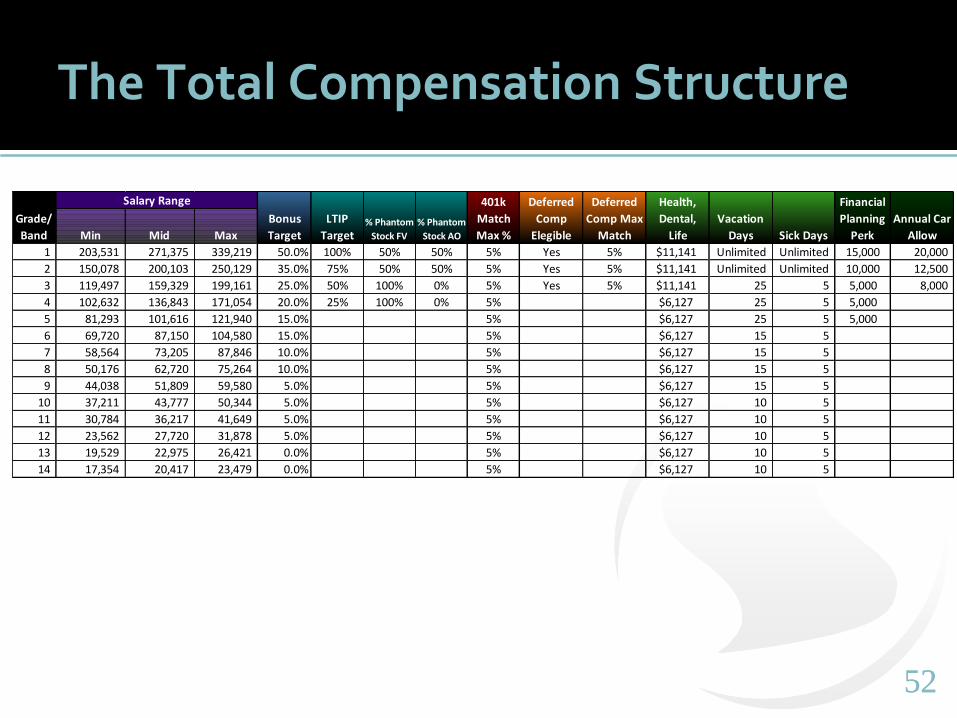
The Total Compensation Structure
Min Mid Max
1 203,531 271,375 339,219 50.0% 100% 50% 50% 5% Yes 5% $11,141 Unlimited Unlimited 15,000 20,000
2 150,078 200,103 250,129 35.0% 75% 50% 50% 5% Yes 5% $11,141 Unlimited Unlimited 10,000 12,500
3 119,497 159,329 199,161 25.0% 50% 100% 0% 5% Yes 5% $11,141 25 5 5,000 8,000
4 102,632 136,843 171,054 20.0% 25% 100% 0% 5% $6,127 25 5 5,000
5 81,293 101,616 121,940 15.0% 5% $6,127 25 5 5,000
6 69,720 87,150 104,580 15.0% 5% $6,127 15 5
7 58,564 73,205 87,846 10.0% 5% $6,127 15 5
8 50,176 62,720 75,264 10.0% 5% $6,127 15 5
9 44,038 51,809 59,580 5.0% 5% $6,127 15 5
10 37,211 43,777 50,344 5.0% 5% $6,127 10 5
11 30,784 36,217 41,649 5.0% 5% $6,127 10 5
12 23,562 27,720 31,878 5.0% 5% $6,127 10 5
13 19,529 22,975 26,421 0.0% 5% $6,127 10 5
14 17,354 20,417 23,479 0.0% 5% $6,127 10 5
Annual Car
Allow
Grade/
Band Sick Days
Salary Range
Bonus
Target
LTIP
Target
Financial
Planning
Perk
Deferred
Comp
Elegible
Deferred
Comp Max
Match
401k
Match
Max %
Vacation
Days% Phantom
Stock FV
% Phantom
Stock AO
Health,
Dental,
Life

5353
Creating a Balance
Total Compensation Structure
Name Title/Position Tier Salary
Short-term Incentive
Target
Long-term Incentive
TargetTotal Direct
Comp
H&W Annual Value
QRP Annual Value
Security Plans Annual
Value
Total Indirect Comp TRI
Jason Smith CEO 1 $ 300,000 $ 120,000 $ - $ 420,000 $ 18,200 $ 8,000 $ - $ 26,200 $ 446,200
Lucy Jones VP Marketing 2 $ 210,000 $ 45,000 $ - $ 255,000 $ 16,200 $ 7,000 $ - $ 23,200 $ 278,200
Rick Miller VP Sales 2 $ 160,000 $ 85,000 $ - $ 245,000 $ 9,200 $ 6,000 $ - $ 15,200 $ 260,200
Janice Johnson CFO 2 $ 195,000 $ 40,000 $ - $ 235,000 $ 10,200 $ 5,000 $ - $ 15,200 $ 250,200
Maria York Director 3 $ 160,000 $ 10,000 $ - $ 170,000 $ 12,200 $ 4,000 $ - $ 16,200 $ 186,200
Frank North Director 3 $ 150,000 $ 10,000 $ - $ 160,000 $ 11,200 $ 3,000 $ - $ 14,200 $ 174,200
Ricardo South Director 3 $ 140,000 $ 10,000 $ - $ 150,000 $ 7,700 $ 2,000 $ - $ 9,700 $ 59,700
Simon Lewis Director 3 $ 130,000 $ 10,000 $ - $ 140,000 $ 8,700 $ 2,500 $ - $ 11,200 $ 151,200
$ 1,445,000 $ 330,000 $ - $ 1,775,000 $ 93,600 $ 37,500 $ - $ 131,100 $ 1,906,100
How are these values determined?
Why no LTI to balance
the STI?
Should we be addressing
these needs?
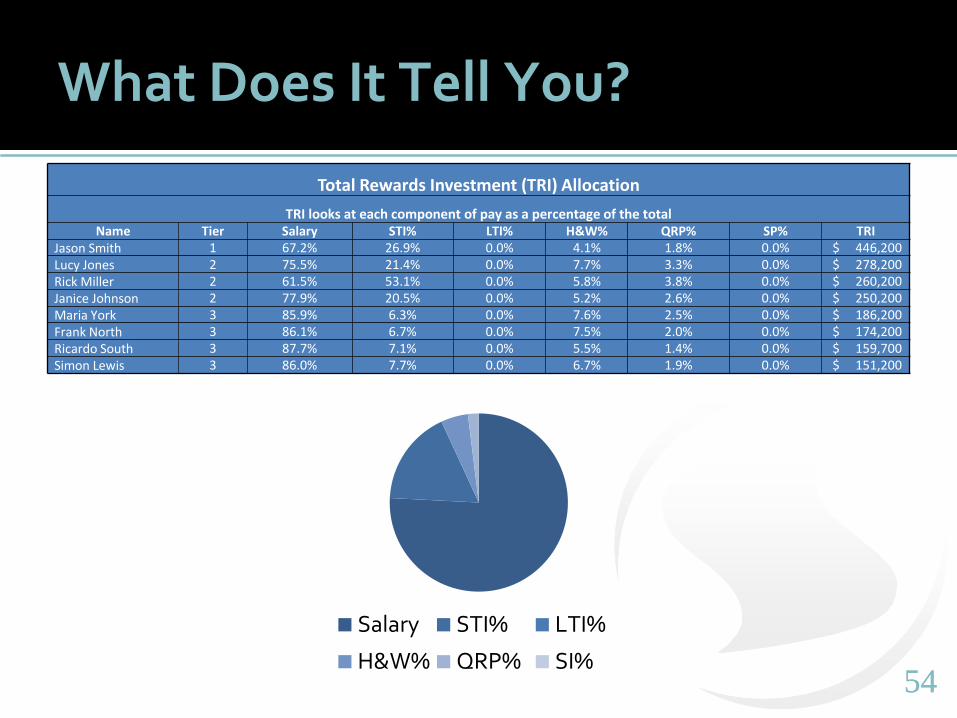
5454
What Does It Tell You?
Total Rewards Investment (TRI) Allocation
TRI looks at each component of pay as a percentage of the totalName Tier Salary STI% LTI% H&W% QRP% SP% TRI
Jason Smith 1 67.2% 26.9% 0.0% 4.1% 1.8% 0.0% $ 446,200 Lucy Jones 2 75.5% 21.4% 0.0% 7.7% 3.3% 0.0% $ 278,200 Rick Miller 2 61.5% 53.1% 0.0% 5.8% 3.8% 0.0% $ 260,200 Janice Johnson 2 77.9% 20.5% 0.0% 5.2% 2.6% 0.0% $ 250,200 Maria York 3 85.9% 6.3% 0.0% 7.6% 2.5% 0.0% $ 186,200 Frank North 3 86.1% 6.7% 0.0% 7.5% 2.0% 0.0% $ 174,200 Ricardo South 3 87.7% 7.1% 0.0% 5.5% 1.4% 0.0% $ 159,700 Simon Lewis 3 86.0% 7.7% 0.0% 6.7% 1.9% 0.0% $ 151,200
Salary STI% LTI%
H&W% QRP% SI%
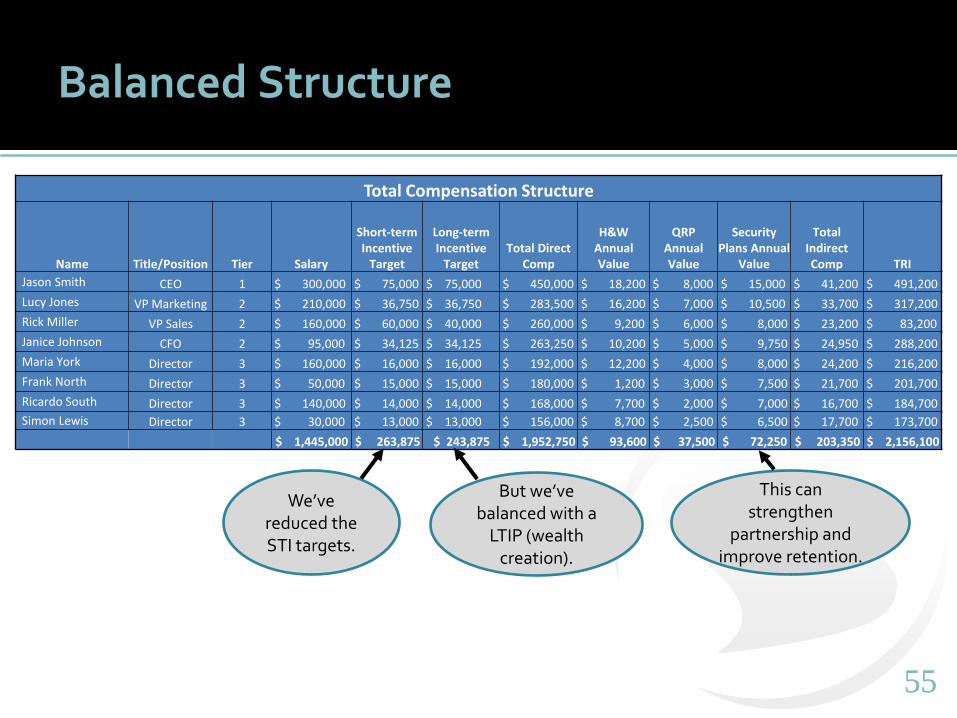
5555
Balanced Structure
Total Compensation Structure
Name Title/Position Tier Salary
Short-term Incentive
Target
Long-term Incentive
TargetTotal Direct
Comp
H&W Annual Value
QRP Annual Value
SecurityPlans Annual
Value
Total Indirect Comp TRI
Jason Smith CEO 1 $ 300,000 $ 75,000 $ 75,000 $ 450,000 $ 18,200 $ 8,000 $ 15,000 $ 41,200 $ 491,200
Lucy Jones VP Marketing 2 $ 210,000 $ 36,750 $ 36,750 $ 283,500 $ 16,200 $ 7,000 $ 10,500 $ 33,700 $ 317,200
Rick Miller VP Sales 2 $ 160,000 $ 60,000 $ 40,000 $ 260,000 $ 9,200 $ 6,000 $ 8,000 $ 23,200 $ 83,200
Janice Johnson CFO 2 $ 95,000 $ 34,125 $ 34,125 $ 263,250 $ 10,200 $ 5,000 $ 9,750 $ 24,950 $ 288,200
Maria York Director 3 $ 160,000 $ 16,000 $ 16,000 $ 192,000 $ 12,200 $ 4,000 $ 8,000 $ 24,200 $ 216,200
Frank North Director 3 $ 50,000 $ 15,000 $ 15,000 $ 180,000 $ 1,200 $ 3,000 $ 7,500 $ 21,700 $ 201,700
Ricardo South Director 3 $ 140,000 $ 14,000 $ 14,000 $ 168,000 $ 7,700 $ 2,000 $ 7,000 $ 16,700 $ 184,700
Simon Lewis Director 3 $ 30,000 $ 13,000 $ 13,000 $ 156,000 $ 8,700 $ 2,500 $ 6,500 $ 17,700 $ 173,700
$ 1,445,000 $ 263,875 $ 243,875 $ 1,952,750 $ 93,600 $ 37,500 $ 72,250 $ 203,350 $ 2,156,100
We’ve reduced the STI targets.
But we’ve balanced with a
LTIP (wealth creation).
This can strengthen
partnership and improve retention.
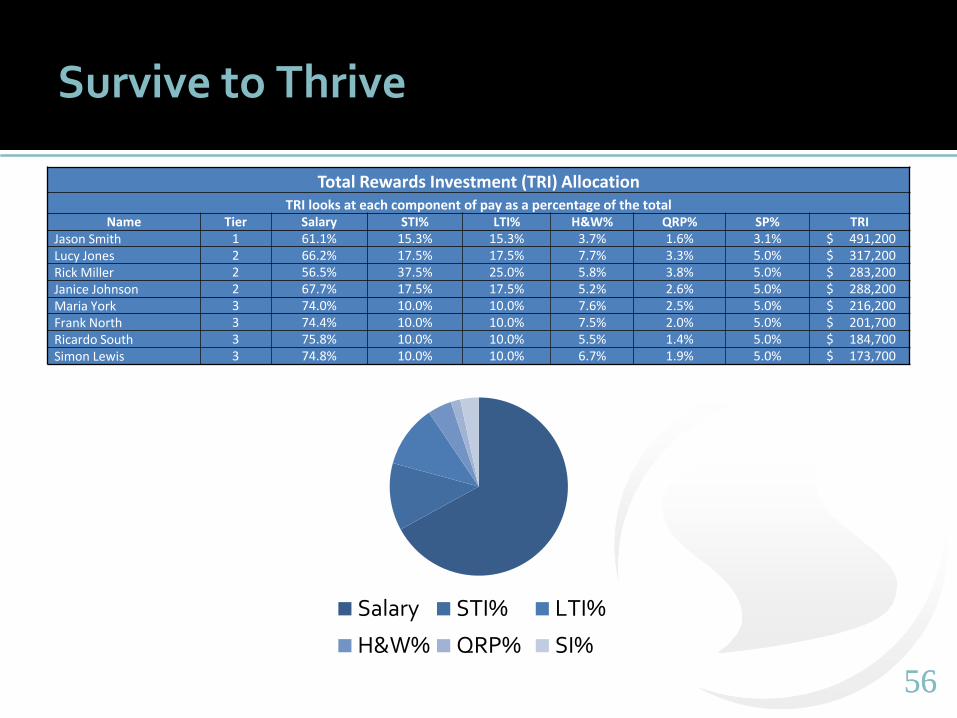
5656
Survive to Thrive
Total Rewards Investment (TRI) AllocationTRI looks at each component of pay as a percentage of the total
Name Tier Salary STI% LTI% H&W% QRP% SP% TRIJason Smith 1 61.1% 15.3% 15.3% 3.7% 1.6% 3.1% $ 491,200 Lucy Jones 2 66.2% 17.5% 17.5% 7.7% 3.3% 5.0% $ 317,200 Rick Miller 2 56.5% 37.5% 25.0% 5.8% 3.8% 5.0% $ 283,200 Janice Johnson 2 67.7% 17.5% 17.5% 5.2% 2.6% 5.0% $ 288,200 Maria York 3 74.0% 10.0% 10.0% 7.6% 2.5% 5.0% $ 216,200 Frank North 3 74.4% 10.0% 10.0% 7.5% 2.0% 5.0% $ 201,700 Ricardo South 3 75.8% 10.0% 10.0% 5.5% 1.4% 5.0% $ 184,700 Simon Lewis 3 74.8% 10.0% 10.0% 6.7% 1.9% 5.0% $ 173,700
Salary STI% LTI%
H&W% QRP% SI%

5757
The Coronavirus Economy Dilemma
Sample Position
Salary Short-Term Value
Sharing
Total Cash Flow Impact
Plan A $110,000 $11,000 $121,000 $121,000
Plan B $100,000 $30,000 $130,000 $130,000
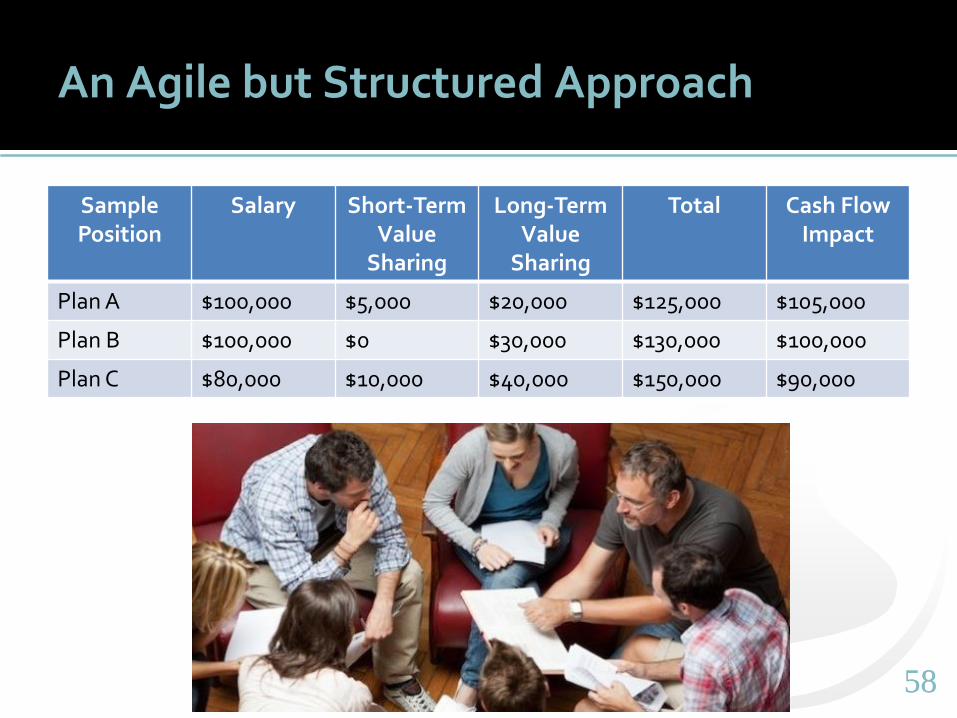
5858
An Agile but Structured Approach
Sample Position
Salary Short-Term Value
Sharing
Long-Term Value
Sharing
Total Cash Flow Impact
Plan A $100,000 $5,000 $20,000 $125,000 $105,000
Plan B $100,000 $0 $30,000 $130,000 $100,000
Plan C $80,000 $10,000 $40,000 $150,000 $90,000
5959
5 Characteristics of Effective Incentive
Compensation in the New Economy
It is Rooted in Value Creation It is Tied to a Clear Pay Philosophy It is Outcome-Based It is Balanced It is Agile but Structured
6060
6161
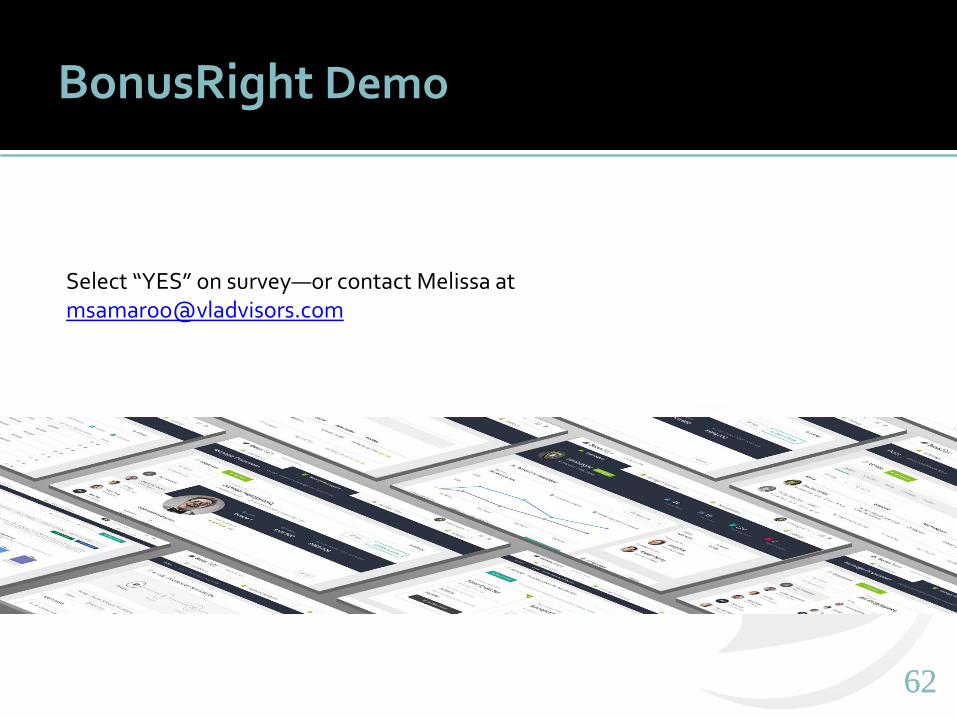
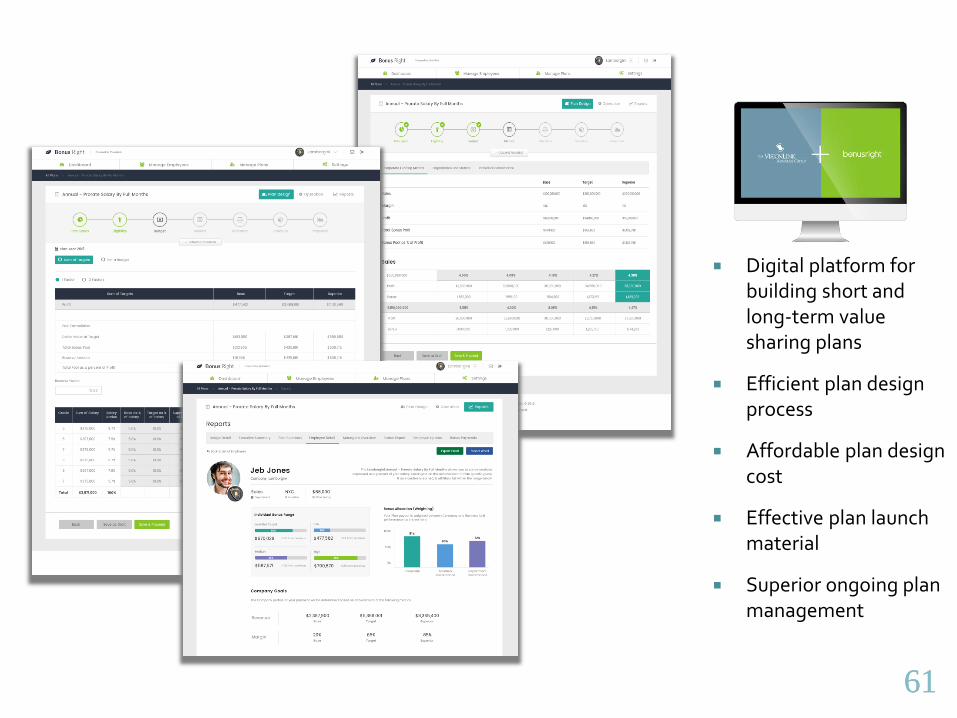
Digital platform for building short and long-term value sharing plans
Efficient plan design process
Affordable plan design cost
Effective plan launch material
Superior ongoing plan management
6363
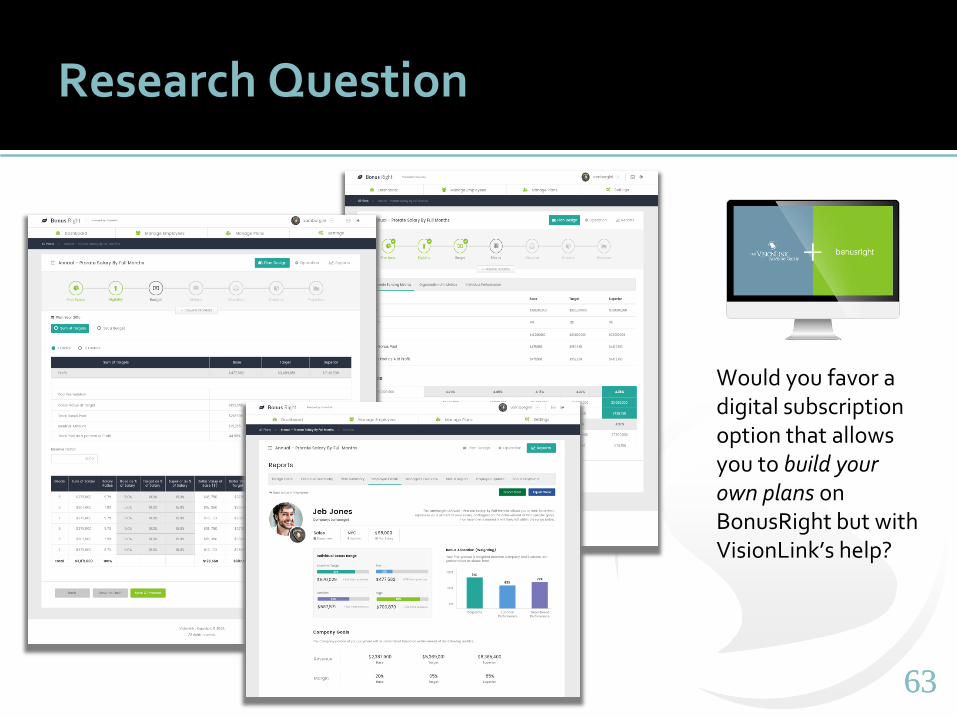
Would you favor a digital subscription option that allows you to build your own plans on BonusRight but with VisionLink’s help?
Research Question

Special Offer
The Productivity Profit Workbook
Request your copy on the final survey.

6565
Take advantage of a one-half hourconsulting call with a VisionLinkprincipal at no charge.
Indicate interest on final survey.
Consultation Offer & Survey
Request a copy of our slides and complimentary
consultation.
Please respond to research question.
We value your input.

6666
Post Webinar Intro
5 Minutes: Who We Are What We Do How We Do It

6767
Q&A
6868
Today’s Presenter:
Ken GibsonSenior Vice President(949) [email protected]
23201 Lake Center Drive, Suite 207 ⬧ Lake Forest, CA 92630 ⬧ 949-852-2288
www.VLadvisors.com ⬧ www.PhantomStock.com
Thank You!

6969
Post Webinar Intro
5 Minutes: Who We Are What We Do How We Do It
7070

7171

7272
VisionLink’s Focus: Help Business Leaders Build and Sustain a High Performance Culture
Accelerate performance through pay strategies that transform employees into growth partners.
7373
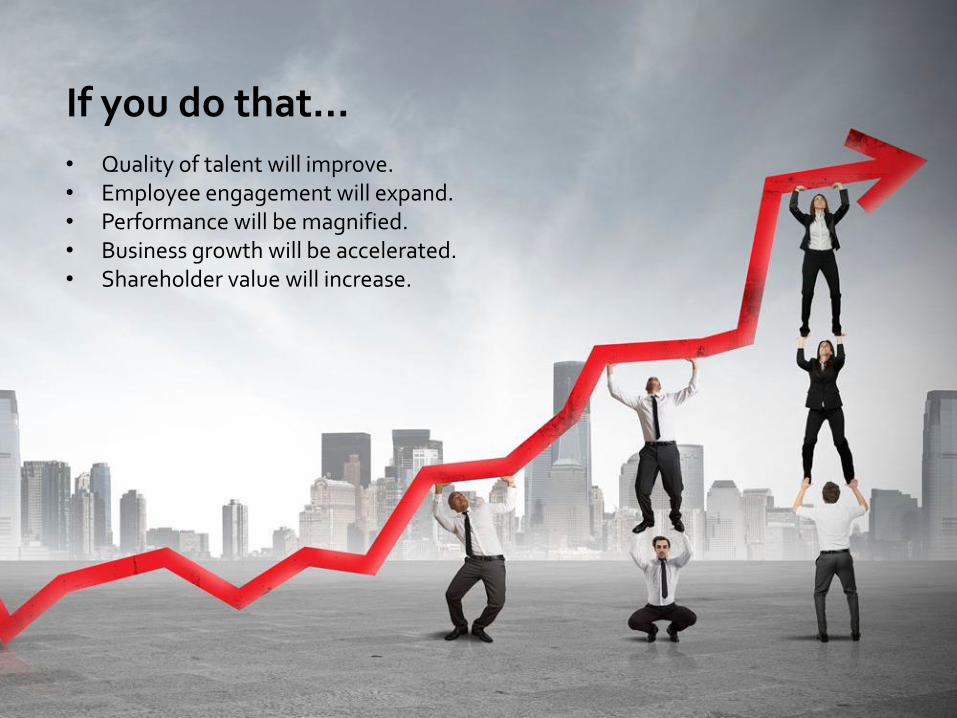
If you do that…
• Quality of talent will improve.• Employee engagement will expand.• Performance will be magnified.• Business growth will be accelerated.• Shareholder value will increase.

7474
Today’s Presenter:
Ken GibsonSenior Vice President(949) [email protected]
23201 Lake Center Drive, Suite 207 ⬧ Lake Forest, CA 92630 ⬧ 949-852-2288
www.VLadvisors.com ⬧ www.PhantomStock.com
Thank You!