Embed Size (px)
Citation preview
Print Date: 17 Jan 2002
Learning About Customers Without Asking
by
Alan L. MontgomeryKannan Srinivasan
January 2002
Alan L. Montgomery is Associate Professor of Marketing ([email protected]) andKannan Srinivasan is H.J. Heinz II Professor of Management, Marketing and InformationSystems and Director of the Center for E-Business Innovation ([email protected]) at theGraduate School of Industrial Administration, Carnegie Mellon University, 5000 Forbes Ave.,Pittsburgh, PA 15213.
Copyright © 2002 by Alan L. Montgomery and Kannan Srinivasan. All rights reserved.
1
Abstract:
The Internet gives incredible opportunities for companies to learn about their consumers.
Most managers view learning as actively asking questions directly to consumers and listening to
their responses. Alternatively, managers can passively learn by observing the choices that
consumers make. Passive learning techniques include user profiling, collaborative filtering, path
analysis, and conjoint analysis. These techniques can be used to extract knowledge from online
data sources like purchase transactions, clickstream data, and e-mail. Together active and
passive learning can be used to create personalized environments for consumers. Such
personalization gives higher value and causes customers to become more loyal and more
profitable for businesses.
Keywords: Internet Marketing, Learning, E-Commerce, Clickstream Data, Personalization

2
Introduction
Personalized marketing refers to customizing offers and content to the individual
consumer. This individualized approach to marketing is also called interactive marketing
(Blattberg and Deighton 1991, Haeckel 1998) or one-to-one marketing (Peppers, Rogers, and
Dorf 1999). At the heart of an interactive marketing strategy is the ability to learn about
individual consumers and adapt the marketing messages correspondingly. The purpose is to
create more value for consumers to increase the consumers’ loyalty to the supplier, and thereby
increase the supplier’s profitability.
A fundamental question is how do we learn about a consumer so that we know what level
and type of personalization is valuable to the consumer? The obvious answer is to ask the
consumer directly, which we call active learning. Examples of actively seeking information
from users online include log-ons, surveys, forms, and shipping information. These are
frequently the fastest and easiest techniques for collecting information that suppliers use to
personalize the products and services they offer. Unfortunately, active learning techniques have
many shortcomings:
(1) The direct approach requires too much effort on the part of the consumer. Imagine a
visitor to Ford’s Web site who would like to build a car and must select every one of
the 4,000 component systems that make up the automobile. Clearly this would be too
intensive an exercise.
(2) The consumer may not know the correct answer, either lacking the proper knowledge
or experience to evaluate the alternatives. For example, our visitor to Ford’s Web site
may lack the expertise to answer questions about engine options.

3
(3) Consumers may be unwilling to reveal correct answers. Suppose Ford was to ask
what price the user would be willing to pay for a customized car. Clearly consumers
might bias their answers anticipating that Ford might use the information to set the
price.
(4) The direct approach is inefficient since it ignores information consumers reveal about
their preferences in their past interactions and purchases. A good deal of internal and
external information to the company can be used to supplement actively collected
information. A repeat visitor to the Ford Web site, for example, who reviews the
product information several times, shows a higher interest level than a one-time
visitor; this is useful internal information in targeting and relationship building.
Additionally, Ford may have access to previous car purchases through external
sources that could also be used to customize the user’s online experience.
Another type of learning is passive learning, and it is the subject here. Passive learning
focuses on learning about consumers through the information they reveal online in browsing the
Web. Active learning is still useful, and sometimes is the only method for learning about a
consumer. Consider a company that needs a customer’s mailing address. One could guess that
the previous mailing address was still correct, which is a form of passive learning. But the direct
approach of asking for a new mailing address is preferred. However, combining active and
passive learning may yield a superior approach. For example, one could give the consumer a
choice of shipping to the address used in the past or to a new address, which combines active
learning (asking for a new address) and passive learning (presenting a previous address).
Many managers are unfamiliar with passive learning and they may be losing out on its
benefits. Passive learning requires some sophistication on the part of the manager, which may
4
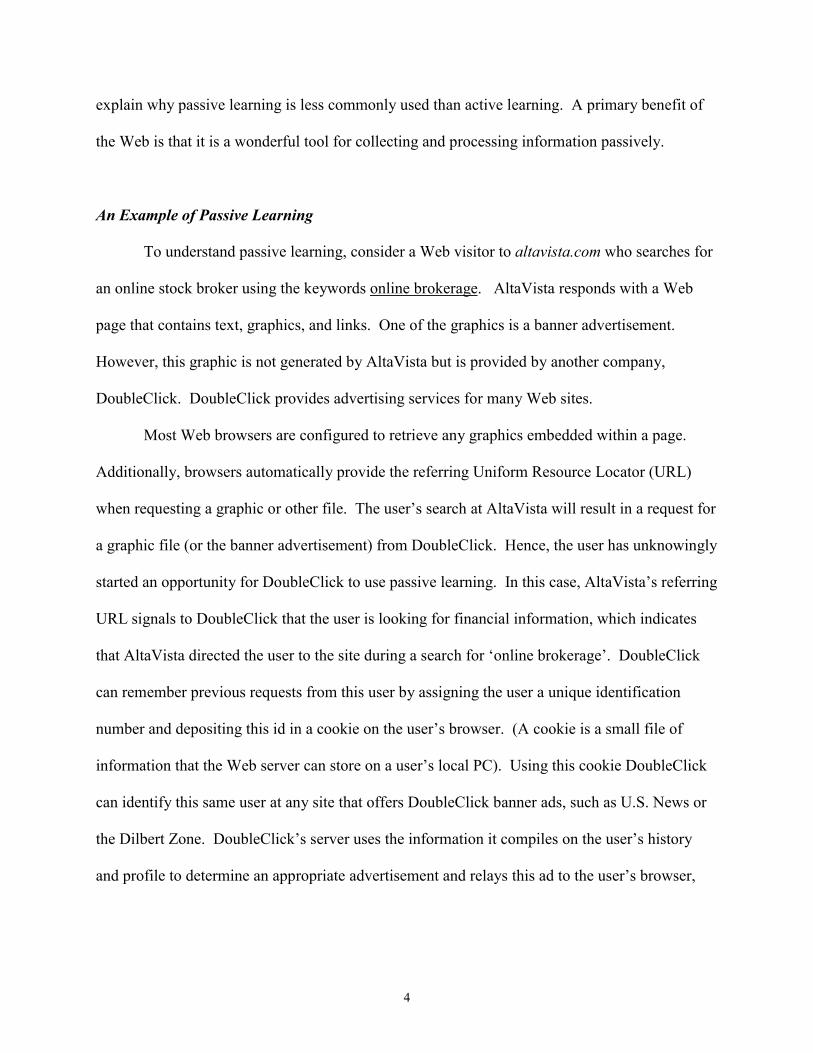
explain why passive learning is less commonly used than active learning. A primary benefit of
the Web is that it is a wonderful tool for collecting and processing information passively.
An Example of Passive Learning
To understand passive learning, consider a Web visitor to altavista.com who searches for
an online stock broker using the keywords online brokerage. AltaVista responds with a Web
page that contains text, graphics, and links. One of the graphics is a banner advertisement.
However, this graphic is not generated by AltaVista but is provided by another company,
DoubleClick. DoubleClick provides advertising services for many Web sites.
Most Web browsers are configured to retrieve any graphics embedded within a page.
Additionally, browsers automatically provide the referring Uniform Resource Locator (URL)
when requesting a graphic or other file. The user’s search at AltaVista will result in a request for
a graphic file (or the banner advertisement) from DoubleClick. Hence, the user has unknowingly
started an opportunity for DoubleClick to use passive learning. In this case, AltaVista’s referring
URL signals to DoubleClick that the user is looking for financial information, which indicates
that AltaVista directed the user to the site during a search for ‘online brokerage’. DoubleClick
can remember previous requests from this user by assigning the user a unique identification
number and depositing this id in a cookie on the user’s browser. (A cookie is a small file of
information that the Web server can store on a user’s local PC). Using this cookie DoubleClick
can identify this same user at any site that offers DoubleClick banner ads, such as U.S. News or
the Dilbert Zone. DoubleClick’s server uses the information it compiles on the user’s history
and profile to determine an appropriate advertisement and relays this ad to the user’s browser,
5
which displays it automatically. In this wonderful example of passive learning, DoubleClick
learns about users without ever actively asking them questions.
While this system may seem complicated, it is transparent and automatic to the
consumer. Its primary advantage is that it allows DoubleClick to display a banner ad on a
finance topic targeted to an individual who has just visited a finance site or to rotate banner ads
to maintain their effectiveness. DoubleClick can also display banner ads chosen on the basis of
search terms and keywords. For example, if a user performs a search for “online brokerage” at
altavista.com, a banner ad for Datek, an online brokerage, may be returned along with the results
of the search. DoubleClick reports that the “click-thru” of targeted banner ads for Datek
constructed in this way was over 15 percent, far beyond the usual 0-3 percent range. The cost for
such a targeted banner ad may be $.085 per viewer, which is more than four times the cost of a
nontargeted banner ad. In comparison the average cost of a 30-second commercial on television
during prime time is about $.012 per viewer. Targeted advertisements are more costly, but their
greater effectiveness may outweigh their costs. The use of passive learning goes far beyond
targeted banner ads; it can be used in many contexts to customize the offers and content provided
to users.
The Inputs of Online Learning
Learning occurs when we take the raw input of data and turn it into knowledge. We can
measure the value of knowledge by the impact it has on a decision. Unfortunately, many
managers do not know how to extract knowledge from the data they collect. Hence, the data
have no value because it has not impact on their decisions. Fortunately many tools are available
for turning data into action.
6
Online environments provide many sources of data. A natural byproduct of users
accessing Web pages is a dataset that contains the sequence of URLs they visited, how long they
viewed them, and at what time. This dataset is called the clickstream, and it is a rich resource for
online learning. To maximize its potential, managers can merge the clickstream with
demographic and purchase information or other external databases. The different types of data
available online include purchase and transaction data, clickstream data, information collected
from cookies, and e-mail data.
Purchase and Transaction Data
Generally, as marketers we wish to predict purchases so it is only natural to start with
transaction data. In many retail contexts, transaction data are already collected automatically.
For example, when you check out at your local supermarket, a computerized bar-code scanner
records all your purchases, the prices you paid, any specials or coupons, and may associate these
purchases with you using a frequent-buyer or affinity card. Besides the obvious uses of this
information for accounting and inventory purposes it can also be used for marketing purposes.
For example, we can compile these data through time and use them to predict a consumer’s next
purchase. In marketing research, we find that the best predictor of a future purchase is what the
consumer has purchased in the past. For example, if we are trying to predict whether a shopper
will purchase Tide or Wisk laundry detergent on a particular visit, the most valuable information
is not age, gender, or other demographics. The most valuable piece of information is whether
that person bought Tide in the past.
In addition, if we want to determine whether the shopper should get a coupon, the most
relevant question is not what they have bought, but how will they respond to price promotions in
7
the future. Rossi, McCulloch, and Allenby (1996) consider how purchase histories can be used
to determine couponing policies. They estimate a statistical model known as a multinomial
probit model to determine the price sensitivity of a supermarket shopper using information from
previous purchases in a single product category, canned tuna. They used the model to determine
what value (if any) of coupon to offer a shopper at the checkout stand and the expected profits
for different coupons based on various information sets (Table 1). The blanket coupon drop
assumed that all consumers received a coupon for 10¢ off on their next purchase. This blanket
coupon drop is used as a benchmark to compare other strategies. Using demographic
information to choose who received a coupon, they increased expected profits by 10 percent over
a blanket coupon drop. In comparison, by using only data on the last purchase, they increased
profits by 60 percent. Clearly purchase information is more valuable than demographic
information in this context. In the full information case, they used information on both previous
purchases and demographics and obtained a 160 percent increase in expected profitability over
the blanket coupon drop. Purchase information used properly is an incredible resource.
Information Set Profit gainBlanket coupon dropCoupon drop using information from consumer demographicsCoupon drop using information from last purchaseCoupon drop using entire purchase historyCoupon drop using entire purchase history and demographics
1.01.11.61.92.6
Table 1. The relative value of information sets for the distribution of a coupon as estimated byRossi, MuCulloch, and Allenby (1996). Expected profits increase as more information is used.The most dramatic profit increased come from using purchase histories and not just demographicinformation.

8
Clickstream Data
Just as we can collect purchase data in physical stores, we can collect purchase data in
virtual stores. However, the data set is much richer. In the brick and mortar retail store, we
know what the customer purchased and what items and prices were available within the store.
But imagine that we also record shopper movements through the store, what items they looked at
and considered and those they ignored, how long shoppers considered their decisions, and
whether they bought cake mix and then put cake frosting into their carts. This is exactly the kind
of information we can collect in online shopping environments.
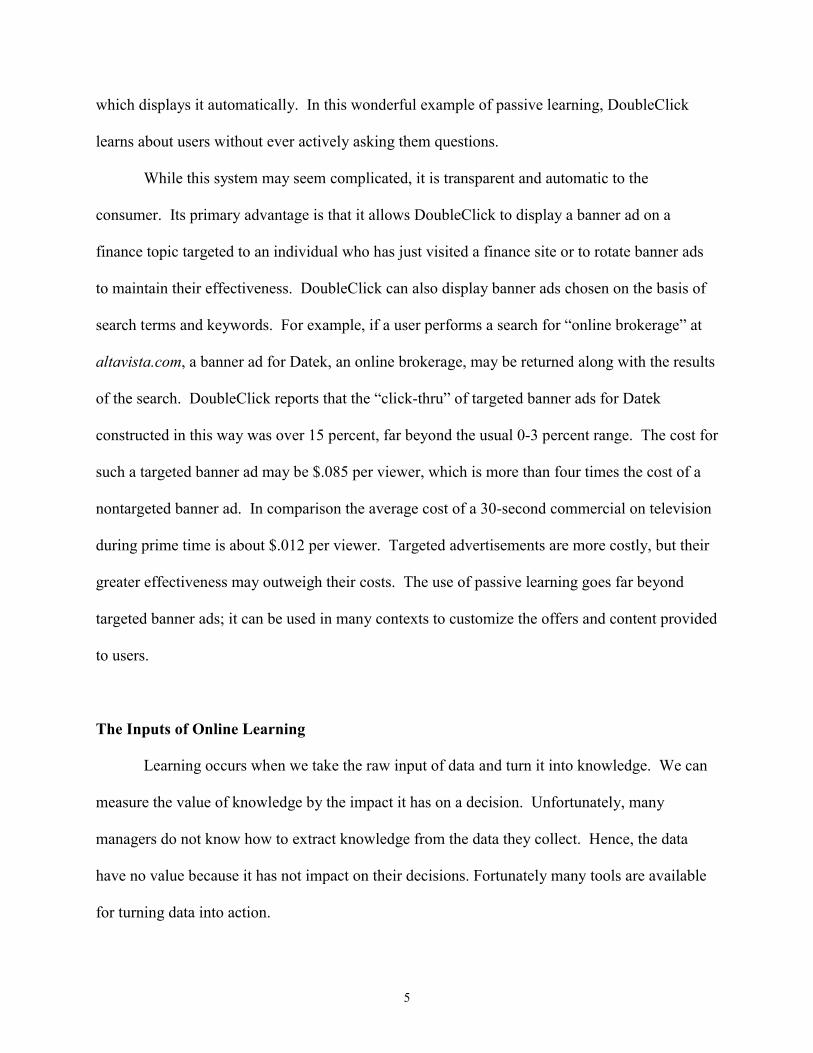
Consider a web user who visits the portal AltaVista, searches for “automobile”, and
selects the first site from the list of results, which is labeled “Automobile Magazine Just $11.95 a
Year!” This Web session is illustrated in Figure 1, and the corresponding clickstream data set is
provided in Table 2.
The browser does many tasks for the user automatically. When the user requested the
second URL the document called for had many graphic images to be imbedded. The browser
automatically requested these images from their servers and displayed them appropriately in the
browser window. Three of the graphics were logos (Avsmall.gif) or navigational symbols
(blended_icon.gif and truste_mark.gif) that were located at akamai.net. The other was a banner
ad located at ad.doubleclick.net/click . Each of these requests created a trace on the servers at
akamai.net or doubleclick.net and hence further opportunities to learn about the user for these
companies.
9
Figure 1. This sample clickstream session illustrates a search at the portal AltaVista for“automobile”. The arrows illustrate the controls selected by the user and the flow of the session.
10
Date and TimeOf Access
SecondsViewed URL
18Jul2001:18:55:5718Jul2001:18:56:1718Jul2001:18:56:55
203818
http://www.altavista.comhttp://www.altavista.com/sites/search/Web?q=automobilehttp://store.yahoo.com/magazinecity/9675-12.html
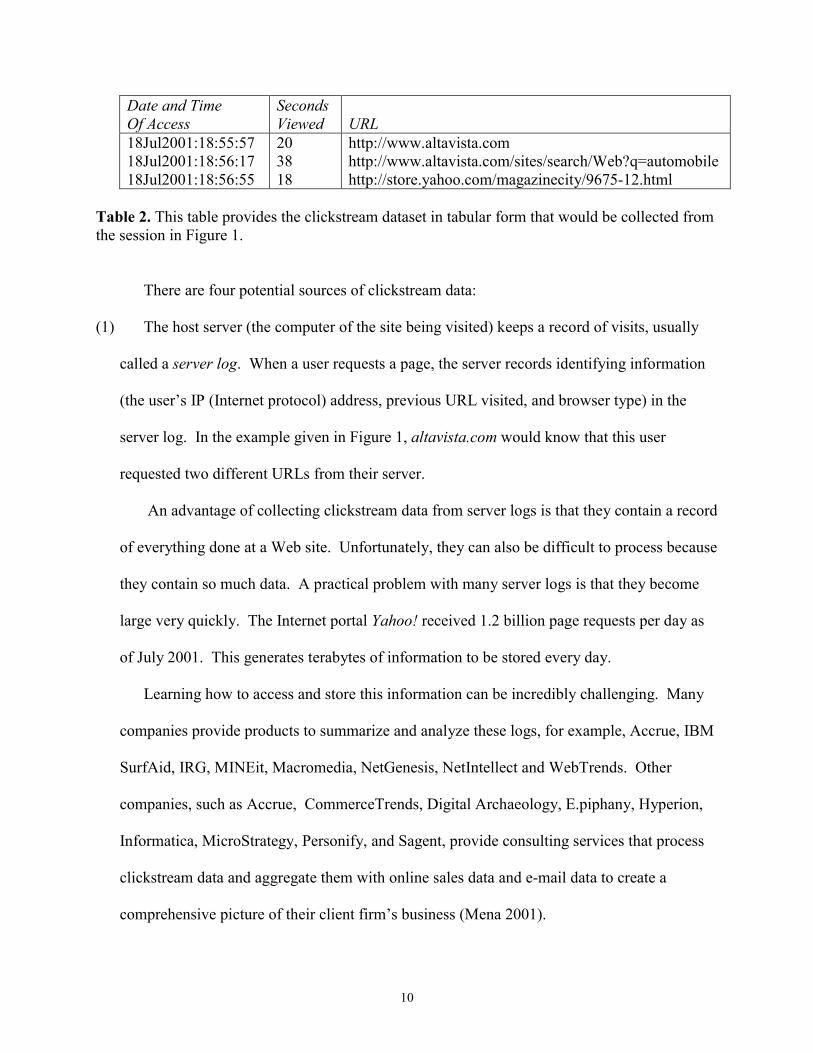
Table 2. This table provides the clickstream dataset in tabular form that would be collected fromthe session in Figure 1.
There are four potential sources of clickstream data:
(1) The host server (the computer of the site being visited) keeps a record of visits, usually
called a server log. When a user requests a page, the server records identifying information
(the user’s IP (Internet protocol) address, previous URL visited, and browser type) in the
server log. In the example given in Figure 1, altavista.com would know that this user
requested two different URLs from their server.
An advantage of collecting clickstream data from server logs is that they contain a record
of everything done at a Web site. Unfortunately, they can also be difficult to process because
they contain so much data. A practical problem with many server logs is that they become
large very quickly. The Internet portal Yahoo! received 1.2 billion page requests per day as
of July 2001. This generates terabytes of information to be stored every day.
Learning how to access and store this information can be incredibly challenging. Many
companies provide products to summarize and analyze these logs, for example, Accrue, IBM
SurfAid, IRG, MINEit, Macromedia, NetGenesis, NetIntellect and WebTrends. Other
companies, such as Accrue, CommerceTrends, Digital Archaeology, E.piphany, Hyperion,
Informatica, MicroStrategy, Personify, and Sagent, provide consulting services that process
clickstream data and aggregate them with online sales data and e-mail data to create a
comprehensive picture of their client firm’s business (Mena 2001).
11
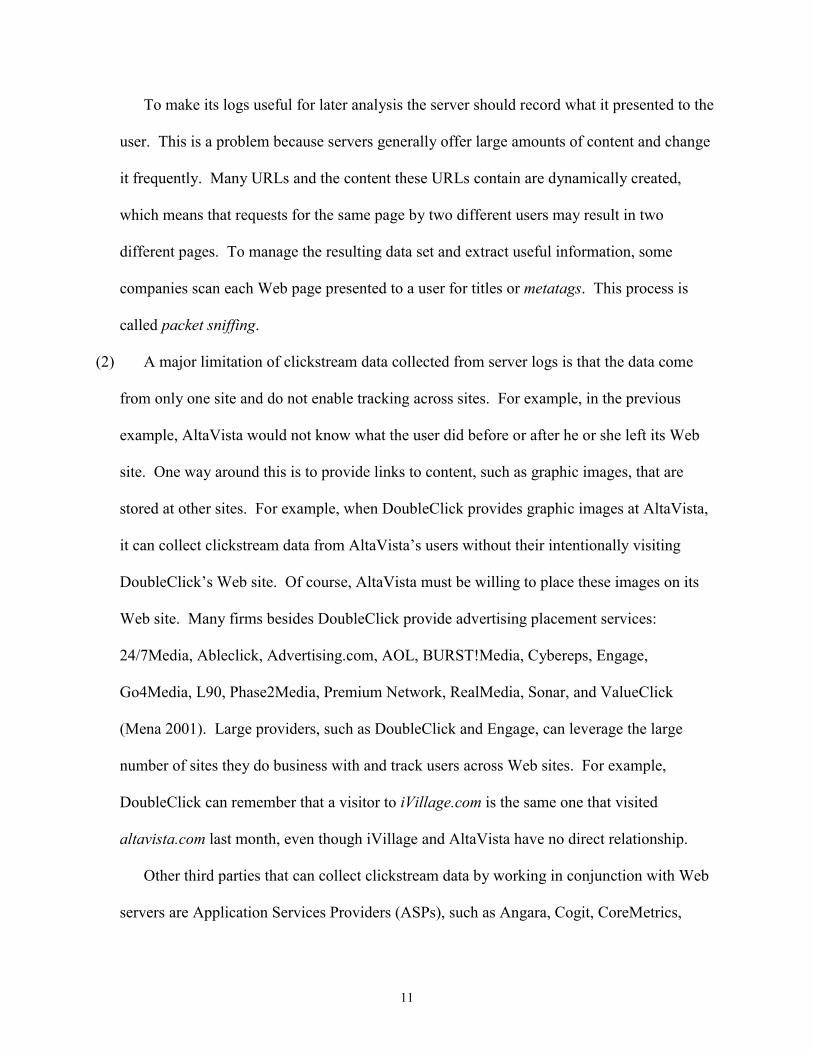
To make its logs useful for later analysis the server should record what it presented to the
user. This is a problem because servers generally offer large amounts of content and change
it frequently. Many URLs and the content these URLs contain are dynamically created,
which means that requests for the same page by two different users may result in two
different pages. To manage the resulting data set and extract useful information, some
companies scan each Web page presented to a user for titles or metatags. This process is
called packet sniffing.
(2) A major limitation of clickstream data collected from server logs is that the data come
from only one site and do not enable tracking across sites. For example, in the previous
example, AltaVista would not know what the user did before or after he or she left its Web
site. One way around this is to provide links to content, such as graphic images, that are
stored at other sites. For example, when DoubleClick provides graphic images at AltaVista,
it can collect clickstream data from AltaVista’s users without their intentionally visiting
DoubleClick’s Web site. Of course, AltaVista must be willing to place these images on its
Web site. Many firms besides DoubleClick provide advertising placement services:
24/7Media, Ableclick, Advertising.com, AOL, BURST!Media, Cybereps, Engage,
Go4Media, L90, Phase2Media, Premium Network, RealMedia, Sonar, and ValueClick
(Mena 2001). Large providers, such as DoubleClick and Engage, can leverage the large
number of sites they do business with and track users across Web sites. For example,
DoubleClick can remember that a visitor to iVillage.com is the same one that visited
altavista.com last month, even though iVillage and AltaVista have no direct relationship.
Other third parties that can collect clickstream data by working in conjunction with Web
servers are Application Services Providers (ASPs), such as Angara, Cogit, CoreMetrics,
12
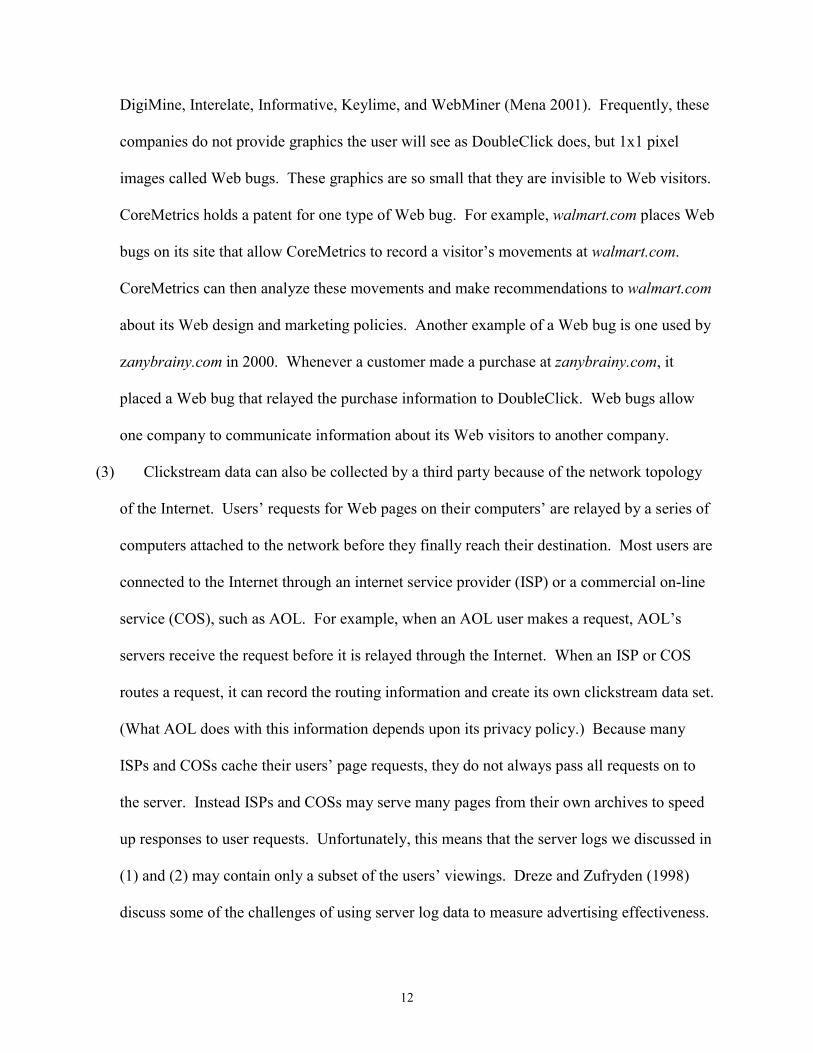
DigiMine, Interelate, Informative, Keylime, and WebMiner (Mena 2001). Frequently, these
companies do not provide graphics the user will see as DoubleClick does, but 1x1 pixel
images called Web bugs. These graphics are so small that they are invisible to Web visitors.
CoreMetrics holds a patent for one type of Web bug. For example, walmart.com places Web
bugs on its site that allow CoreMetrics to record a visitor’s movements at walmart.com.
CoreMetrics can then analyze these movements and make recommendations to walmart.com
about its Web design and marketing policies. Another example of a Web bug is one used by
zanybrainy.com in 2000. Whenever a customer made a purchase at zanybrainy.com, it
placed a Web bug that relayed the purchase information to DoubleClick. Web bugs allow
one company to communicate information about its Web visitors to another company.
(3) Clickstream data can also be collected by a third party because of the network topology
of the Internet. Users’ requests for Web pages on their computers’ are relayed by a series of
computers attached to the network before they finally reach their destination. Most users are
connected to the Internet through an internet service provider (ISP) or a commercial on-line
service (COS), such as AOL. For example, when an AOL user makes a request, AOL’s
servers receive the request before it is relayed through the Internet. When an ISP or COS
routes a request, it can record the routing information and create its own clickstream data set.
(What AOL does with this information depends upon its privacy policy.) Because many
ISPs and COSs cache their users’ page requests, they do not always pass all requests on to
the server. Instead ISPs and COSs may serve many pages from their own archives to speed
up responses to user requests. Unfortunately, this means that the server logs we discussed in
(1) and (2) may contain only a subset of the users’ viewings. Dreze and Zufryden (1998)
discuss some of the challenges of using server log data to measure advertising effectiveness.
13
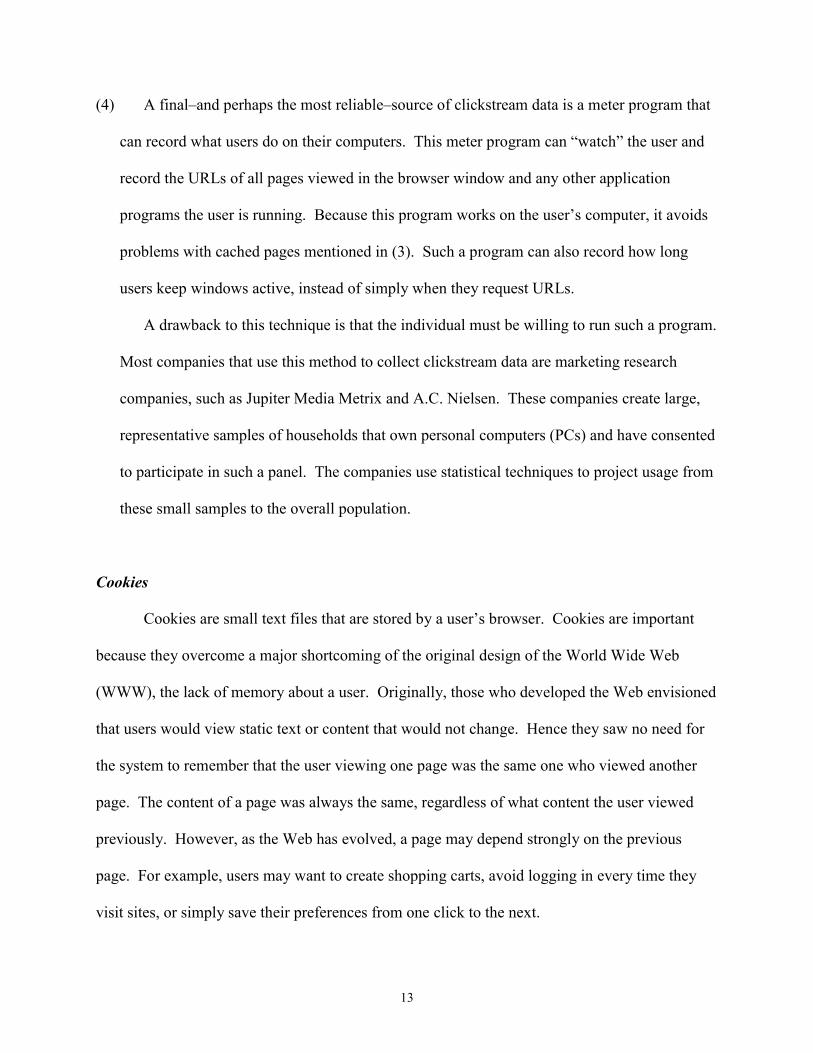
(4) A final–and perhaps the most reliable–source of clickstream data is a meter program that
can record what users do on their computers. This meter program can “watch” the user and
record the URLs of all pages viewed in the browser window and any other application
programs the user is running. Because this program works on the user’s computer, it avoids
problems with cached pages mentioned in (3). Such a program can also record how long
users keep windows active, instead of simply when they request URLs.
A drawback to this technique is that the individual must be willing to run such a program.
Most companies that use this method to collect clickstream data are marketing research
companies, such as Jupiter Media Metrix and A.C. Nielsen. These companies create large,
representative samples of households that own personal computers (PCs) and have consented
to participate in such a panel. The companies use statistical techniques to project usage from
these small samples to the overall population.
Cookies
Cookies are small text files that are stored by a user’s browser. Cookies are important
because they overcome a major shortcoming of the original design of the World Wide Web
(WWW), the lack of memory about a user. Originally, those who developed the Web envisioned
that users would view static text or content that would not change. Hence they saw no need for
the system to remember that the user viewing one page was the same one who viewed another
page. The content of a page was always the same, regardless of what content the user viewed
previously. However, as the Web has evolved, a page may depend strongly on the previous
page. For example, users may want to create shopping carts, avoid logging in every time they
visit sites, or simply save their preferences from one click to the next.
14
Cookies allow Web servers to maintain memories about users. When a browser makes a
request to a Web server, it also checks to see whether it has any cookies that the server has asked
it to save from previous visits. The first time a user visits a Web server, he or she will not have
any cookies for that site. The Web server can ask the browser to create cookies or change
cookies when it responds to a user request.
The Web server determines how to use the cookie. For example, DoubleClick uses a
cookie to assign every visitor who requests one of its files a unique identification number. Other
servers use a cookie to identify the shopping basket, to save preferences about a Web site, or to
identify which requests from a given computer are coming from the same browser window.
Users can decide whether they want to accept a cookie, but most users do not change the default
setting of “accept all cookies.” Given that the primary use of the cookie is to track users, many
privacy advocates are very concerned about the use of cookies, although no consensus has
developed concerning privacy (Smith 2001).
E-mail is one of the most frequently used applications on the Internet, and marketers can
use it to reach customers. People use e-mail to communicate with colleagues, friends, and
family. One property of e-mail that makes it different from Web browsing is that it is
asynchronous. Generally, when a user requests a page from a Web server, it is displayed
immediately and then removed after a short time. E-mail messages, however, may not be viewed
for many hours or days. Also, they can persist for a long time, since users can save them for
future reference. It is possible to embed Web bugs or references to graphic images in e-mail
messages that will cause them to make requests to a Web server. When the user reads the e-mail
15
message, the browser will request the server to display the graphic or Web bug, leaving a trace in
a clickstream dataset. Hence, clickstream data and data on e-mail browsing can be combined.
Many companies have begun using e-mail for direct marketing. Companies such as
Brigade, Brightware, Digital Impact, eGain, FaceTime, Kana, LivePerson, Message Media, and
NetCentives (Mena 2001) provide e-mail systems that can be intelligent and can interface with
other functions that their clients provide. For example, LivePerson provides facilities to monitor
chat sites and to use advanced text-processing techniques to respond to user comments.
Passive Learning
Online data sources are valuable only if they change our actions as marketers. Most of
the data sets we have mentioned are easy to collect but can be large and difficult to process.
Data mining (Berry and Linoff 1997) is useful for processing these datasets. Data mining
combines algorithms developed in computer science with statistical techniques to automatically
search for patterns in large data sets. Currently, data mining is made up of diverse methods, such
as regression analysis, decision trees, neural networks, Bayesian learning, genetic algorithms,
and clustering. Many software providers provide data-mining tools: Angoss, BusinessMiner,
Data Distilleries, IBM, Megaputer, Quadstone, Urban Science, Visual Insights, SAS, and SPSS.
Unfortunately, these tools can be expensive and require trained analysts to process the data sets
into actionable knowledge. These techniques extract knowledge from data collected passively,
and several are very promising in turning data collected online into valuable intelligence for
managers. Hence, data mining is another example of passive learning.
User Profiling

16
Frequently we want to identify users in terms of demographic characteristics or attitudes.
For example, if we have separate clothing lines for men and women, determining users’ genders
could be useful for personalizing their experience. Answering questions can be burdensome for
users—if they are willing to answer questions at all. We can use passive learning with
clickstream data to make inferences about users’ demographic characteristics and attitudes based
upon the choices they made while visiting Web sites or pages. For example, visitors to sports
sites are likely to be men. The question is how much can we learn and can we trust what we
learn?
Montgomery (2001) developed a user-profiling technique using clickstream data.
Consider the example of one user who visited 22 Web sites during a month (Table 3). Jupiter
Media Metrix estimated the percentage of people visiting each domain at least once during the
month who were women. For example, it estimated that 66 percent of visitors to ivillage.com are
female. (This percentage is not weighted by the number of pages requested, and men may
account for a lower percentage of page requests since they may request fewer pages per visit than
women.) Without knowing anything about a user except that he or she visits ivillage.com, the
odds are two to one that the user is female. These odds are quite reasonable because ivillage.com
offers content geared towards women. For similar reasons, a gaming site may appeal primarily
to teenage boys, and sports sites may predominately attract men. On the other hand, portals such
as Yahoo and Excite draw audiences that are fairly representative of the Web as a whole and their
use provides little information about gender.
Domain Visited
Percentageof Visitorswho arefemale Domain Visited
Percentageof Visitorswho arefemale

17
Aol.comAstronet.comAvon.comBlue-planet.comCartoonnetwork.comCbs.comCountry-lane.comEplay.comHalcyon.comHomearts.comIvillage.com
48%64%75%52%56%54%76%47%41%70%66%
libertynet.orglycos.comnetradio.netnick.comonhealth.comonlinepsych.comsimplenet.comthriveonline.comvalupage.comvirtualgarden.comwomenswire.com
63%39%27%57%59%83%44%76%59%71%66%
Table 3. In this list of domains visited by a female user over the course of one month, JupiterMedia Metrix estimated the percentage of people who visited the domain at least once during themonth that were female.
If we did not know the gender of a Web user, we might form the hypothesis that the user
was female since the user visits web sites oriented towards a female audience (Table 3). Initially
we could use the information that 45 percent of Web users in this month were female. If we
knew that the user visited ivillage.com, 66 percent of whose visitors were female, we could
update our inference that our hypothesis (the user is female) was true using this new piece of
information. Statistically this is known as a Bayesian hypothesis-updating problem, and we
could apply the following rule to recompute the probability that the user is female:
The original probability that the user is female is denoted by p� =.45. The new
information indicates the probability is .66, p=.66. The updated probability or posterior
probability of our hypothesis is denoted by p�� =.62. In other words, the probability that this is a
female user has increased from 45 percent to 62 percent. Based on information from all 22 sites,
the probability that the user is female is 99.97 percent (derived by updating the probability that
the user is female by using information on all the sites listed in Table 3).
62.34.55.66.45.
66.45.)1()1(
=⋅+⋅
⋅=−⋅−+⋅
⋅=pppp
ppp��
���

18
To assess the accuracy of this technique, we applied it to actual usage information from a
sample of 19,000 representative Web users with one month of usage and known gender. Users
in this sample vary a great deal; some visit only one site, while others may visit hundreds. If the
model predicted that a user was male with more than an 80 percent probability, then we
predicted the user to be male. We made similar predictions for female users. We had enough
information to classify 60 percent of users as either male or female. Of the users we classified as
male, 81 percent were male, and of the users we classified as female, 96 percent were female.
The agreement between the predictions and actual gender validates the accuracy of the
technique. More advanced techniques that accounted for statistical dependence between Web-
site visits could increase the accuracy of these predictions.
In this example, we knew all the Web sites a user visited, but such thorough tracking is
not necessary to employ a user-profiling technique. For example, we could determine the
probability that a user who visited cnn.com were male by examining what categories he or she
visited. Or we could guess whether a random visitor to ppg.com was an industrial buyer or
technician by examining the types of pages visited. The technique does not require huge
amounts of information. If we knew only that this user visited cbs.com, ivillage.com,
libertynet.org, nick.com, and onlinepsych.com, we could still predict with a 95 percent degree of
certainty that this was a female visitor. This is precisely the information that the DoubleClick
network would have about this visitor.
Predicting the genders of Web users seems innocuous, but we can use the same
techniques to predict incomes (for example, does a user make more than $75,000?). Just as some
sites provide information about gender, some provide information about income (for example,
millionaire.com, wsj.com, and businessweek.com). In fact, we could apply this technique to any
19
characteristic as long as we had a sample of users with known characteristics to compare with
our unknown user. With user-profiling techniques, managers can accurately predict the
characteristics of their Web-site visitors without asking them to fill out surveys.
User profiling has potential problems. First, it makes errors. Even with a 99.97 percent
chance that site visitors are female, we will incorrectly label some males as females and vice
versa. For example, in a sample of 10,000 users that we predicted were females, on average
three would be male. Therefore, we must consider the costs associated with making a wrong
prediction. We might display the wrong advertisement or insult a female user with a male
message. In addition, a company should assess its users’ privacy concerns and determine
whether the value of personalization outweighs its costs.
Collaborative Filtering
Another approach to providing customized content is to recommend new products based
on an individual’s previous purchases or on expressed preferences for particular products. A
popular technique for doing this is collaborative filtering. Collaborative filtering works by
comparing a consumer’s past purchases or stated preferences to the purchases or stated
preferences of similar consumers from an existing database. The firm can make
recommendations by identifying products that similar consumers have purchased that this
consumer has not yet purchased.
Amazon and CDNow, for example, use collaborative filtering to recommend books and
CDs to customers. For example, if someone bought albums by the Rolling Stones, the Beatles,
the Who, and Jefferson Starship, a collaborative filtering system might recommend Hot Tuna,
Kaukonen*Jorma, Quicksilver Messenger Service, and Love. Ireactor says this system has
20
doubled CDNow’s sales of recommended albums over a system of having its employees make
recommendations based on their own experience. For additional references about collaborative
filtering and its applications, see Shardanand and Maes (1995).
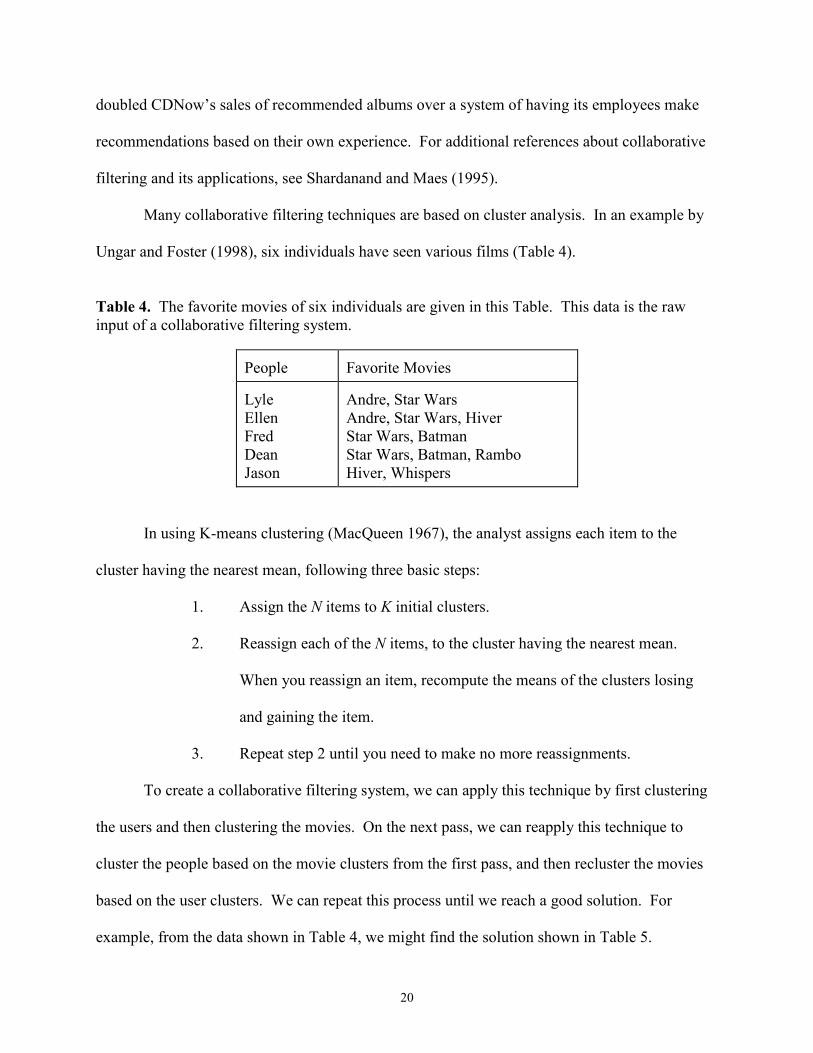
Many collaborative filtering techniques are based on cluster analysis. In an example by
Ungar and Foster (1998), six individuals have seen various films (Table 4).
Table 4. The favorite movies of six individuals are given in this Table. This data is the rawinput of a collaborative filtering system.
People Favorite Movies
Lyle Ellen Fred Dean Jason
Andre, Star Wars Andre, Star Wars, Hiver Star Wars, Batman Star Wars, Batman, Rambo Hiver, Whispers
In using K-means clustering (MacQueen 1967), the analyst assigns each item to the
cluster having the nearest mean, following three basic steps:
1. Assign the N items to K initial clusters.
2. Reassign each of the N items, to the cluster having the nearest mean.
When you reassign an item, recompute the means of the clusters losing
and gaining the item.
3. Repeat step 2 until you need to make no more reassignments.
To create a collaborative filtering system, we can apply this technique by first clustering
the users and then clustering the movies. On the next pass, we can reapply this technique to
cluster the people based on the movie clusters from the first pass, and then recluster the movies
based on the user clusters. We can repeat this process until we reach a good solution. For
example, from the data shown in Table 4, we might find the solution shown in Table 5.
21
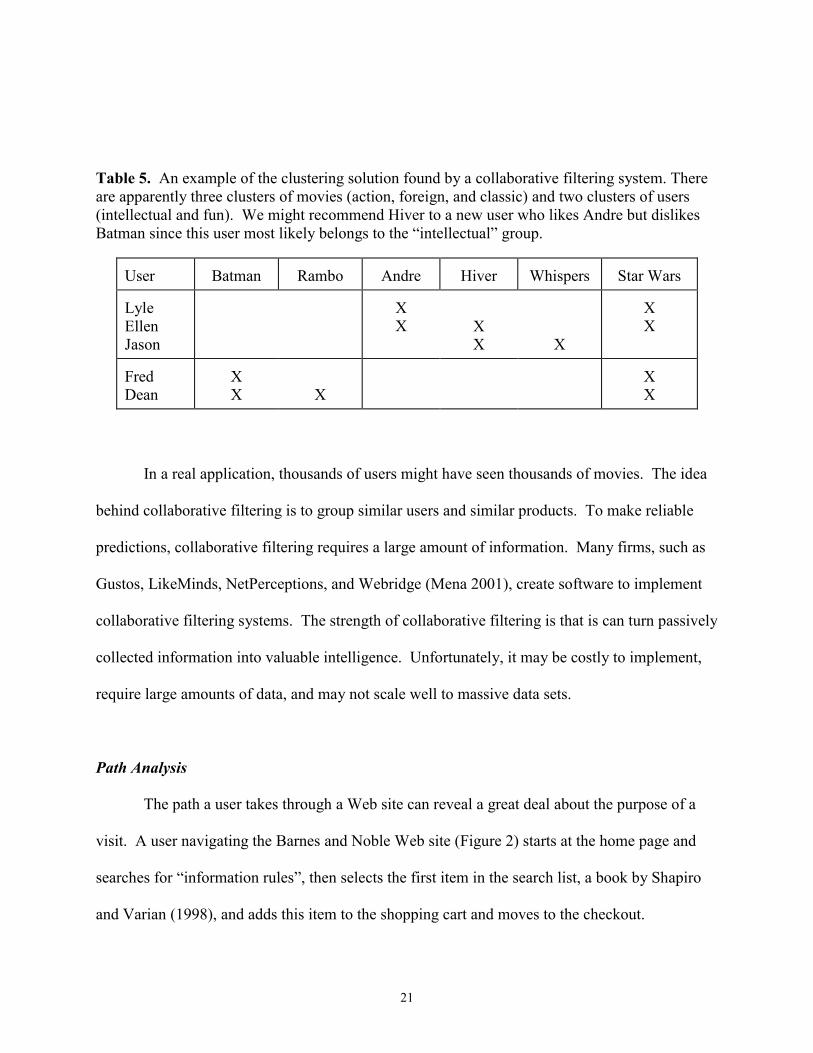
Table 5. An example of the clustering solution found by a collaborative filtering system. Thereare apparently three clusters of movies (action, foreign, and classic) and two clusters of users(intellectual and fun). We might recommend Hiver to a new user who likes Andre but dislikesBatman since this user most likely belongs to the “intellectual” group.
User Batman Rambo Andre Hiver Whispers Star Wars
Lyle Ellen Jason
X X
X X
X
X X
Fred Dean
X X
X
X X
In a real application, thousands of users might have seen thousands of movies. The idea
behind collaborative filtering is to group similar users and similar products. To make reliable
predictions, collaborative filtering requires a large amount of information. Many firms, such as
Gustos, LikeMinds, NetPerceptions, and Webridge (Mena 2001), create software to implement
collaborative filtering systems. The strength of collaborative filtering is that is can turn passively
collected information into valuable intelligence. Unfortunately, it may be costly to implement,
require large amounts of data, and may not scale well to massive data sets.
Path Analysis
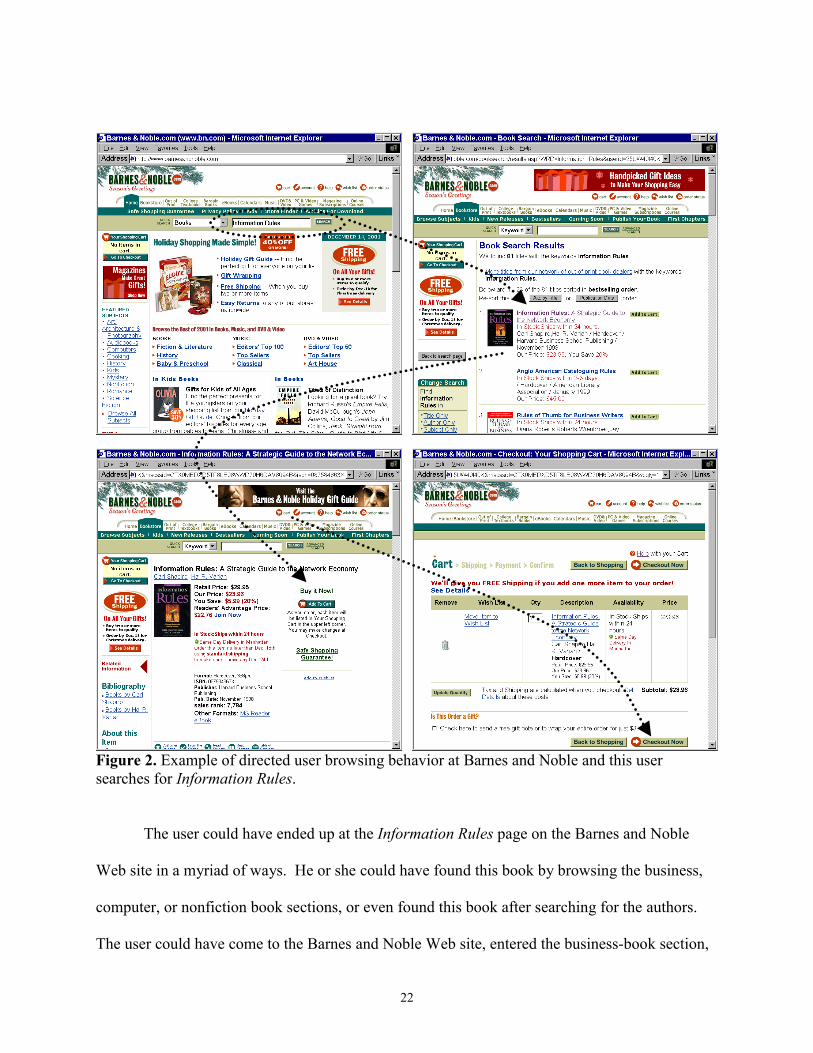
The path a user takes through a Web site can reveal a great deal about the purpose of a
visit. A user navigating the Barnes and Noble Web site (Figure 2) starts at the home page and
searches for “information rules”, then selects the first item in the search list, a book by Shapiro
and Varian (1998), and adds this item to the shopping cart and moves to the checkout.
22
Figure 2. Example of directed user browsing behavior at Barnes and Noble and this usersearches for Information Rules.
The user could have ended up at the Information Rules page on the Barnes and Noble
Web site in a myriad of ways. He or she could have found this book by browsing the business,
computer, or nonfiction book sections, or even found this book after searching for the authors.
The user could have come to the Barnes and Noble Web site, entered the business-book section,
23
viewed a number of bestsellers, then searched for pricing, and eventually found the Information
Rules page after two dozen clicks.
Path analysis is an attempt to infer information about users’ goals from the navigation
decisions they make. Some users make directed searches with distinct goals in mind (Figure 2).
People in this directed mode would likely see additional information as irrelevant since their goal
is to find a specific book. In fact, any additional information on the page, such as specials and
advertisements, could be distracting and could lower the probability that they would stay at that
site. On the other hand, users surfing the site are conducting nondirected searches and can be
strongly influenced by the content of the session. An appealing Web-page design may capture
the attention of such users and cause them to look at a book they would not have considered
previously. With path analysis, managers can personalize users’ sessions by responding with
relevant information, can intervene with users who are likely to leave the site by making special
offers, or can identify users who are simply browsing and locating products they might never
otherwise have considered (and perhaps display recommendations from a collaborative filtering
system).
Browsing behavior at online stores differs from that at offline stores. In an offline store,
shoppers must take time to move through the store, which gives the retailer time to present
products in an order that maximizes profits. For example, supermarkets put their dairy, produce,
and bakery departments at opposite ends of the store even though they offer items that are
commonly purchased. The supermarkets thus force consumers to navigate through the entire
store. However, an online store does not have that luxury. Users can enter or leave the store from
any point. This implies that online retailers need to be more cognizant of the paths users take
through the store. Unfortunately, research on path analysis both in academia and in business is
24
just beginning. However, path-analysis technology could have a huge impact on Web-site design
and on the use of passively collected data to infer shoppers’ goals and desires.
Proactive Learning
In active learning, one focuses on asking questions and allowing users to dictate the
course of personalization. In passive learning one focuses on using information collected
passively or as a byproduct of browsing to learn about users and personalize their experiences.
Another form of learning, which we call proactive learning, combines these two elements. With
proactive learning, one leverages the strengths of the two methods to improve the interface with
users. Specifically, we will describe a marketing technique, conjoint analysis, to illustrate
proactive learning.
The principle behind conjoint analysis is that consumers attach values to all the attributes
of a product. The total value or utility of the product is the sum of the values of its components.
However, attribute values are latent, and consumers cannot state them directly. For example, we
could ask consumers directly for the probability that they would purchase a wool coat at $98 and
a rayon one at $89. Unfortunately, consumers would not know the answer to these questions or if
they did answer such questions, the answers would be of doubtful reliability. However,
consumers would be able to answer directly whether they would purchase a wool or a rayon coat.
If the analyst varies the attributes of products and asks consumers to compare a series of coats
with varying attributes and prices, the analyst can then infer the value of each component using a
statistical model of choice, such as a multinomial logit or probit model. The use of a statistical
model helps the analyst to infer how consumers make decisions.
25
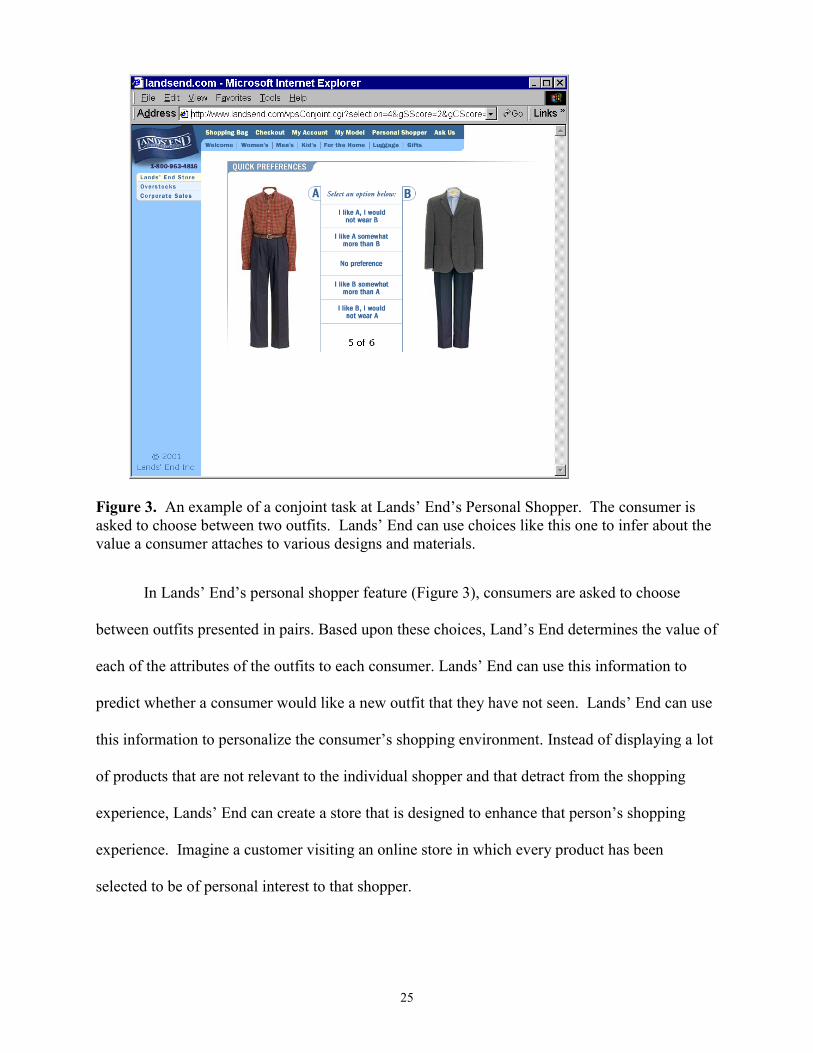
Figure 3. An example of a conjoint task at Lands’ End’s Personal Shopper. The consumer isasked to choose between two outfits. Lands’ End can use choices like this one to infer about thevalue a consumer attaches to various designs and materials.
In Lands’ End’s personal shopper feature (Figure 3), consumers are asked to choose
between outfits presented in pairs. Based upon these choices, Land’s End determines the value of
each of the attributes of the outfits to each consumer. Lands’ End can use this information to
predict whether a consumer would like a new outfit that they have not seen. Lands’ End can use
this information to personalize the consumer’s shopping environment. Instead of displaying a lot
of products that are not relevant to the individual shopper and that detract from the shopping
experience, Lands’ End can create a store that is designed to enhance that person’s shopping
experience. Imagine a customer visiting an online store in which every product has been
selected to be of personal interest to that shopper.
26
Conjoint analysis can also be used in the context of a shopbot (a shopping robot). A
shopbot helps consumers find low-priced items. The shopbot asks the user to request a product
and then launches a search at all the online stores it can access. For example, a search for the
recent book John Adams by David McCullough at dealtime.com yields a range of prices between
$20.99 and $50.95 after searching scores of online stores. The offers made by the various stores
are for the same book but differ in price, shipping options, availability, and reputation of the
store. In the context of conjoint analysis, we can think of each of these features as an attribute.
As the shopbot visitor makes choices, we can find out what features this person values. Without
asking the consumer to make dozens of comparisons, the shopbot can determine which offers are
likely to interest each consumer. It can then improve the shopping experience for the consumer,
which should make that consumer more profitable and loyal for the shopbot (Montgomery et al.
2001).
Discussion and Conclusions
The Internet offers many firms ways to reduce their costs and ways to passively learn
about opportunities to sell products and services. They can often reduce costs for customer
service. By providing information online, firms can save on their call centers for customer
service. The celebrated example in this area is Federal Express’s migration to the Internet,
where it gives customers the ability to track their own shipped packages. The firm provides
detailed information on the progress of the shipment, including where the package is in the
transit process. Customers switched to the Internet to obtain information, and Fed Ex’s call
center volume decreased dramatically. Fed Ex has reduced its call-center personnel from several
hundred to scores. The firm also has an opportunity for passive learning. Individuals who often
track overnight packages are apparently far more time sensitive than other customers. They may
27
become ripe targets for future services that further reduce shipping time or allow them to track
shipments using remote network appliances, such as cell phones or PDAs (personal digital
assistants).
Firms in several sectors are following Federal Express’s lead. Mutual funds, inundated
with calls from customers who want their current account balances, have flocked to the Web to
minimize costly call volume. Appliance firms provide electronic manuals to customers who
have misplaced them reducing the need for call centers to support customer requests. The cost
reduction is immediate, and the scope for passive learning is immense.
Through passive learning, firms can tailor different strategies for customers with different
levels of expertise. Financial service firms can provide vast amounts of information on
instruments ranging from the simple to the complex. By mining collected data on the extent and
depth of information customers seek, firms can develop prospect lists for their product offerings.
In addition, based on customers’ information-search patterns, firms can distinguish expert
customers from novice customers. For the former, providing information on complex offerings
might suffice, while for the latter, far more personal counseling may be required.
Passive learning has enormous potential for business-to-business interactions as well.
Firms providing maintenance have a major opportunity to keep their customers’ machinery up
and running. For the next generation of networked copiers, suppliers will continuously monitor
usage patterns, recognizing when the system might break down and providing timely preventive
maintenance. Suppliers will be able to offer customized maintenance plans instead of standard
plans that may not serve all customers optimally. The suppliers can also identify opportunities to
sell consumables, additional services, and even new products. For example, customers who use
color copiers heavily need far more related consumables than other firms do. The supplier can
28
deliver such consumables frequently and may even figure out that a different copier would better
serve the customer. Some customers may use copiers intensely during certain periods. For
example, an accounting firm’s usage would peak just before April 15. By tracking firms’ peak
loads, suppliers can schedule preventive maintenance and supplies appropriately. Finally, such
passive monitoring systems also provide a plethora of information about which features of the
product the customer uses heavily.
Many firms do not have the in-house expertise to leverage the data they collect.
Fortunately, many companies produce e-commerce suites and e-Customer Relationship
Management (eCRM) systems that help them to reap the benefits of these techniques. Some of
these companies are ATG, BEA, Blue Martini, Broadbase, Broadvision, eHNC, Harte-Hanks,
Manna, MarketSwitch, Microsoft, Oracle, Siebel, and Xchange (Mena 2001).
Today’s technology appliances are loaded with features, and disentangling their value is
critical for developing the next generation of the products. Along with such well-known market-
research methods as conjoint analysis, inferences drawn from usage patterns might provide
valuable information about customer needs. The opportunity for passive monitoring and
maintenance is enormous. United Technology has proposed real-time wireless information
gathering and engine monitoring to various airlines. Using intelligent inference engines, the firm
aims to schedule maintenance dynamically. It also plans to leverage the information it collects to
forecast requirements for parts and labor.
Passive learning is not limited to making inferences about customers. The Web provides
a wealth of information about competing firms. By leveraging information found through the
customized intelligent searches offered by such companies as WhizBang Labs!
(www.whizbang.com), firms can develop the ability to monitor the changing prices of
29
competitors’ products. In fact, computer programs that systematically search the web (crawlers)
can alert managers and sales people to competitors’ price changes in real time and to content
changes such as announcements of new products or services or of promotions.
Individualized marketing makes new demands on managers and on accounting. In the
past, marketers thought in aggregate terms over a few quarters. However, this is no longer
efficient, because marketers can now track customers’ responses by the individual over long
periods. Marketers should focus on analyzing the lifetime value of consumers direct marketing
firms do (Mulhern 1999). Managers need to track and compute the cost of acquiring each
consumer and then relate this cost to the profits the customer produces over his or her lifetime.
Given that it is much more expensive for a firm to acquire a new customer than to keep an
existing one, long-term analysis can help it to increase profits.
30
References
Berry, Michael J. A. and Gordon S. Linoff. 1997. Data Mining Techniques: For Marketing,Sales, and Customer Support. New York: John Wiley & Sons.
Blattberg, R. and J. Deighton. 1991. Interactive marketing: Exploiting the age of addressability.Sloan Management Review 33 (1): 5-14.
Dreze, Xavier and Fred Zufryden. 1997. Testing Web site design and promotional content.Journal of Advertising Research 37 (2): 77-91.
Haeckel, Stephan H. 1998. About the nature and future of interactive marketing. Journal ofInteractive Marketing 12 (1): 63-71.
MacQueen, J. B. 1967. Some methods for classification and analysis of multivariateobservations. Proceedings of the Fifth Berkeley Symposium on Mathematical Statistics andProbability. Berkeley, California: University of California Press. Vol. 1, pp. 281-297.
Mena, Jesus. 2001. Web Mining for Profit: Beyond Personalization. Woburn, Massachusetts:Butterworth-Heinemann.
Montgomery, Alan L. 2001. Applying quantitative marketing techniques to the Internet.Interfaces 32 (2): 90-108.
Montgomery, Alan L., Kartik Hosanagar, Ramayya Krishnan, and Karen B. Clay. 2001.Designing a better shopbot. Working paper, Graduate School of Industrial Administration,Carnegie Mellon University.
Mulhern, Francis J. 1999. Customer profitability analysis: Measurement, concentration, andresearch directions. Journal of Interactive Marketing 13 (1): 25-40.
Peppers, Don, Martha Rogers, and Bob Dorf. 1999. Is your company ready for one-to-onemarketing. Harvard Business Review, 77 (1): 151-162.
Rossi, Peter E., Rober E. McCulloch, and Greg M. Allenby. 1996. The value of purchasehistory data in target marketing. Marketing Science 15 (4): 321-340.
Shardanand, Upendra and Pattie Maes. 1995. Social information filtering: Algorithms forautomating Word of Mouth. Proceedings of the CHI-95 Conference. Denver, Colorado: ACMPress.
Shapiro, Carl and Hal R. Varian. 1998. Information Rules: A Strategic Guide to the NetworkEconomy. Cambridge, Massachusetts: Harvard Business School Press.

31
Smith, Jeff H. 2001. Information privacy and marketing: What the U.S. should (and shouldn’t)learn from Europe. Harvard Business Review 43 (2): 8-31.
Ungar, Lyle H. and Dean P. Foster. 1998. Clustering methods for collaborative filtering.Working paper, University of Pennsylvania.

32
Biography for Alan L. Montgomery
Alan L. Montgomery is an associate professor of marketing at the Graduate School of
Industrial Administration, Carnegie Mellon University. His fields of interest include electronic
commerce, micro-marketing, pricing, and data mining. Some current research projects include
the design of shopbots, customization of pricing strategies to micro-markets, automated
approaches to the analysis of marketing data, new methodologies for estimating consumer price
sensitivity, using radio airplay to forecast album sales, and forecasting time series using non-
linear models. Dr. Montgomery's research on electronic commerce has focused on how to
extract value from a Web user's session history. Specifically he has modeled browsing behavior
across web sites and through time, and is currently working on predicting purchase behavior
using clickstream data. An important finding to date shows that previous usage history is the
best predictor of current behavior. Dr. Montgomery's research has appeared in a variety of
publications including Advances in Econometrics, IEEE Computer, Interfaces, Journal of
Marketing Research, Journal of the American Statistical Association, Marketing Science, Case
Studies in Bayesian Statistics, and Computational Statistics & Data Analysis. He holds Ph.D.
and M.B.A. degrees in Marketing and Statistics from the University of Chicago and a B.S.
degree in Economics from the University of Illinois at Chicago.
33
Biography for Kannan Srinivasan
Kannan Srinivasan is H.J. Heinz II Professor of Management, Marketing and
Information Systems at Carnegie Mellon University. Prior to earning his Ph.D. at the University
of California at Los Angeles, Kannan worked as a product manager at Procter & Gamble. His
recent research interests include dynamic Internet data analysis, dynamic pricing,
Marketing/Information Systems interface, Impact of Electronic Data Interchange, New Business
Models for E-Commerce. He has extensively published in leading journals. He was a member of
the steering committee that launched the first full-time Master of Science in Electronic
Commerce program, a joint initiative by the business and computer science schools at Carnegie
Mellon.
Kannan was nominated for the Leland Bach Teaching Award in 1991, 1993, 1995 and
1996. He has also taught at the graduate schools of business at The University of Chicago and
Stanford University. He has worked on numerous consulting projects and executive teaching
engagements with firms such as General Motors, Asea-Brown Boveri, Kodak, Chrysler, Fujitsu,
IBM, Calgon Carbon, Kraft Foods, IKEA, Management Science Associates, McKinsey &Co.,
Pricewaterhouse Coopers, and United Technologies. He actively works with Internet startups. He
serves on the board/ advisory board of these companies as well as advisory board of a venture
capital firm. He is the also Director of the Center for E-Business Innovation (eBI) at Carnegie
Mellon University. In collaboration with eBI, Pricewaterhouse Coopers has developed a
comprehensive tool (known as emm@) to assess the e-business maturity of firms.