Embed Size (px)
Citation preview

Coimisiún na Scrúduithe StáitState Examinations Commission
Leaving Certificate 2018
Marking Scheme
Accounting
Higher Level

Note to teachers and students on the use of published marking schemes
Marking schemes published by the State Examinations Commission are not intended to be
standalone documents. They are an essential resource for examiners who receive training
in the correct interpretation and application of the scheme. This training involves, among
other things, marking samples of student work and discussing the marks awarded, so as to
clarify the correct application of the scheme. The work of examiners is subsequently
monitored by Advising Examiners to ensure consistent and accurate application of the
marking scheme. This process is overseen by the Chief Examiner, usually assisted by a Chief
Advising Examiner. The Chief Examiner is the final authority regarding whether or not the
marking scheme has been correctly applied to any piece of candidate work.
Marking schemes are working documents. While a draft marking scheme is prepared in
advance of the examination, the scheme is not finalised until examiners have applied it to
candidates’ work and the feedback from all examiners has been collated and considered in
light of the full range of responses of candidates, the overall level of difficulty of the
examination and the need to maintain consistency in standards from year to year. This
published document contains the finalised scheme, as it was applied to all candidates’ work.
In the case of marking schemes that include model solutions or answers, it should be noted
that these are not intended to be exhaustive. Variations and alternatives may also be
acceptable. Examiners must consider all answers on their merits, and will have consulted
with their Advising Examiners when in doubt.
Future Marking Schemes
Assumptions about future marking schemes on the basis of past schemes should be
avoided. While the underlying assessment principles remain the same, the details of the
marking of a particular type of question may change in the context of the contribution of
that question to the overall examination in a given year. The Chief Examiner in any given
year has the responsibility to determine how best to ensure the fair and accurate
assessment of candidates’ work and to ensure consistency in the standard of the
assessment from year to year. Accordingly, aspects of the structure, detail and application
of the marking scheme for a particular examination are subject to change from one year to
the next without notice.

1
Accounting – Higher Level 2018 – Marking Scheme
Q.1 Manufacturing Account 75
Manufacturing Account of Austin Ltd for the year ended 31/12/2017 [1]
€ € €
Opening stock of raw materials 41,500 [1]
Purchases of raw materials (N1) 482,700 [3]
Less closing stock of raw materials (31,500) [1]
Cost of Raw Materials Consumed 492,700
Direct Costs:
Factory wages (N2) 178,200 [5]
Hire of special equipment 39,800 [2]
Royalty payments 26,900 [2] 244,900
Prime Cost 737,600
Factory Overheads:
General factory overheads (N3) 102,800 [6]
Depreciation – plant and machinery (N4) 41,000 [3]
Depreciation – buildings (N5) 14,937 [3]
Loss on sale of machine (N6) 4,500 [4] 163,237
Factory Cost 900,837
Add work in progress 01/01/2017 38,200 [2]
Less work in progress 31/12/2017 (40,200) [2]
898,837
Less sale of scrap materials (N7) (2,100) [4]
Cost of manufacture 896,737

2
Trading, Profit and Loss Account for the year ended 31/12/2017
€ € €
Sales (N8) 1,382,500 [4]
Less cost of sales
Opening stock ‐ finished goods 43,100 [2]
Cost of manufacture 896,737 [2]
Less closing stock ‐ finished goods (N9) (82,100) [3] (857,737)
Gross profit 524,763
Less Expenses
Administration
Administration expenses 59,200 [1]
Depreciation – buildings (N5) 4,979 [2] 64,179
Selling and Distribution
Provision for bad debts (N10) 2,760 [3]
Selling expenses 45,000 [1] 47,760 (111,939)
412,824
Add Operating Income
Discount (N11) 7,400 [3]
Bad debt recovered 2,500 [1]
Rent (N12) 12,000 [4] 21,900
Operating profit 434,724
Investment income (N13) 11,000 [3]
445,724
Less debenture interest (N14) (23,000) [2]
Net profit 422,724
Less dividends paid (27,500) [1]
Retained profit 395,224
Profit and loss balance 01/01/2017 38,000 [2]
Profit and loss balance 31/12/2017 433,224 [2]

3
45
Balance Sheet of Austin Ltd as at 31/12/2017
Cost Acc. Depreciation NBV
Tangible Fixed Assets € € €
Factory buildings (N15) + (N16) 995,800 [2] 59,916 [1] 935,884
Plant and machinery (N17) + (N18) 400,000 [2] 193,500 [3] 206,500
1,395,800 253,416 1,142,384
Financial Investments
4 % Investments 330,000 [3]
1,472,384
Current Assets
Closing stock: finished goods (N9) 82,100 [3]
raw materials 31,500 [2]
work in progress 40,200 [2]
Debtors (N19) 46,000 [4]
Less provision for bad debts (N10) (2,760) [2] 43,240
Investment income due 11,000 [2]
208,040
Creditors: amounts falling due within 1 year
Creditors (N20) 61,400 [4]
Bank (N21) 39,600 [4]
Debenture interest due (N14) 23,000 [2]
PAYE, PRSI, USC 20,700 [2]
Wages due 2,500 [1] (147,200) 60,840
1,533,224
Financed by:
Creditors: amounts falling due after 1 year
8% Debentures 300,000 [2]
Authorised Issued
Ordinary shares @ €1 each 600,000 [1] 550,000 [1]
5% Preference shares @ €1 each 300,000 [1] 250,000 [1]
900,000 800,000
Profit and loss balance 433,224 1,233,224
Capital employed 1,533,224

4
1 Purchase of raw materials 514,200 – 31,500 482,700
2 Factory wages 200,000 – 24,300 + 2,500 178,200
3 Factory overheads 91,400 + 12,000 – 600 102,800
4 Depreciation – plant and machinery
400,000 @ 10% = 40,000 + 20,000 @ 10% × 6/12 = 1,000
41,000
5 Depreciation buildings – manufacturing
2% of 995,800 × 75% 14,937
5 Depreciation buildings – profit and loss
2% of 995,800 × 25% 4,979
6 Loss on sale of machine 20,000 – 12,500 – 3,000 4,500
7 Sale of scrap materials 5,100 – 3,000 2,100
8 Sales 1,400,000 – 17,500 1,382,500
9 Closing stock of finished goods 68,100 + 14,000 82,100
10 Provision for bad debts 46,000 @ 6% 2,760
11 Discount received 8,000 – 600 7,400
12 Rent 9,000 + 3,000 12,000
13 Investment income 4% of 330,000 × 10/12 11,000
14 Debenture interest 250,000 @ 8% = 20,000 + 50,000 @ 8% × 9/12 = 3,000
23,000
15 Factory building 940,000 + [31,500 + 24,300] 995,800
16 Acc. depreciation on buildings 40,000 + 19,916 59,916
17 Plant and machinery 420,000 – 20,000 400,000
18 Acc. depreciation plant and machinery
165,000 + 41,000 – 12,500 193,500
19 Debtors 62,000 – 17,500 + 1,500 46,000
20 Creditors 49,400 + 12,000 61,400
21 Bank (43,600) + 1,000 + 3,000 (39,600)
21 Bank (33,300) + (6,300) (39,600)
5
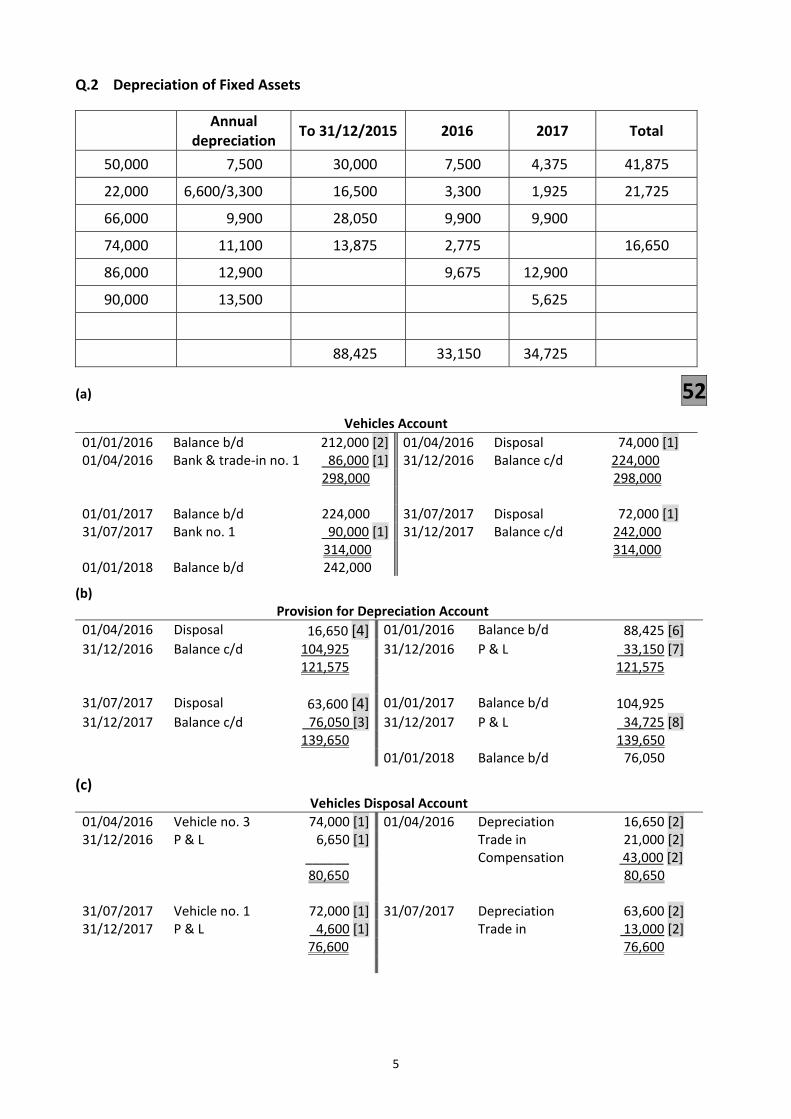
Q.2 Depreciation of Fixed Assets
Annual depreciation
To 31/12/2015 2016 2017 Total
50,000 7,500 30,000 7,500 4,375 41,875
22,000 6,600/3,300 16,500 3,300 1,925 21,725
66,000 9,900 28,050 9,900 9,900
74,000 11,100 13,875 2,775 16,650
86,000 12,900 9,675 12,900
90,000 13,500 5,625
88,425 33,150 34,725
(a) 52 Vehicles Account
01/01/2016 Balance b/d 212,000 [2] 01/04/2016 Disposal 74,000 [1] 01/04/2016 Bank & trade‐in no. 1 86,000 [1] 31/12/2016 Balance c/d 224,000 298,000 298,000 01/01/2017 Balance b/d 224,000 31/07/2017 Disposal 72,000 [1] 31/07/2017 Bank no. 1 90,000 [1] 31/12/2017 Balance c/d 242,000 314,000 314,000 01/01/2018 Balance b/d 242,000
(b) Provision for Depreciation Account
01/04/2016 Disposal 16,650 [4] 01/01/2016 Balance b/d 88,425 [6]
31/12/2016 Balance c/d 104,925 31/12/2016 P & L 33,150 [7] 121,575 121,575 31/07/2017 Disposal 63,600 [4] 01/01/2017 Balance b/d 104,925
31/12/2017 Balance c/d 76,050 [3] 31/12/2017 P & L 34,725 [8] 139,650 139,650 01/01/2018 Balance b/d 76,050
(c) Vehicles Disposal Account
01/04/2016 Vehicle no. 3 74,000 [1] 01/04/2016 Depreciation 16,650 [2] 31/12/2016 P & L 6,650 [1] Trade in 21,000 [2] ______ Compensation 43,000 [2] 80,650 80,650 31/07/2017 Vehicle no. 1 72,000 [1] 31/07/2017 Depreciation 63,600 [2] 31/12/2017 P & L 4,600 [1] Trade in 13,000 [2] 76,600 76,600

6
(d) 8
(i) Deprecation is the measure of loss in value of a fixed asset over its useful economic life
as a result of wear and tear, passage of time, obsolescence and extraction. The
amount allocated in each accounting period is treated as an expense to be set against
revenue in the calculation of profit. Depreciation is an example of the matching
concept in practice. The value of the asset is used up in the business (its depreciable
amount) is matched to those accounting periods that are expected to benefit from it.
(ii) The straight line method is where the same amount of the cost of the asset is written
off each year. It is appropriate in the case of an asset that remains in the business over
a long period of time and loses value slowly, for example assets such as buildings that
generate profit over many years.
The straight‐line method involves spreading the depreciable amount evenly over the
estimated useful life of the asset. Using this method, the depreciation is the same
figure each year, which suggests that the asset is being used up at an even rate.
The reducing balance applies a constant percentage to the gradually carrying amount
balance so that the amount of depreciation expense diminishes over the useful life of
the asset. The amount written off is high in early years and reduces each year until
written off. This method is appropriate in the case of an asset which loses most of its
value in the years immediately after purchase e.g. vehicles, computer, equipment etc.,
(assets that become obsolete quickly because of changes in technology).
It should be noted that relatively few businesses use the reducing balance method
and, where it is used, the percentage figure is often an approximation.

7
Q.3 Incomplete Records 52
(a)
Trading profit and loss account for year ended 31/12/2017
€ € €
Sales (N1) 312,840 [9]
Less cost of sales
Opening stock 22,600 [2]
Purchases (N2) 112,160 [7]
134,760
Less closing stock (24,200) [2] (110,560)
Gross profit 202,280
Less Expenses
General expenses (N3) 42,400 [4]
Light and heat (N4) 10,240 [5]
Insurance (N5) 19,500 [5]
Interest (N6) 2,700 [5]
Rent (N7) 10,000 [4]
Standing order 2,000 [2]
Depreciation on equipment (N8) 5,880 [2] (92,720)
109,560
Add Operating Income
Interest on fund 900 [2]
Net profit 110,460 [3]

8
Workings
Sales (N1)
Credit 52,000 + 23,400 – 28,300 47,100
Cash 141,000 + 43,200 + 76,000 + 4,680 + 860 265,740 312,840
Purchases (N2)
Credit 47,000 + 18,200 – 25,400 39,800
Cash 76,000
Less drawings of stock (3,640) 112,160
Gen. expenses (N3) 43,200 – 800 42,400
Light and heat (N4) 11,500 + 1,300 – 2,560 10,240
Insurance (N5) 19,600 + 4,800 – 4,900 19,500
Interest (N6) 1,200 + 2,400 – 900 2,700
Rent (N7) 24,000 – 14,000 10,000
Dep. equip (N8) 42,000 × 14% 5,880
(b) 8
(i) If drawings are not treated correctly they may be entered in error as a business expense with the result that the profit figure will be reduced/understated. It is also essential to control/monitor how much is taken from the business in the form of drawings.
(ii) Importance of double entry bookkeeping for Walsh:
It provides a more accurate look at the financial position of a business than single entry bookkeeping due to the matching principle which uses accrual accounting rules to record revenue and expenses.
It reduces errors by providing checks and balances.
It reduces fraud because it allows transactions to be traced/audited.
It can be used in the preparation of financial statements.

9
Q.4 Service Firm 34
Income and Expenditure (Profit and Loss) Account of M. Noctor for the year ended 31/12/2017
Income € €
Profit on sale of equipment (N1) 1,200 [3]
Medical card scheme (N2) 71,600 [3]
Private patients (N3) 41,180 [2]
Investment income (N4) 4,900 [2]
118,880
Expenditure
Medical supplies (N5) 14,900 [5]
Cleaning expenses 3,200 [1]
Insurance (N6) 2,300 [3]
Sponsorship of local GAA prize 2,000 [1]
Light and heat (N7) 2,100 [2]
Telephone (N8) 5,915 [2]
Wages of receptionist 15,500 [1]
Locum doctor (N9) 4,800 [2]
Bank charges 120 [1]
Depreciation:
- Surgery 3,200 [1]
- Equipment (N10) 15,600 [2]
- Furniture 4,500 [1] (74,135)
Net profit 44,745 [2]
10
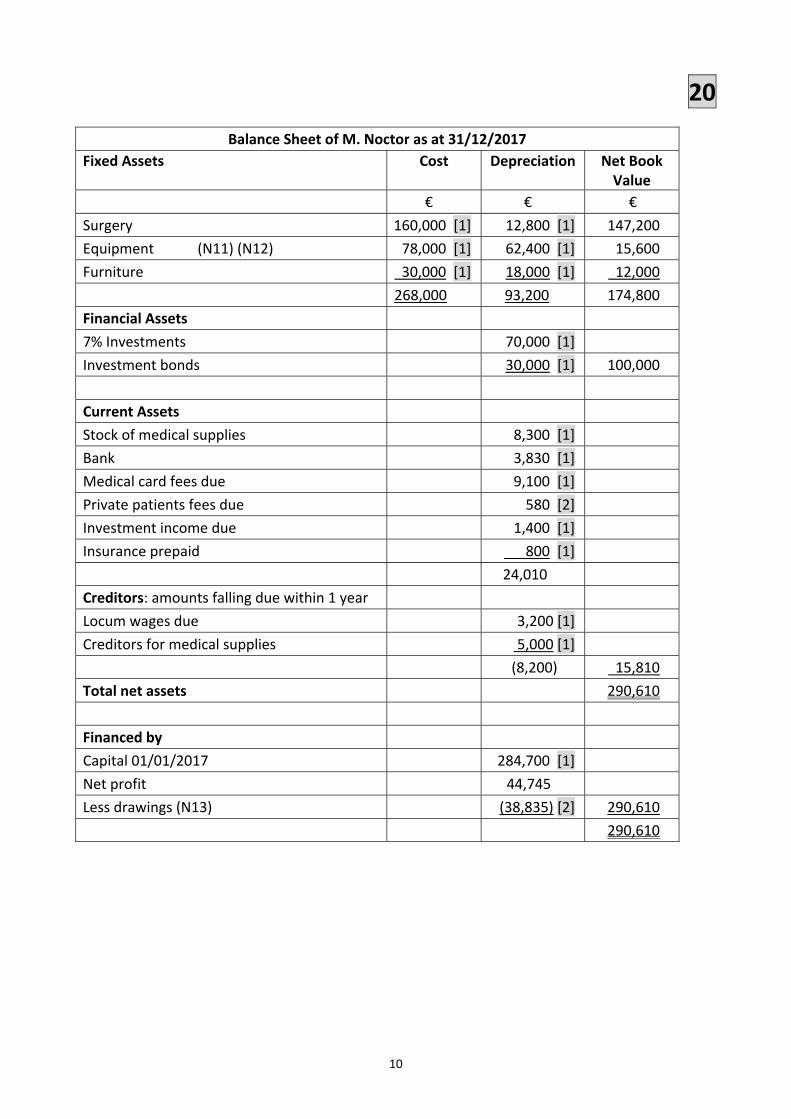
20
Balance Sheet of M. Noctor as at 31/12/2017
Fixed Assets Cost Depreciation Net Book Value
€ € €
Surgery 160,000 [1] 12,800 [1] 147,200
Equipment (N11) (N12) 78,000 [1] 62,400 [1] 15,600
Furniture 30,000 [1] 18,000 [1] 12,000
268,000 93,200 174,800
Financial Assets
7% Investments 70,000 [1]
Investment bonds 30,000 [1] 100,000
Current Assets
Stock of medical supplies 8,300 [1]
Bank 3,830 [1]
Medical card fees due 9,100 [1]
Private patients fees due 580 [2]
Investment income due 1,400 [1]
Insurance prepaid 800 [1]
24,010
Creditors: amounts falling due within 1 year
Locum wages due 3,200 [1]
Creditors for medical supplies 5,000 [1]
(8,200) 15,810
Total net assets 290,610
Financed by
Capital 01/01/2017 284,700 [1]
Net profit 44,745
Less drawings (N13) (38,835) [2] 290,610
290,610
11
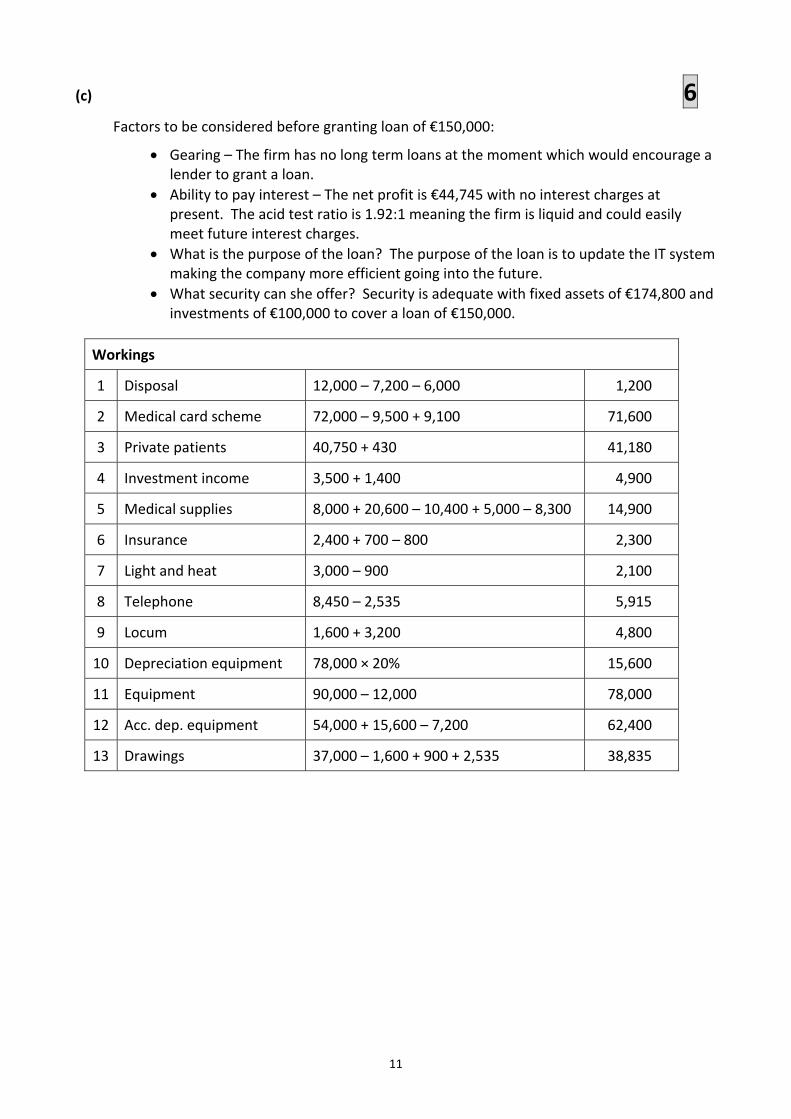
(c) 6 Factors to be considered before granting loan of €150,000:
Gearing – The firm has no long term loans at the moment which would encourage a lender to grant a loan.
Ability to pay interest – The net profit is €44,745 with no interest charges at present. The acid test ratio is 1.92:1 meaning the firm is liquid and could easily meet future interest charges.
What is the purpose of the loan? The purpose of the loan is to update the IT system making the company more efficient going into the future.
What security can she offer? Security is adequate with fixed assets of €174,800 and investments of €100,000 to cover a loan of €150,000.
Workings
1 Disposal 12,000 – 7,200 – 6,000 1,200
2 Medical card scheme 72,000 – 9,500 + 9,100 71,600
3 Private patients 40,750 + 430 41,180
4 Investment income 3,500 + 1,400 4,900
5 Medical supplies 8,000 + 20,600 – 10,400 + 5,000 – 8,300 14,900
6 Insurance 2,400 + 700 – 800 2,300
7 Light and heat 3,000 – 900 2,100
8 Telephone 8,450 – 2,535 5,915
9 Locum 1,600 + 3,200 4,800
10 Depreciation equipment 78,000 × 20% 15,600
11 Equipment 90,000 – 12,000 78,000
12 Acc. dep. equipment 54,000 + 15,600 – 7,200 62,400
13 Drawings 37,000 – 1,600 + 900 + 2,535 38,835

12
Q.5 Interpretation of Accounts 50
(a)
(i) Cash purchases if the period of credit received from trade creditors is 2½ months
Creditors × 12 = 2½ months Credit purchases
80,000 × 12 = 2½ 960,000 = 2½x x = 384,000
X
Total purchases = cost of sales + closing stock – opening stock 560,000 + 90,000 – 60,000 = 590,000 Cash purchases = total purchases – credit purchases 590,000 – 384,000 = €206,000 [12]
(ii) Dividend yield = dividend per share × 100 = x%
market value
DPS = ordinary dividend × 100 = 29,000 × 100 = 8.29 cent market value 350,000
Dividend yield = dividend per share × 100 = 8.29 × 100 = 6.14% [10] market value 135 (iii)
Price earnings ratio = market value = x years earnings per share
Earnings per share = net profit – preference dividend × 100 = x cent no. of issued ordinary shares
EPS = 82,000 – 16,000 = 66,000 × 100 = 18.86 cent 350,000 350,000
P/E Ratio = market value 135 = 7.16 years [10] earnings per share 18.86 (iv)
Return on capital employed = net profit + interest × 100 = x% capital employed
82,000 + 18,000 × 100 = 10.75% [9] 930,000

13
(v) Interest cover = net profit + interest
interest
82,000 + 18,000 = 5.56 times [9] 18,000
(b) 40
The debenture holders would not be satisfied with the performance, state of affairs and prospects of the company for the following reasons: [4] Performance Profitability [7] The company is profitable earning a return on capital employed in 2017 of 10.75% which is well above the return from risk‐free investments of 2% and the cost of borrowing of 6%. Profitability, however, has disimproved (negative trend) by 1.65% compared to 2016 when the return was 12.4%. Born2Run plc is definitely making less efficient use of its resources this year and the debenture holders would not be pleased with the dip in performance in 2017. The earnings per share has fallen from 20 cent in 2016 to 18.86 cent in 2017. This is also a negative trend and cause for concern. Dividend Policy [4] The dividend cover is 2.28 times and this is an improvement on last year’s dividend cover of 1.3 times (2 times). Debenture holders would be happy that Born2Run plc is retaining more of its profits for expansion and future repayments of loans. The percentage of the profits distributed to shareholders is 43.96% which is an improvement on the 50% distributed in 2016.
If there is any evidence that candidates’ dividend cover figure has been affected by the incorrect dividend cover figure in 2016 accept candidates own figure for dividend cover.
State of Affairs
Liquidity [7] Born2Run plc has liquidity problems with an acid test ratio of 0.88:1, for every €1 of short‐term debt the firm has only 88 cent in liquid assets. This is also a disimproving trend compared to 2016 when the acid test ratio was 1.3:1. The worsening of the ratio is a major cause of concern to debenture holders because the company may have difficulty paying future interest. If this trend continues, the ability to pay interest would come under pressure and funds would not be available to invest for the purpose of repaying the loan.

14
Gearing [7] Born2Run plc is highly geared with a debt to capital employed of 53.76% and a debt to equity ratio of 116.28%. The company’s long‐term finance is sourced more by long‐term debt than by equity which means it is a higher risk and will have high interest payments. The gearing position has worsened from 2016 when it was lowly geared with a gearing percentage of 41%. Born2Run are now more dependent on outside borrowing. Interest cover has worsened from 6.3 times in 2016 to 5.5 times in 2017. The company is still well able to meet its interest commitments, but the worsening trend combined with poor liquidity would concern debenture holders.
Security [6] Fixed assets are valued at €650,000. Debenture holders would like to know does this reflect their true value and has depreciation been accounted for. However, as the debentures are €300,000, it would appear that there is more than adequate security to cover the loans. Born2Runplc also has investments which cost €200,000 but the debenture holders would be disappointed at the fact that the investments now have a market value of €150,000. This would indicate poor investment decisions by management.
Prospects
Sector [5] Short‐term prospects are not that encouraging due to the fact that the company operates as a retailer in the sportswear industry, which is highly competitive, with leading brands dominating the industry. Long‐term prospects are better with rising incomes and a greater emphasis on keeping fit and buying new sportswear, on a regular basis. However to protect itself from the intense competition in the industry, Born2Run would need to spend large amounts of money on brand proliferation and advertising but considering their current liquidity situation, this may prove difficult.
(c) 10
Period of credit allowed to debtors
The length of time it takes a debtor to settle their account has improved by 20 days (from 60 days to 40 days). This is a good trend. The liquidity position of the business is improving as it is collecting debts more efficiently/quickly. However, while its liquidity position has improved, the collection period from debtors is longer than the average credit period of 34 days received from creditors.
Period of credit received from creditors
The length of time the business has to settle accounts with suppliers has improved by 14 days. (It has increased from 20 – 34 days.) This is improving the liquidity position as it is taking longer to settle its accounts with suppliers. However, the business may lose out on discounts for prompt payment which may have a negative effect on its liquidity.
Stock Turnover
Stock turnover has worsened. It has fallen from 12 times to 6 times. This is a negative trend. The liquidity position of the business has worsened as it is taking much longer to sell stock. This may mean it may have too much money tied up in stock, when it could have been used for other purposes. If the decrease in stock turnover is as a result of decreasing sales, this will also have a negative effect on liquidity as it will have less revenue. I would not recommend that Born2Run plc should invest in this business.

15
Q.6 Published Accounts 40
Published Profit and Loss Account of Capital plc for year ended 31/12/2017
€ €
Turnover 1,780,000 [2]
Cost of sales (1,188,600) [5]
Gross profit 591,400
Distribution costs (197,880) [5]
Administration expenses (267,120) [6]
Other operating income 82,000 [3]
Operating profit 208,400
Exceptional item/profit from sale of land 87,000 [2]
Income from financial investments 13,500 [3]
Interest payable (21,000) [3]
Profit on ordinary activities before taxation [1] 287,900
Tax on profit on ordinary activities (49,000) [2]
Profit on ordinary activities after taxation 238,900
Dividends paid (55,000) [2]
Retained profit 183,900
Profit and loss balance 01/01/2017 (42,500) [3]
Profit and loss balance 31/12/2017 141,400 [3]

16
26 Balance Sheet of Capital plc as at 31/12/2017
Fixed assets € € €
Intangible assets 35,000 [2]
Tangible assets 981,200 [2]
Financial assets 300,000 [1]
1,316,200
Current assets
Stock 86,000 [1]
Debtors 115,600 [3]
Bank 82,000 [1]
283,600
Creditors: amounts falling due within 1 year [1]
Trade creditors 108,000 [1]
Other creditors 60,700 [4]
Taxation 83,200 [2] (251,900)
Net current assets 31,700
Total assets less current liabilities 1,347,900
Creditors: amounts falling due after 1 year
7% Debentures 300,000 [2]
Capital and Reserves
Called up share capital 720,000 [2]
Revaluation reserve 186,500 [3]
Profit and loss balance 141,400 [1] 1,047,900
1,347,900

17
Workings
1 Turnover 1,800,300 – 20,300 1,780,000
2 Cost of sales 91,000 + 1,170,000 + 6,600 – 86,000 + 7,000 1,188,600
3 Distribution costs 144,000 + 6,080 + 32,800 + 15,000 197,880
4 Administration expenses 205,000 + 9,120 + 16,000 + 32,000 + 5,000 267,120
5 Other operating income 39,000 + 15,000 + 28,000 82,000
6 Investment income 8,400 + 5,100 13,500
7 Interest payable 13,300 + 7,700 21,000
8 Intangible assets 42,000 – 7,000 35,000
9 Debtors 139,000 – 28,500 + 5,100 115,600
10 Other creditors 16,000 + 32,000 + 5,000 + 7,700 60,700
11 Revaluation reserve 90,000 + 96,500 186,500
Notes to the Accounts 24 1. Accounting Policy Notes
Tangible Fixed Assets [6]
Buildings were revalued at the end of this year and have been included in the accounts at their revalued amount. Depreciation is calculated in order to write off the value or cost of tangible fixed assets over their estimated useful economic life, as follows:
Buildings 2% per annum straight line basis Delivery vans 20% per annum reducing balance basis
Stocks are valued on a first in first out basis at the lower of cost or net realisable value.
2. Operating Profit [5]
The operating profit is arrived at after charging:
Depreciation on tangible fixed assets €48,000 Patent amortised €7,000 Directors’ fees €22,000 Auditors’ fees €16,000 Legal fees €5,000
3. Dividends [4]
Ordinary Dividend Paid 7.57 cent per share €45,400 Preference Dividends Paid 8 cent per share €9,600
18
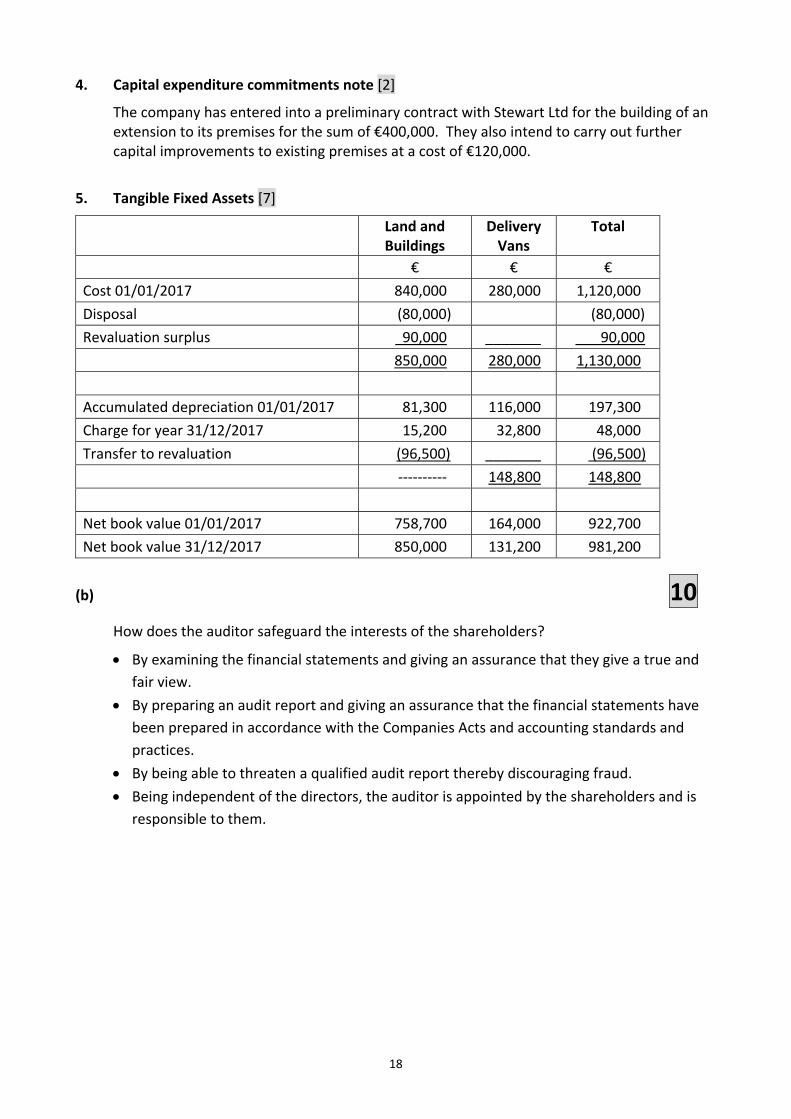
4. Capital expenditure commitments note [2]
The company has entered into a preliminary contract with Stewart Ltd for the building of an extension to its premises for the sum of €400,000. They also intend to carry out further capital improvements to existing premises at a cost of €120,000.
5. Tangible Fixed Assets [7]
Land and Buildings
Delivery Vans
Total
€ € €
Cost 01/01/2017 840,000 280,000 1,120,000
Disposal (80,000) (80,000)
Revaluation surplus 90,000 _______ 90,000
850,000 280,000 1,130,000
Accumulated depreciation 01/01/2017 81,300 116,000 197,300
Charge for year 31/12/2017 15,200 32,800 48,000
Transfer to revaluation (96,500) _______ (96,500)
‐‐‐‐‐‐‐‐‐‐ 148,800 148,800
Net book value 01/01/2017 758,700 164,000 922,700
Net book value 31/12/2017 850,000 131,200 981,200
(b) 10
How does the auditor safeguard the interests of the shareholders?
By examining the financial statements and giving an assurance that they give a true and
fair view.
By preparing an audit report and giving an assurance that the financial statements have
been prepared in accordance with the Companies Acts and accounting standards and
practices.
By being able to threaten a qualified audit report thereby discouraging fraud.
Being independent of the directors, the auditor is appointed by the shareholders and is
responsible to them.
19
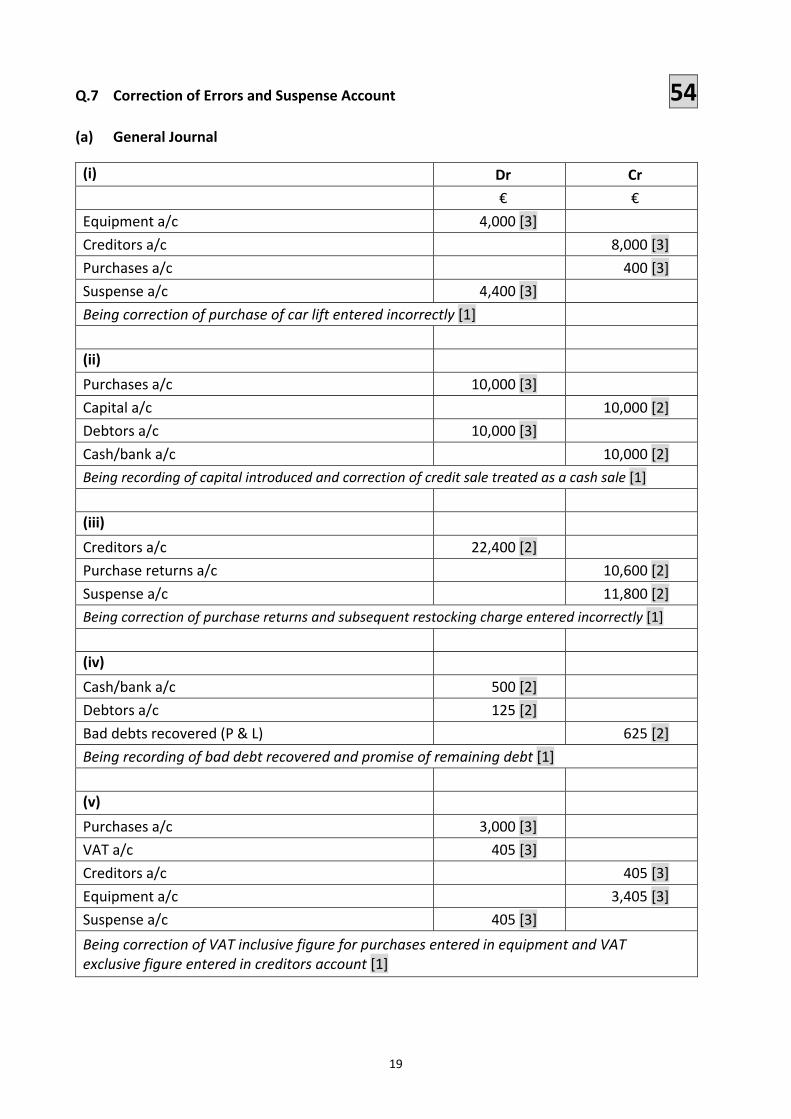
Q.7 Correction of Errors and Suspense Account 54
(a) General Journal
(i) Dr Cr
€ €
Equipment a/c 4,000 [3]
Creditors a/c 8,000 [3]
Purchases a/c 400 [3]
Suspense a/c 4,400 [3]
Being correction of purchase of car lift entered incorrectly [1]
(ii)
Purchases a/c 10,000 [3]
Capital a/c 10,000 [2]
Debtors a/c 10,000 [3]
Cash/bank a/c 10,000 [2]
Being recording of capital introduced and correction of credit sale treated as a cash sale [1]
(iii)
Creditors a/c 22,400 [2]
Purchase returns a/c 10,600 [2]
Suspense a/c 11,800 [2]
Being correction of purchase returns and subsequent restocking charge entered incorrectly [1]
(iv)
Cash/bank a/c 500 [2]
Debtors a/c 125 [2]
Bad debts recovered (P & L) 625 [2]
Being recording of bad debt recovered and promise of remaining debt [1]
(v)
Purchases a/c 3,000 [3]
VAT a/c 405 [3]
Creditors a/c 405 [3]
Equipment a/c 3,405 [3]
Suspense a/c 405 [3]
Being correction of VAT inclusive figure for purchases entered in equipment and VAT exclusive figure entered in creditors account [1]

20
(b) Corrected Suspense Account 6
Suspense a/c
Original Difference 6,995 (iii) Creditors/purchase returns [2] 11,800
(i) Purchases/creditors 4,400 [2]
(v) Equipment/creditors 405 [2] ______
11,800 11,800
(c) Statement of Corrected Net Profit 14
€ €
Original net profit 40,000
Add:
(i) Purchases 400 [2]
(iii) Purchase returns 10,600 [2]
(iv) P & L (bad debt recovered) 625 [2] 11,625
Less:
(ii) Purchases 10,000 [2]
(v) Purchases 3,000 [2] (13,000)
Corrected net profit 38,625 [4]
21
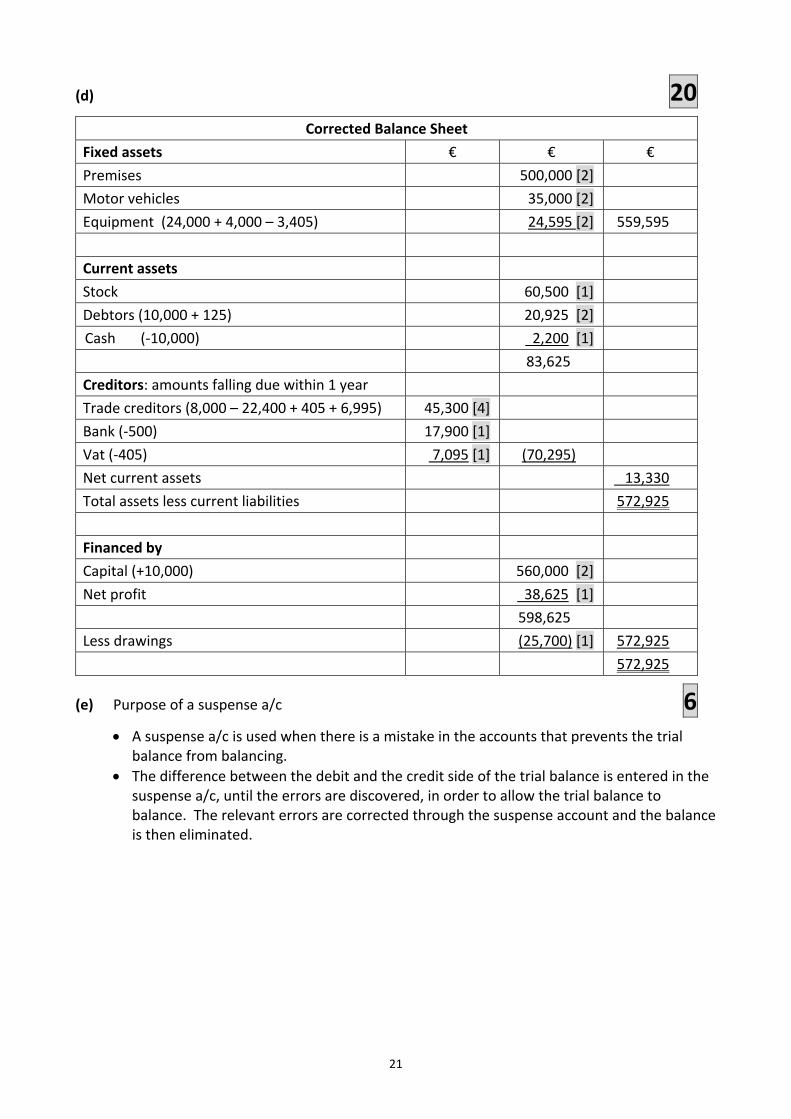
(d) 20 Corrected Balance Sheet
Fixed assets € € €
Premises 500,000 [2]
Motor vehicles 35,000 [2]
Equipment (24,000 + 4,000 – 3,405) 24,595 [2] 559,595
Current assets
Stock 60,500 [1]
Debtors (10,000 + 125) 20,925 [2]
Cash (‐10,000) 2,200 [1]
83,625
Creditors: amounts falling due within 1 year
Trade creditors (8,000 – 22,400 + 405 + 6,995) 45,300 [4]
Bank (‐500) 17,900 [1]
Vat (‐405) 7,095 [1] (70,295)
Net current assets 13,330
Total assets less current liabilities 572,925
Financed by
Capital (+10,000) 560,000 [2]
Net profit 38,625 [1]
598,625
Less drawings (25,700) [1] 572,925
572,925
(e) Purpose of a suspense a/c 6
A suspense a/c is used when there is a mistake in the accounts that prevents the trial balance from balancing.
The difference between the debit and the credit side of the trial balance is entered in the suspense a/c, until the errors are discovered, in order to allow the trial balance to balance. The relevant errors are corrected through the suspense account and the balance is then eliminated.
22
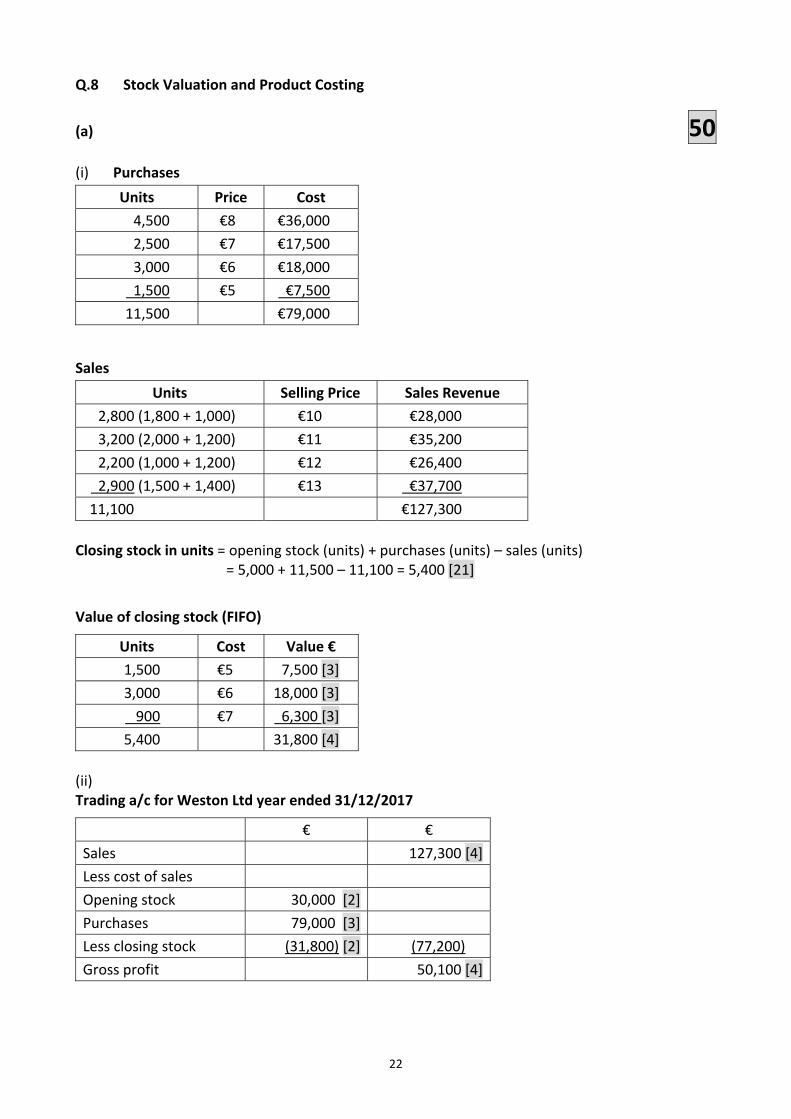
Q.8 Stock Valuation and Product Costing
(a) 50
(i) Purchases
Units Price Cost
4,500 €8 €36,000
2,500 €7 €17,500
3,000 €6 €18,000
1,500 €5 €7,500
11,500 €79,000
Sales
Units Selling Price Sales Revenue
2,800 (1,800 + 1,000) €10 €28,000
3,200 (2,000 + 1,200) €11 €35,200
2,200 (1,000 + 1,200) €12 €26,400
2,900 (1,500 + 1,400) €13 €37,700
11,100 €127,300
Closing stock in units = opening stock (units) + purchases (units) – sales (units)
= 5,000 + 11,500 – 11,100 = 5,400 [21]
Value of closing stock (FIFO)
Units Cost Value €
1,500 €5 7,500 [3]
3,000 €6 18,000 [3]
900 €7 6,300 [3]
5,400 31,800 [4]
(ii) Trading a/c for Weston Ltd year ended 31/12/2017
€ €
Sales 127,300 [4]
Less cost of sales
Opening stock 30,000 [2]
Purchases 79,000 [3]
Less closing stock (31,800) [2] (77,200)
Gross profit 50,100 [4]

23
(iii) Prudence concept and valuation of stock [1]
The prudence concept states caution should be exercised when preparing financial
statements. Therefore, only realised profits should be included in the accounts.
However, provision should be made for all expected expenses and losses. The
prudence concept ensures that profits are not overstated and losses not understated.
If closing stock was overvalued then profits would be overstated. Therefore stocks
should be valued at the lower of cost or net realisable value.
(b) Product Costing 30
(i) Budgeted Overheads
Department A
Variable Fixed
€ €
Budgeted Overhead Costs 20,000 22,000
Budgeted Hours 500 500
Overhead Absorption Rates €40 per LH [1] €44 per LH [1]
Department B
Variable Fixed
€ €
Budgeted Overhead Costs 18,000 23,000
Budgeted Hours 1,000 1,000
Overhead Absorption Rates €18 per LH [1] €23 per LH [1]
Department C
Variable Fixed
€ €
Budgeted Overhead Costs 21,000 42,000
Budgeted Hours 1,400 1,400
Overhead Absorption Rates €15 per LH [1] €30 per LH [1]
24
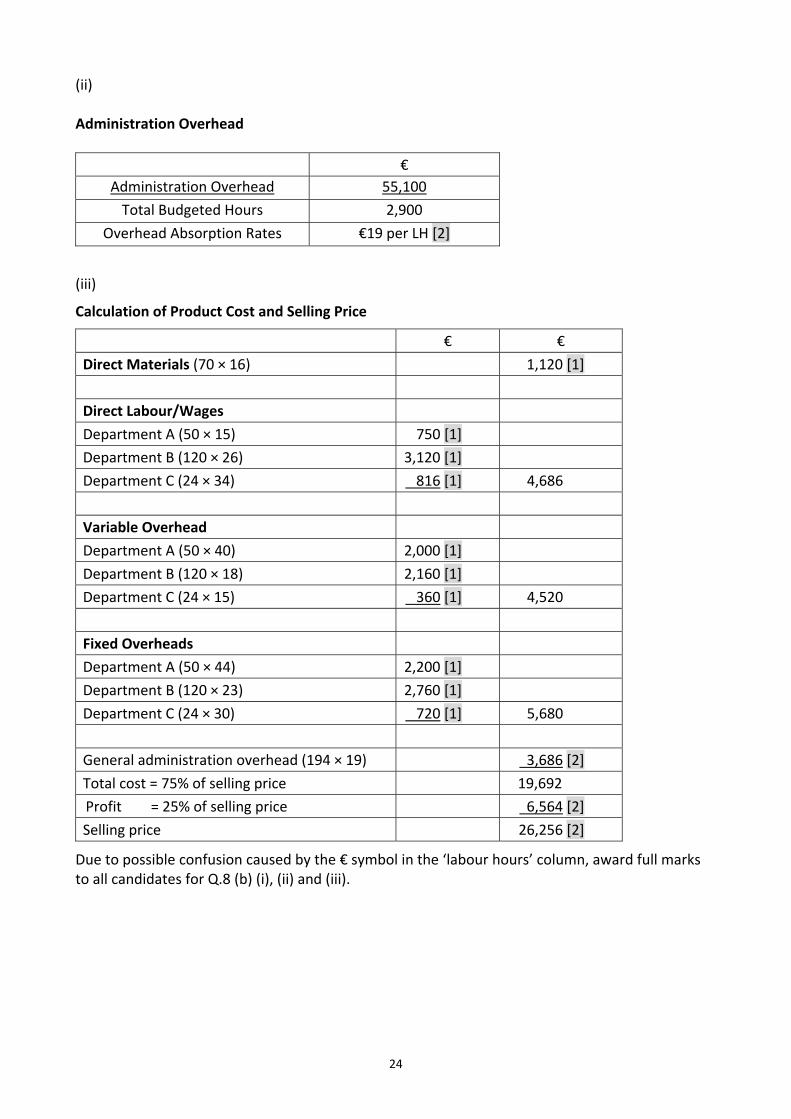
(ii) Administration Overhead
€
Administration Overhead 55,100
Total Budgeted Hours 2,900
Overhead Absorption Rates €19 per LH [2]
(iii)
Calculation of Product Cost and Selling Price
€ €
Direct Materials (70 × 16) 1,120 [1]
Direct Labour/Wages
Department A (50 × 15) 750 [1]
Department B (120 × 26) 3,120 [1]
Department C (24 × 34) 816 [1] 4,686
Variable Overhead
Department A (50 × 40) 2,000 [1]
Department B (120 × 18) 2,160 [1]
Department C (24 × 15) 360 [1] 4,520
Fixed Overheads
Department A (50 × 44) 2,200 [1]
Department B (120 × 23) 2,760 [1]
Department C (24 × 30) 720 [1] 5,680
General administration overhead (194 × 19) 3,686 [2]
Total cost = 75% of selling price 19,692
Profit = 25% of selling price 6,564 [2]
Selling price 26,256 [2]
Due to possible confusion caused by the € symbol in the ‘labour hours’ column, award full marks to all candidates for Q.8 (b) (i), (ii) and (iii).
25
(iv) Role of the Management Accountant 6 The management accountant is a key member of an organisation’s management team who makes a vital contribution to the managerial functions of planning, controlling and decision making.
The management accountant is responsible for:
1. Preparing data/gathering information required for formulating plans. 2. Recording costs and providing details of the cost of products and departments. 3. Participation in the creation and executing of budgets. 4. Assisting in the control of operations by comparing actual costs with budgeted
costs. 5. Providing data for decisions that require managers to select between alternative
courses of action. 6. Ensuring that relevant data is provided to managers on a timely basis and that the
data is readily understandable. 7. The valuation of closing stock which is then used in the preparation of financial
statements.

26
Q.9 Flexible Budgeting
(a) (i) 43 Production overheads Units Total Cost
€ €
High 36,000 186,600
Low 24,000 134,400
Difference 12,000 52,200
The variable cost of 12,000 units is 52,200 therefore the variable cost per unit is €4.35 [7]
Total production overhead cost 132,400 158,500 184,600
Less variable costs [units × €4.35] (104,400) (130,500) (156,600)
Therefore, fixed cost 28,000 28,000 28,000 [7]
(ii)
Other overheads Units Total Cost
€ €
High 36,000 250,800
Low 24,000 169,200
Difference 12,000 81,600
The variable cost of 12,000 units is 81,600 therefore the variable cost per unit is €6.80 [7]
Total production overhead cost 169,200 210,000 250,800
Less variable costs [units × €6.80] (163,200) (204,000) (244,800)
Therefore, fixed cost 6,000 6,000 6,000 [7]

27
(iii)
Flexible Budget 95 % Activity Level in Marginal Costing format
€ €
Sales 1,083,500 [2]
Less: variable costs
Direct materials [38,000 × 4.50] 171,000 [1]
Direct labour [38,000 × 5.20] 197,600 [1]
Production overheads [38,000 × 4.35] 165,300 [1]
Other overhead costs [38,000 × 6.80] 258,400 [1] (792,300)
Contribution 291,200 [2]
Less: fixed costs
Production overheads 28,000 [1]
Other overheads 6,000 [1]
Administration 40,500 [1] (74,500)
Profit 216,700 [4]
28
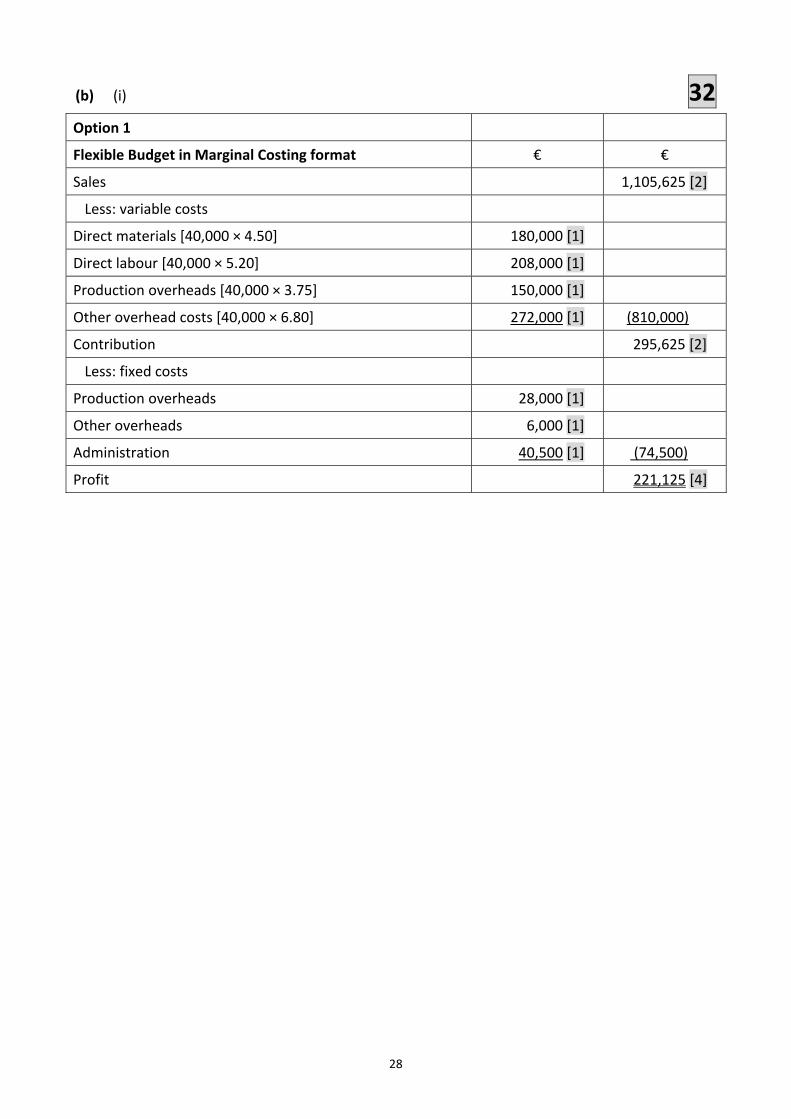
(b) (i) 32
Option 1
Flexible Budget in Marginal Costing format € €
Sales 1,105,625 [2]
Less: variable costs
Direct materials [40,000 × 4.50] 180,000 [1]
Direct labour [40,000 × 5.20] 208,000 [1]
Production overheads [40,000 × 3.75] 150,000 [1]
Other overhead costs [40,000 × 6.80] 272,000 [1] (810,000)
Contribution 295,625 [2]
Less: fixed costs
Production overheads 28,000 [1]
Other overheads 6,000 [1]
Administration 40,500 [1] (74,500)
Profit 221,125 [4]
29
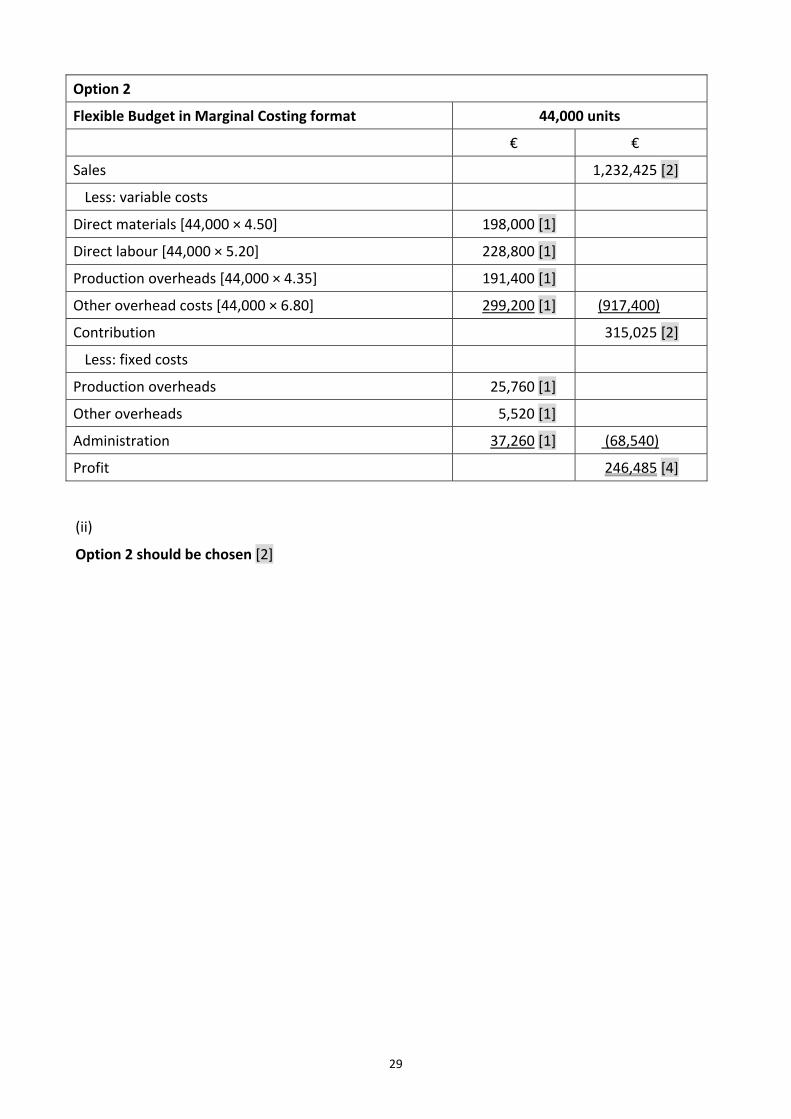
Option 2
Flexible Budget in Marginal Costing format 44,000 units
€ €
Sales 1,232,425 [2]
Less: variable costs
Direct materials [44,000 × 4.50] 198,000 [1]
Direct labour [44,000 × 5.20] 228,800 [1]
Production overheads [44,000 × 4.35] 191,400 [1]
Other overhead costs [44,000 × 6.80] 299,200 [1] (917,400)
Contribution 315,025 [2]
Less: fixed costs
Production overheads 25,760 [1]
Other overheads 5,520 [1]
Administration 37,260 [1] (68,540)
Profit 246,485 [4]
(ii)
Option 2 should be chosen [2]

30
(c) 5 (i) Distinguish between contribution and profit
Contribution is sales revenue less variable costs. This goes towards paying off the fixed
costs. Once the fixed costs are paid off, any further contribution goes towards profit.
Profit is sales revenue less total costs (fixed and variable).
(ii) Outline why Conlon Ltd would prepare a flexible budget.
1. To show management the cost levels at different levels of production.
2. To compare actual costs and budgeted costs at the same level of activity.
3. To compare budgeted costs and actual costs in order to identify variances. This allows corrective action to be taken.
4. To help in controlling costs or planning production levels. It is misleading to compare the budgeted costs at one level of activity with the actual costs at a different level of activity.

Blank Page
Blank Page

Blank Page