Embed Size (px)
DESCRIPTION
civil engineering
Citation preview

LECTURE 4
TRAFFIC COUNTS, VARIATIONS, PLANNING, ANALYSIS,
FORECASTING(ESTIMATION) AXLE LOAD DETERMINATION, SURVEY
PLANNING
TRAFFIC VOLUME
SURVEYS and AXLE
LOAD SURVEYS

Outline
Traffic Volume Surveys
– Traffic counts and classification – Types and Methods – Traffic Variations (Hourly, daily, weekly, Yearly) – Meaning of ADT or (A)ADT – Planning for a traffic count survey – Contracting for a traffic volume study – Analysis of results – Errors that can occur in data analysis
• In order to determine the total traffic on a road, the first step is to determine the current volume and type of traffic travelling on that particular road.
• If no data is available, traffic volume surveys have to be undertaken.
• Traffic in terms of size and weight is increasing rapidly in many countries.
• Highway engineers are concerned with designing new roads or strengthening of existing roads.
• The deterioration of paved roads by traffic results:
– from the magnitude of the individual wheel loads
– the number of passes the loads are applied
• Hence, for the design of pavement/ upgrading works, we need to consider:
– the total number of vehicles using the road
– wheel loads/ Axle loads
Traffic volume- Counts
• Traffic counts can be either manual or automatic.
• Manual counts: – Carried out by observers situated at the side of the road
– Impractical to be carried out for a long period of time
– 3 methods of recording: Tally sheets, mechanical counting boards, electronic counting boards
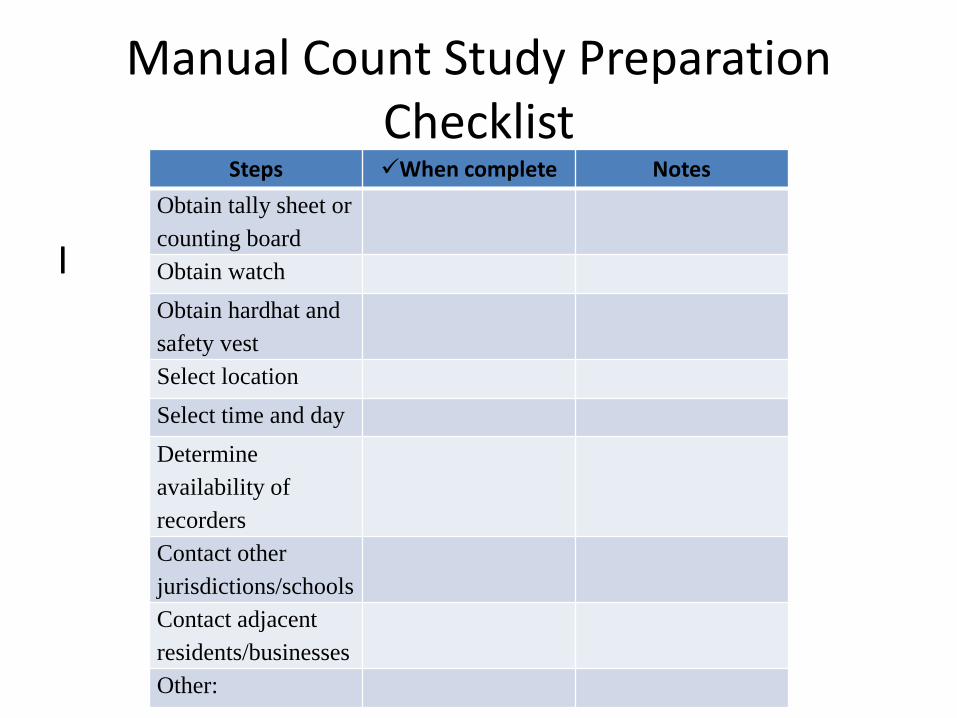
Manual Count Study Preparation Checklist
I
Steps When complete Notes
Obtain tally sheet or
counting board
Obtain watch
Obtain hardhat and
safety vest
Select location
Select time and day
Determine
availability of
recorders
Contact other
jurisdictions/schools
Contact adjacent
residents/businesses
Other:
Key Steps to a Manual Count Study
A manual count study includes three key steps:
1. Perform necessary office preparations.
2. Select proper observer location.
3. Label data sheets and record observations.
Example Manual Count Study
• Smith City was considering a land use change on one of its city blocks. The proposal was to remove four houses and construct an apartment complex .
• This proposed land use change would affect traffic volume.
• The city wanted to document the traffic volumes at the closest intersection during the peak flow period of the day.
• The study was conducted at the intersection of 7th Street and Delaware Avenue, an uncontrolled intersection.
• The time period chosen, 7:00 a.m. to 9:00 a.m., included the morning peak flow.
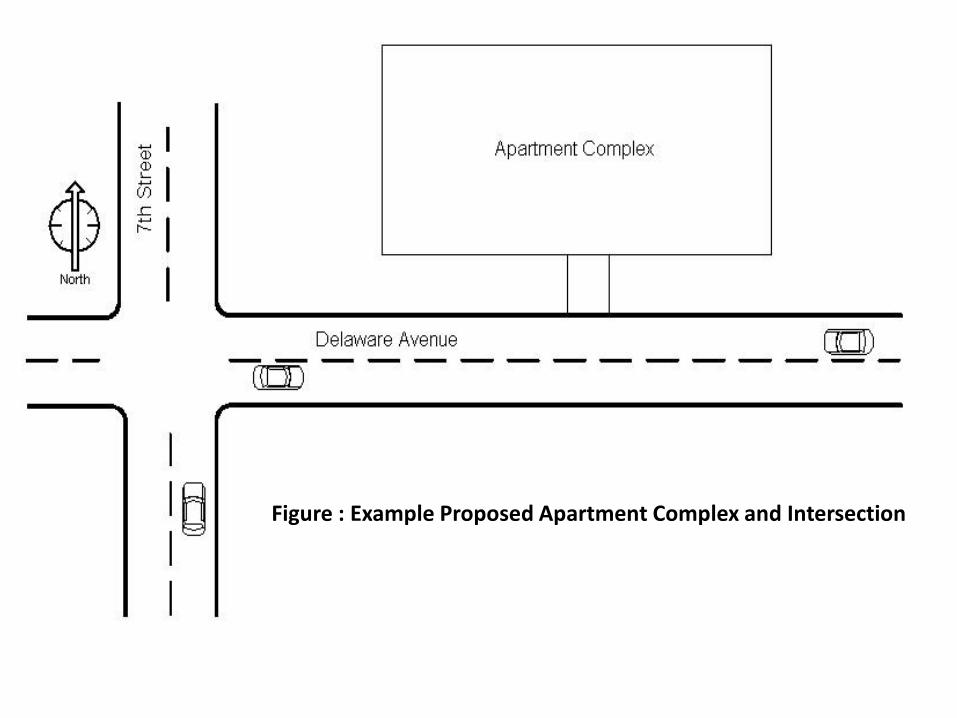
Figure : Example Proposed Apartment Complex and Intersection
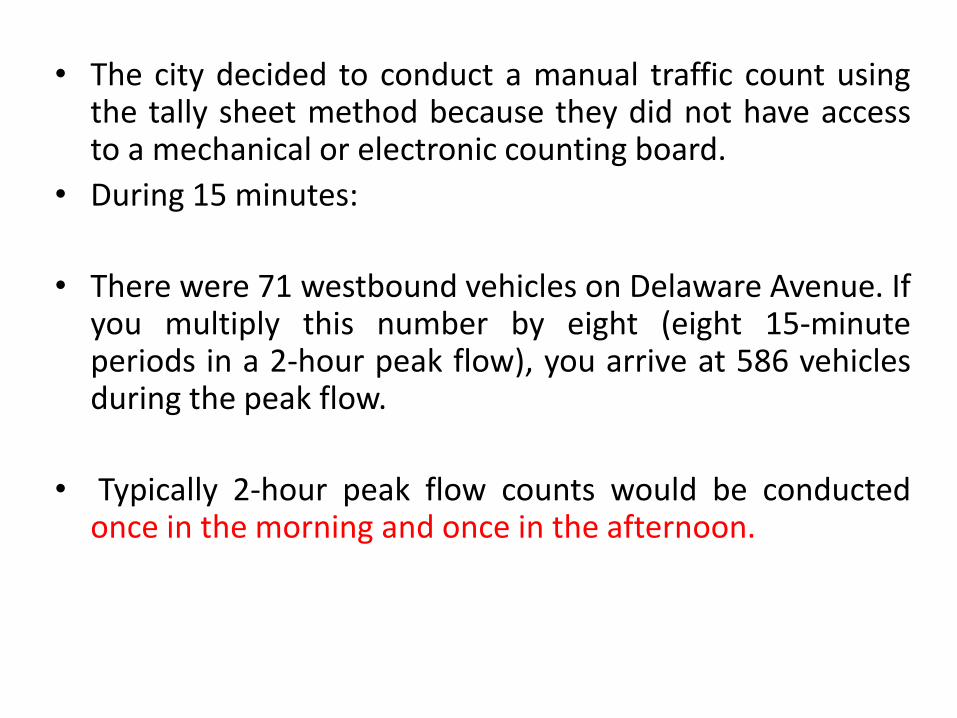
• The city decided to conduct a manual traffic count using the tally sheet method because they did not have access to a mechanical or electronic counting board.
• During 15 minutes:
• There were 71 westbound vehicles on Delaware Avenue. If you multiply this number by eight (eight 15-minute periods in a 2-hour peak flow), you arrive at 586 vehicles during the peak flow.
• Typically 2-hour peak flow counts would be conducted once in the morning and once in the afternoon.
• If an apartment complex is introduced, another study may need to be conducted. The apartment complex could increase the traffic volume.
• If the traffic volume is increased, there may be a need for new traffic control.
• The initial study provides a baseline count that can be used in a traffic impact analysis or a traffic control device evaluation.
• The Manual on Uniform Traffic Control Devices provides current standards on traffic control device warrants.
Automatic counts
• The automatic count method provides a means for gathering large amounts of traffic data.
• Automatic counts are usually taken in 1-hour intervals for each 24-hour period. The counts may extend for a week, month, or year.
• When the counts are recorded for each 24-hour time period, the peak flow period can be identified.
• Consists of automatic counters connected to a sensor that is mounted in or on the road, which produces a signal each time a vehicle passes over it.
• These can be either temporary or permanent installations.
Automatic counts
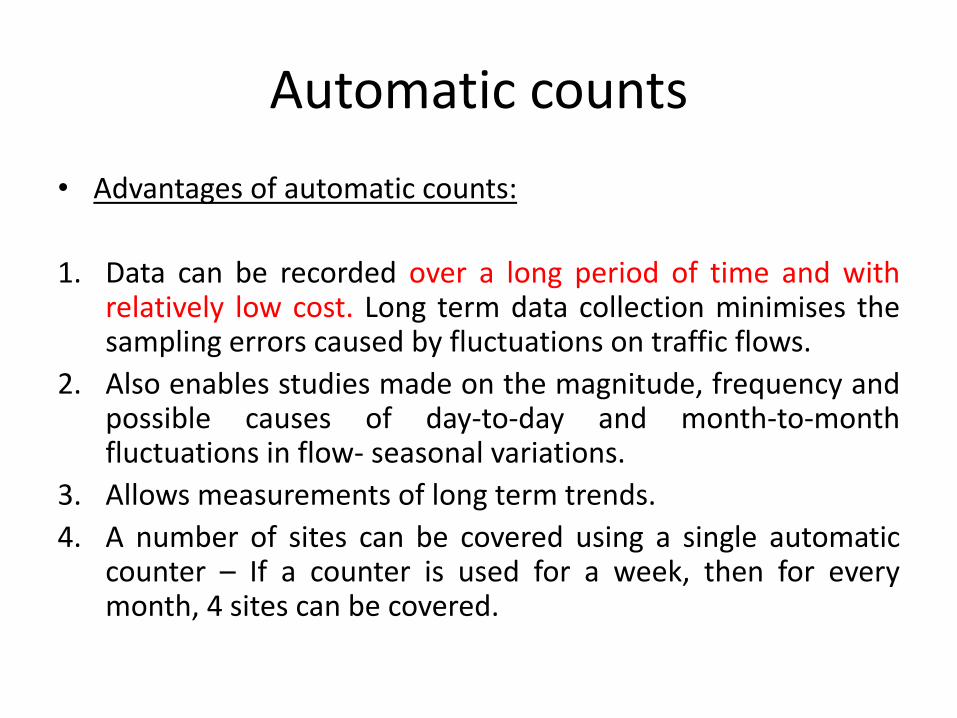
• Advantages of automatic counts:
1. Data can be recorded over a long period of time and with relatively low cost. Long term data collection minimises the sampling errors caused by fluctuations on traffic flows.
2. Also enables studies made on the magnitude, frequency and possible causes of day-to-day and month-to-month fluctuations in flow- seasonal variations.
3. Allows measurements of long term trends.
4. A number of sites can be covered using a single automatic counter – If a counter is used for a week, then for every month, 4 sites can be covered.
Automatic counts
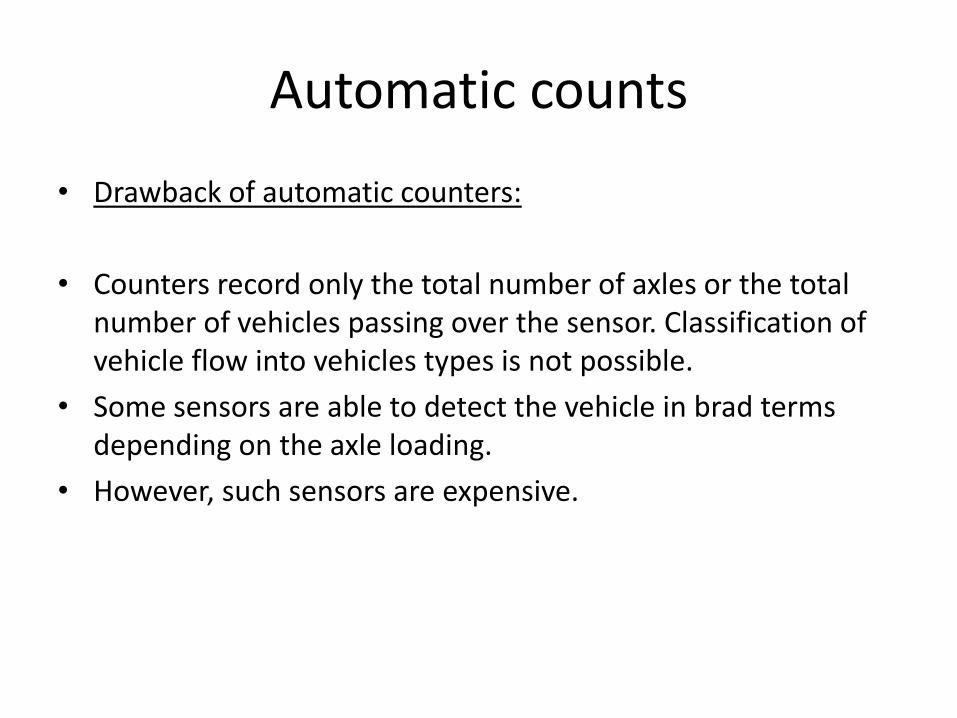
• Drawback of automatic counters:
• Counters record only the total number of axles or the total number of vehicles passing over the sensor. Classification of vehicle flow into vehicles types is not possible.
• Some sensors are able to detect the vehicle in brad terms depending on the axle loading.
• However, such sensors are expensive.
Types of Automatic counters
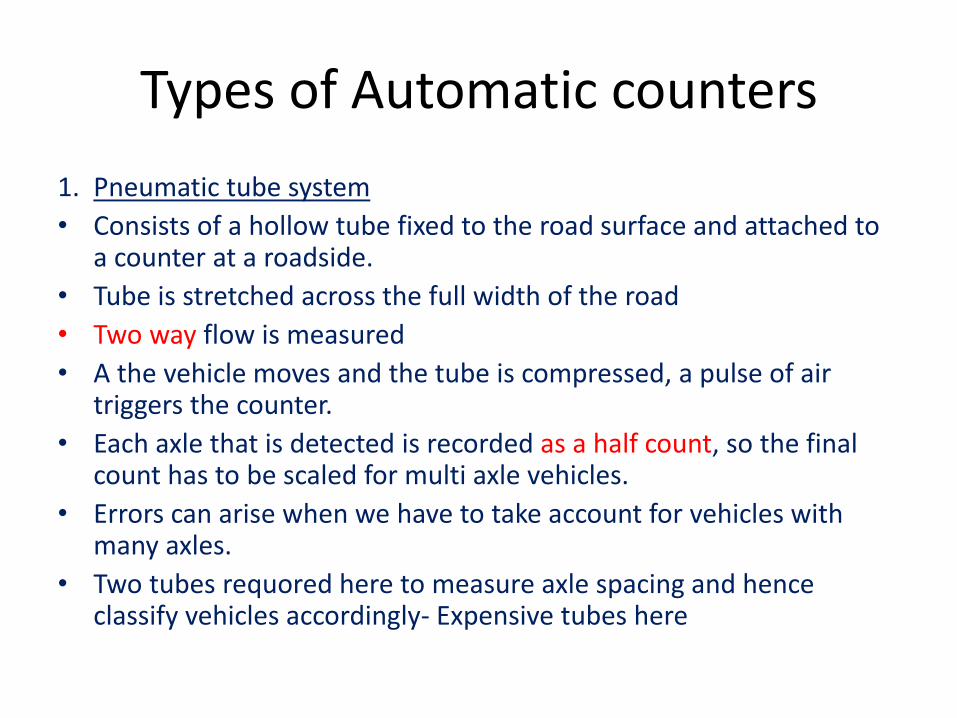
1. Pneumatic tube system
• Consists of a hollow tube fixed to the road surface and attached to a counter at a roadside.
• Tube is stretched across the full width of the road
• Two way flow is measured
• A the vehicle moves and the tube is compressed, a pulse of air triggers the counter.
• Each axle that is detected is recorded as a half count, so the final count has to be scaled for multi axle vehicles.
• Errors can arise when we have to take account for vehicles with many axles.
• Two tubes requored here to measure axle spacing and hence classify vehicles accordingly- Expensive tubes here
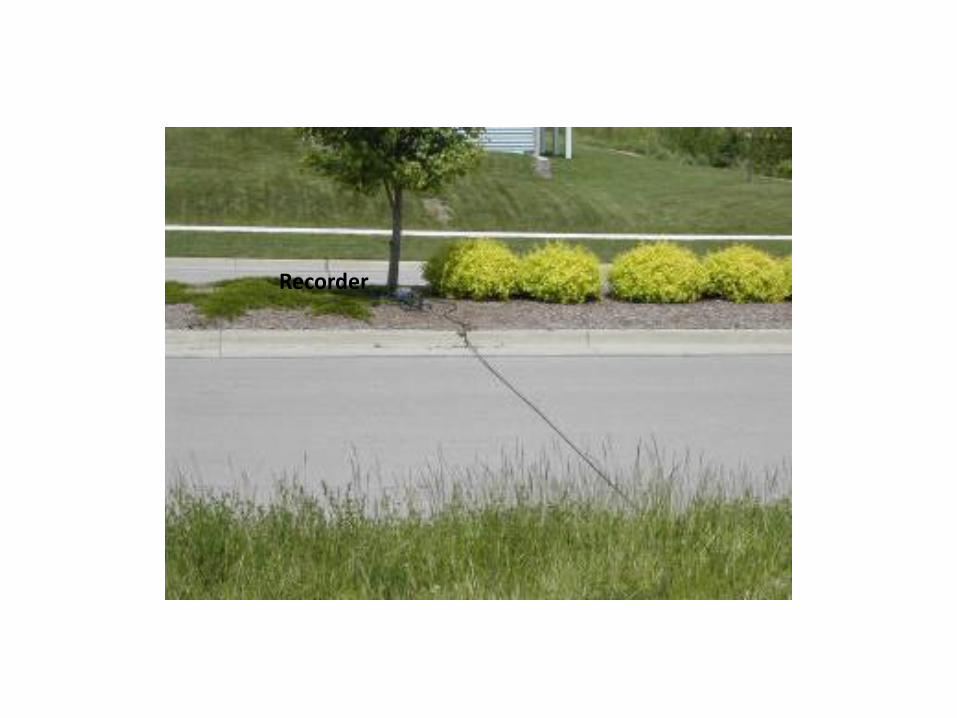
Recorder
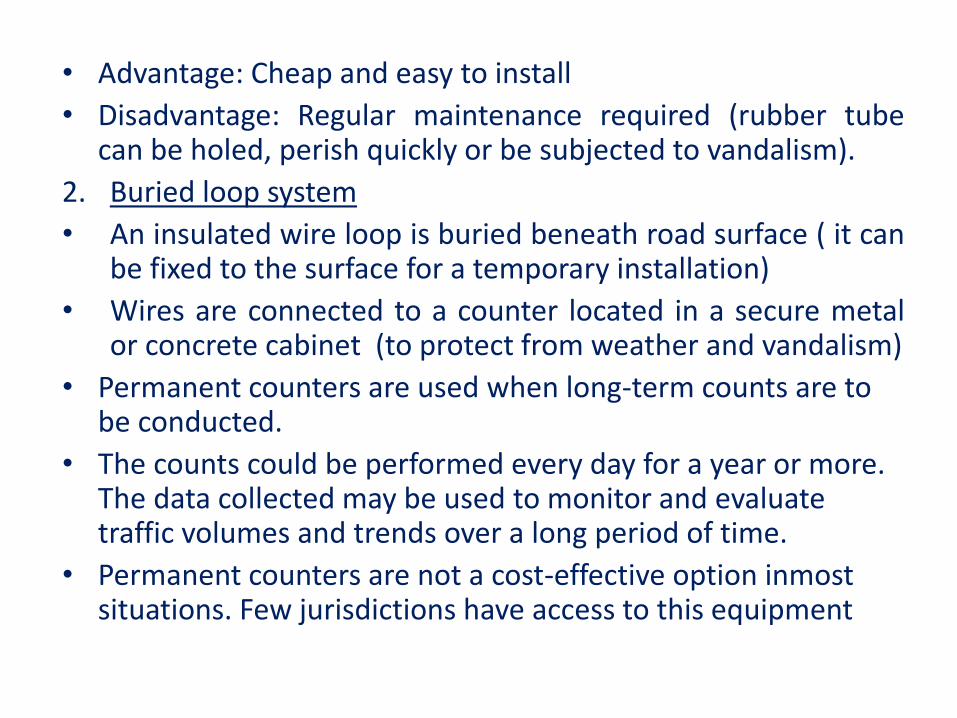
• Advantage: Cheap and easy to install
• Disadvantage: Regular maintenance required (rubber tube can be holed, perish quickly or be subjected to vandalism).
2. Buried loop system
• An insulated wire loop is buried beneath road surface ( it can be fixed to the surface for a temporary installation)
• Wires are connected to a counter located in a secure metal or concrete cabinet (to protect from weather and vandalism)
• Permanent counters are used when long-term counts are to be conducted.
• The counts could be performed every day for a year or more. The data collected may be used to monitor and evaluate traffic volumes and trends over a long period of time.
• Permanent counters are not a cost-effective option inmost situations. Few jurisdictions have access to this equipment
3 Piezo system
• When a force/ stress is applied to the sensor, an electric charge is applied to the sensor surface, an the electric charge is proportional to the applied force.
• The charge is used to determine the number of vehicles, axle loads etc..
• By use of more than one sensor and recording the passage of each axle, a piezo sensor can identify different types of vehicle axle configurations.
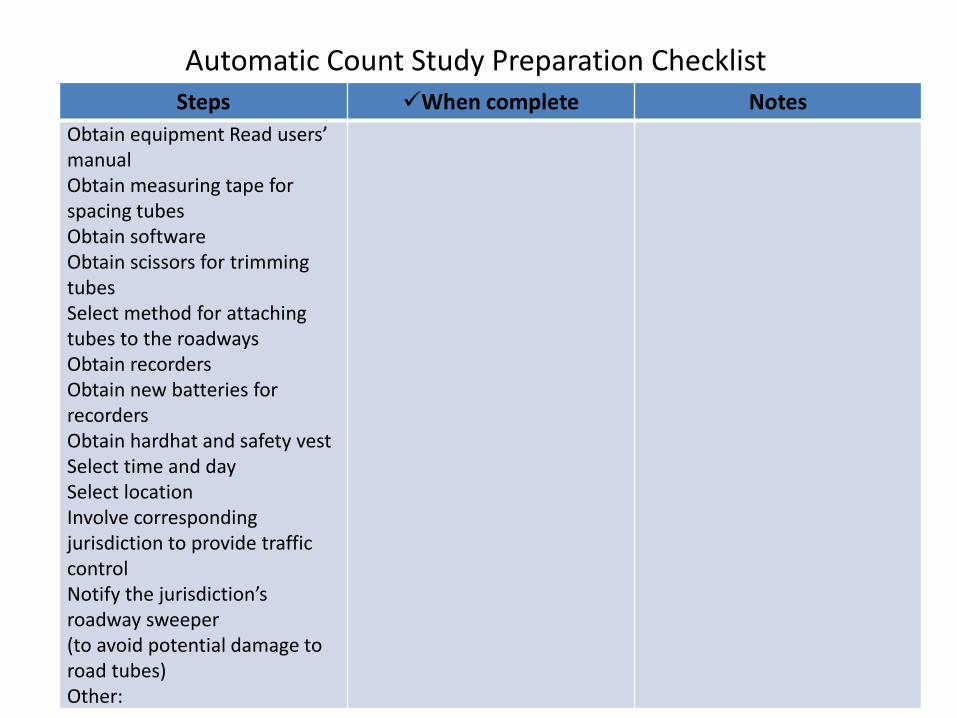
Automatic Count Study Preparation Checklist Steps When complete Notes
Obtain equipment Read users’ manual Obtain measuring tape for spacing tubes Obtain software Obtain scissors for trimming tubes Select method for attaching tubes to the roadways Obtain recorders Obtain new batteries for recorders Obtain hardhat and safety vest Select time and day Select location Involve corresponding jurisdiction to provide traffic control Notify the jurisdiction’s roadway sweeper (to avoid potential damage to road tubes) Other:
Key Steps to an automatic Count Study
• An automatic count study includes three key steps (Robertson 1994):
1. Perform necessary office preparations.
2. Deploy and calibrate data collection equipment.
3. Check data and retrieve equipment
EXAMPLES OF TRAFFIC VOLUME COUNT STUDIES
• Intersection Counts
• Intersection counts are used for timing traffic signals, designing channelization, planning turn prohibitions, computing capacity, analyzing high crash intersections, and evaluating congestion (Homburger et al. 1996).
• The manual count method is usually used to conduct an intersection count.
• A single observer can complete an intersection count only in very light traffic conditions.
EXAMPLES OF TRAFFIC VOLUME COUNT STUDIES
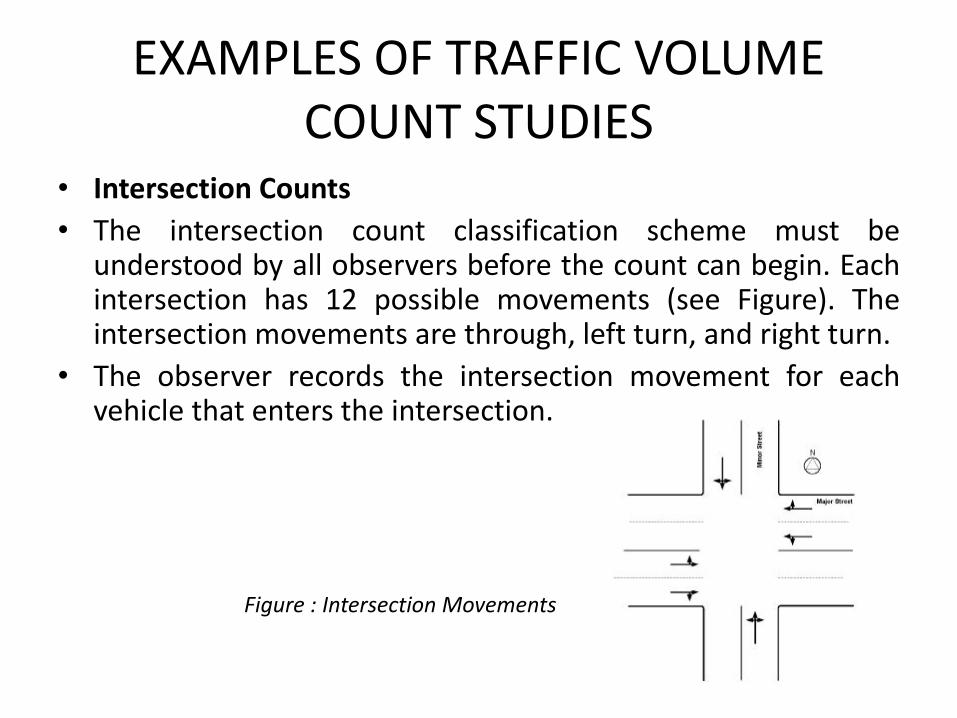
• Intersection Counts
• The intersection count classification scheme must be understood by all observers before the count can begin. Each intersection has 12 possible movements (see Figure). The intersection movements are through, left turn, and right turn.
• The observer records the intersection movement for each vehicle that enters the intersection.
Figure : Intersection Movements
EXAMPLES OF TRAFFIC VOLUME COUNT STUDIES
• Pedestrian Counts • Pedestrian count data are used frequently in planning
applications. • Pedestrian counts are used to evaluate sidewalk and
crosswalk needs, to justify pedestrian signals, and to time traffic signals.
• Pedestrian counts may be taken at intersection crosswalks, midblock crossings, or along sidewalks.
• When pedestrians are tallied, those 12 years or older are customarily classified as adults (Robertson 1994).
• Persons of grade school age or younger are classified as children.
• The observer records the direction of each pedestrian crossing the roadway.
EXAMPLES OF TRAFFIC VOLUME COUNT STUDIES
• Vehicle Classification Counts
• Vehicle classification counts are used in establishing structural and geometric design criteria, computing expected highway user revenue, and computing capacity.
• If a high percentage of heavy trucks exists or if the vehicle mix at the crash site is suspected as contributing to the crash problem, then classification counts should be conducted.
EXAMPLES OF TRAFFIC VOLUME COUNT STUDIES
• Average Daily Traffic and Annual Average Daily Traffic Counts
• Average daily traffic (ADT) counts represent a 24-hour count at any specified location.
• These counts are obtained by placing an automatic counter at the analysis location for a 24-hour period.
• Accuracy of the ADT data depends on the count being performed during typical roadway, weather, and traffic demand conditions.
• Local levels of government will typically conduct this type of count.
EXAMPLES OF TRAFFIC VOLUME COUNT STUDIES
• Annual average daily traffic (AADT) counts represent the average 24-hour traffic volume at a given location averaged over a full 365-day year.
• AADT volume counts have the following uses:
– measuring or evaluating the present demand for service by the roadway or facility
– developing the major or arterial roadway system
– locating areas where new facilities or improvements to existing facilities are needed
– programming capital improvements
Variation in traffic flows and accuracy of counts
• Hourly Variations
• Traffic counts conducted over a short period of time are unreliable and produce large errors because traffic flows vary daily, weekly, monthly and seasonally.
• We can conduct 24 hour counts to determine a scaling factor.
• The accuracy of the 24 hour count will depend on:
– The number of hours of counting on “normal” count days
– The number of days of counting
– The accuracy and scaling factor (that is the number of 24 hours used to obtain the scaling factor)
Variation in traffic flows and accuracy of counts
• Daily and weekly variations
• In the same way as hourly variations, the volume of traffic varies during a week
• During weekends- the volume of commercial vehicles will decrease significantly in an urban area
• During weekends- in rural areas, the volume of traffic can increase
• The day- to-day traffic flow tends to vary more than the week- to-week flows over a year.
• Hence large errors are associated with estimating average daily traffic from counts from a few days only
• Thus, we prefer to estimate with average annual daily traffic
Variation in traffic flows and accuracy of counts
• There is an increased accuracy when the time period is one week (including weekend).
• For counts longer than one week, the increase in accuracy is less pronounced.
• Thus a survey on 7 consecutive days- is an optimum length.
Variation in traffic flows and accuracy of counts
• Monthly and seasonal variations
• Examples on variations: Increase in traffic during harvest time or decrease in traffic flow in wet season
• It is thus desirable to repeat the classified traffic count at different times a year.
• A series of weekly traffic counts repeated over at various seasons throughout the year- will provide a better estimate of the AADT than a continuous traffic count
• From these seasonal data, the seasonal adjustments can be derived for each month of the year.
• These factors can be used to convert traffic counts at any time of the year to average annual counts.
Data analysis- Converting a partial day’s count into a full day’s traffic
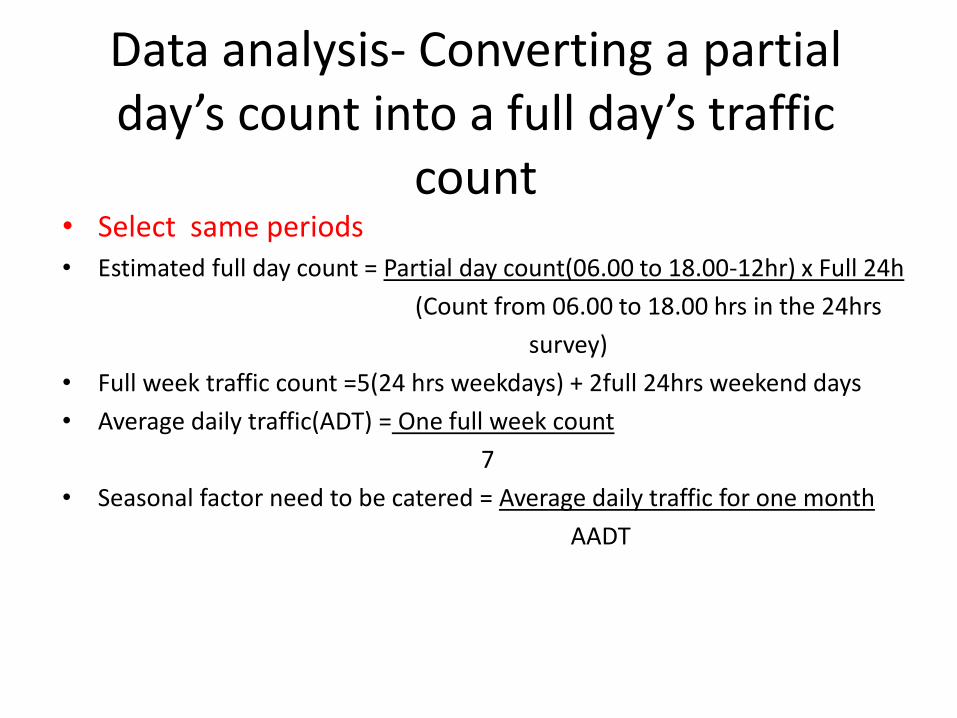
count • Select same periods • Estimated full day count = Partial day count(06.00 to 18.00-12hr) x Full 24h
(Count from 06.00 to 18.00 hrs in the 24hrs
survey)
• Full week traffic count =5(24 hrs weekdays) + 2full 24hrs weekend days
• Average daily traffic(ADT) = One full week count
7
• Seasonal factor need to be catered = Average daily traffic for one month
AADT
Automatic count data
• Data from automatic counts are recorded in blocks- 1h, 2h, 3h, 4h etc
• Cumulative traffic is recorded
• The total traffic per 24 h is calculated
• The average vehicle per day= mean of the Total traffic
• Data can be adjusted to remove non motorised traffic or season factors
• To know about the counting process ( whether one way or two way) or even the type of traffic- one needs to be on site and observe the counter in action.

Errors in count surveys and analysis
• Not carrying out a classified count – Type of vehicle is an important factor for pavement design
• Whether 2 way or one way
• Not distinguishing with the travel directions
• Not correlating axle count with vehicle count
• Not converting a partial day count to a full day count
• Incorrect counting through lack of concentration
Planning a classified traffic count survey
• Planning stage:
– When to carry out the survey and duration
– Survey location
– Staffing and equipment
– Traffic counts in conjunction with an axle load survey
– Recording traffic count data
CONTRACTING FOR A TRAFFIC VOLUME COUNT STUDY
• Information Gathering
• Before a jurisdiction contacts an engineering consulting firm to perform a traffic volume count study, a variety of information may need to be collected.
• Any information may aid the consulting firm in adequately completing the study.
• The following is a list of possible information that an engineering consulting firm may request:
CONTRACTING FOR A TRAFFIC VOLUME COUNT STUDY
• Information Gathering • issue at hand • historic volume counts • existing zoning • proposed future land use changes • traffic impact statements if available • citizen input • location map • appropriate contact persons • any other relevant information
VOLUME, DEMAND AND CAPACITY
•Volume, number of vehicles (persons) passing a point during a specified time period which is usually one hour (veh/ h).
•Demand, number of vehicles (persons) that desire to travel past a point during a specified period also usually one hour.
•Capacity, maximum rate at which vehicle can traverse a point or short segment during a specified time period
Theoretically, actual volume can never be observed at levels higher than the true capacity of the section.
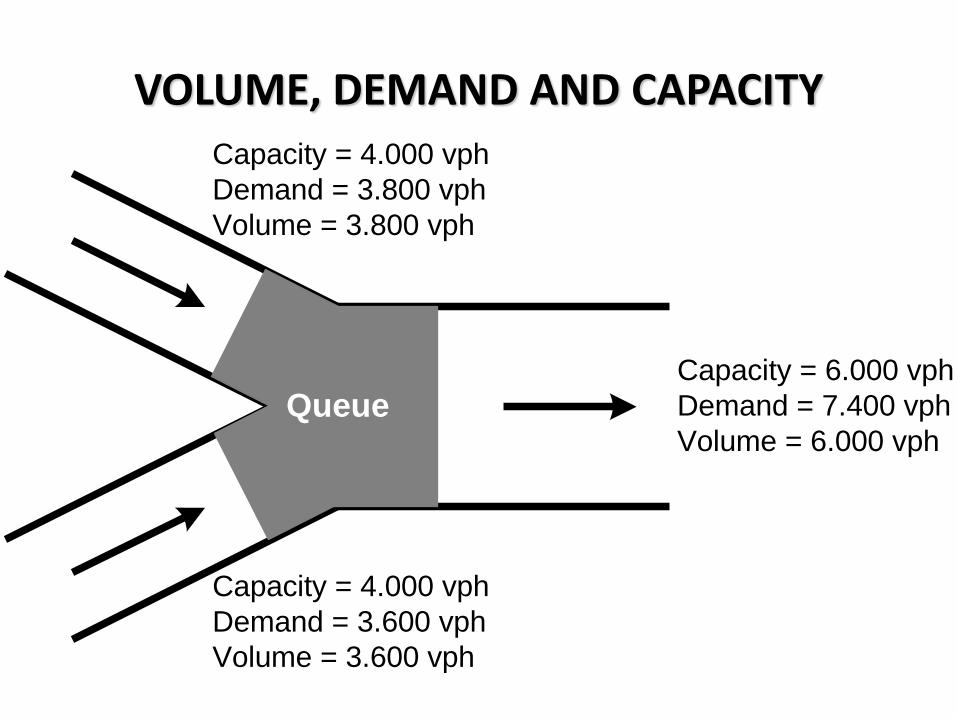
VOLUME, DEMAND AND CAPACITY Capacity = 4.000 vph
Demand = 3.800 vph
Volume = 3.800 vph
Capacity = 4.000 vph
Demand = 3.600 vph
Volume = 3.600 vph
Capacity = 6.000 vph
Demand = 7.400 vph
Volume = 6.000 vphQueue

AXLE LOADING
Survey
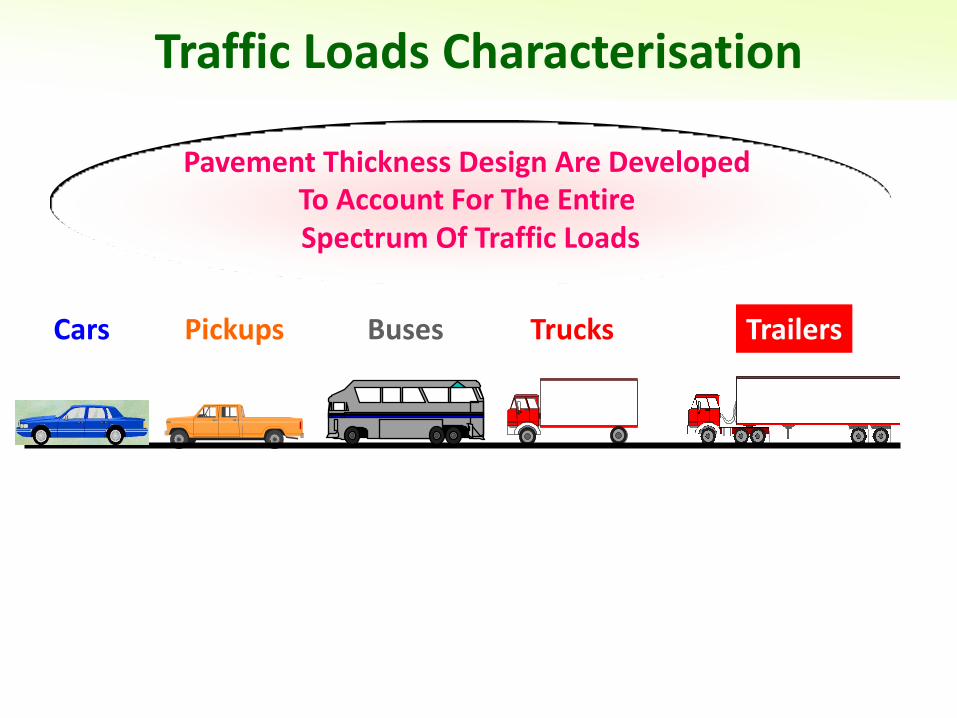
Traffic Loads Characterisation
Pavement Thickness Design Are Developed To Account For The Entire Spectrum Of Traffic Loads
Cars Pickups Buses Trucks Trailers
AXLE LOADING
• Axle load survey is carried out to determine the axle load distribution of the heavy vehicles using the road.
The survey data are then used to calculate the mean number of equivalent standard axles.
These values are then combined with traffic flows and forecasts to determine the total predicted traffic loading that a particular road will carry over its design life in terms of msa (millions of equivalent standard axles).
• msa = 106 esa
= These are units of traffic loading over the pavement
design life, used for design and rehabilitation purposes
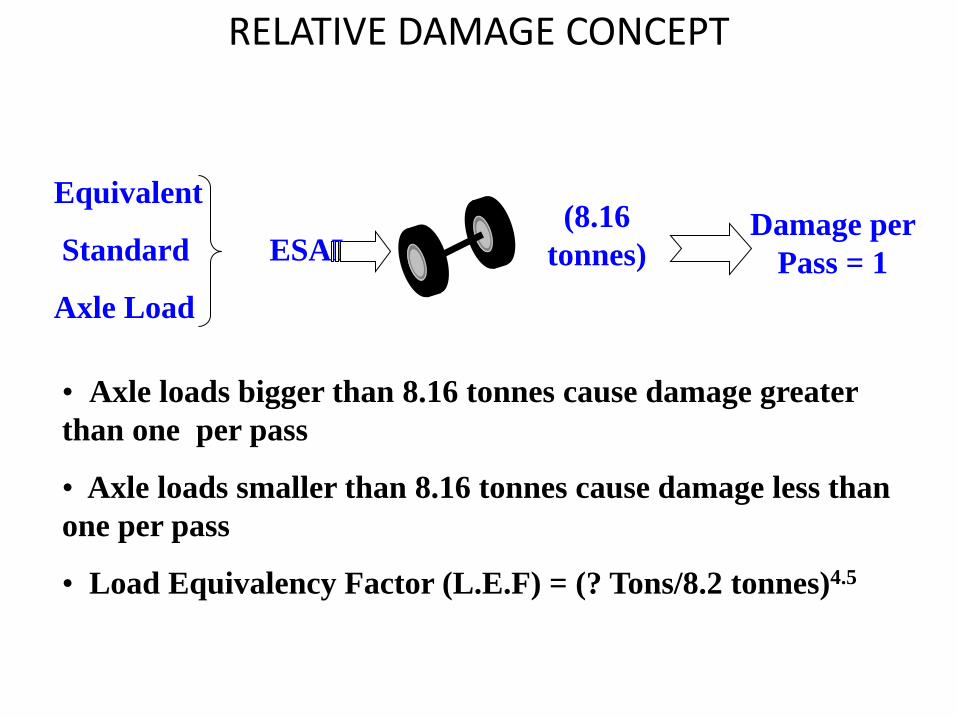
Equivalent
Standard ESAL
Axle Load
(8.16
tonnes) Damage per
Pass = 1
• Axle loads bigger than 8.16 tonnes cause damage greater
than one per pass
• Axle loads smaller than 8.16 tonnes cause damage less than
one per pass
• Load Equivalency Factor (L.E.F) = (? Tons/8.2 tonnes)4.5
RELATIVE DAMAGE CONCEPT

RELATIVE DAMAGE CONCEPT
• ESA/ESAL- may also be known as E80 (a standard axle load is
8.16 tonnes (80 kN).
• All axle loads are converted to an equivalent standard axle loads (ESAs) and pavement design is usual based upon the total cumulative ESAs that the pavement will carry over its design life.
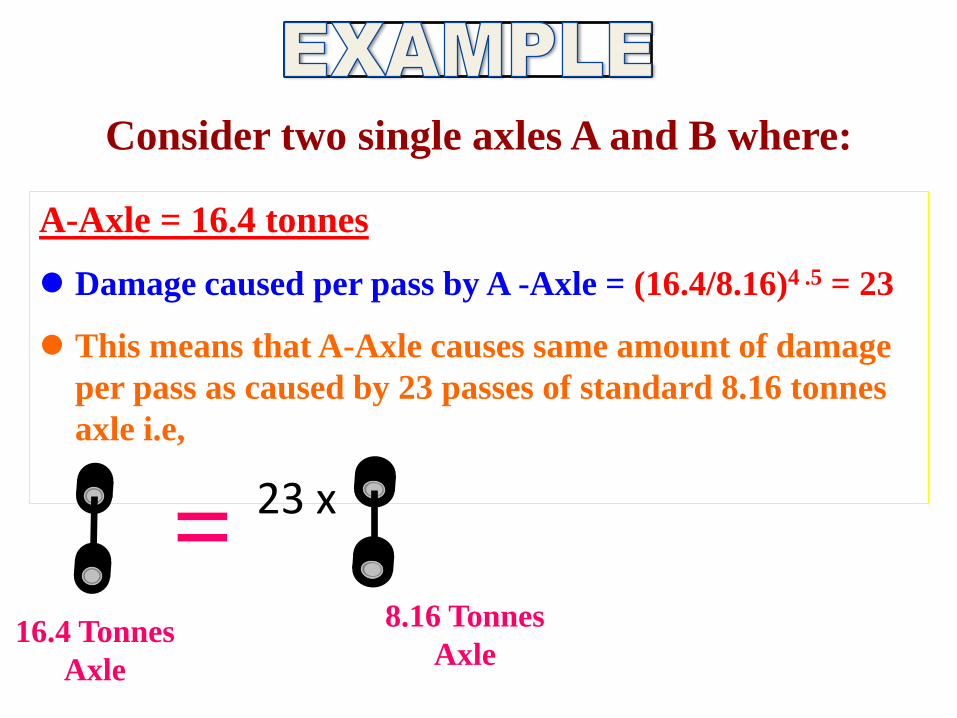
Consider two single axles A and B where:
A-Axle = 16.4 tonnes
Damage caused per pass by A -Axle = (16.4/8.16)4 .5 = 23
This means that A-Axle causes same amount of damage
per pass as caused by 23 passes of standard 8.16 tonnes
axle i.e,
8.16 Tonnes
Axle 16.4 Tonnes
Axle
= 23 x
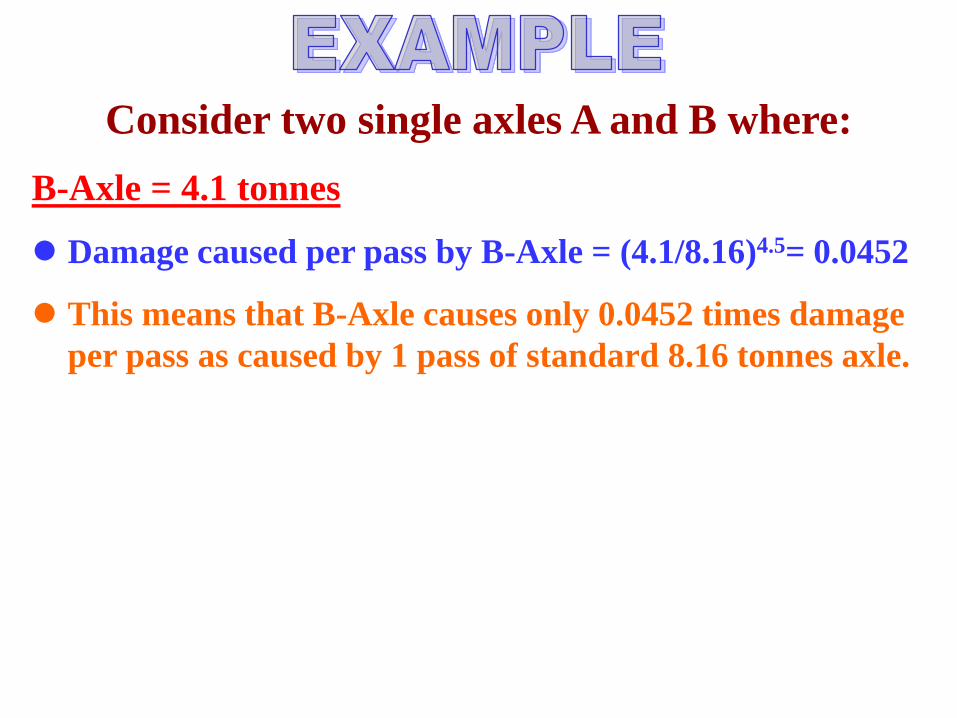
B-Axle = 4.1 tonnes
Damage caused per pass by B-Axle = (4.1/8.16)4.5= 0.0452
This means that B-Axle causes only 0.0452 times damage
per pass as caused by 1 pass of standard 8.16 tonnes axle.
Consider two single axles A and B where:

AXLE LOADING
• If flow is high, selected samples of vehicles should be weighed.
• Not necessary to weigh vehicles less than 1.5 tonnes unladen weight- motorcycles, cars
• 3 main ways of measuring axle loading: – A fixed weighbridge
– Portable weighpads
– Weigh-in -motion equipment
Planning for a survey
• Duration and timing of survey – Ideally the survey needs to be carried out for 7 consecutive
days an for 24 hours a day.
– However, if this is impossible, survey should last to weigh 80% of the traffic.
– Require surveys of 12 h- 16 h per day.
– Surveys with less than 7 days not recommended
– Avoid short periods of unusual traffic flows- as for traffic counts

Planning for a survey
• Survey location and site layout
– The accuracy, ease and safety of an axle load survey will depend very largely on the choice of site.
– The site must be chosen carefully to enable traffic to be sampled and stopped easily and safely.
– Warning signs should be displayed for safety
– Good visibility in both directions
• Safety and road signs
• Police presence
• Staffing and equipment

Survey Procedure
• We have to determine an equivalency factor (EF) for each type of vehicle.
• This represents an average damaging effect of a vehicle of each class.
1. The number of vehicles to weigh
• For accuracy, as many vehicles must be weighed as possible
• The number of vehicles that can actually be weighed every hour will depend on: – the volume and flow of commercial vehicles
– The speed of weighing (dependent on the type of weighing equipment, staff and skill, complexity of the interview survey)
– Site layout
Survey Procedure
• It must be possible to weigh at least 60 vehicles per hour per set of weighpads, although this is however governed by the factors mentioned.
• It is possible to reduce the number of vehicles in a sample for large axle load surveys on busy roads (ORN 40-section 11.2)
• Survey data forms and axle load survey forms are used for recording of data.
• (Read sections 11.3 to 11.6)- Recording of data
Analysis of results
• Calculate EF or ESA for each vehicle class
• Data check- important to check unusual values for axle loads > 20 tonnes- check against original survey sheets
• Calculate the average EF per vehicle for each vehicle type