Embed Size (px)
Citation preview
1
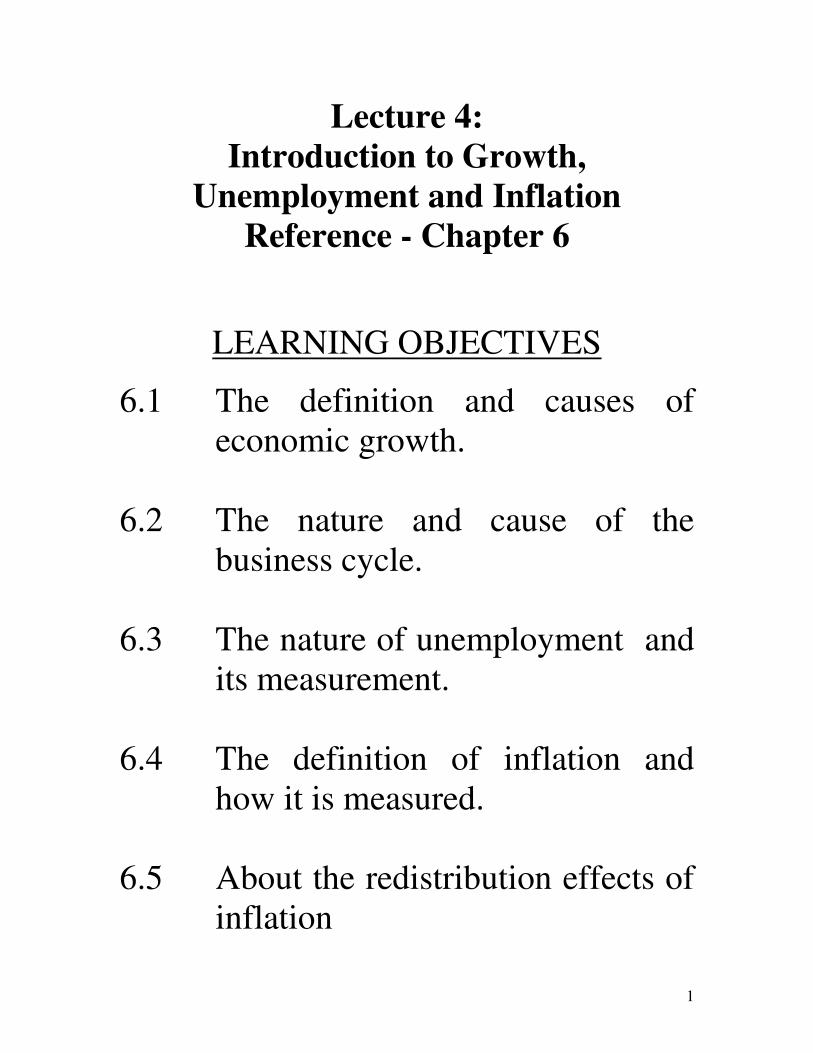
Lecture 4: Introduction to Growth,
Unemployment and Inflation Reference - Chapter 6
LEARNING OBJECTIVES
6.1 The definition and causes of economic growth.
6.2 The nature and cause of the
business cycle. 6.3 The nature of unemployment and
its measurement. 6.4 The definition of inflation and
how it is measured. 6.5 About the redistribution effects of
inflation
2
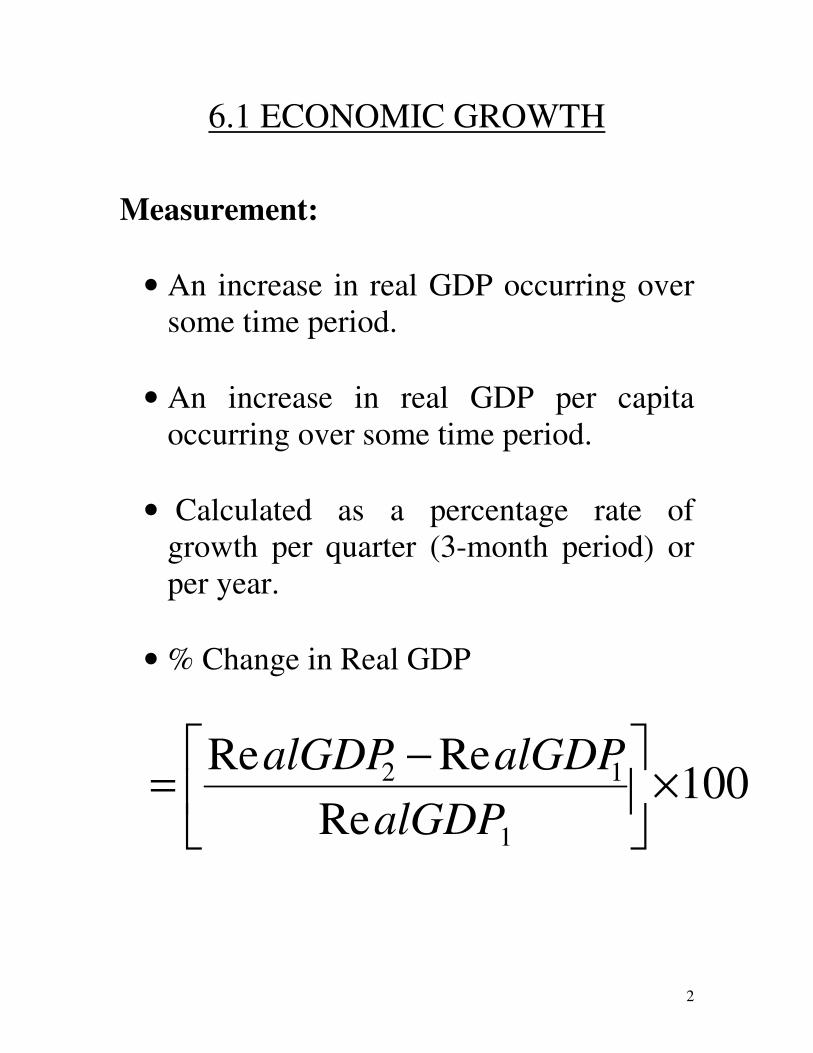
6.1 ECONOMIC GROWTH
Measurement:
• An increase in real GDP occurring over some time period.
• An increase in real GDP per capita
occurring over some time period.
• Calculated as a percentage rate of growth per quarter (3-month period) or per year.
• % Change in Real GDP
100Re
ReRe
1
12 ��
���
� −=alGDP
alGDPalGDP
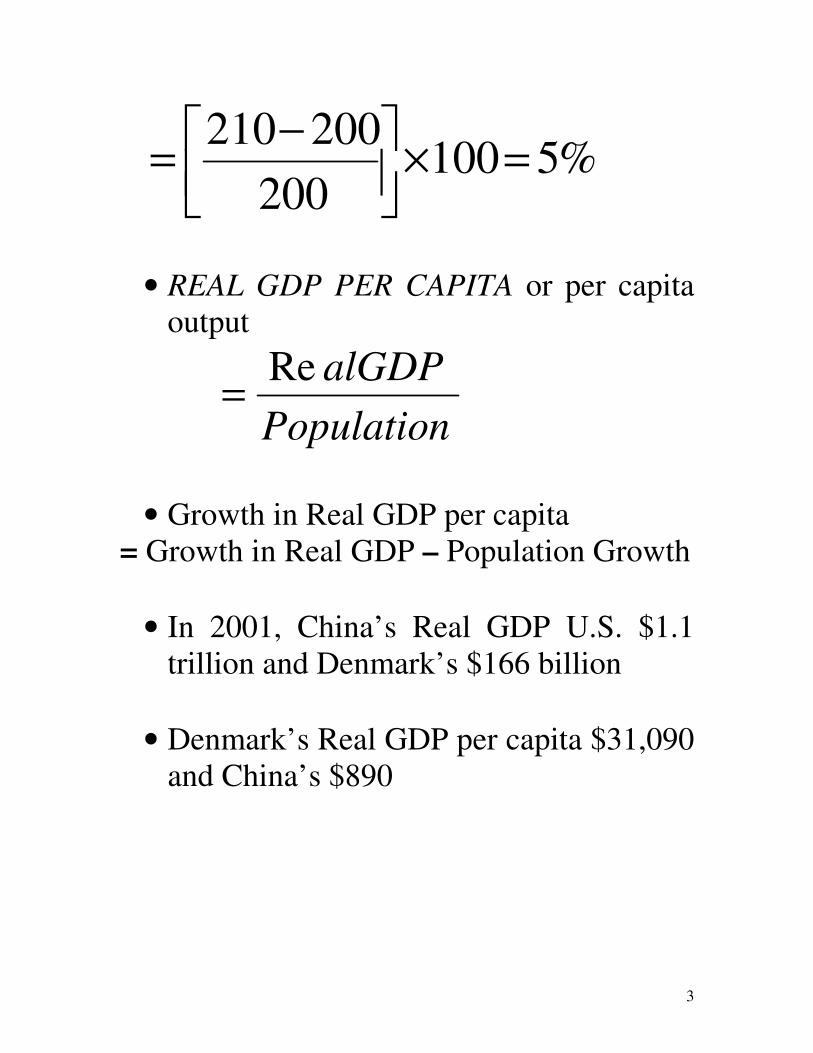
3
%5100200
200210 =���
��
� −=
• REAL GDP PER CAPITA or per capita
output
PopulationalGDPRe=
• Growth in Real GDP per capita
= Growth in Real GDP – Population Growth
• In 2001, China’s Real GDP U.S. $1.1 trillion and Denmark’s $166 billion
• Denmark’s Real GDP per capita $31,090
and China’s $890
4
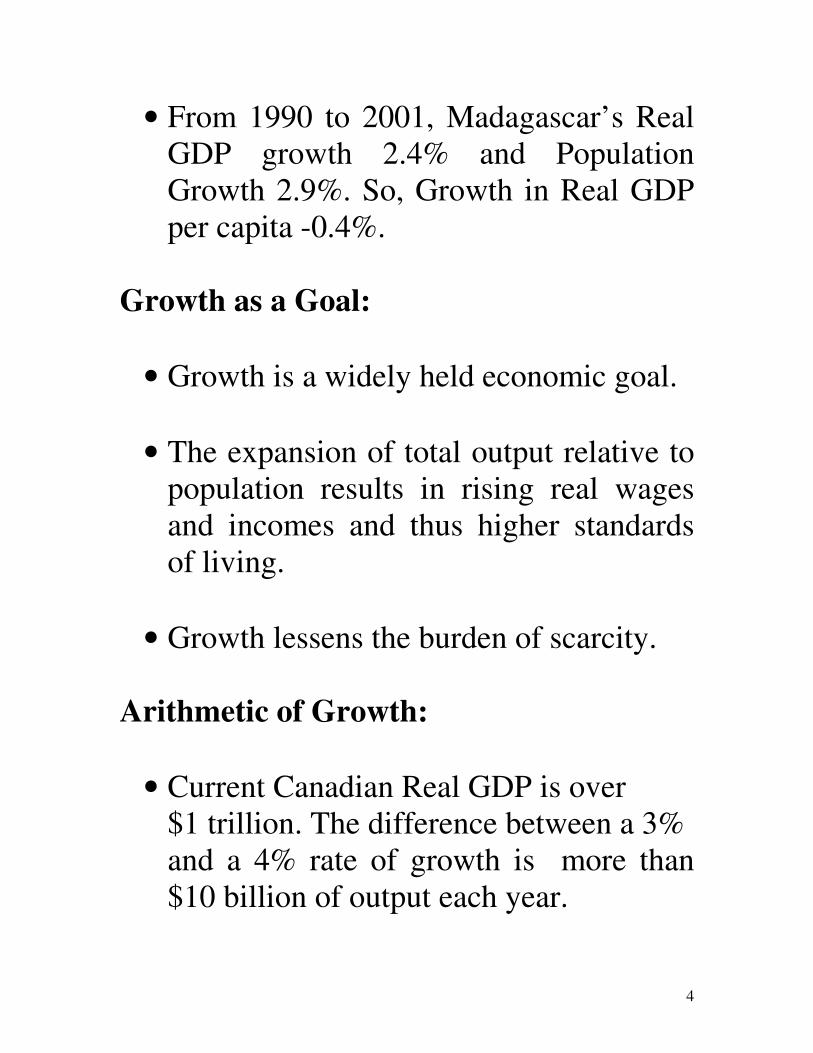
• From 1990 to 2001, Madagascar’s Real GDP growth 2.4% and Population Growth 2.9%. So, Growth in Real GDP per capita -0.4%.
Growth as a Goal:
• Growth is a widely held economic goal. • The expansion of total output relative to
population results in rising real wages and incomes and thus higher standards of living.
• Growth lessens the burden of scarcity.
Arithmetic of Growth:
• Current Canadian Real GDP is over $1 trillion. The difference between a 3% and a 4% rate of growth is more than $10 billion of output each year.
5
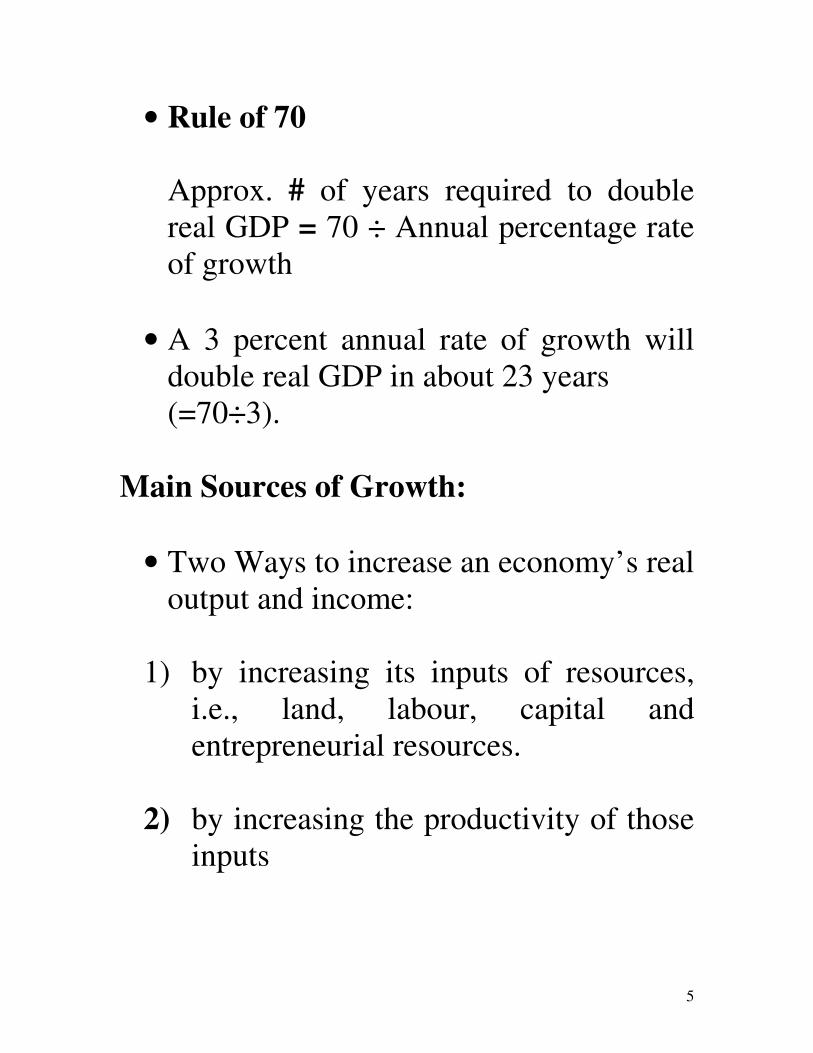
• Rule of 70
Approx. # of years required to double real GDP = 70 ÷ Annual percentage rate of growth
• A 3 percent annual rate of growth will double real GDP in about 23 years (=70÷3).
Main Sources of Growth:
• Two Ways to increase an economy’s real output and income:
1) by increasing its inputs of resources,
i.e., land, labour, capital and entrepreneurial resources.
2) by increasing the productivity of those
inputs
6
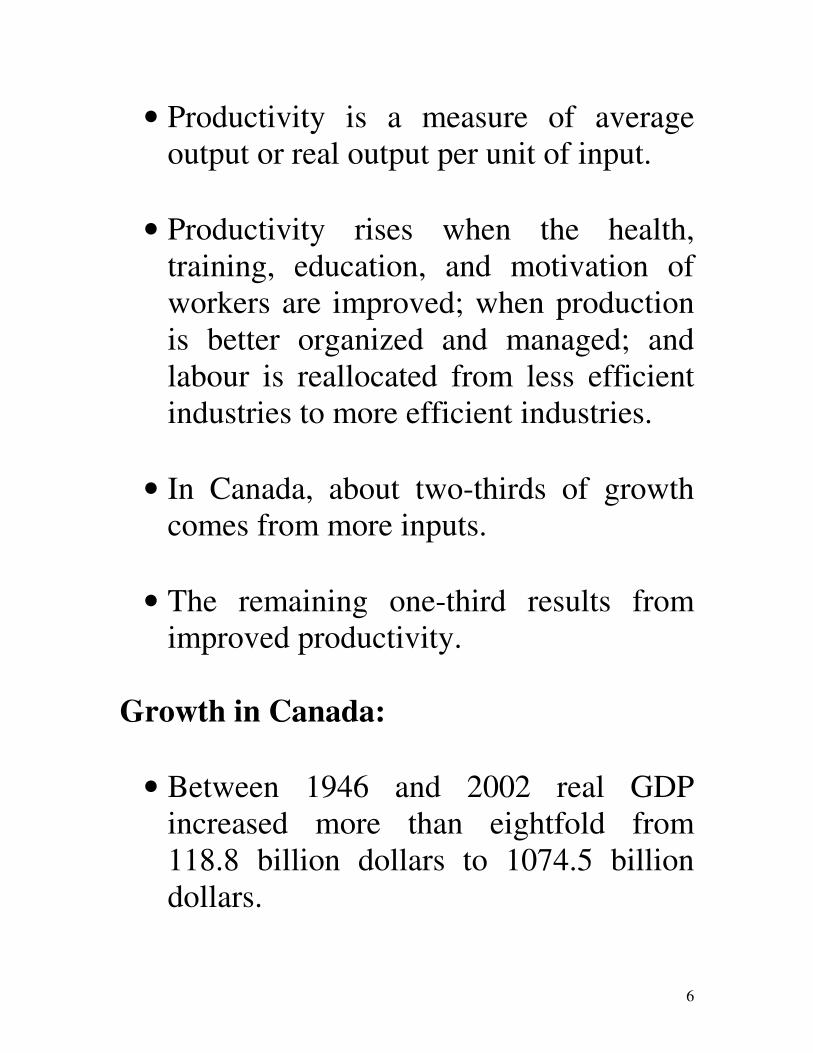
• Productivity is a measure of average output or real output per unit of input.
• Productivity rises when the health,
training, education, and motivation of workers are improved; when production is better organized and managed; and labour is reallocated from less efficient industries to more efficient industries.
• In Canada, about two-thirds of growth
comes from more inputs.
• The remaining one-third results from improved productivity.
Growth in Canada:
• Between 1946 and 2002 real GDP increased more than eightfold from 118.8 billion dollars to 1074.5 billion dollars.
7
• Real GDP per capita rose almost fourfold over these years from 9,659 to34,661.
• Real GDP grew at an annual rate of
almost 4 percent between 1950 and 2002.
• Real GDP per capita increased more
than 2 percent per year over that time.
• Improved products and services - Understatement of the growth of
economic well-being
• Added Leisure - 50-hr workweek to 35 hr - Understatement of the growth of
economic well-being
8
• Other Impacts - If growth debases the physical
environment and create a stressful work environment, the bare growth numbers will overstate the gains in well-being that result from growth.
- If growth leads to stronger
environmental protections and greater human security, the growth rates will understate the gains in well-being.
Relative Growth Rates:
• In last half century, economic growth in Canada lagged behind Japan and Germany.
• Japan’s annual growth rate averaged
a third more than that of Canada.
9
• Between 1994 and 1995, growth in Canada was stronger than in many of the other major countries, surpassing even the U.S., between 2000 and 2002.
• Latest Growth Figures Canada: 3.0% (Q2); 2004 3.0% ;
U.S. : 4.7% (Q2); 2004 4.3%; China : 9.6% (Q2);
6.2 THE BUSINESS CYCLE Phases of the Business Cycle (B.C.):
• The term business cycle refers to alternating rises and declines in the level of economic activity, sometimes extending over several years
10
• The typical business cycle goes through four phases: peak, recession, trough, and recovery. The duration and strength of each phase may vary.
• Peak
- A phase in the B.C. during which the economy is at full employment and the level of real output is at or very close to the economy’s capacity.
- The price level is likely to rise
during this phase.
• Recession
- A peak is followed by a recession. - A period of declining real GDP,
accompanied by lower real income and higher unemployment.
11
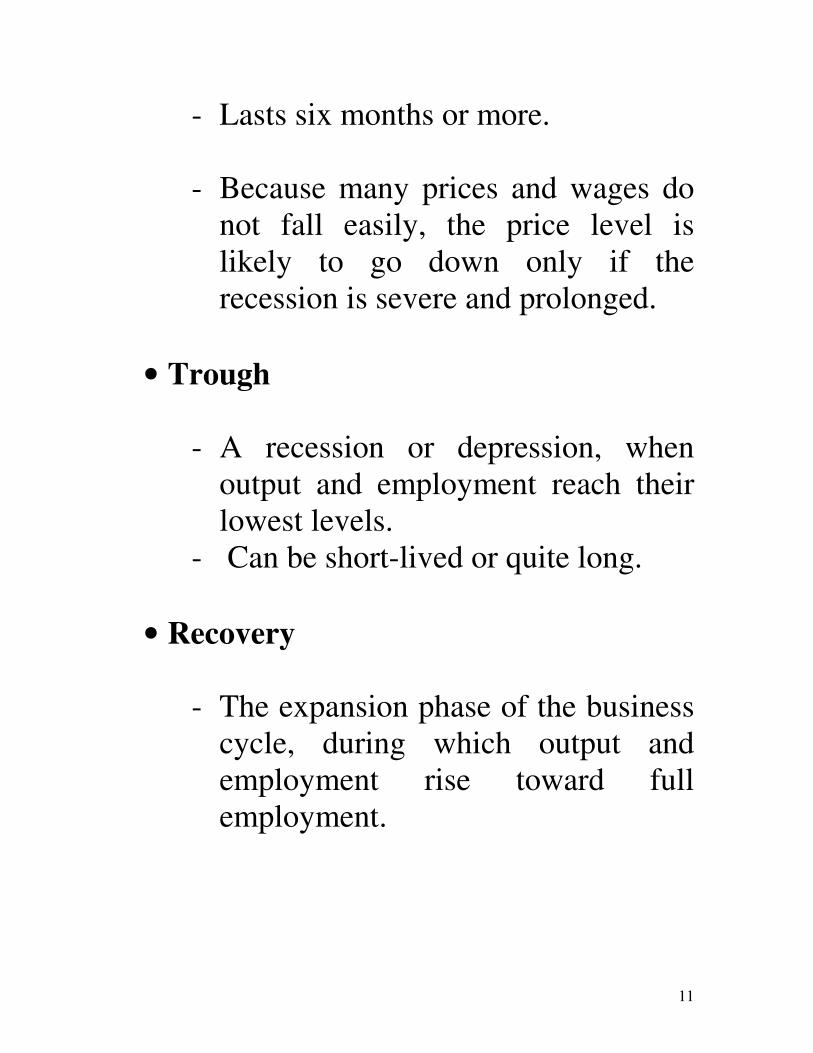
- Lasts six months or more.
- Because many prices and wages do not fall easily, the price level is likely to go down only if the recession is severe and prolonged.
• Trough
- A recession or depression, when
output and employment reach their lowest levels.
- Can be short-lived or quite long.
• Recovery - The expansion phase of the business
cycle, during which output and employment rise toward full employment.
12
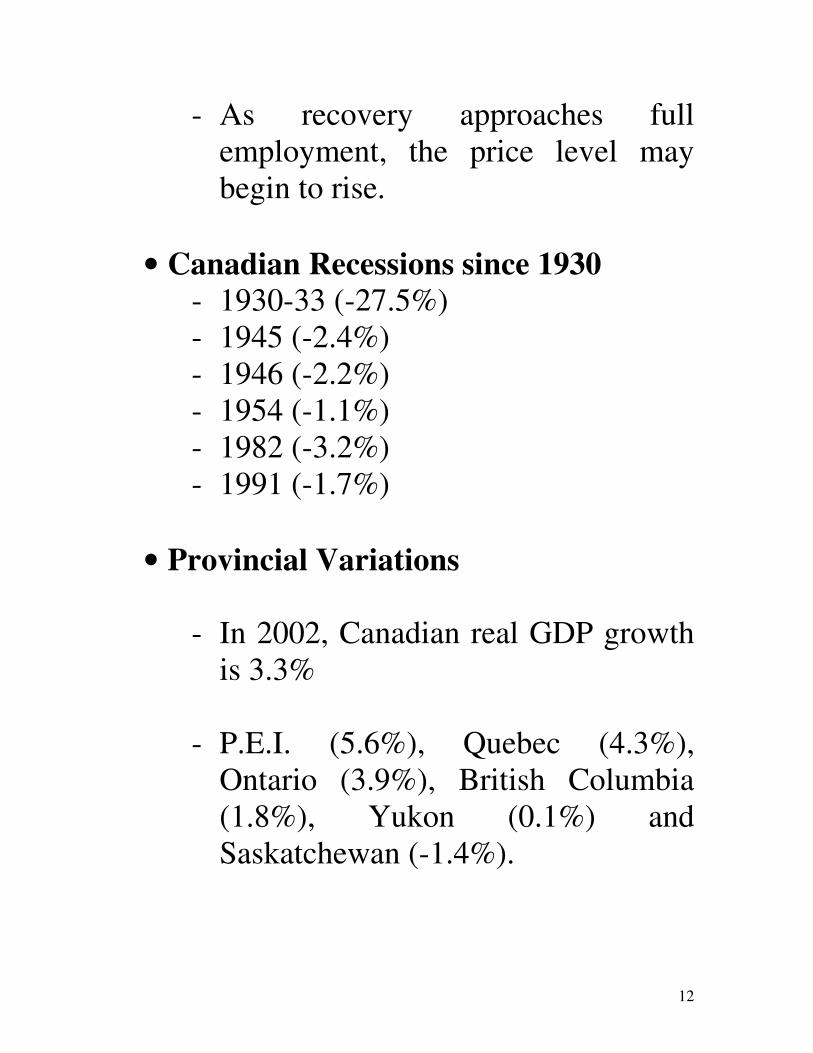
- As recovery approaches full employment, the price level may begin to rise.
• Canadian Recessions since 1930
- 1930-33 (-27.5%) - 1945 (-2.4%) - 1946 (-2.2%) - 1954 (-1.1%) - 1982 (-3.2%) - 1991 (-1.7%)
• Provincial Variations
- In 2002, Canadian real GDP growth is 3.3%
- P.E.I. (5.6%), Quebec (4.3%),
Ontario (3.9%), British Columbia (1.8%), Yukon (0.1%) and Saskatchewan (-1.4%).
13
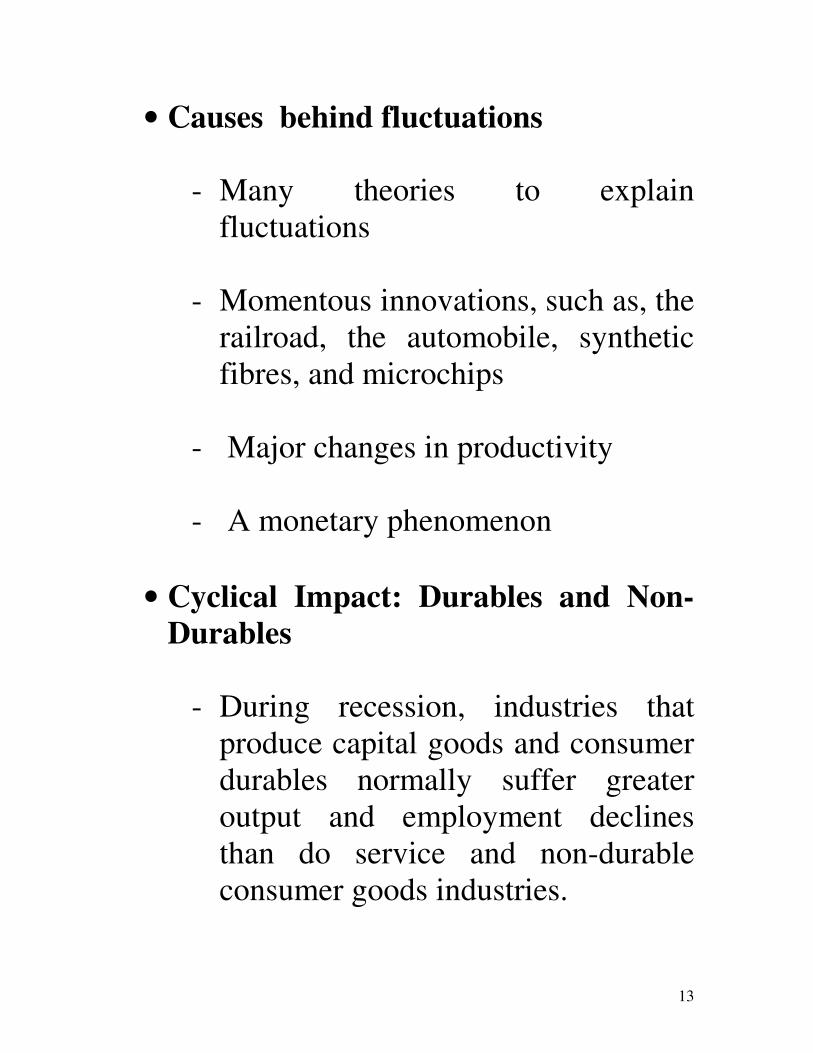
• Causes behind fluctuations
- Many theories to explain fluctuations
- Momentous innovations, such as, the
railroad, the automobile, synthetic fibres, and microchips
- Major changes in productivity
- A monetary phenomenon
• Cyclical Impact: Durables and Non-
Durables
- During recession, industries that produce capital goods and consumer durables normally suffer greater output and employment declines than do service and non-durable consumer goods industries.
14
6.3 UNEMPLOYMENT
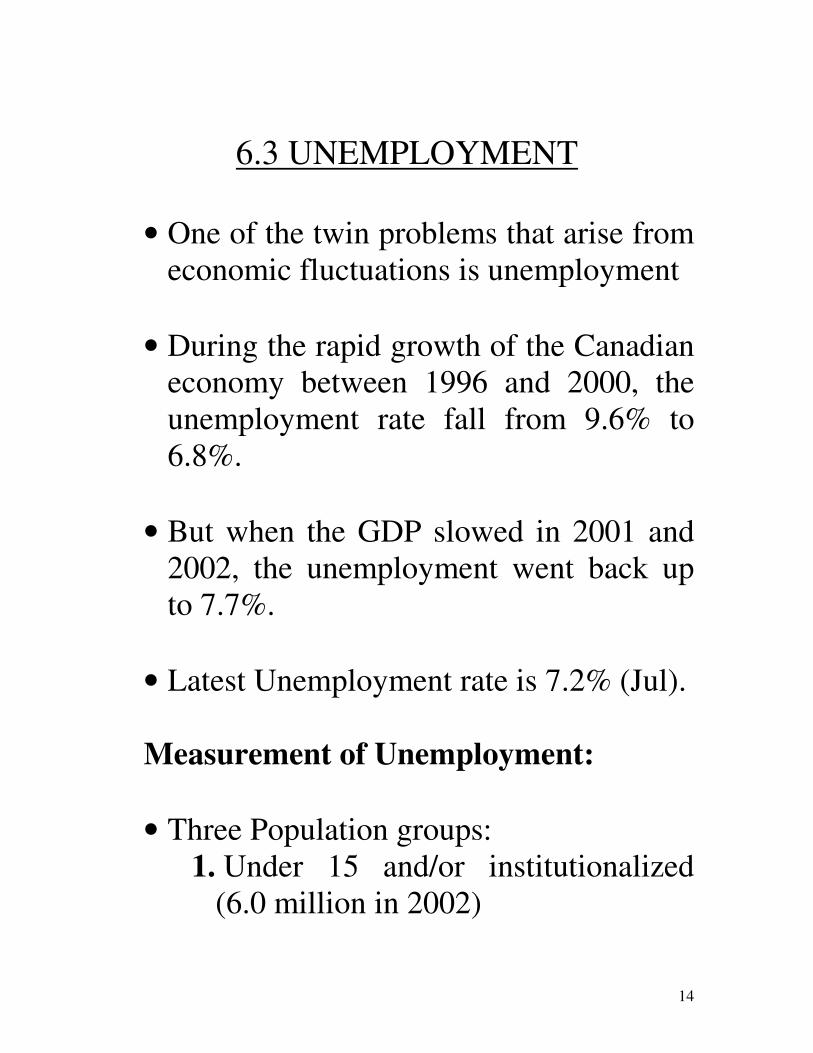
• One of the twin problems that arise from
economic fluctuations is unemployment • During the rapid growth of the Canadian
economy between 1996 and 2000, the unemployment rate fall from 9.6% to 6.8%.
• But when the GDP slowed in 2001 and
2002, the unemployment went back up to 7.7%.
• Latest Unemployment rate is 7.2% (Jul).
Measurement of Unemployment: • Three Population groups:
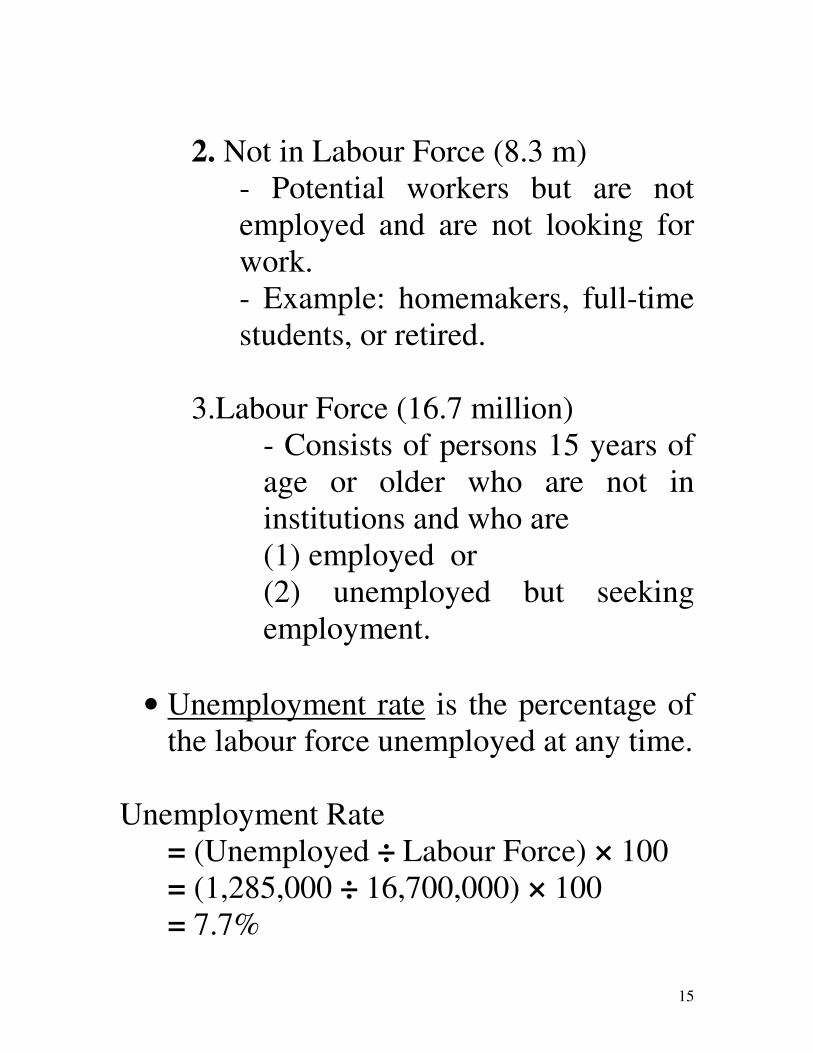
1. Under 15 and/or institutionalized (6.0 million in 2002)
15
2. Not in Labour Force (8.3 m)
- Potential workers but are not employed and are not looking for work. - Example: homemakers, full-time students, or retired.
3.Labour Force (16.7 million) - Consists of persons 15 years of age or older who are not in institutions and who are (1) employed or (2) unemployed but seeking employment.
• Unemployment rate is the percentage of
the labour force unemployed at any time. Unemployment Rate = (Unemployed ÷ Labour Force) × 100 = (1,285,000 ÷ 16,700,000) × 100 = 7.7%
16
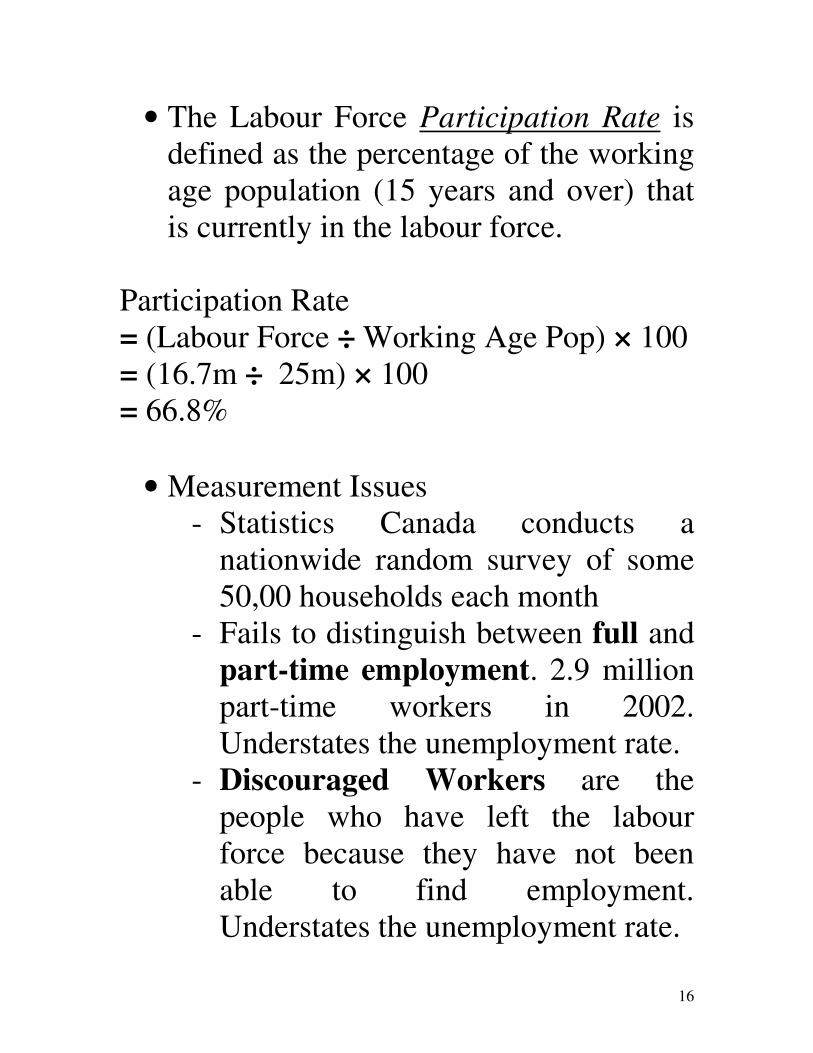
• The Labour Force Participation Rate is defined as the percentage of the working age population (15 years and over) that is currently in the labour force.
Participation Rate = (Labour Force ÷ Working Age Pop) × 100 = (16.7m ÷ 25m) × 100 = 66.8%
• Measurement Issues - Statistics Canada conducts a
nationwide random survey of some 50,00 households each month
- Fails to distinguish between full and part-time employment. 2.9 million part-time workers in 2002. Understates the unemployment rate.
- Discouraged Workers are the people who have left the labour force because they have not been able to find employment. Understates the unemployment rate.
17
Types of Unemployment:
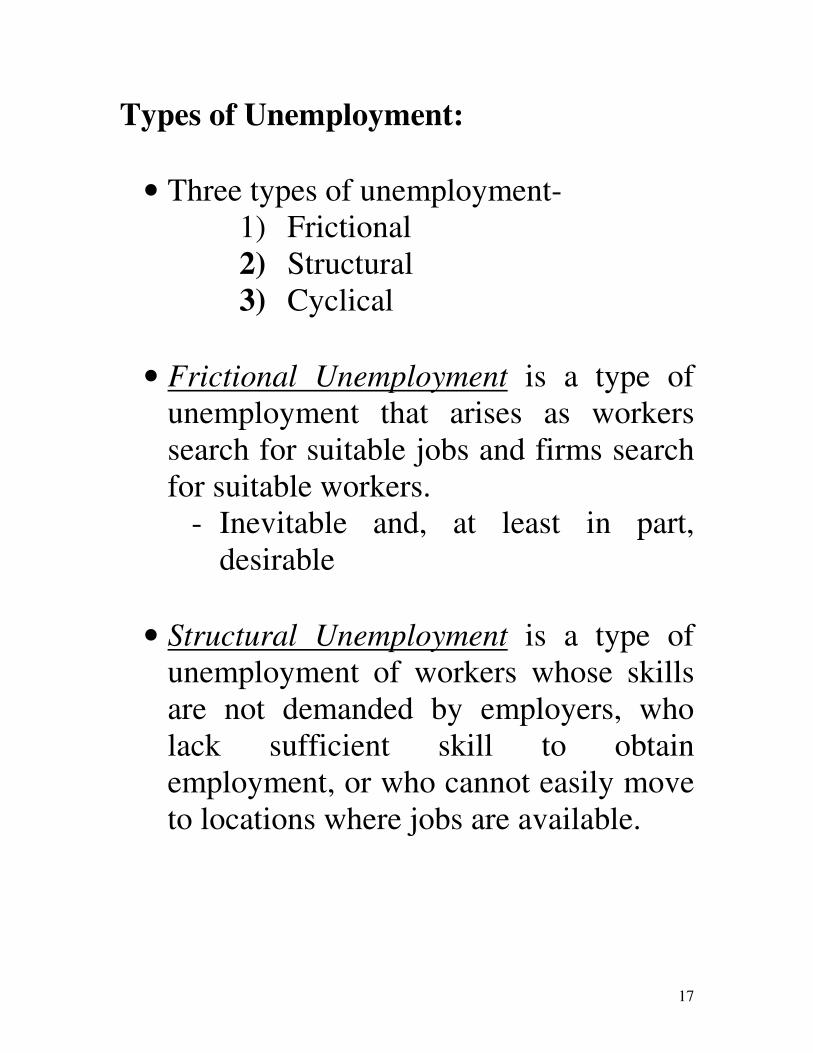
• Three types of unemployment- 1) Frictional 2) Structural 3) Cyclical
• Frictional Unemployment is a type of unemployment that arises as workers search for suitable jobs and firms search for suitable workers.
- Inevitable and, at least in part, desirable
• Structural Unemployment is a type of
unemployment of workers whose skills are not demanded by employers, who lack sufficient skill to obtain employment, or who cannot easily move to locations where jobs are available.
18
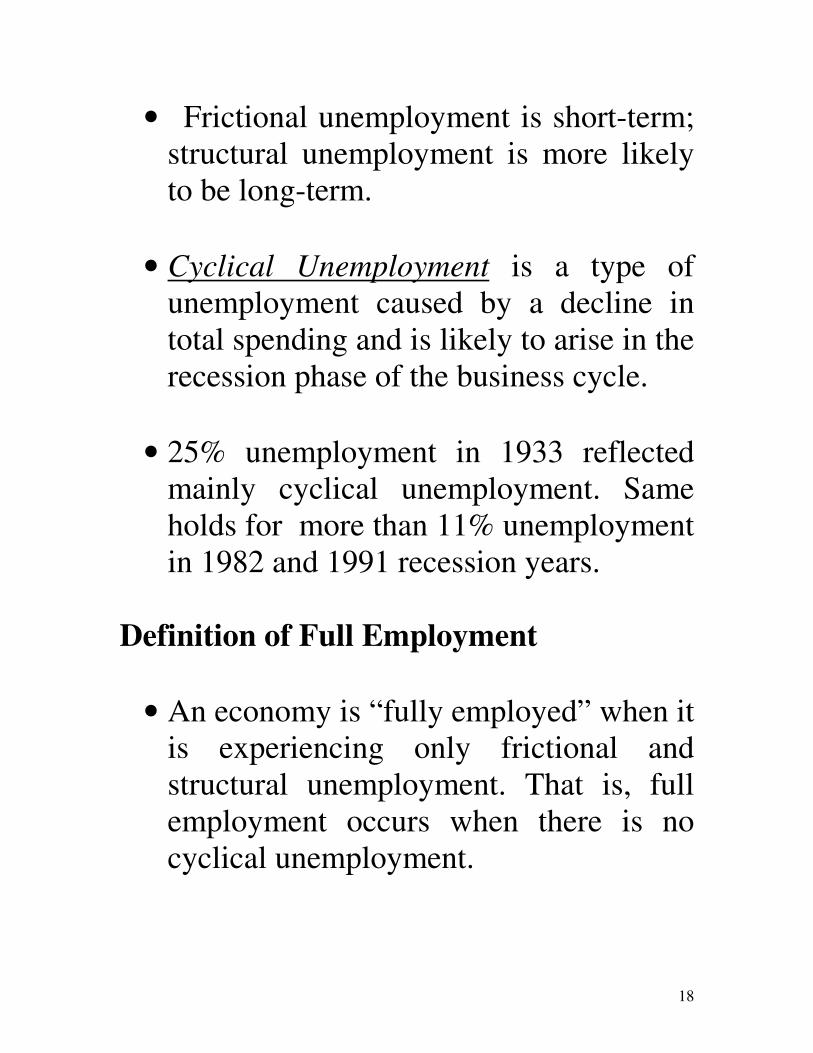
• Frictional unemployment is short-term; structural unemployment is more likely to be long-term.
• Cyclical Unemployment is a type of
unemployment caused by a decline in total spending and is likely to arise in the recession phase of the business cycle.
• 25% unemployment in 1933 reflected
mainly cyclical unemployment. Same holds for more than 11% unemployment in 1982 and 1991 recession years.
Definition of Full Employment
• An economy is “fully employed” when it is experiencing only frictional and structural unemployment. That is, full employment occurs when there is no cyclical unemployment.
19
• The unemployment rate that is consistent with full employment is called the full-employment rate of unemployment, or the natural rate of unemployment (NRU).
• The Potential GDP is the real output an
economy can produce when it fully employs its available resources, i.e., at the natural rate of unemployment.
• “Natural” does not mean that the
economy will always operate at this rate and thus realize its potential output.
• NRU can vary over time. In 1980s, it
was 7.5%. Currently, it is estimated to be 6 to 7%. Why the decline?
- A larger proportion of middle-aged workers.
- The growth of temporary-help agencies and the internet
20
Economic Cost of Unemployment:
• The basic economic cost of unemployment is foregone output.
• When the economy fails to create
enough jobs for all who are able and willing to work, potential production of goods and services is irretrievably lost.
• The GDP gap is the amount by which
actual domestic product falls below potential gross domestic product.
GDP gap = actual GDP – potential GDP
• The GDP gap can be either negative or
positive. • A high unemployment rate means a
large GDP gap (negative), and a low unemployment rate means a small or even positive GDP gap.
21
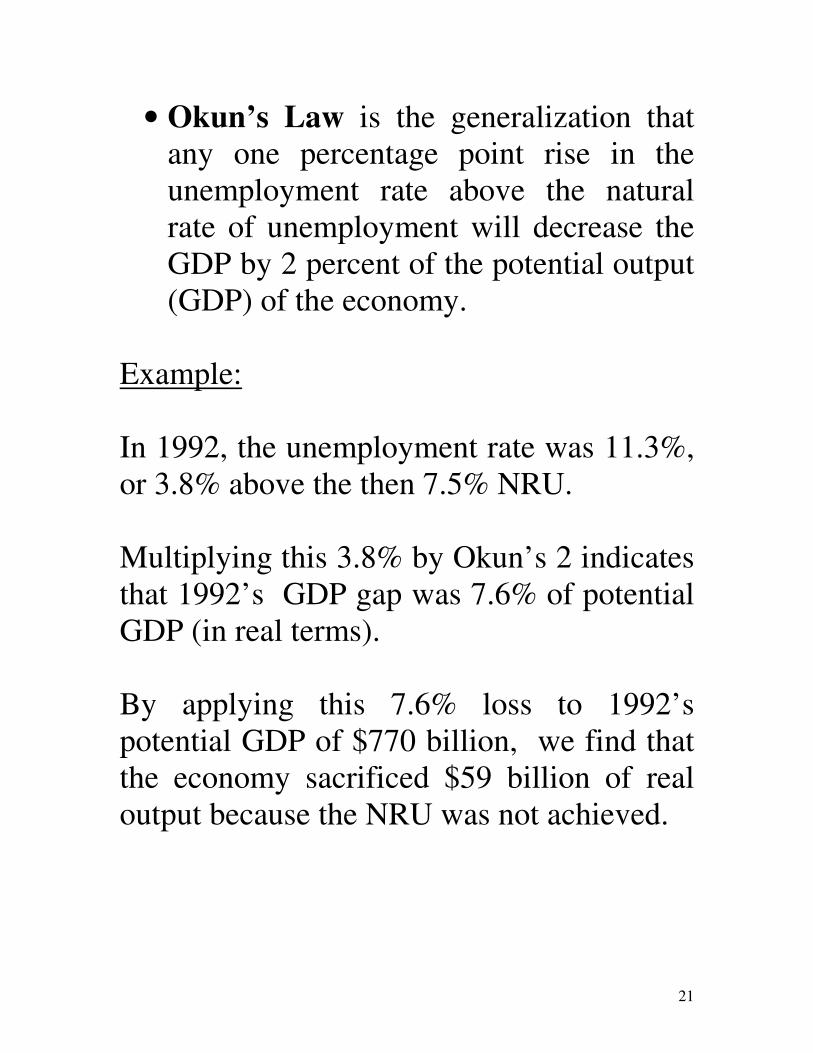
• Okun’s Law is the generalization that any one percentage point rise in the unemployment rate above the natural rate of unemployment will decrease the GDP by 2 percent of the potential output (GDP) of the economy.
Example: In 1992, the unemployment rate was 11.3%, or 3.8% above the then 7.5% NRU. Multiplying this 3.8% by Okun’s 2 indicates that 1992’s GDP gap was 7.6% of potential GDP (in real terms). By applying this 7.6% loss to 1992’s potential GDP of $770 billion, we find that the economy sacrificed $59 billion of real output because the NRU was not achieved.
22
• Unequal Burdens of Unemployment. - Lower-skilled workers, teenagers,
and less educated workers bear a disproportionate burden of employment.
- The unemployment rates for men
and women are very similar.
• Non-economic costs of severe cyclical unemployment are very high. It is a social catastrophe.
• Unemployment rate varies across
regions on Canada. For 2002 the national rate was 7.7% but as high as 16.9% in Newfoundland and as low as 5.2% in Manitoba.
• Unemployment rates differ greatly
among nations at any given time. One reason is that nations have different
23
NRU. Another is that nations may be in different phases of their business cycles.
• Between 1993 and 2002, the Canadian
unemployment came down steadily, and by the turn of the millennium Canada had an unemployment rate still above many other industrialized countries (U.K., U.S. and Japan)
6.4 INFLATION
• Inflation is a rise in the general level of
prices in an economy. Measurement of Inflation:
• Consumer Price Index (CPI) is an index that measures the prices of a fixed “market basket” of goods and services (over 600) that is bought by a “typical” consumer.

24
CPI of 2003 = (Price of the base year basket in 2003 ÷ Price of the same basket in the base (1992) year) × 100 Example: Rate of Inflation = [(119-116.4) ÷ 116.4]×100 = 2.2 %
• Rule of 70
-With a 3 percent annual rate of inflation the price level will double in about 23 years (=70÷3).
- Inflation of 8 percent per year will
double the price level in about 9 years (=70÷8).
• Facts of Inflation
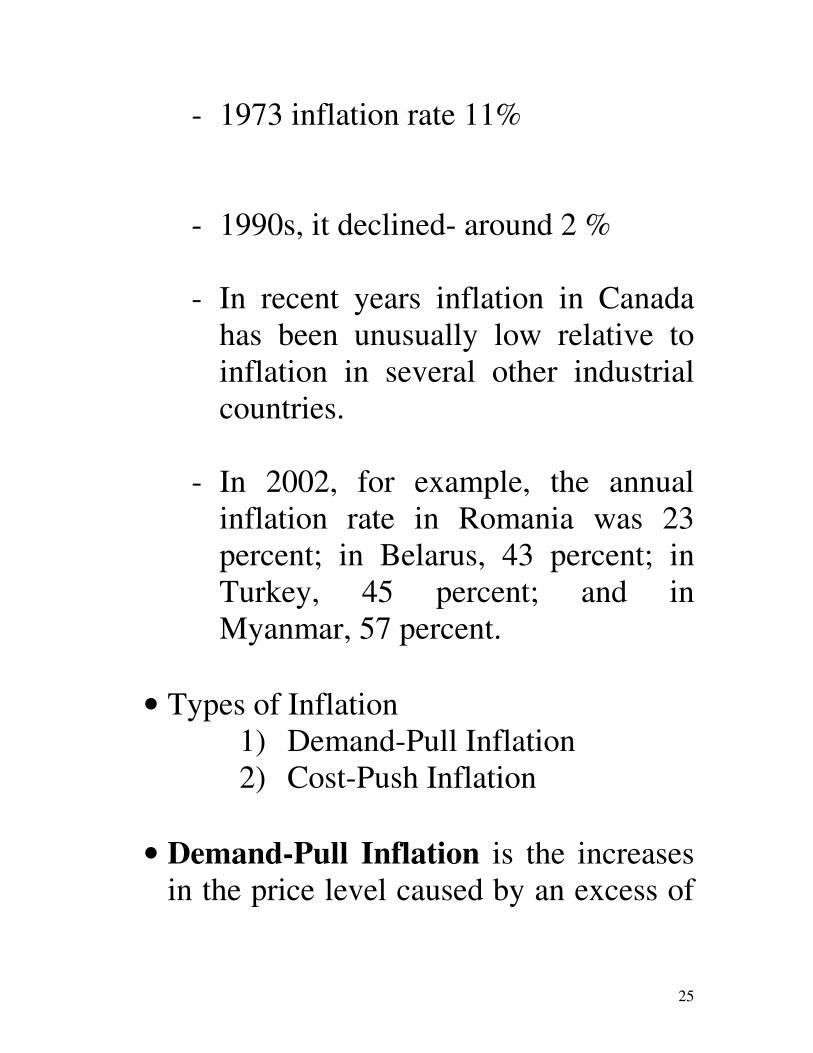
- 1981 inflation rate 12.5%
25
- 1973 inflation rate 11%
- 1990s, it declined- around 2 % - In recent years inflation in Canada
has been unusually low relative to inflation in several other industrial countries.
- In 2002, for example, the annual
inflation rate in Romania was 23 percent; in Belarus, 43 percent; in Turkey, 45 percent; and in Myanmar, 57 percent.
• Types of Inflation
1) Demand-Pull Inflation 2) Cost-Push Inflation
• Demand-Pull Inflation is the increases
in the price level caused by an excess of
26
total spending beyond the economy’s capacity to produce.
• The essence of demand-pull inflation is
“too much spending chasing too few goods”.
• Cost-Push Inflation is the increases in
the price level resulting from an increase in resource costs and hence in per unit production costs.
• Per-unit production cost = Total Input Cost ÷ Units of Output • Major sources of cost-push inflation
have been so-called supply shocks. • For example, the rocketing prices of
imported oil in 1973-74 and again in 1979-80 increased the costs of producing and transporting virtually every product
27
in the economy, and thus cost-push inflation ensued.
• Complexities It is often difficult to distinguish between demand-pull and cost-push inflation unless the original source of inflation is known.
6.5 Redistribution Effects of Inflation
• Inflation hurts some people, leaves
others unaffected, and actually helps still others.
Nominal and Real Income: • Nominal income is the number of
current dollars received as wages, rent, interest, or profits.
• Real income is a measure of the amount
of goods and services nominal income
28
can buy; it is the purchasing power of nominal income, or income adjusted for inflation.
Real income = (Nominal Income ÷ Price Index) × 100
• Real income will remain the same when nominal income rises at the same rate as the price index.
• But when inflation occurs, not every one’s nominal income rises at the same pace as the price index.
Rule of thumb: % change in real income = (% change in nominal income - % change in price level).
Example: 4% = 10% - 6%
• Expectations
29
• Anticipated or expected inflation is
the increases in the price level that occur at the expected rate.
• With an anticipated inflation an
income receiver may be able to avoid or lessen the adverse effects of inflation on real income.
• Unanticipated inflation is the
increases in the price level that occur at a rate greater than expected.
Who is Hurt by inflation?
• Unanticipated inflation hurts people on fixed incomes, savers, and creditors. It redistributes income away from them and toward others.
• Fixed-Income Receivers
30
- Their real income fall when inflation occurs
- An elderly couple living on a private pension or annuity
- Landlords who receive lease payments of fixed dollar amounts
- Public sector workers whose incomes are dictated by fixed pay schedules
- Minimum-wage workers - Families living on fixed welfare
incomes
• Savers - Unanticipated inflation hurts savers - The purchasing power of an
accumulated savings deteriorates Example: A HH saves $1000 in GIC in a bank with 6% annual interest rate,
31
With 13% inflation rate, the real value will be cut to about $938 by the end of the year. Saver will receive $1060 (1000 + 60 of interest). But deflating 1060 for 13% means that its real value is only about 938 =(1060 ÷1.13).
• Creditors - Unanticipated inflation harms
creditors (lenders). - Suppose Bank of Montreal lends
Bob $1000, to be paid in two years. If in that time the price doubles, the $1000 that Bob repays will have only half the purchasing power of the $1000 he borrowed.
32
Who is Unaffected or Helped by Inflation?
• Flexible-income Receivers - Individuals who derive their income
solely from social programs are largely unaffected by inflation, because payments are indexed to the CPI.
- Some union workers also get automatic cost-of living adjustments (COLAS) in therir pay whenCPI rises.
- COLA is am automatic increase in
the income (wages) of workers when inflation occurs.
33
- Rapid inflation may cause some nominal income to rise at faster pace than the price level, thereby enhancing their real income. - Example: Property owners faced
with an inflation-induced real-state boom may able to raise rents more rapidly than the rate of inflation
• Debtors
- Unanticipated inflation benefits debtors (borrowers)
- In our previous example, Bank of Montreal’s loss of real income from inflation is Bob’s gain of real income
- Historical example: the inflation of 1970s and 1980s created a windfall of capital gains for people who purchased homes in earlier periods with low, fixed-interest-rate mortgages.
34
Anticipated Inflation
• If inflation is anticipated, the effects of inflation may be less severe, since wage and pension contracts may have inflation clauses built in, and interest rates will be high enough to cover the cost of inflation to savers and lenders.
• Inflation premium is amount that
nominal interest rate is raised to cover effects of anticipated inflation.
Nominal Interest Rate = Real Interest Rate + Inflation Premium
• Real interest is the interest rate expressed in dollars of constant value
(adjusted for inflation) • Nominal interest rate is the interest rate
expressed in terms of annual amounts currently charged for interest and not adjusted for inflation
35
Final Points
• Deflation is defined as a decline in price level.
- Unexpected deflation will have the opposite effect of unexpected inflation.
• Mixed effects - Many families are simultaneously
helped and hurt by inflation because they are both borrowers and earners and savers.
• Arbitrariness
- Effects of inflation are arbitrary, regardless of society’s goals and values.
36
Output Effects of Inflation
• Cost-push inflation, where resource prices rise unexpectedly, could cause both output and employment to decline. Real income falls.
• Mild inflation (<3%) has uncertain
effects. It may be a healthy by-product of a prosperous economy, or it may have an undesirable impact on real income.
• Danger of creeping inflation turning into
hyperinflation, which can cause speculation, reckless spending, and more inflation (see examples in text of Hungary and Japan following World War II, and Germany following World War I).