Embed Size (px)
Citation preview
Lecture -- 6 -- Start

Outline
1. Science, Method & Measurement2. On Building An Index3. Correlation & Causality4. Probability & Statistics5. Samples & Surveys6. Experimental & Quasi-experimental Designs7. Conceptual Models8. Quantitative Models9. Complexity & Chaos10. Recapitulation - Envoi

Outline
1. Science, Method & Measurement2. On Building An Index3. Correlation & Causality4. Probability & Statistics5. Samples & Surveys6. Experimental & Quasi-experimental Designs7. Conceptual Models8. Quantitative Models9. Complexity & Chaos10. Recapitulation - Envoi

Quantitative Techniques for Social Science Research
Ismail SerageldinAlexandria
2012
Lecture # 6:Experimental And
Quasi-Experimental Designs
There are many outstanding texts for this section of the course…


This one is a classic:

And these two are excellent for medical studies

But for now, just follow the presentation

ExperimentalAnd
Quasi-Experimental Designs

How to Design Studies To Test Hypotheses

We want to test a new treatment (teaching method, m edicine, etc.) and know what effect it will have. We design a study
based on studying small samples of the Population
Source: Statistics, Cliffs Quick Review, Wiley, NY, 2001

So we formulate the Null Hypothesis (no difference in
applying the new treatment) and we think of how to sample and
how to test.

Remember:Two Types Of Error
• Type I (α): reject the null-hypothesis when the null-hypothesis is true, and
• Type II (β): fail to reject the null-hypothesis when the null-hypothesis is false
• These are also referred to as false positive and false negative

Experimental and Quasi-experimental Designs

Importance of Proper Experimental Design
• Confidence in validity of resulting data
• Confidence in appropriateness and quality of statistical analysis (in relation to the data sets)
• Appropriate controls of internal and external sources of invalidity

BUT:Depending on how we set up the
experiment we have two other types of problems:

Internal & External Validity
• Internal Validity question: Is the data I have collected interpretable? Can I say what I want to say about this data and my statement would be valid?
• External Validity question: Are these (valid) findings generalizable beyond this experiment? To what populations, settings, treatments, and measurable variables can the recorded effect be generalized?

So what affects Internal Validity?

Internal Sources of Invalidity
• History• Maturation• Testing• Instrumentation• Regression• Selection• Mortality• Interaction of selection and others
Source: Donald Campbell and Julian Stanley, Experimental and quasi-experimental designs for Research, Wadsworth Publishing; 1 edition (July 13, 1963)

And what affects External Validity?

External Sources of Invalidity
• Interaction of Testing and X• Interaction of selection and X• Reactive arrangements• Multiple X interference
Source: Donald Campbell and Julian Stanley, Experimental and quasi-experimental designs for Research, Wadsworth Publishing; 1 edition (July 13, 1963)

No Design Is Perfect --Different Designs Have
Different Strengths

So let’s first discuss the Internal and External Validity issues

Noting that In many of our designs we will have :
• More than one observation of the group (e.g. once before and once after the treatment)
• We may have more than one group only one of which is subjected to the treatment (the other being a control group)
• Some selections will be randomizedsamples, but not in all cases.

Internal Validity Issues• Internal validity issues are those
extraneous variables which, if not controlled in the experimental design, could produce results confused with the effect of the experimental stimulus. Thus each represents the effects of a possible source of invalidity in the conclusions.
Source: Donald T. Campbell and Julian C. Stanley; E xperimental and Quai-Experimental designs for resea rch; Rand McNally, Chicago, USA, 1963

Internal Sources of Invalidity
• History• Maturation• Testing• Instrumentation• Regression• Selection• Mortality• Interaction of selection and others

Internal Validity Issues
• History: The specific events occurring between the first and second measurement (other than the experimental variable).
• Maturation: Changes occurring in the respondents simply by the passage of time.

Internal Validity Issues (cont)
• Testing: The effect of taking a test on the scores of the second test.
• Instrumentation: Changes in the calibration of the instrument, the observers, or scorers, that could change the measurement.

Internal Validity Issues (cont)
• Statistical regression: The phenomenon occurs whenever the groups have been selected on the basis of extreme scores.
• Selection: Biases in the selection of the comparator groups.
Source: Donald T. Campbell and Julian C. Stanley; E xperimental and Quai-Experimental designs for resea rch; Rand McNally, Chicago, USA, 1963

Internal Validity Issues (cont)
• Experimental Mortality: The differential loss of respondents from the comparison groups.
• Selection -Maturation Interaction: In some complex design such effects could be confused for the effect of the experimental variable.

External Validity (representativeness) Issues
• These issues relate to the representativeness of the experiment, and hence to the generalizability of the measured result to the total population.
Source: Donald T. Campbell and Julian C. Stanley; E xperimental and Quai-Experimental designs for resea rch; Rand McNally, Chicago, USA, 1963

External Sources of Invalidity
• Interaction of Testing and X• Interaction of selection and X• Reactive arrangements• Multiple X interference

External Validity (representativeness) Issues
• Interaction effects of Testing & X: : The effect of pretest loss of respondents from the comparison groups.
• Interaction effects of Selection & X: differential selection that can interact differently with the experimental variable could be confused for the effect of the experimental variable.
Source: Donald T. Campbell and Julian C. Stanley; E xperimental and Quai-Experimental designs for resea rch; Rand McNally, Chicago, USA, 1963

External Validity (representativeness) Issues (cont)• Reactive Arrangements: The interactive effect
of pretest on the group being studied makes the group no longer representative of the population they were selected to represent.
• Multiple Treatment Interference: this is likely to occur whenever multiple treatments are applied to the same respondents, as the effects of prior treatments are usually not erasable. (This is a particular problem with one-group designs of type 8 & 9).
Source: Donald T. Campbell and Julian C. Stanley; E xperimental and Quai-Experimental designs for resea rch; Rand McNally, Chicago, USA, 1963

In fact, There is a whole area of study that looks for measures that do not impact directly
on the respondents

Remember:No Design Is Perfect --Different Designs Have
Different Strengths
So let’s discuss experimental and quasi-experimental designs
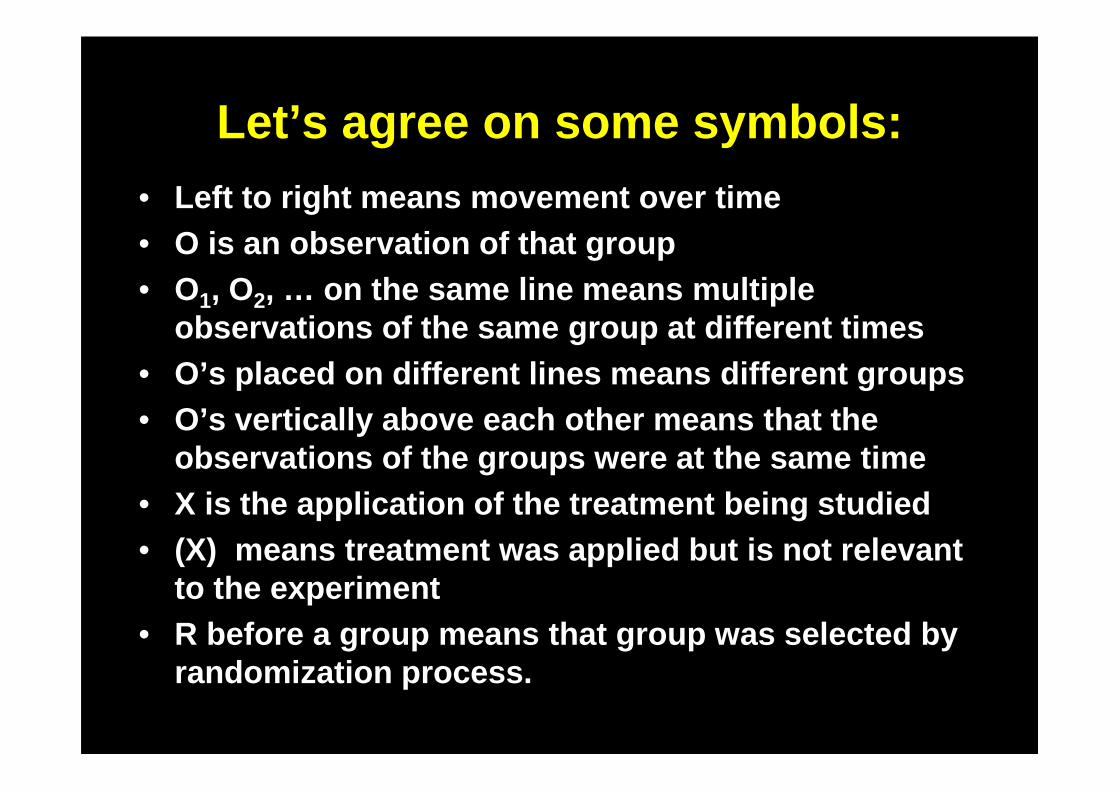
Let’s agree on some symbols:• Left to right means movement over time• O is an observation of that group• O1, O2, … on the same line means multiple
observations of the same group at different times• O’s placed on different lines means different group s• O’s vertically above each other means that the
observations of the groups were at the same time• X is the application of the treatment being studied• (X) means treatment was applied but is not relevan t
to the experiment• R before a group means that group was selected by
randomization process.

1. One Shot Case Study
X O
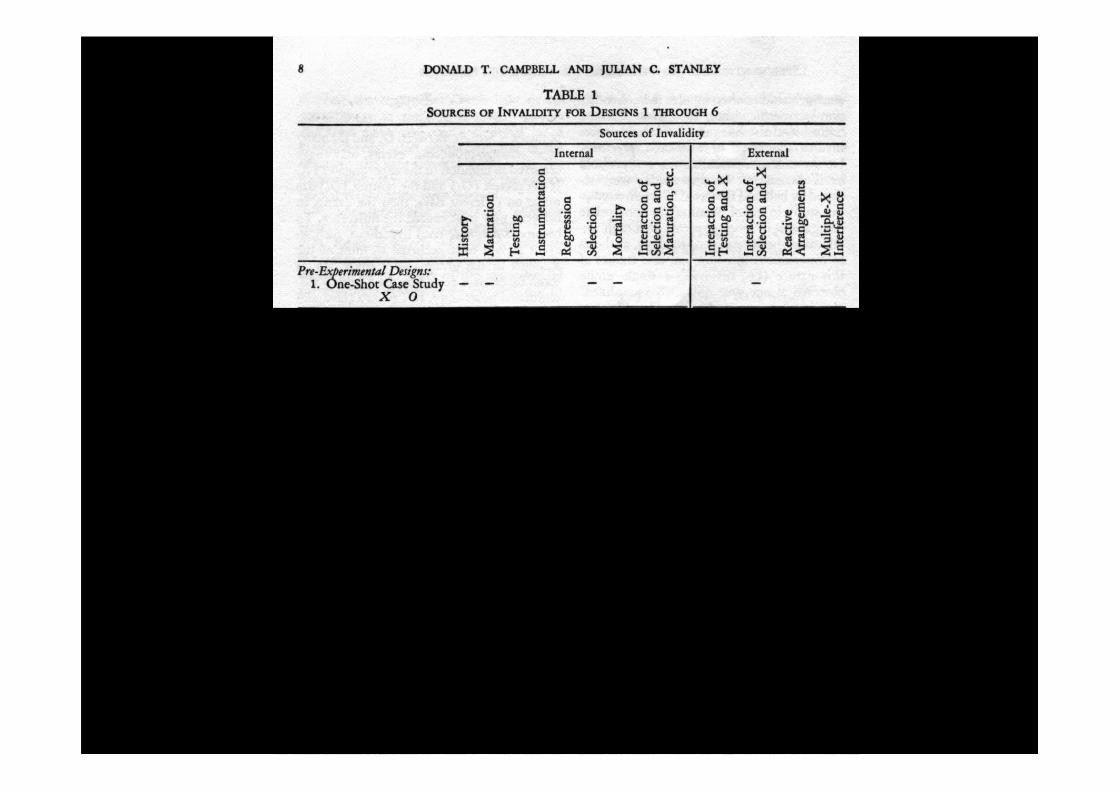

• Example : Freudian Psycho Analysis• Individual Case Study• No generalization possible

2. One-Group Pretest-Posttest Design
O X O

This is a really BAD design• Internal invalidity that can explain O 1 – O2 difference:
– History: many other things could have happened between O 1 & O2 . In social science you cannot have experimental isolation as in the natural sciences labs.
– Maturation: between O 1 & O2 students could have grown older, hungrier, more tired, etc.
– Testing: that is the effect measured is the effect of the pretest O 1 not the treatment X
– Instrumentation (decay) The observers themselves can get tired, etc. accounting for a part if not al l of the O 1 – O2 change


Further problems with design 2
• Again applies only to the group being tested (no generalizability), plus
There is also regression towards the mean …

Regression towards the mean

Prediction PredictionFrom Homogeneous Pretest Groups
To Mean Posttest
To MeanPosttest
From HomogeneousPosttest Groups
13 13
7
Fig. 1b. Fig. 1c.
Fig. 1. Regression in the Prediction of Posttest Sco res from Pretest, and Vice Versa
7
8
9
10
11
12
11
10
9
12
8

Thus if you were to take observations and try to predict from the post test to the pre test or vice versa, you would get markedly different results, due to
this phenomenon.

Pretest Scores
7 8 9 10 11 12 13 Mean Posttest
13 1 1 1 1 11.5
12 1 1 2 1 1 11.0
11 1 2 3 3 2 1 10.5
10 1 1 3 4 3 1 1 10.0
9 1 2 3 3 2 1 9.5
8 1 1 2 1 1 9.0
7 1 1 1 1 8.5
8.5
9.0
9.5
10.0
10.5
11.0
11.5
Mean
Pretest
Regression line bshowingbest prediction from pretest to posttest.
Posttest Scores
Regression line cshowingbest prediction from posttest to pretest.
Fig. 1a. Frequency Scatter of Posttest Scores for Each Cla ss of Pretest Scores, and Vice Versa.

3. Static group Comparison
X O-----------------
O

Examples
• Comparinga school system that requires a bachelor’s degree for teachers with one that does not
• Comparing classes that have received extra lectures to others that have not
The fundamental problem:• There is no way of certifying that the two
groups would have been the same except for X (This will be controlled in Design 6 later)

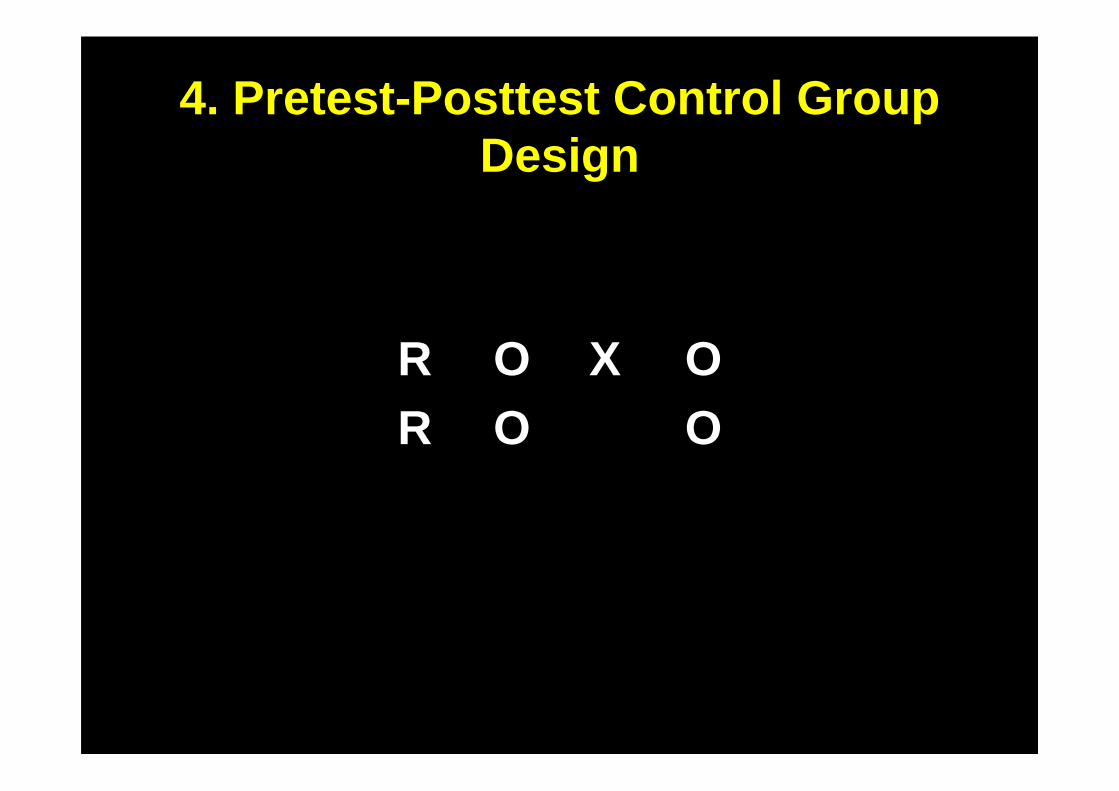
4. Pretest-Posttest Control Group Design
R O X OR O O

Now, this is much better… Note:
we are comparing a single X with no X


This type of test design, and the next (the Solomon Four-Group design) are
standard in many of clinical studies.
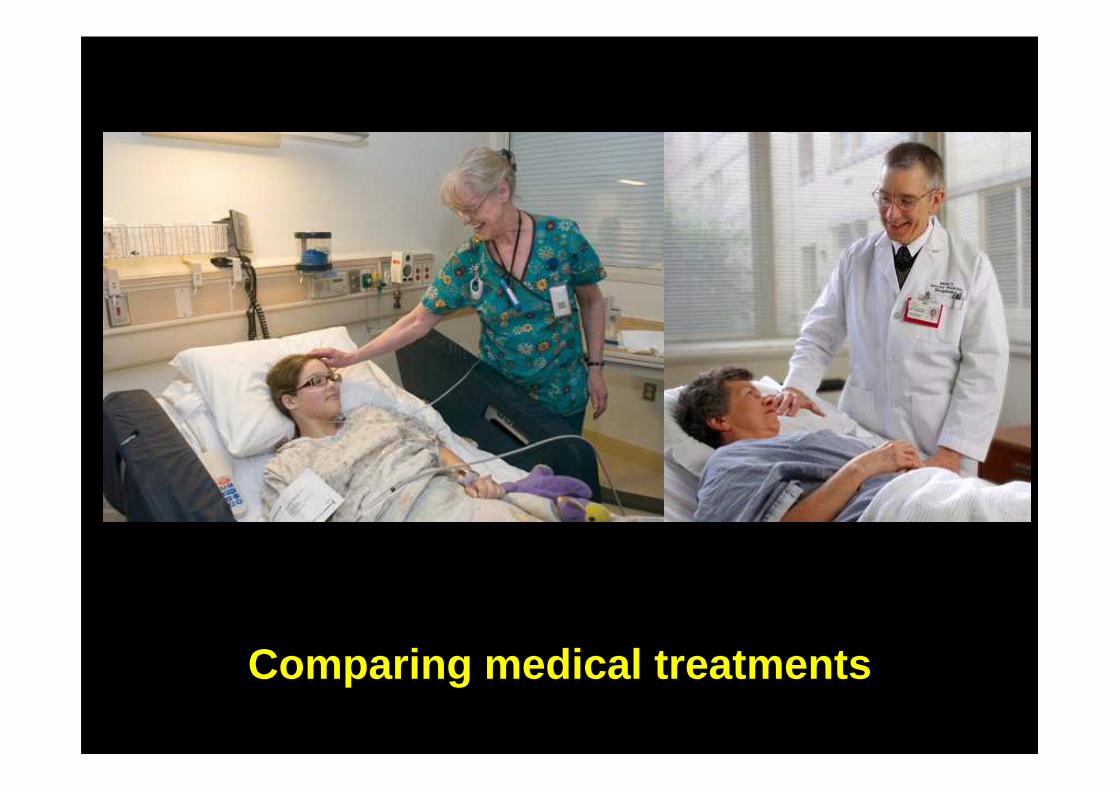
Comparing medical treatments

Is this treatment really effective?

So we need careful clinical trials and careful statistical analysis

Double blind designs (control groups) is usually preferred

Does this medicine have unacceptable side effects?

Which is the real test medicine and which is the placebo?

Is it Medicine or a placebo?

Who is the test case and who is the control?

We want to be sure of the safety and effectiveness of the medicines we give our
children…

But you also need to compare new treatments with existing (known)
treatments

5. Solomon Four-Group Design
R O1 X O2
R O3 O4
R X O5
R O6
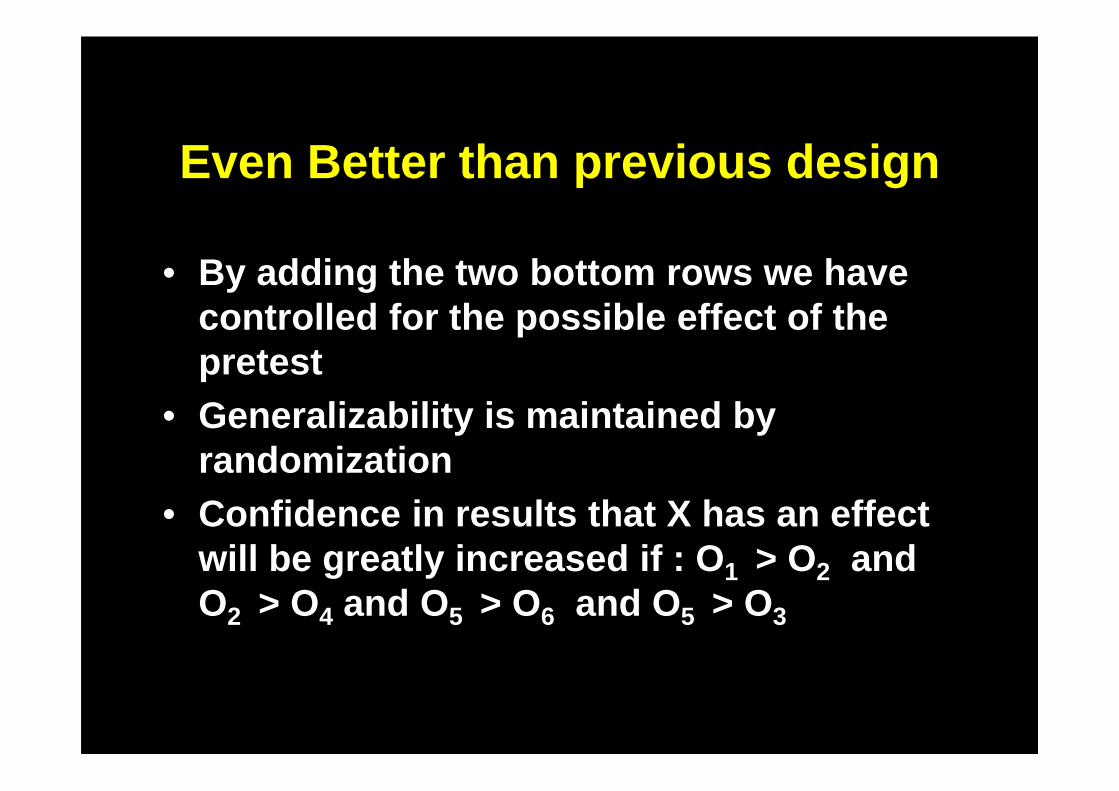
Even Better than previous design
• By adding the two bottom rows we have controlled for the possible effect of the pretest
• Generalizability is maintained by randomization
• Confidence in results that X has an effect will be greatly increased if : O 1 > O2 and O2 > O4 and O5 > O6 and O5 > O3

Again:
R O1 X O2
R O3 O4
R X O5
R O6
• Confidence in results that X has an effect will be greatly increased if :O2 > O1 and O2 > O4 and O5 > O6 and O5 > O3


But do we really need all that?Let’s look at the bottom part of the last
design:

6. Posttest-Only Control Group Design
R X OR O

If you believe in randomization, then we do not really need the pretest and this
design is just as good as the preceding ones with the pretest.


WOW!


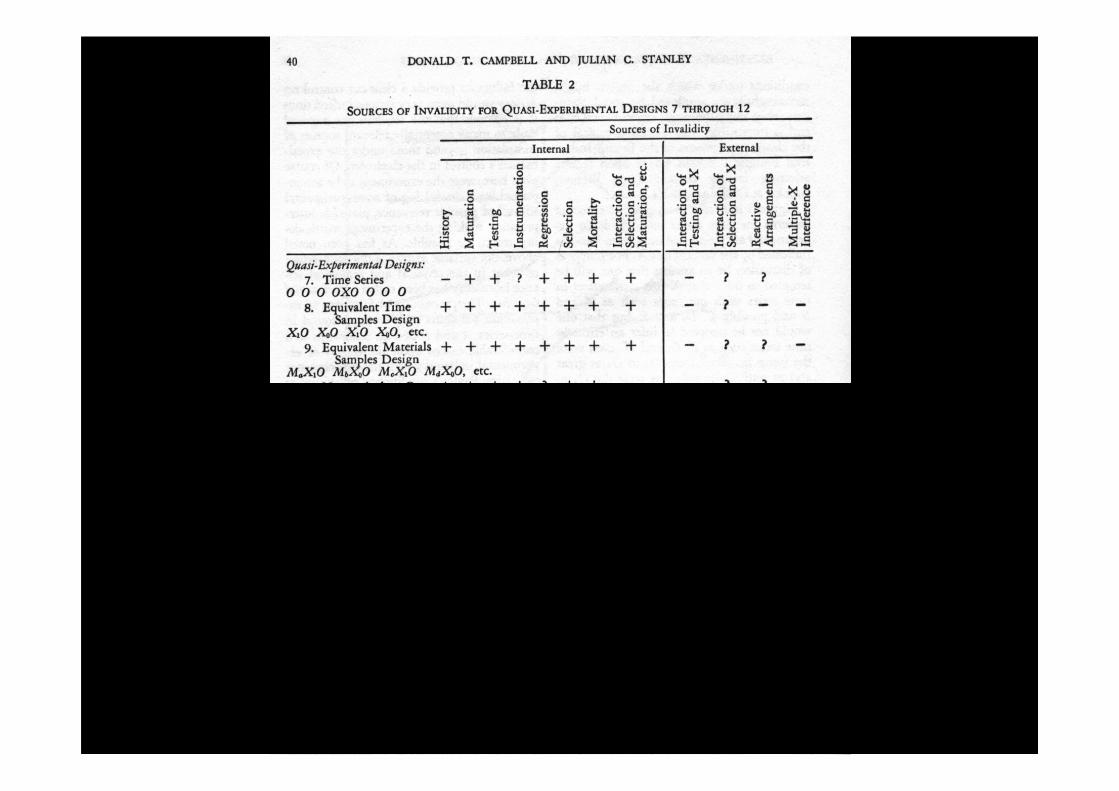
7. Time Series
O O O O X O O O O


Remember the really BAD design 2…
Design 2: One-Group Pretest-Posttest Design:
O X O
• If you take only the two points around the application of X you have design 2 applied to many different groups being tested for different Xs

Introduction of an experimental variable at
point X into a time series of
measurements, O 1 – O8Some possible outcome
patterns
• Except for D , which is flat, the gain O 4 – O5 is the same in all the time series
O1 O2 O3 O4 O5 O6 O7 O8
X
XA
B
C
DE
F
G
H
Source: Donald Campbell and Julian Stanley, Experimental and quasi-experimental designs for Research, Wadsworth
Publishing; 1 edition (July 13, 1963)

Now lets give those two points some context:
Let’s add all the observations

Introduction of an experimental variable at
point X into a time series of
measurements, O 1 – O8Some possible outcome
patterns
• Now Add Context:• The legitimacy of
inferring an effect varies widely:– Strongest in A and B– Possible in C, D and E – Totally unjustified in F,
G and H.
O1 O2 O3 O4 O5 O6 O7 O8
X
XA
B
C
D
E
F
G
H
Source: Donald Campbell and Julian Stanley, Experimental and quasi-experimental designs for Research, Wadsworth
Publishing; 1 edition (July 13, 1963)

So
• Generally not very comforting design when we look at any one of the time series alone. Because of inability to control History (what other effects are affecting the group).
• Plus:– Absence of controls– Absence of generalizability

8. Equivalent Time Samples Design
X1O X0O X1O X0O, etc.

What is happening here…
• This is repeated testing and observation of a group
• The real test X 1 is introduced intermittently followed by an observation, with other (non) tests X 0 being introduced before other observations
• This can work if the effect of the X is transient• Example telling students that “this is a test”
and then doing it every week, but not telling them which ones of these tests will count for the final grade! Controls factors such as anxiety of respondents (students).


9. Equivalent Materials Samples Design
MaX1O MbX0O McX1O MdX0O, etc.

9. Equivalent Materials Samples Design
MaX1O MbX0O McX1O MdX0O, etc.
This design changes some things in the materials used for the test itself in addition to the previous design which is interwoven with
it. Internally valid, but again externally not valid
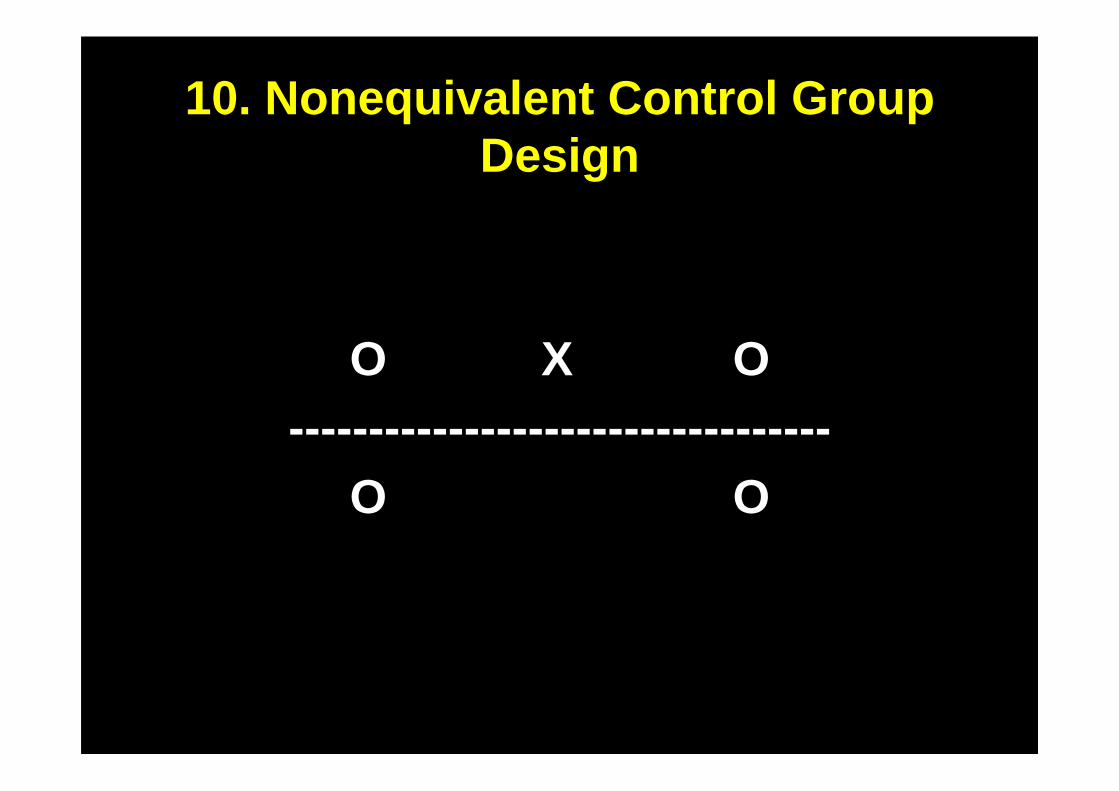
10. Nonequivalent Control Group Design
O X O----------------------------------
O O

Why would we use this design?
• Because you frequently cannot randomize, and have to use equivalent convenience samples, e.g. class rooms in schools or schools in a district, or production units in an institution and test all the people in that class, school or production unit.
• Accordingly, we cannot control interaction of selection and maturation etc.
• Again, external validity (i.e. generalizability) is questionable.


11. Counterbalanced Designs
X1O X2O X3O X4O----------------------------------
X2O X4O X1O X3O----------------------------------
X3O X1O X4O X2O----------------------------------
X4O X3O X2O X1O

Why this complicated design?
• To enter each respondent (or respondent group) into each type of treatment once.
• The design is orthogonal (each combination of X i and O t occurs once).
• Good for multiple treatment testing.
• PS: the design is also called a Latin -square design.

Orthogonal: you can change the columns and /or rows in
the table(s)
X1O X2O X3O X4O----------------------------------
X2O X4O X1O X3O----------------------------------
X3O X1O X4O X2O----------------------------------
X4O X3O X2O X1O
T1O T2O T3O T4O X1O X2O X3O X4O
T1O T2O T3O T4O----------------------------------
T2O T4O T1O T3O----------------------------------
T3O T1O T4O T2O----------------------------------
T4O T3O T2O T1O
A------
B------
C-------
D

Which of these medicines is most effective?


12. Separate -Sample Pretest-Posttest Design
R O (X)R X O

When to use this Design?
• When the X has to be administered to all, and we can control who gets it and who does not, but we want to test for its effect
• Thus we rely on the randomization to establish the representativity of the pre-test and the post-test.
• It is much stronger than Design 2 and should not be confused with it.


12a. Separate -Sample Pretest-Posttest Design
R O (X)R X O----------------------------------------R O (X)R (X) O


12b. Separate -Sample Pretest-Posttest Design
R O1 (X)R O2 (X)R X O3


12c. Separate -Sample Pretest-Posttest Design
R O1 X O2
R X O3


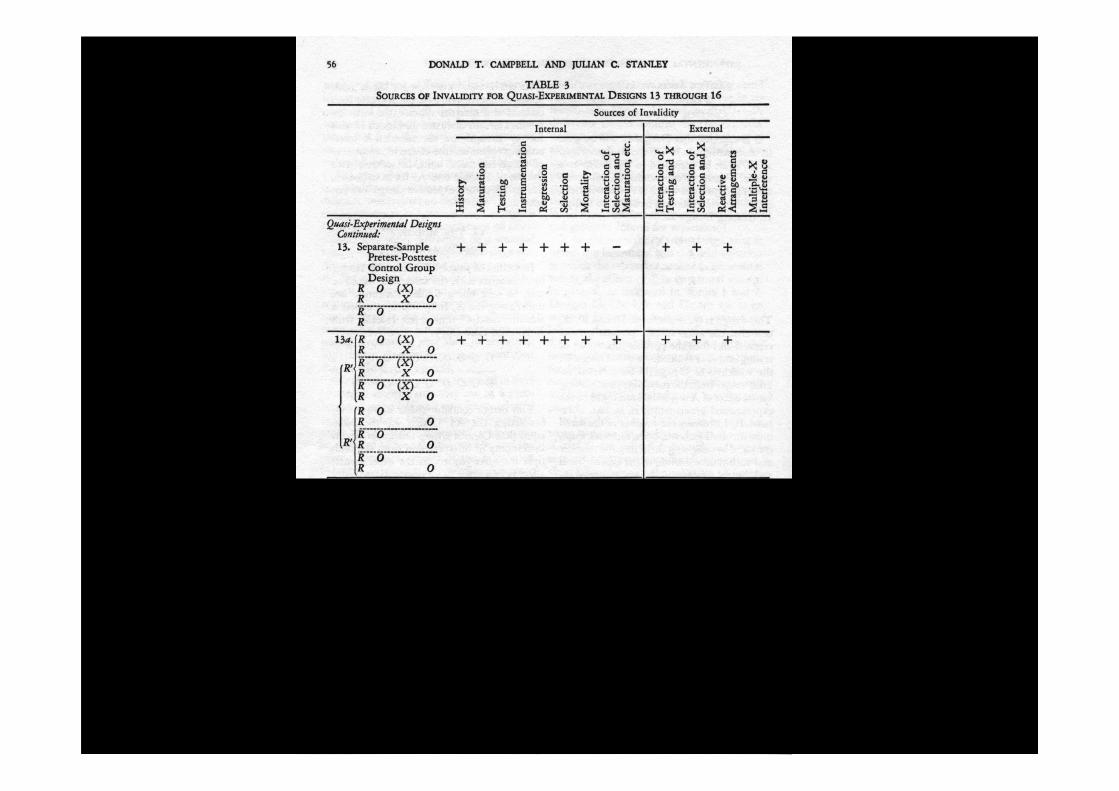
13. Separate -Sample Pretest-Posttest Control Group Design
R O (X)R X O-------------------------R OR O

If we can add a control group where X is not given, then we can transform design 12 to
Design 13.


13a. Separate -Sample Pretest-Posttest Control Group
Design
R O (X)R X O--------------------------R O (X) R X O --------------------------R O (X) R X O
R′′′′
R OR X O------------------------R OR X O ------------------------R OR O
R′′′′

14. Multiple Time -Series
O O O X O O O--------------------------
O O O X O O O


15. Institutional Cycle DesignClass A X O 1
Class B 1 R O2 X O3 Class B 2 R X) O4
Class C R O5 X
O2<O1O5<O4O2<O3O2<O4O6=O7
O2y=O2o
------------------------------------------------
------------------------------------------------------------------------------------------------
------------------------------------------------

A complicated patch -up ex -post design. Let’s just ignore it for now.


16. Regression• It is used when experimental studies are
impossible and only pre-existing data are available, (usually the case in economics).
• It relates independent variable(s) to a dependent variable and usually assumes causation by the independent variable(s).
• Regression analysis is widely used for prediction and forecasting, and fits in our discussion under quantitative models rather than here.

Typical linear regression

There are many types of regression analysis, e.g.:
• Linear regression• Simple regression• Ordinary least
squares• Polynomial regression• General linear model• Discrete choice • Logistic regression• Logit• Multinomial logit• Mixed logit
• Probit• Multinomial probit• Ordered logit or probit• Poisson• Multilevel model• Fixed effects• Random effects• Mixed model• Nonlinear regression• Nonparametric• Semiparametric

But in this section we are concerned with Regression Discontinuity Design

Linear Discontinuities

Linear Discontinuities

NON- Linear Discontinuities

Let’s take an example

Scholarship example using Regression Discontinuity Design (RDD) - Problem
• Problem: – Students who get high marks get scholarships– They would continue to get high marks even if
they did not get the scholarship– How can I find out the effect of the
scholarship?

Scholarship example using Regression Discontinuity Design (RDD) - Answer
• Answer: – say all students above 80% - are given the
scholarship– Compare the performance over time of students
scoring around the 80% cut-off: The intuition here is that a student scoring 79% is likely to be very similar to a student scoring 81%
– However, one student will receive the scholarship while the other will not.
– Comparing the pre and post award performance of the two will give the local treatment effect.


Conclusion:There is no perfect design, you must choose the most appropriate for the
study you are undertaking.
Sometimes, detailed and very thoughtful follow up studies are
required to find subtle and unsuspected relationships and
explanations – As we shall see in the following case study.

Important Case Study:Hormones and Heart
Attacks

A famous Case Study:Hormone Replacement Therapy (HRT)
and Heart Attacks in Women

Hormone Therapy and Heart Attacks• In a widely studied example, numerous
epidemiological studies showed that women who were taking combined hormone replacement therapy (HRT) also had a lower-than -average incidence of coronary heart disease (CHD), leading doctors to propose that HRT was protective against CHD .
Source: Lawlor DA, Davey Smith G, Ebrahim S (June 20 04). "Commentary: the hormone replacement-coronary heart disease conundrum: is th is the death of observational
epidemiology?". Int J Epidemiol 33 (3): 464–7. doi:10 .1093/ije/dyh124. PMID 15166201.

So, Should I take HRT as a preventative against Heart Attacks?

BUT….

Hormone Therapy and Heart Attacks
• But randomized controlled trials showed that HRT caused a small but statistically significant increase in risk of CHD.
• So: How come?
Source: Lawlor DA, Davey Smith G, Ebrahim S (June 20 04). "Commentary: the hormone replacement-coronary heart disease conundrum: is th is the death of observational
epidemiology?". Int J Epidemiol 33 (3): 464–7. doi:10 .1093/ije/dyh124. PMID 15166201.

Hormone Therapy and Heart Attacks• Re-analysis of the data from the epidemiological
studies showed that women undertaking HRT were more likely to be from higher socio-economic groups.
• These wealthier women also had better than average diet and exercise regimens .
• The use of HRT and decreased incidence of coronary heart disease were coincident effects of a third and separate cause (i.e. the benefits associated with a higher socioeconomic status).
• They were not cause and effect , as had been supposed.
Source: Lawlor DA, Davey Smith G, Ebrahim S (June 20 04). "Commentary: the hormone replacement-coronary heart disease conundrum: is this the death of obser vational epidemiology?". Int J Epidemiol 33 (3): 464– 7.
doi:10.1093/ije/dyh124. PMID 15166201 .

This is so important, let’s go over it one more time…

Hormone Replacement Therapy (HRT)
• After menopause or after surgery some women got HRT to replace the hormones their bodies were no longer producing.

Women who got HRT also had less heart attacks
Therefore HRT reduces incidence of Heart Attacks.

Actually The Opposite: HRT increases the risk of Heart Attacks

How come?
Women who got HRT tended to be wealthier

Wealthier women have better diet

Wealthier women exercise more

Diet and exercise tend to reduce incidence of heart attacks more than HRT
raises it!

SO…

The lesson of this important example:
• It is essential to be very careful in:– How you design your research , – How you collect the data– How you analyze the data and – How you draw your conclusions.

Now we are back to asking:

Are we sinking? Or Swimming?

I want you not just to swim!

Let’s all fly…

Fly Even Like Eagles

Soar like Eagles

Thank You


![[PPT]Art of Teaching (Pedagogy) - University of Pittsburghsuper7/46011-47001/46031.ppt · Web viewArt of Teaching (Pedagogy) Dr. A.K. Avasarala Professor& Head Dept of Community Medicine](https://img.pdfslide.net/doc/110x75/5b0a8ca17f8b9abe5d8e5ab2/pptart-of-teaching-pedagogy-university-of-super746011-4700146031pptweb.jpg)

![[PPT]OCCUPATIONAL HEALTH - University of Pittsburghsuper7/13011-14001/13471.ppt · Web viewGOALS To reduce industrial accidents. To prevent occupational hazards/ diseases. To achieve](https://img.pdfslide.net/doc/110x75/5acfe1977f8b9ac1478d56f8/pptoccupational-health-university-of-super713011-1400113471pptweb-viewgoals.jpg)


![[PPT]PowerPoint Presentation - University of Pittsburghsuper7/6011-7001/6991.ppt · Web viewProf. Joshua Lederberg Raymond and Beverly Sackler Foundation Scholar Suite 400 (Founders](https://img.pdfslide.net/doc/110x75/5b24bb7a7f8b9a625c8b4c29/pptpowerpoint-presentation-university-of-super76011-70016991ppt-web-viewprof.jpg)