Embed Size (px)
Citation preview
MEDICAL IMAGE COMPUTING (CAP 5937)
LECTURE 7: Medical Image Segmentation (I)(Radiology Applications of Segmentation, and Thresholding)
Dr. Ulas BagciHEC 221, Center for Research in Computer Vision (CRCV), University of Central Florida (UCF), Orlando, FL [email protected] or [email protected]
1SPRING 2016
Outline• Introduction to Medical Image Segmentation, type of
segmentation methods, and definitions– Recognition & Delineation
• Simplest Segmentation Method(s): Thresholding– Otsu Thresholding– Parametric Method– PET Image Thresholding Methods
• ITM (Iterative Thresholding Method)
2
Motivation for Image SegmentationIn the last 20 years the computer vision and medical imaging communities have produced a number of useful algorithms for localizing object boundaries in images.
3
Motivation for Image Segmentation• Content based image retrieval• Machine Vision• Medical Imaging applications (tumor delineation,..)• Object detection (face detection,…)• 3D Reconstruction• Object/Motion Tracking• Object-based measurements such as size and shape• Object recognition (face recognition,…)• Fingerprint recognition,• Video surveillance• …
4
Segmentation Tools in Radiology Applications
• 3D views to visualize structural information and spatial anatomic relationships is a difficult task, which is usually carried out in the clinician’s mind.
5
Segmentation Tools in Radiology Applications
• 3D views to visualize structural information and spatial anatomic relationships is a difficult task, which is usually carried out in the clinician’s mind.
• Image-processing tools provide the surgeon with interactively displayed 3D visual information.
6
Segmentation Tools in Radiology Applications
7
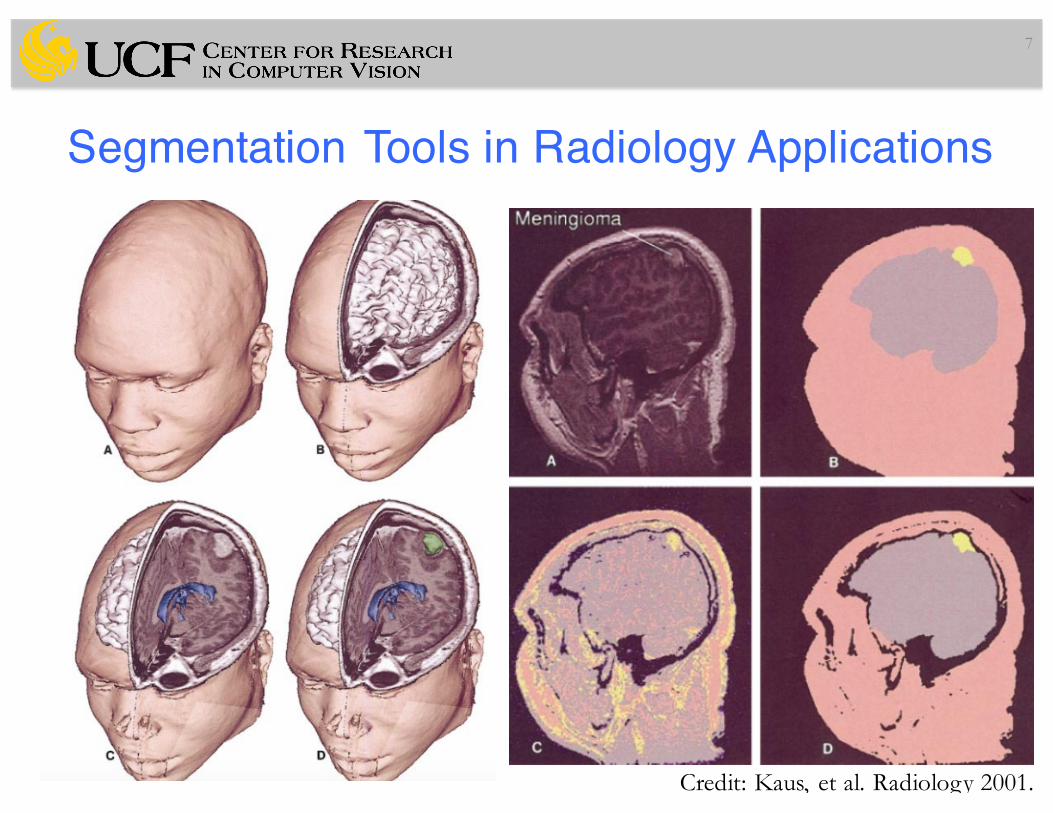
Credit: Kaus, et al. Radiology 2001.
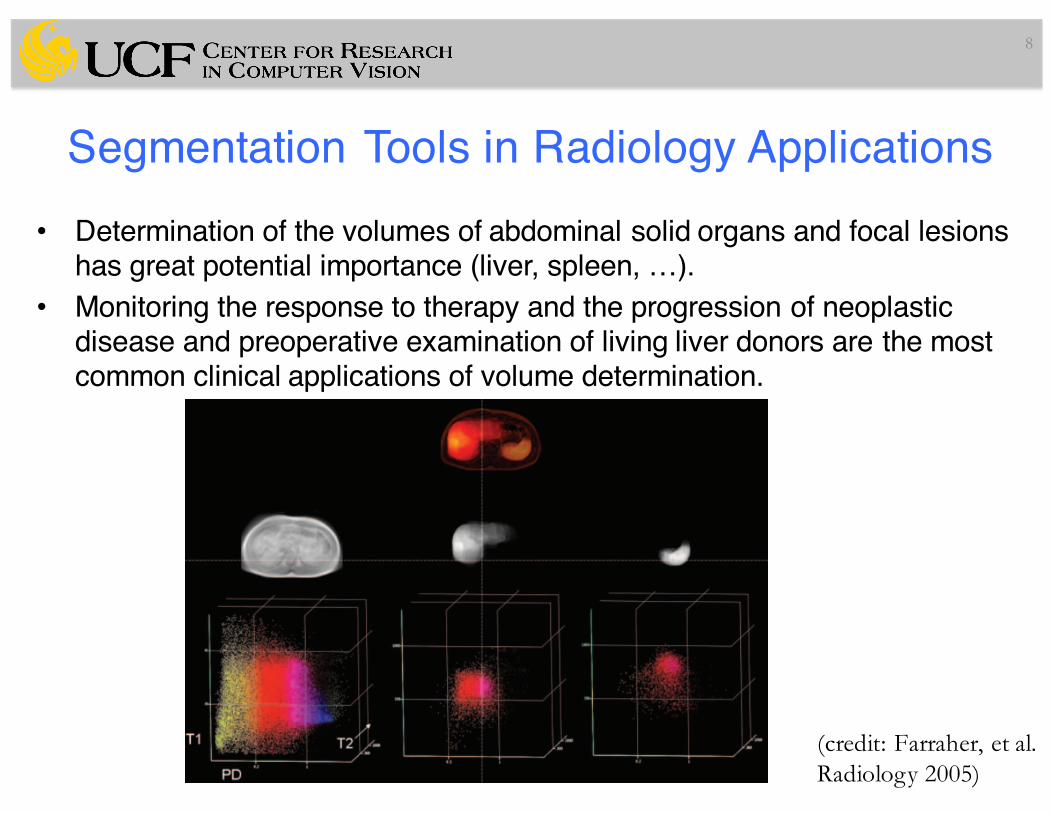
• Determination of the volumes of abdominal solid organs and focal lesions has great potential importance (liver, spleen, …).
• Monitoring the response to therapy and the progression of neoplastic disease and preoperative examination of living liver donors are the most common clinical applications of volume determination.
8
Segmentation Tools in Radiology Applications
(credit: Farraher, et al.Radiology 2005)
Segmentation Tools in Radiology Applications
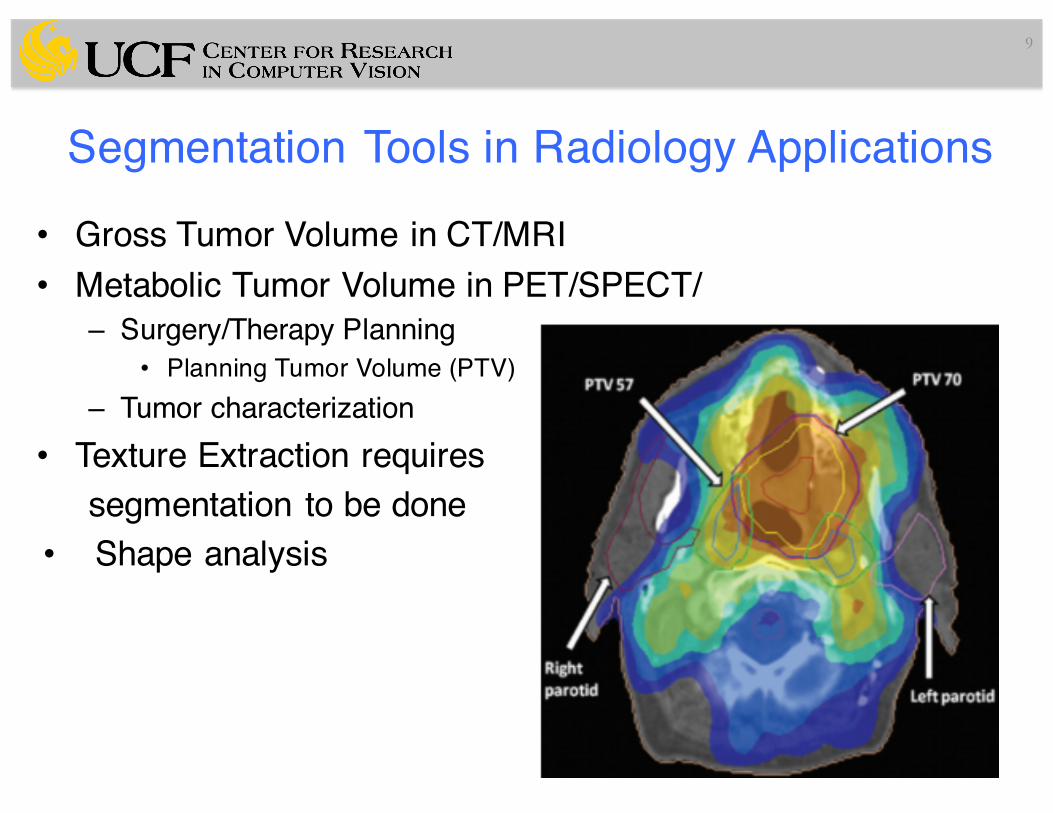
• Gross Tumor Volume in CT/MRI• Metabolic Tumor Volume in PET/SPECT/
– Surgery/Therapy Planning• Planning Tumor Volume (PTV)
– Tumor characterization• Texture Extraction requires
segmentation to be done• Shape analysis
9
Segmentation Tools in Radiology Applications
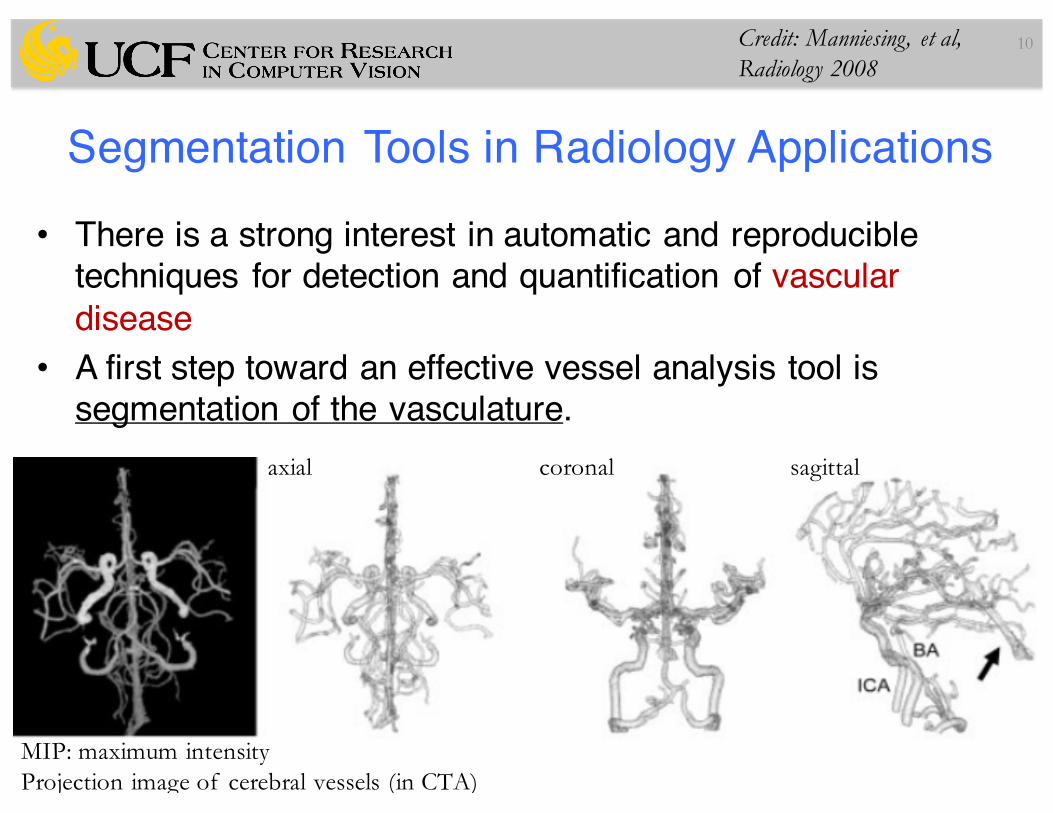
• There is a strong interest in automatic and reproducible techniques for detection and quantification of vascular disease
• A first step toward an effective vessel analysis tool is segmentation of the vasculature.
10
axial coronal sagittal
Credit: Manniesing, et al, Radiology 2008
MIP: maximum intensityProjection image of cerebral vessels (in CTA)
Segmentation Tools in Radiology Applications
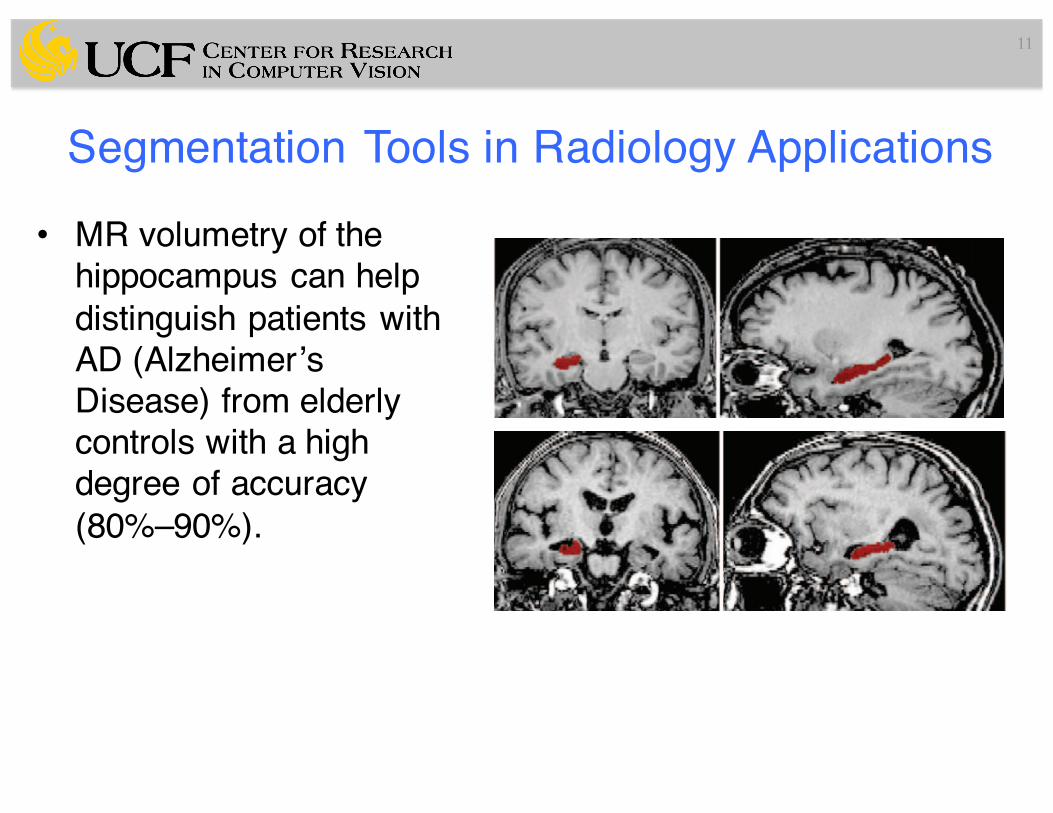
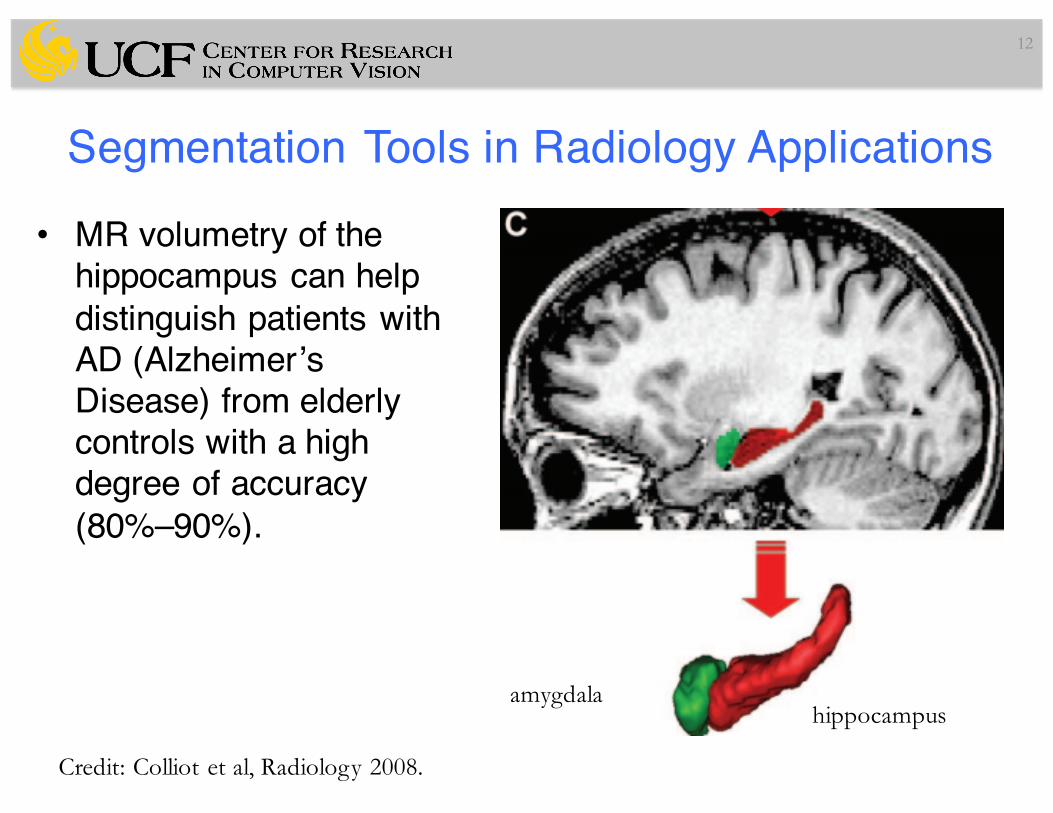
• MR volumetry of the hippocampus can help distinguish patients with AD (Alzheimer’s Disease) from elderly controls with a high degree of accuracy (80%–90%).
11
Segmentation Tools in Radiology Applications
• MR volumetry of the hippocampus can help distinguish patients with AD (Alzheimer’s Disease) from elderly controls with a high degree of accuracy (80%–90%).
12
hippocampusamygdala
Credit: Colliot et al, Radiology 2008.
Image SegmentationDefinition: Partitioning a picture/image into distinctive subsets is called segmentation.
13
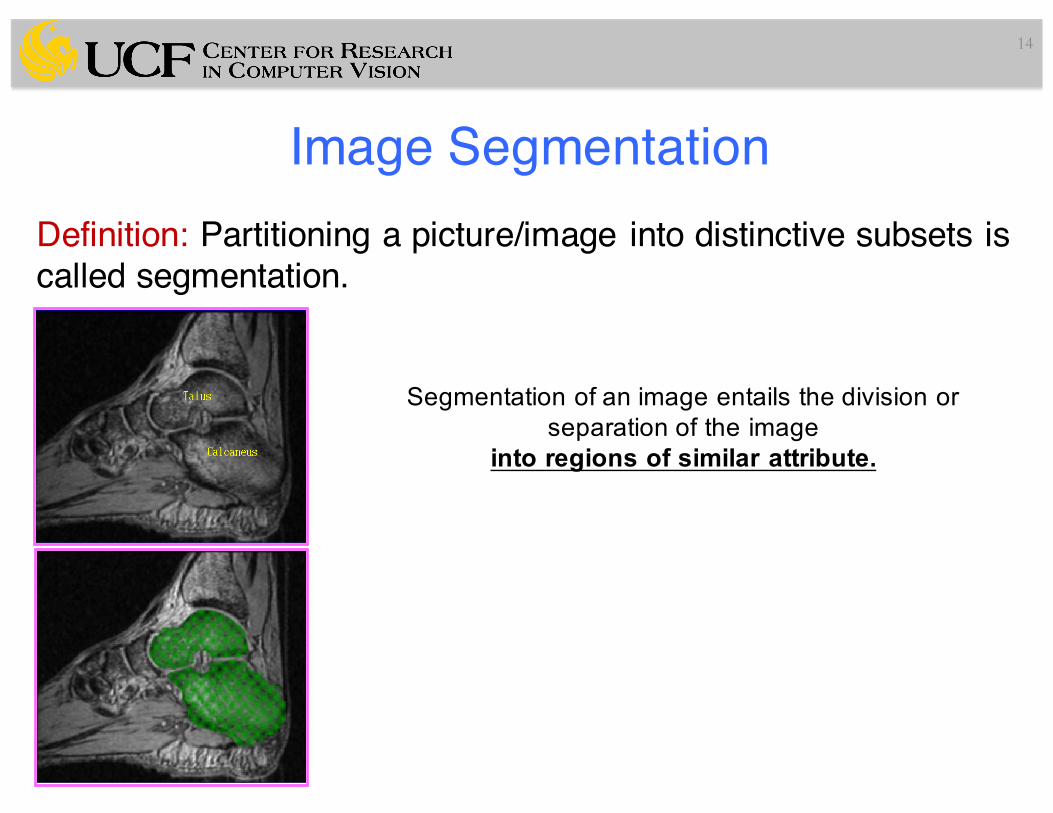
Image SegmentationDefinition: Partitioning a picture/image into distinctive subsets is called segmentation.
14
Segmentation of an image entails the division or separation of the image
into regions of similar attribute.
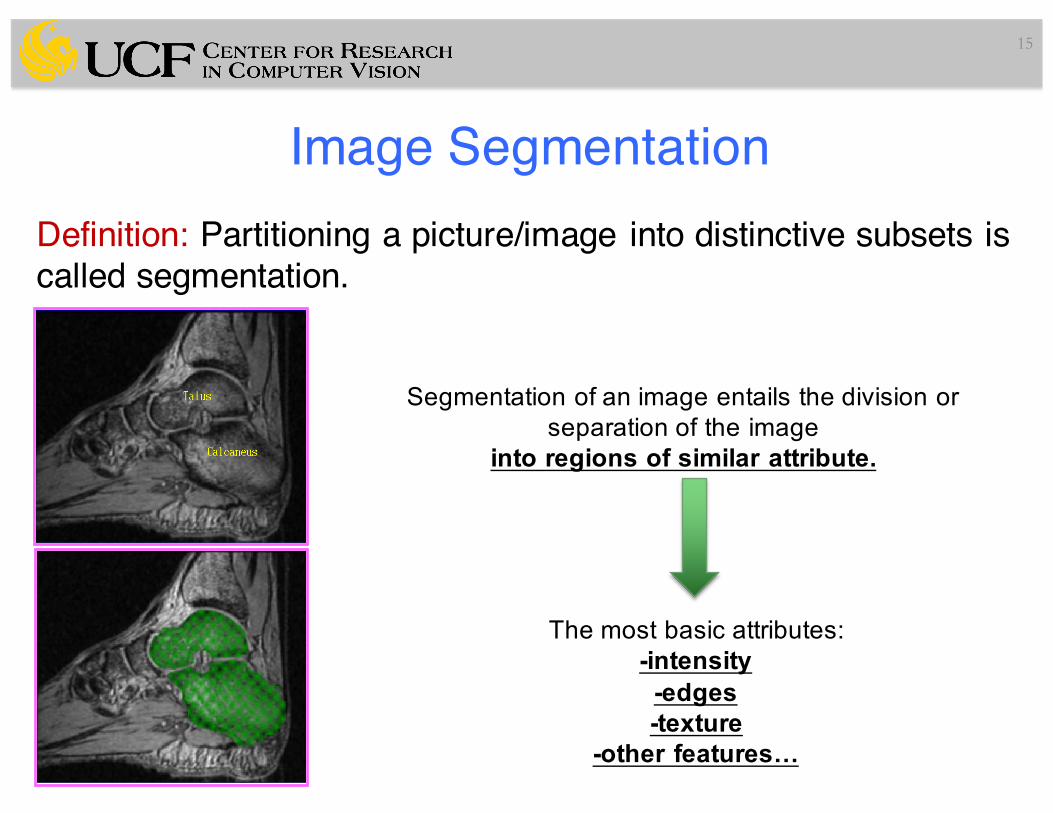
Image SegmentationDefinition: Partitioning a picture/image into distinctive subsets is called segmentation.
15
Segmentation of an image entails the division or separation of the image
into regions of similar attribute.
The most basic attributes:-intensity
-edges-texture
-other features…
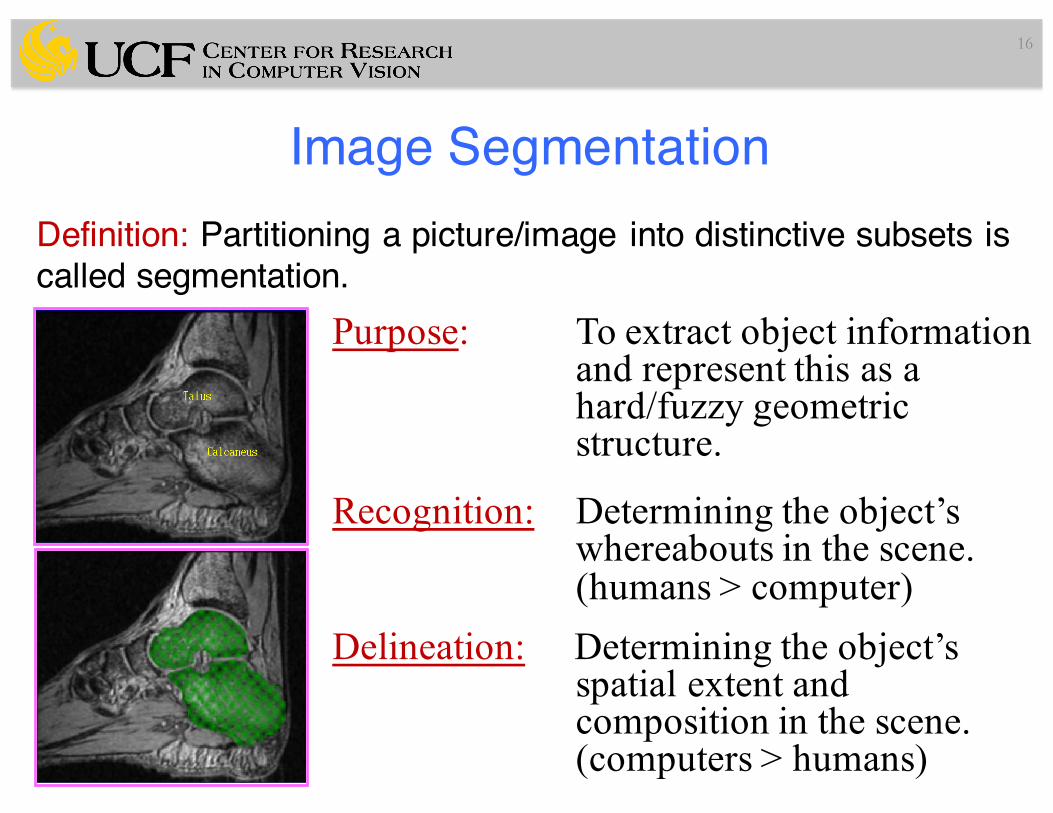
Image SegmentationDefinition: Partitioning a picture/image into distinctive subsets is called segmentation.
16
Purpose: To extract object information and represent this as a hard/fuzzy geometricstructure.
Recognition: Determining the object’swhereabouts in the scene.(humans > computer)
Delineation: Determining the object’sspatial extent andcomposition in the scene.(computers > humans)
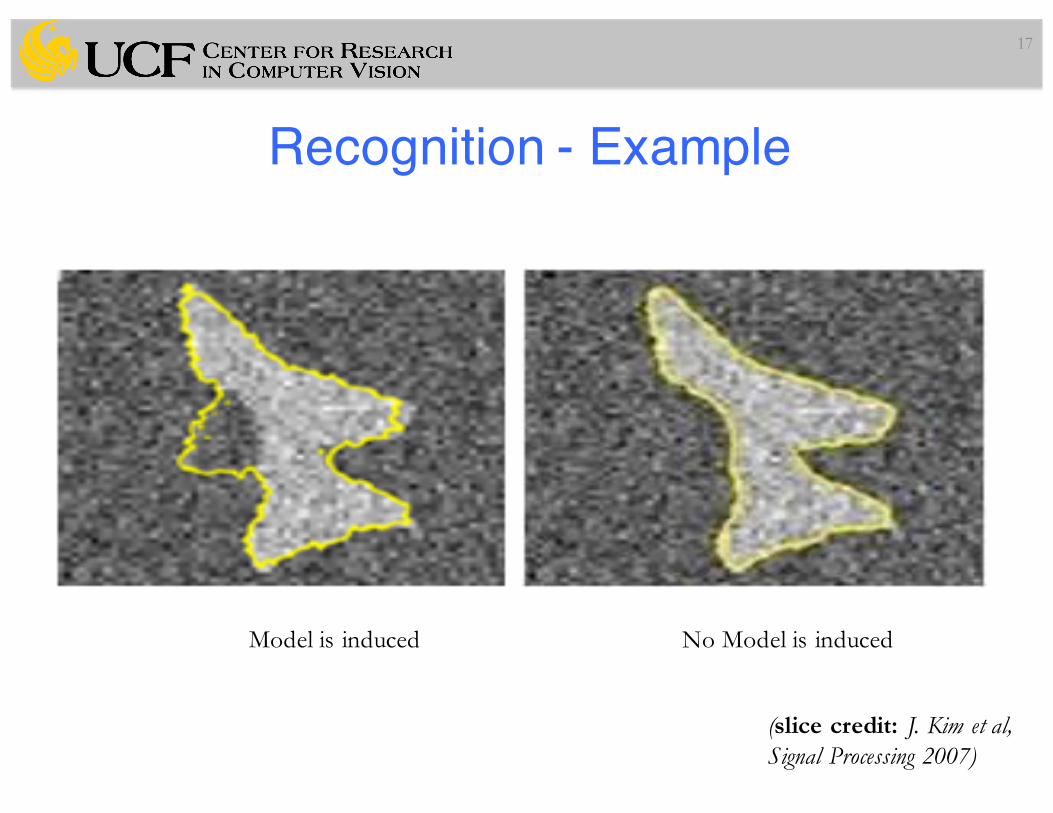
Recognition - Example
17
(slice credit: J. Kim et al,Signal Processing 2007)
Model is induced No Model is induced
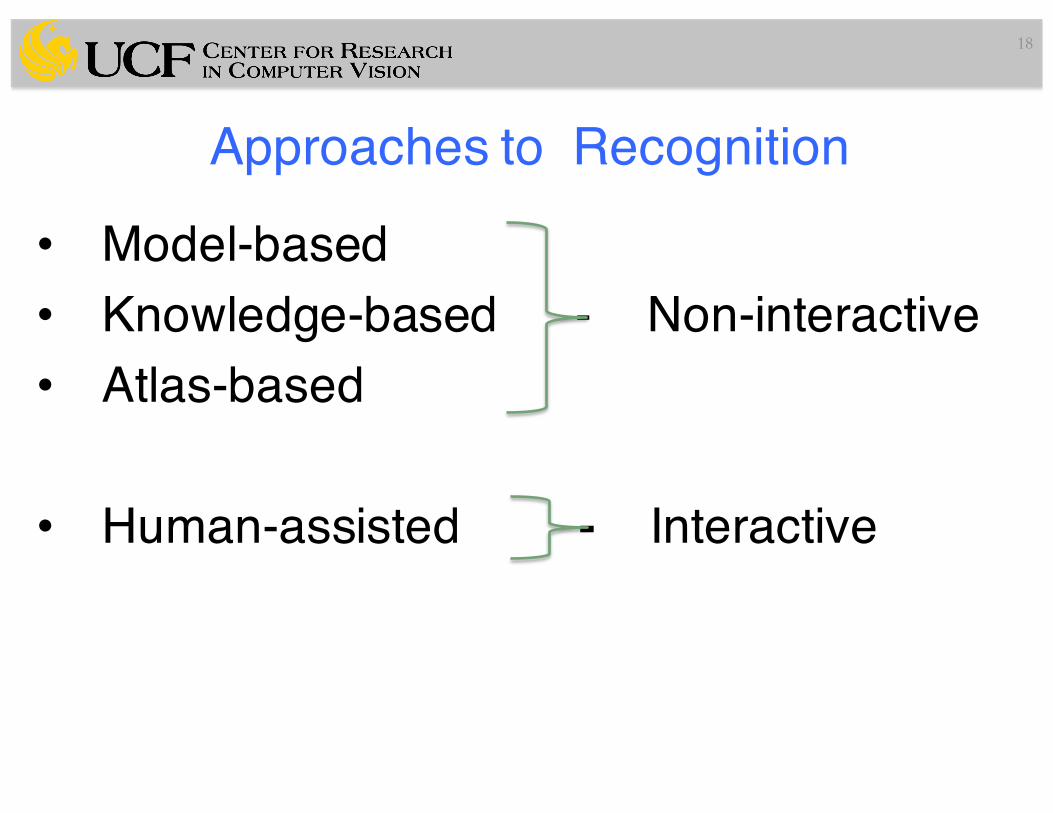
Approaches to Recognition
18
• Model-based• Knowledge-based - Non-interactive• Atlas-based
• Human-assisted - Interactive
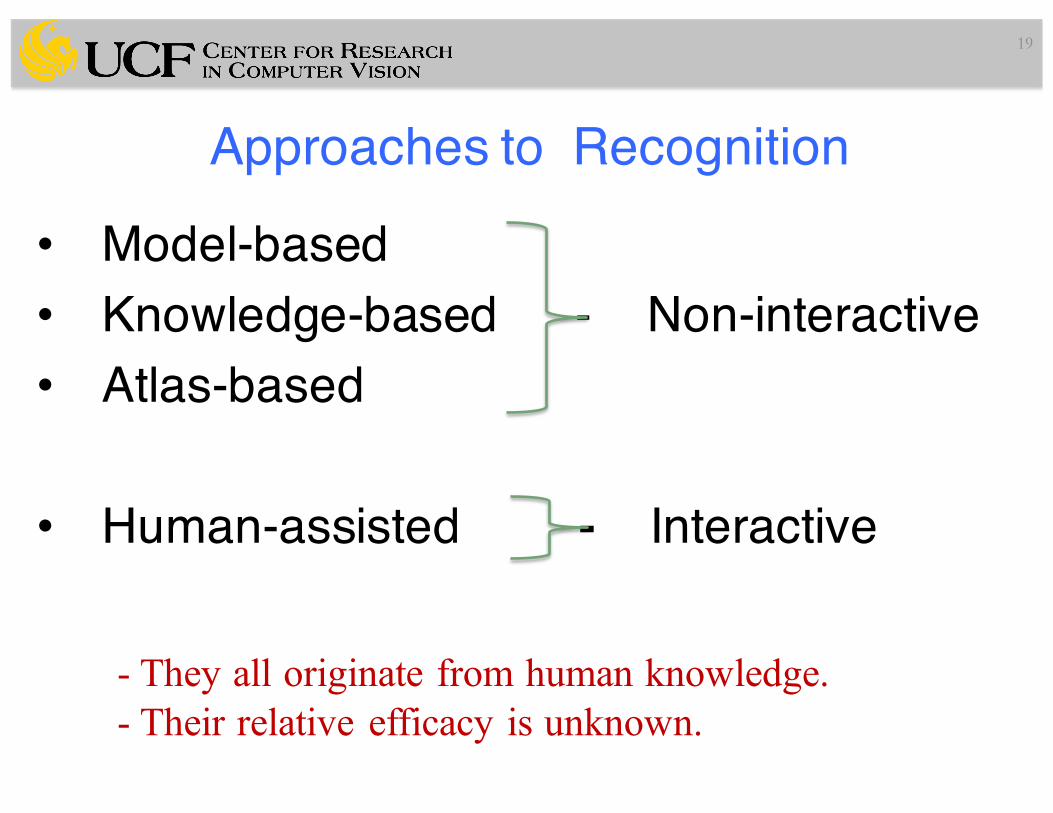
Approaches to Recognition
19
• Model-based• Knowledge-based - Non-interactive• Atlas-based
• Human-assisted - Interactive
- They all originate from human knowledge.- Their relative efficacy is unknown.
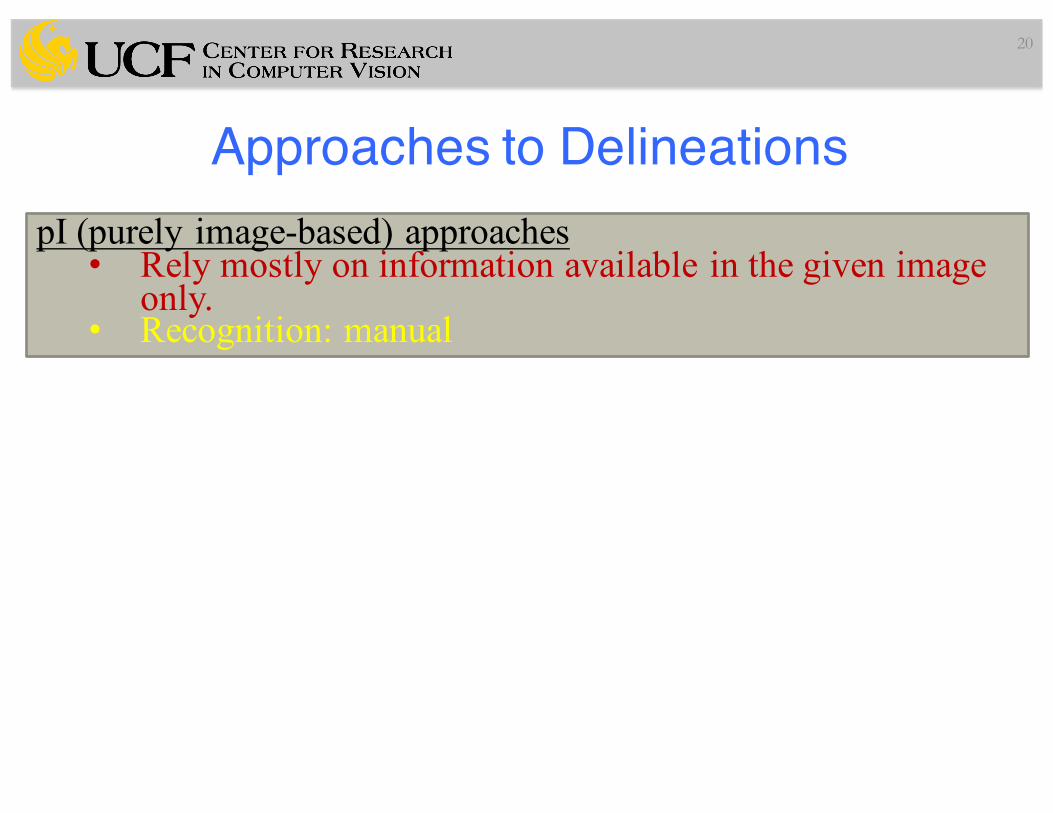
Approaches to Delineations
20
pI (purely image-based) approaches• Rely mostly on information available in the given image
only. • Recognition: manual
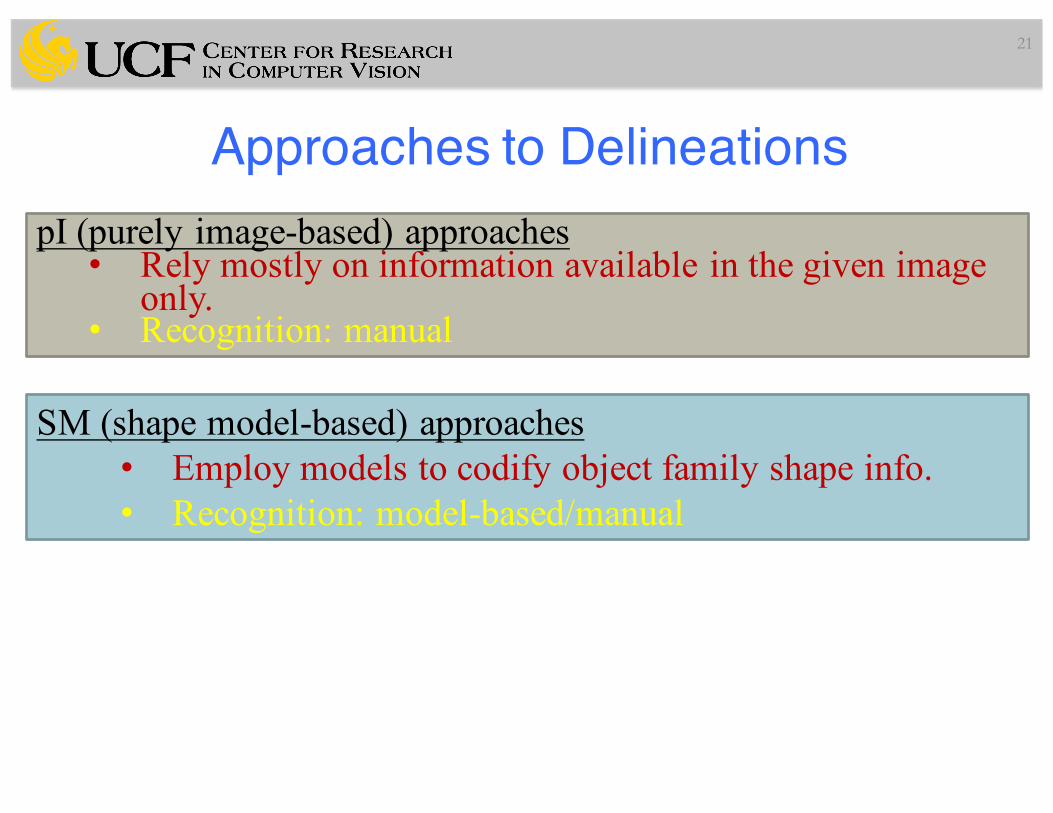
Approaches to Delineations
21
pI (purely image-based) approaches• Rely mostly on information available in the given image
only. • Recognition: manual
SM (shape model-based) approaches• Employ models to codify object family shape info.• Recognition: model-based/manual
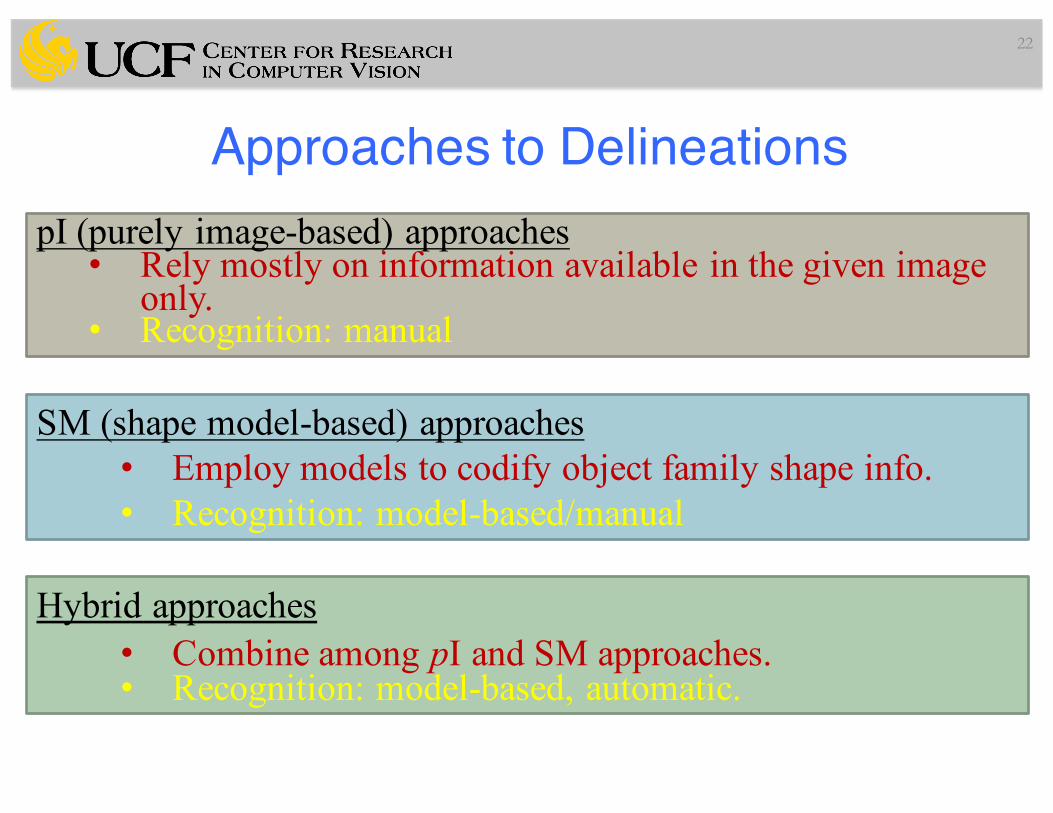
Approaches to Delineations
22
pI (purely image-based) approaches• Rely mostly on information available in the given image
only. • Recognition: manual
SM (shape model-based) approaches• Employ models to codify object family shape info.• Recognition: model-based/manual
Hybrid approaches• Combine among pI and SM approaches.• Recognition: model-based, automatic.
Classification of Methods
23
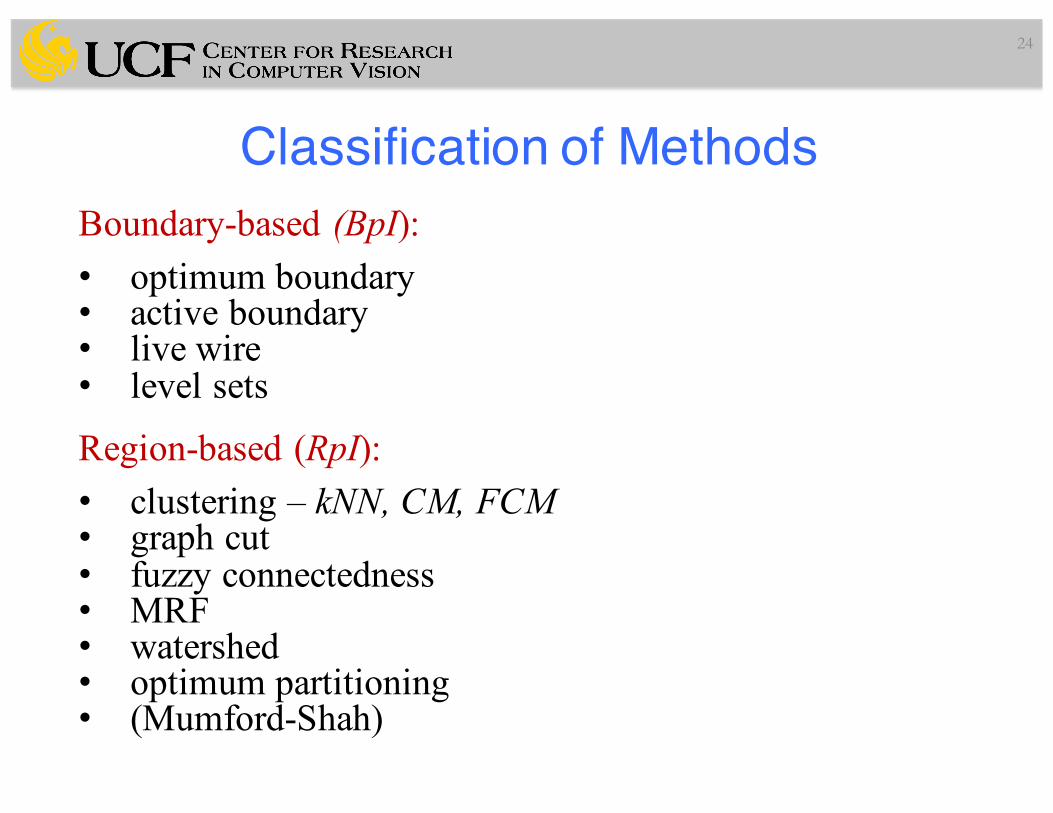
Boundary-based (BpI):• optimum boundary• active boundary• live wire• level sets
Classification of Methods
24
Boundary-based (BpI):• optimum boundary• active boundary• live wire• level sets
Region-based (RpI):• clustering – kNN, CM, FCM• graph cut• fuzzy connectedness• MRF• watershed• optimum partitioning• (Mumford-Shah)
Classification of Methods
25
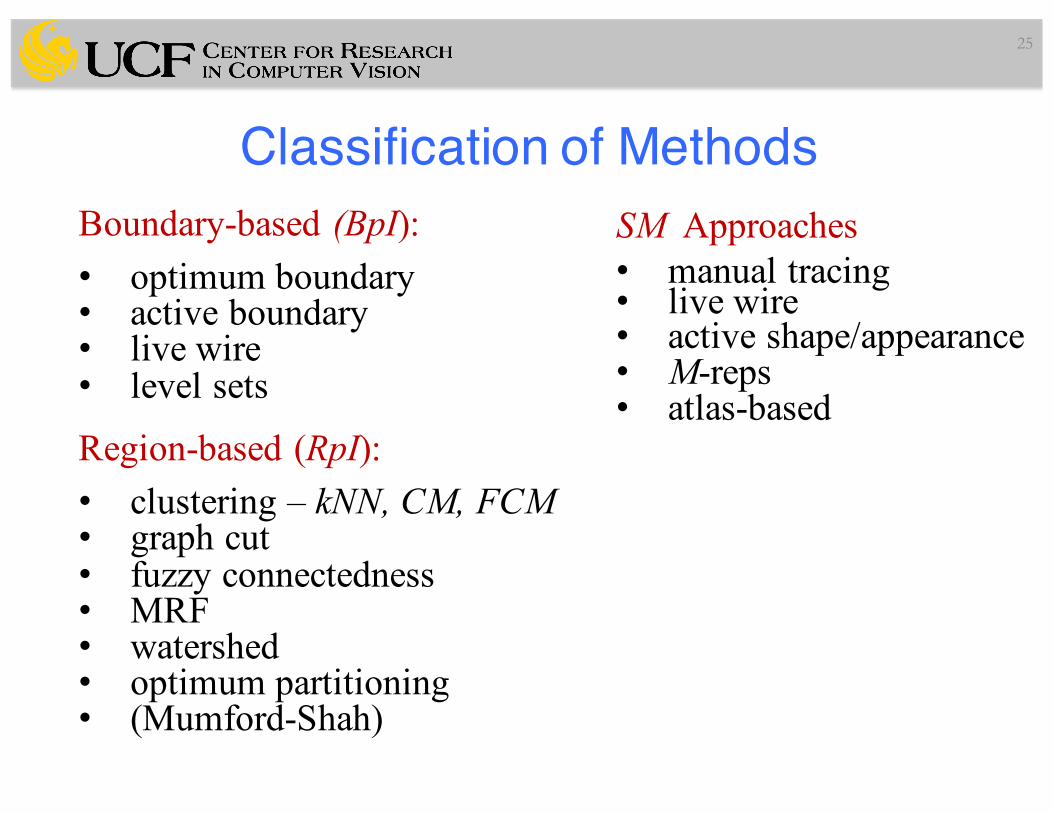
Boundary-based (BpI):• optimum boundary• active boundary• live wire• level sets
Region-based (RpI):• clustering – kNN, CM, FCM• graph cut• fuzzy connectedness• MRF• watershed• optimum partitioning• (Mumford-Shah)
SM Approaches• manual tracing• live wire• active shape/appearance• M-reps• atlas-based
Classification of Methods
26
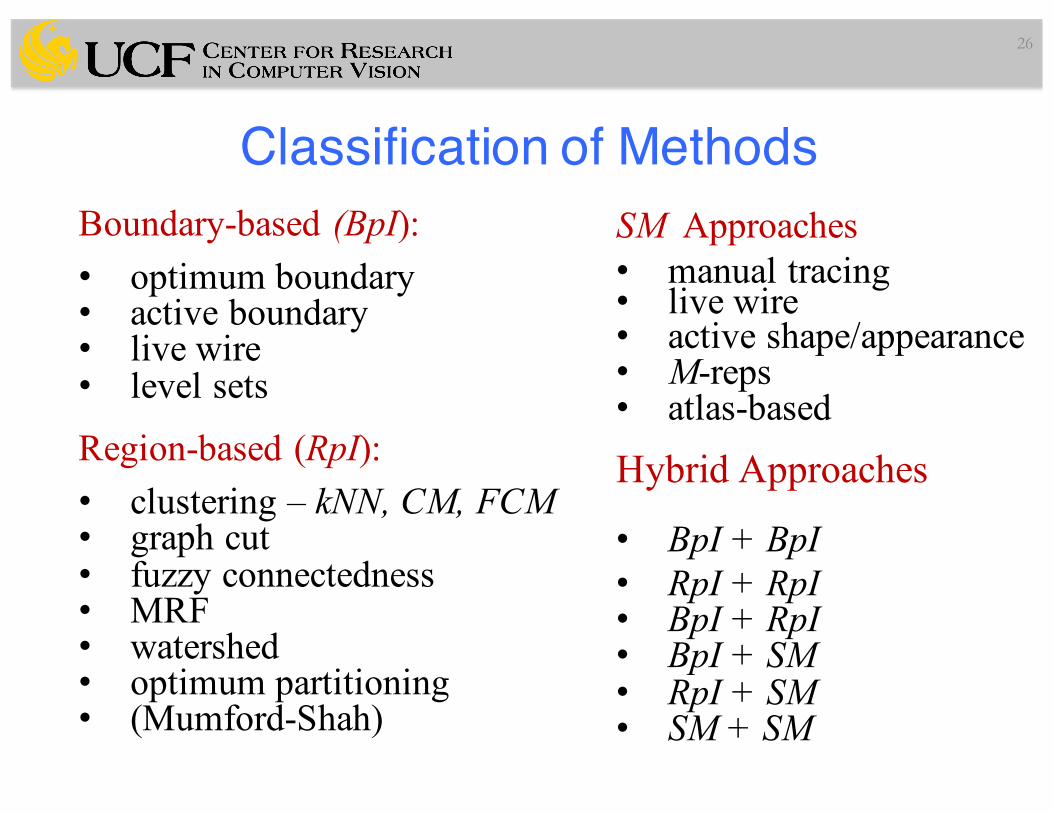
Boundary-based (BpI):• optimum boundary• active boundary• live wire• level sets
Region-based (RpI):• clustering – kNN, CM, FCM• graph cut• fuzzy connectedness• MRF• watershed• optimum partitioning• (Mumford-Shah)
SM Approaches• manual tracing• live wire• active shape/appearance• M-reps• atlas-based
Hybrid Approaches
• BpI + BpI• RpI + RpI• BpI + RpI• BpI + SM• RpI + SM• SM + SM
Classification of Methods
27
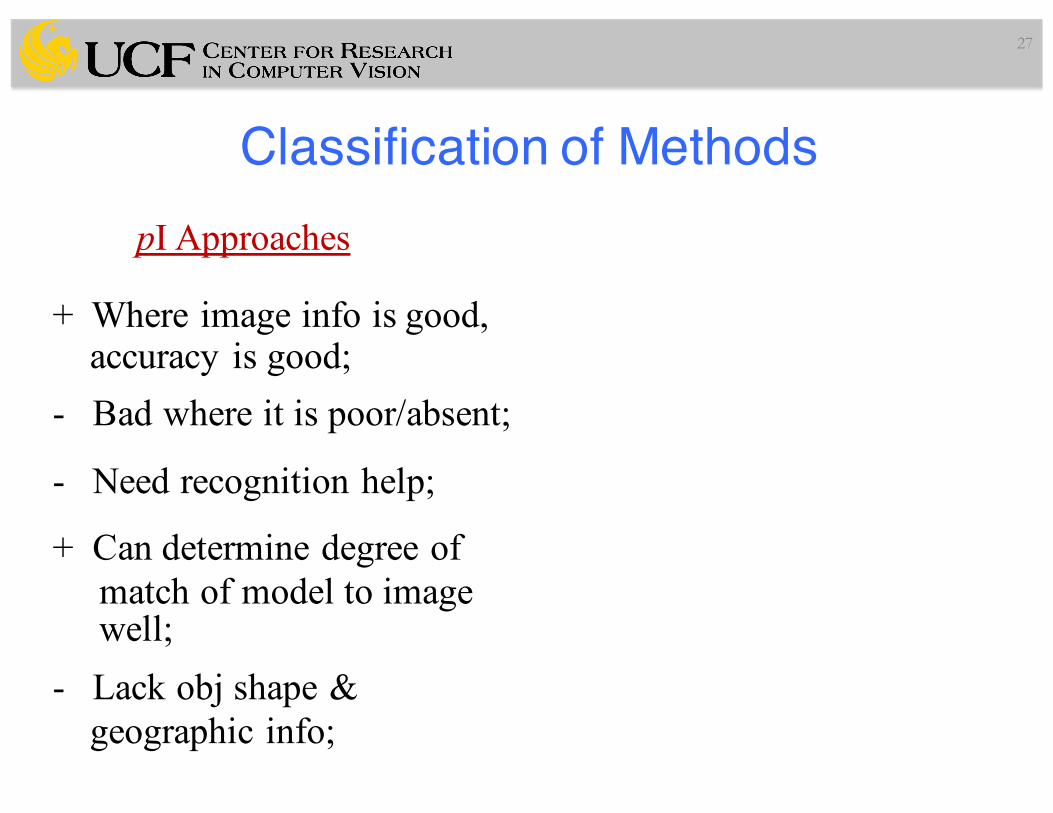
pI Approaches
+ Where image info is good,accuracy is good;
- Bad where it is poor/absent;
- Need recognition help;
+ Can determine degree of match of model to image well;
- Lack obj shape &geographic info;
Classification of Methods
28
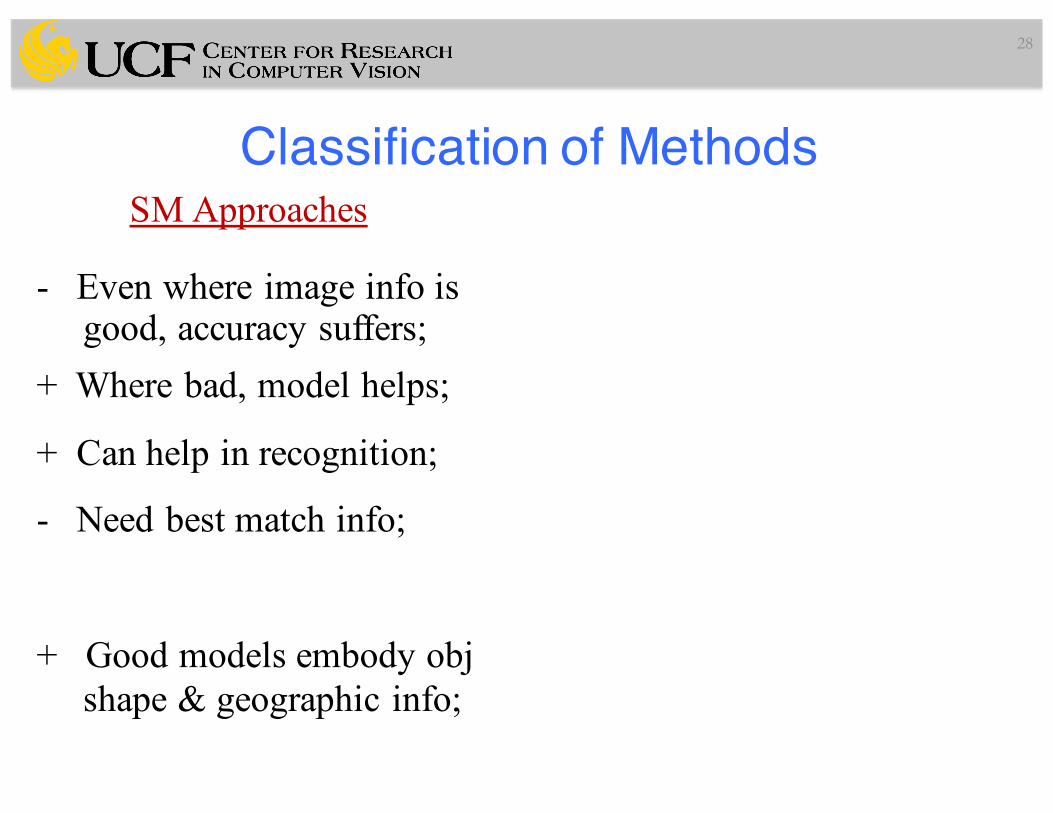
SM Approaches
- Even where image info isgood, accuracy suffers;
+ Where bad, model helps;
+ Can help in recognition;
- Need best match info;
+ Good models embody objshape & geographic info;
Purely Image Based Segmentation Methods
29
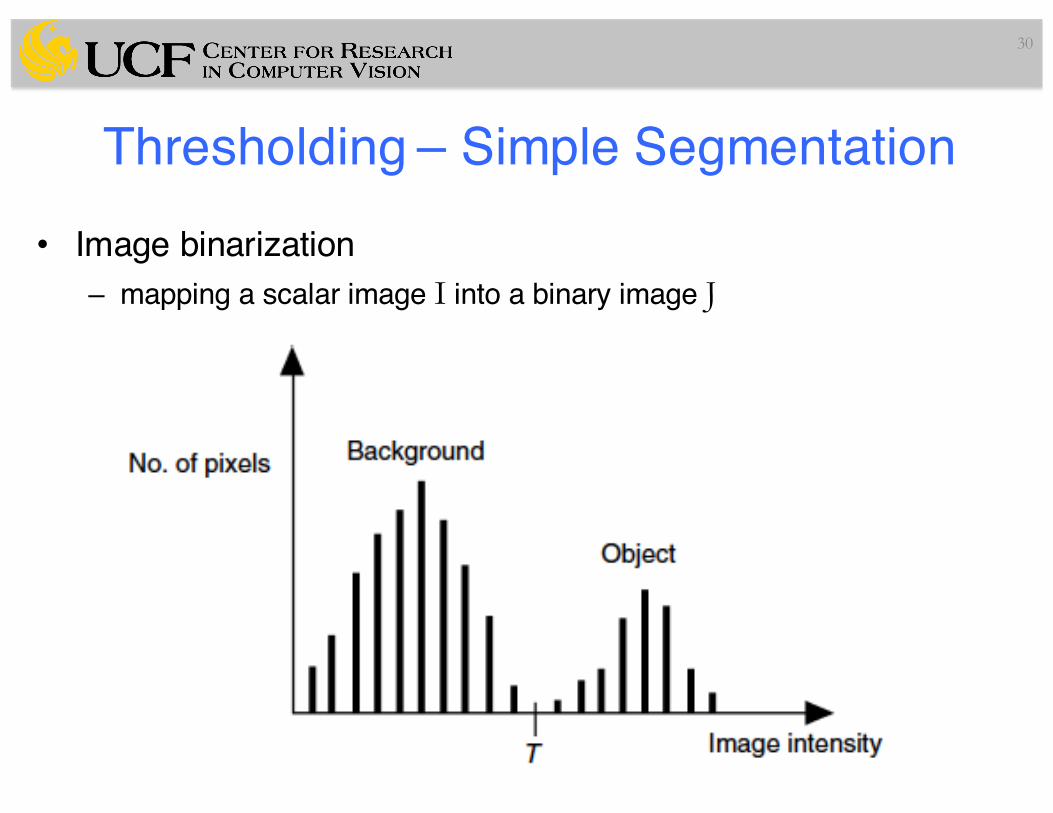
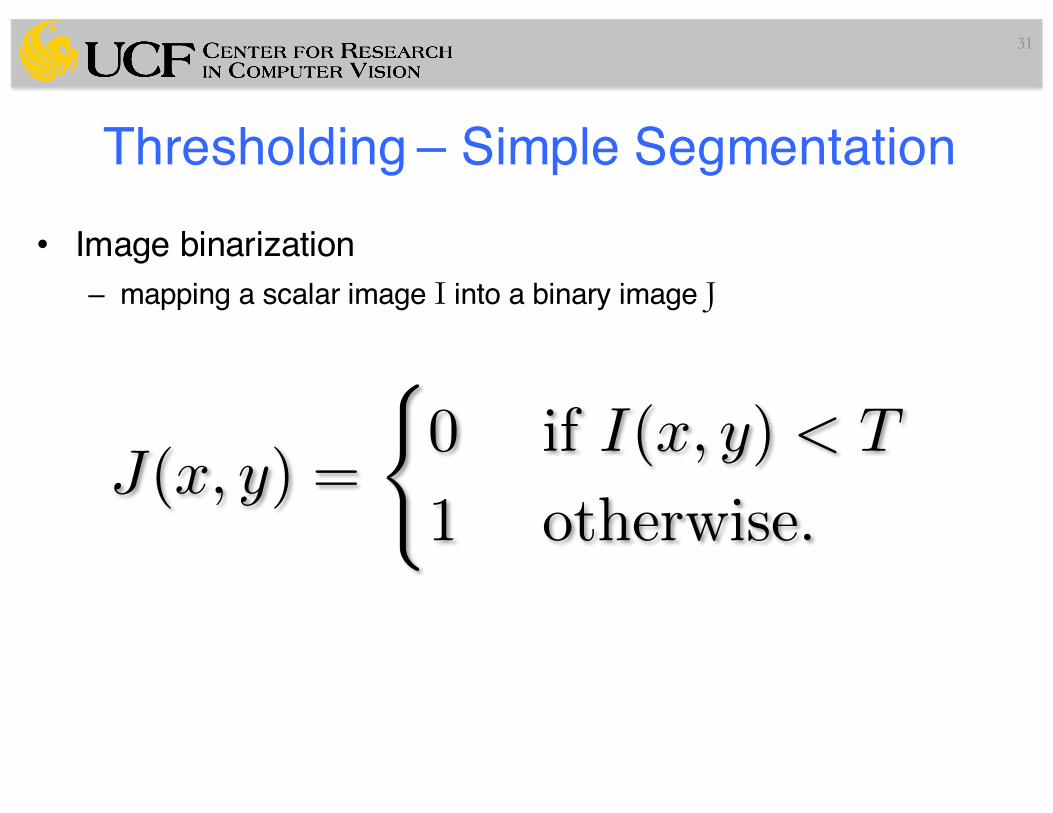
Thresholding – Simple Segmentation• Image binarization
– mapping a scalar image I into a binary image J
30
J(x, y) =
(0 if I(x, y) < T
1 otherwise.
Thresholding – Simple Segmentation• Image binarization
– mapping a scalar image I into a binary image J
31
J(x, y) =
(0 if I(x, y) < T
1 otherwise.
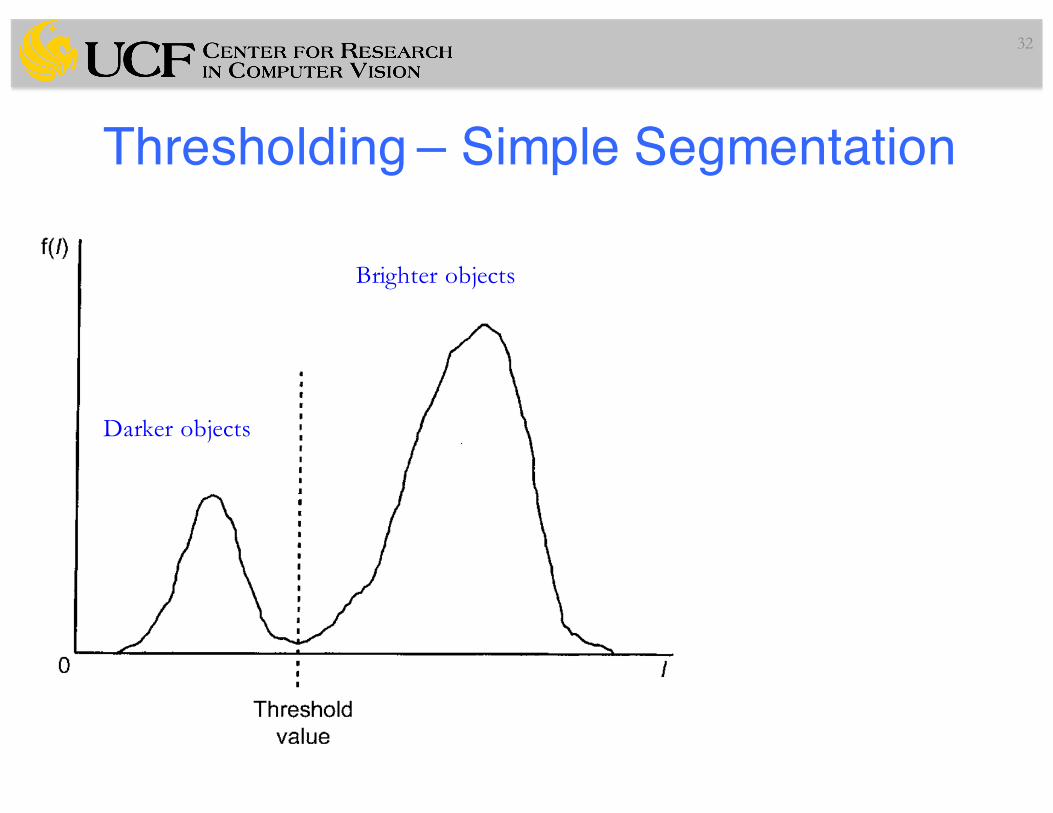
Thresholding – Simple Segmentation
32
Brighter objects
Darker objects
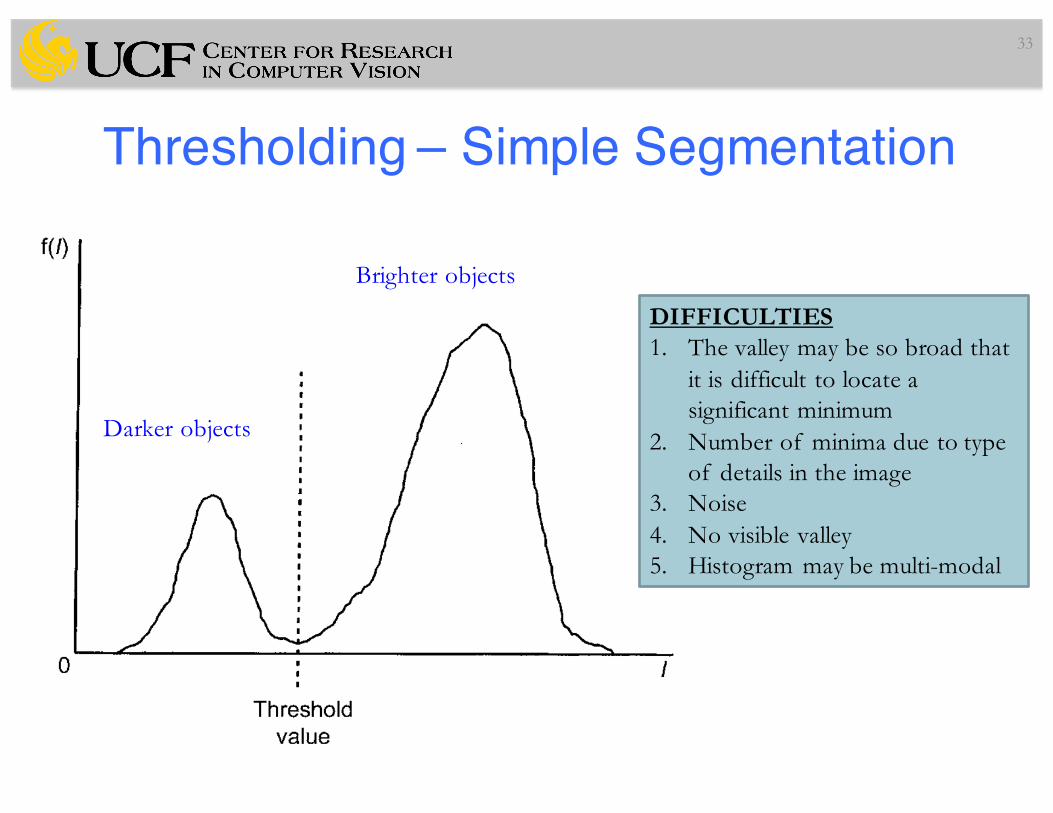
Thresholding – Simple Segmentation
33
Brighter objects
Darker objects
DIFFICULTIES1. The valley may be so broad that
it is difficult to locate a significant minimum
2. Number of minima due to type of details in the image
3. Noise4. No visible valley5. Histogram may be multi-modal
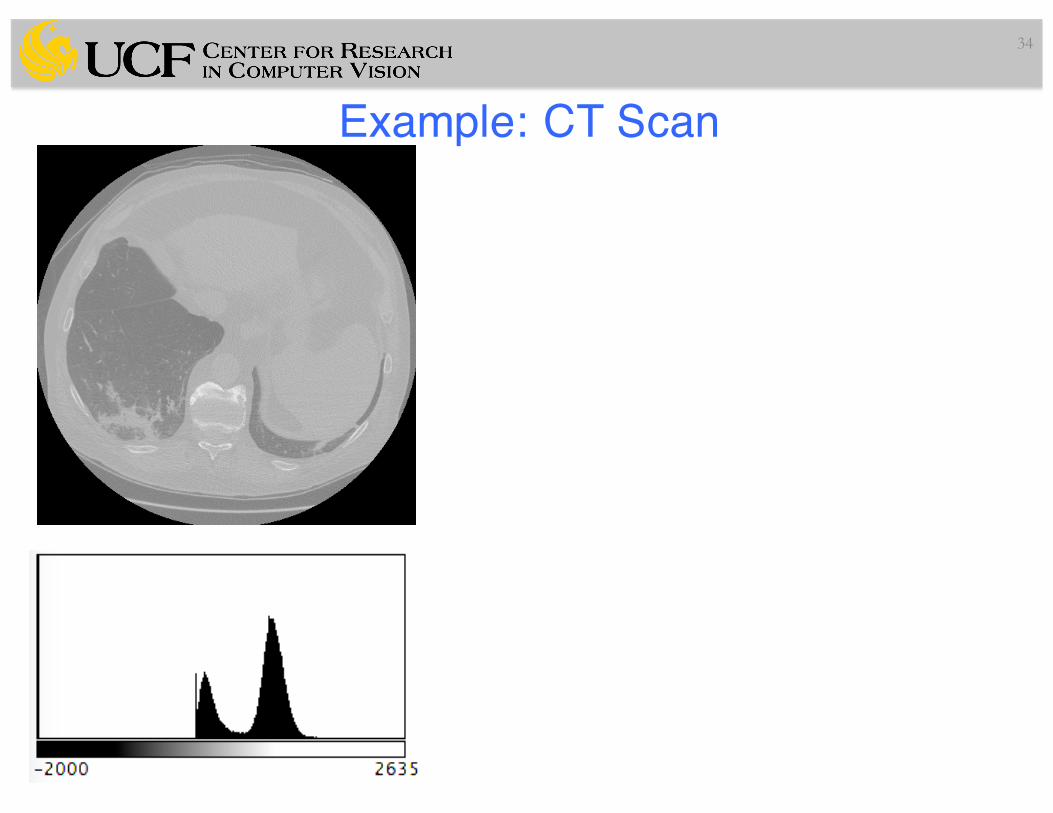
Example: CT Scan
34
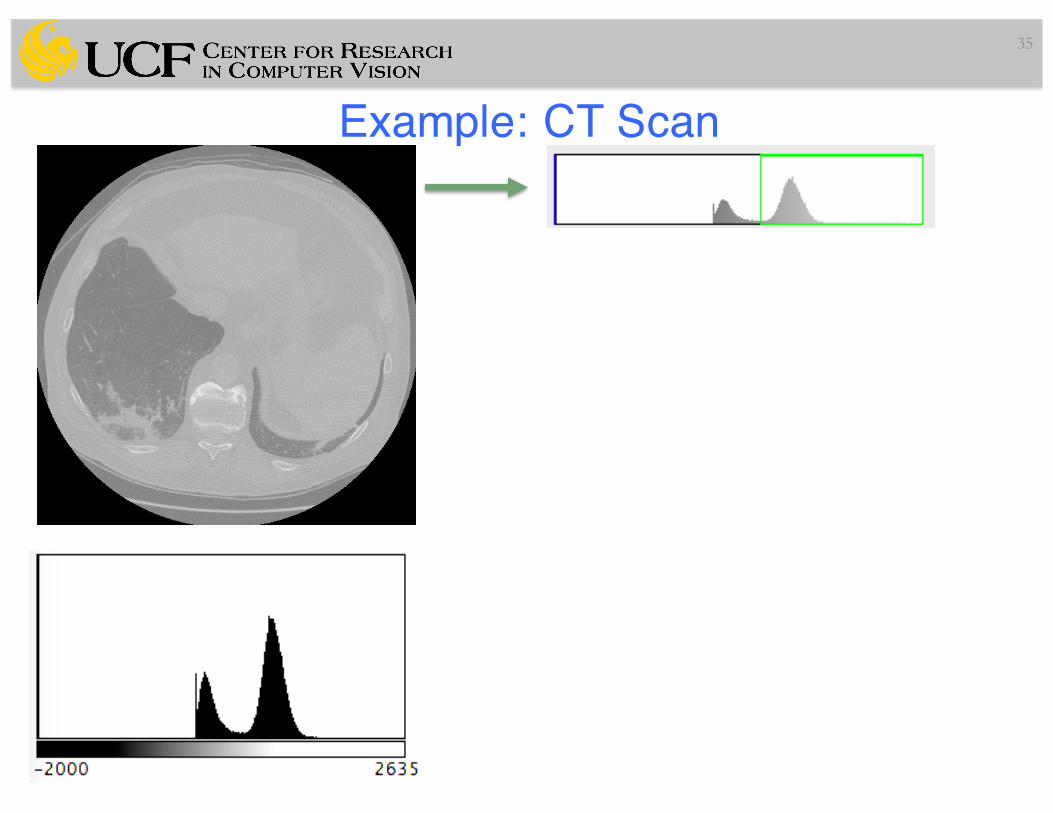
Example: CT Scan
35
Example: CT Scan
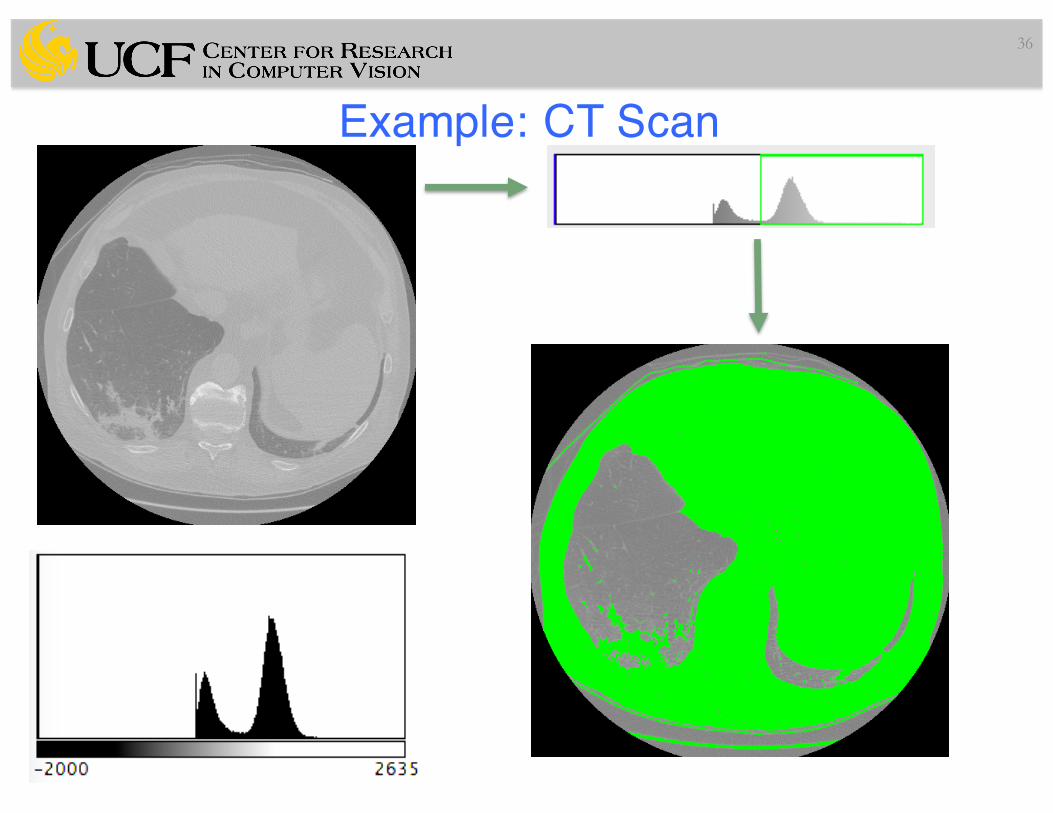
36
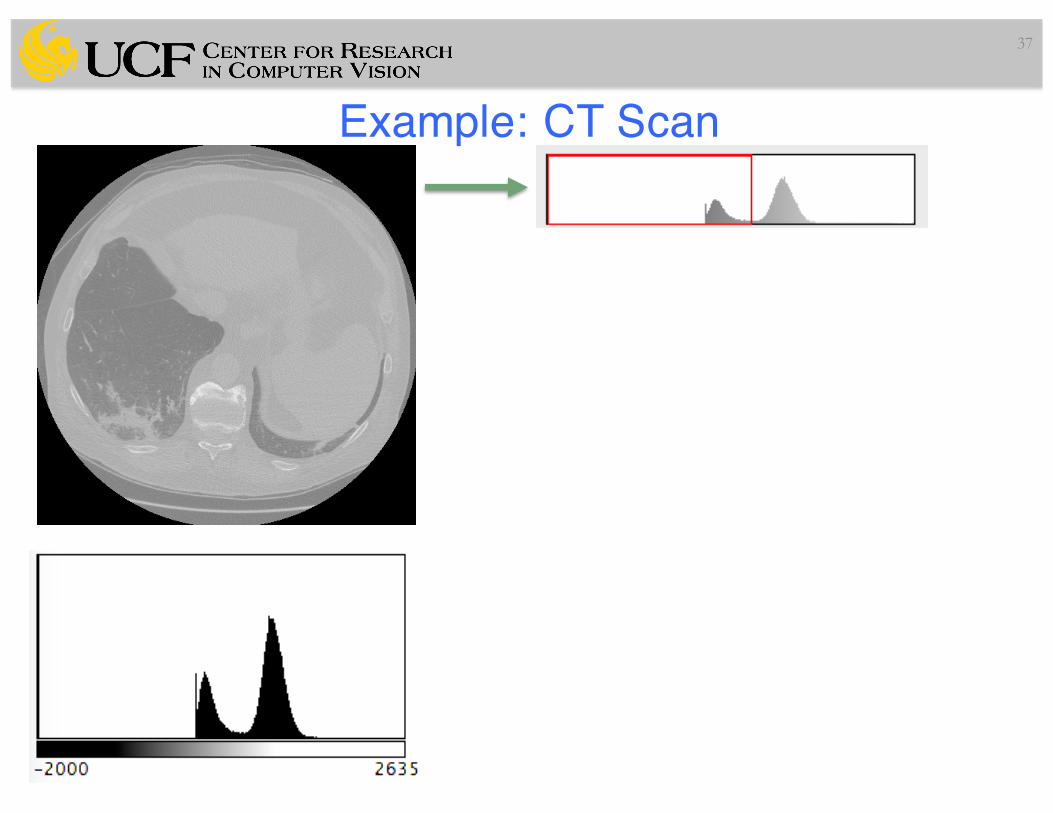
Example: CT Scan
37
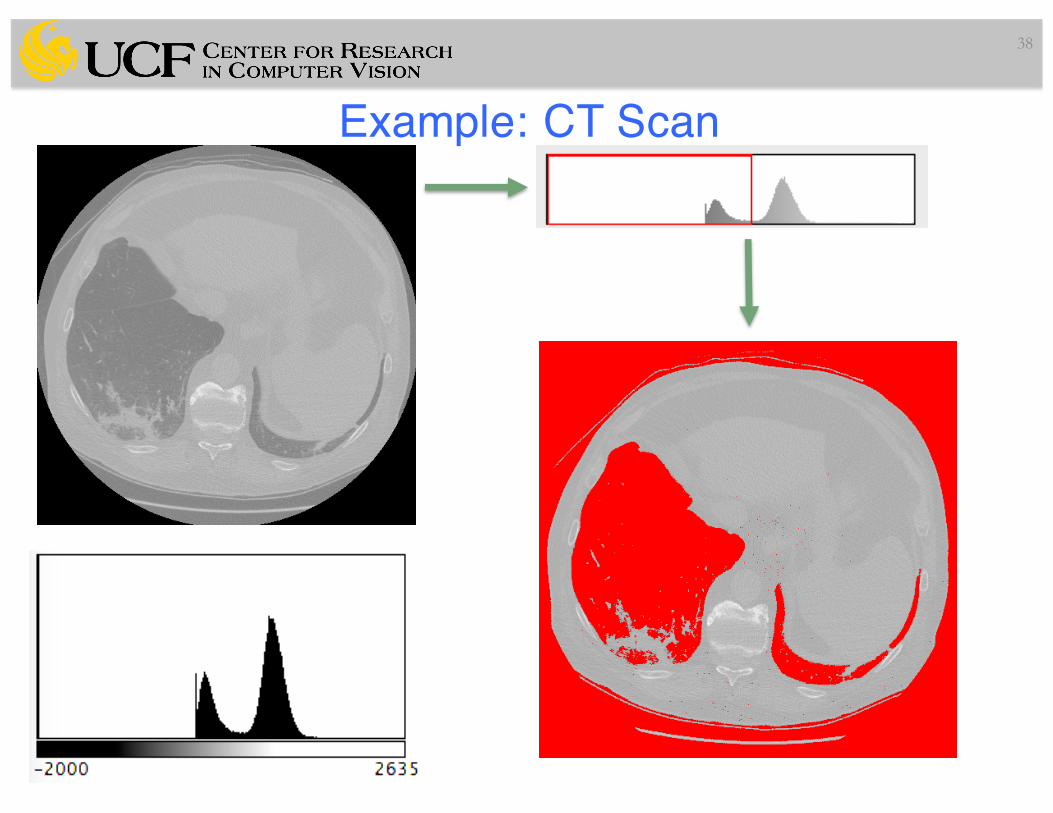
Example: CT Scan
38
Thresholding Methods• Huang• Intermode• Isodata• Li• MaxEntropy• Mean• MinError• Otsu• Percentile• RenyiEntropy• Moments
39
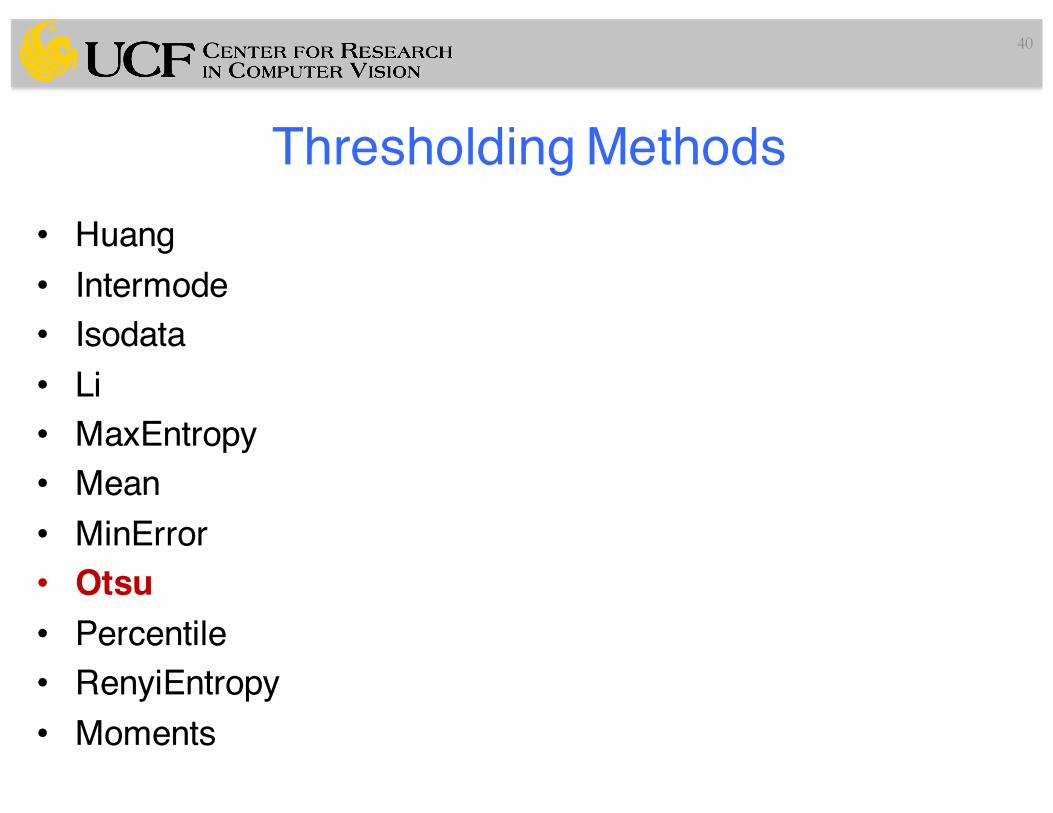
Thresholding Methods• Huang• Intermode• Isodata• Li• MaxEntropy• Mean• MinError• Otsu• Percentile• RenyiEntropy• Moments
40
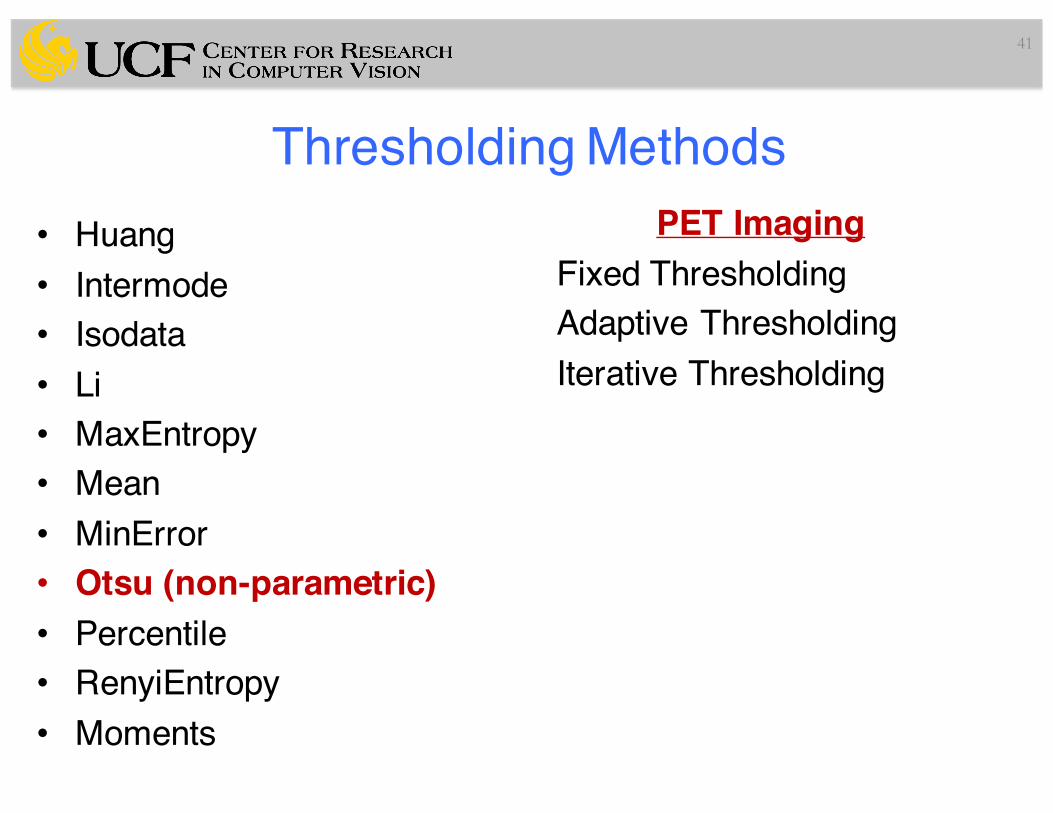
Thresholding MethodsPET Imaging
Fixed ThresholdingAdaptive ThresholdingIterative Thresholding
41
• Huang• Intermode• Isodata• Li• MaxEntropy• Mean• MinError• Otsu (non-parametric)• Percentile• RenyiEntropy• Moments
Otsu Thresholding• Definition: The method uses the grey-value histogram of the
given image I as input and aims at providing the best threshold in the sense that the “overlap” between two classes, set of object and background pixels, is minimized (i.e., by finding the best balance).
42
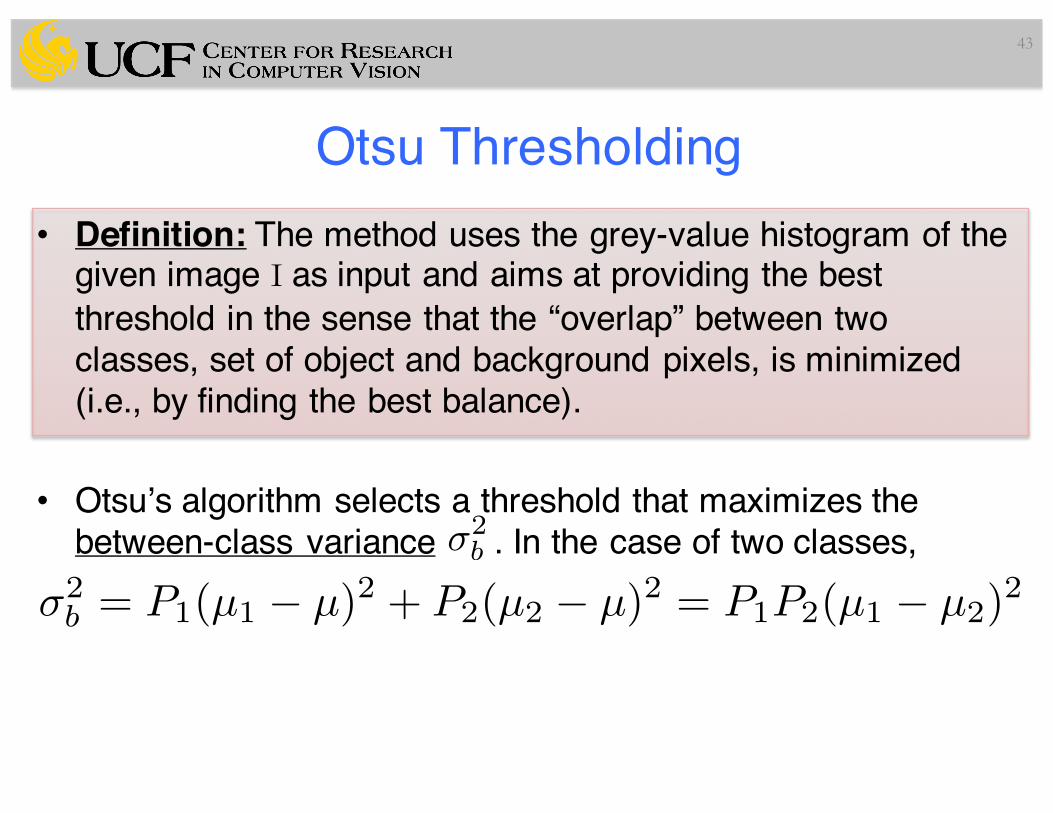
Otsu Thresholding• Definition: The method uses the grey-value histogram of the
given image I as input and aims at providing the best threshold in the sense that the “overlap” between two classes, set of object and background pixels, is minimized (i.e., by finding the best balance).
• Otsu’s algorithm selects a threshold that maximizes the between-class variance . In the case of two classes,
43
�2b
�2b = P1(µ1 � µ)2 + P2(µ2 � µ)2 = P1P2(µ1 � µ2)
2
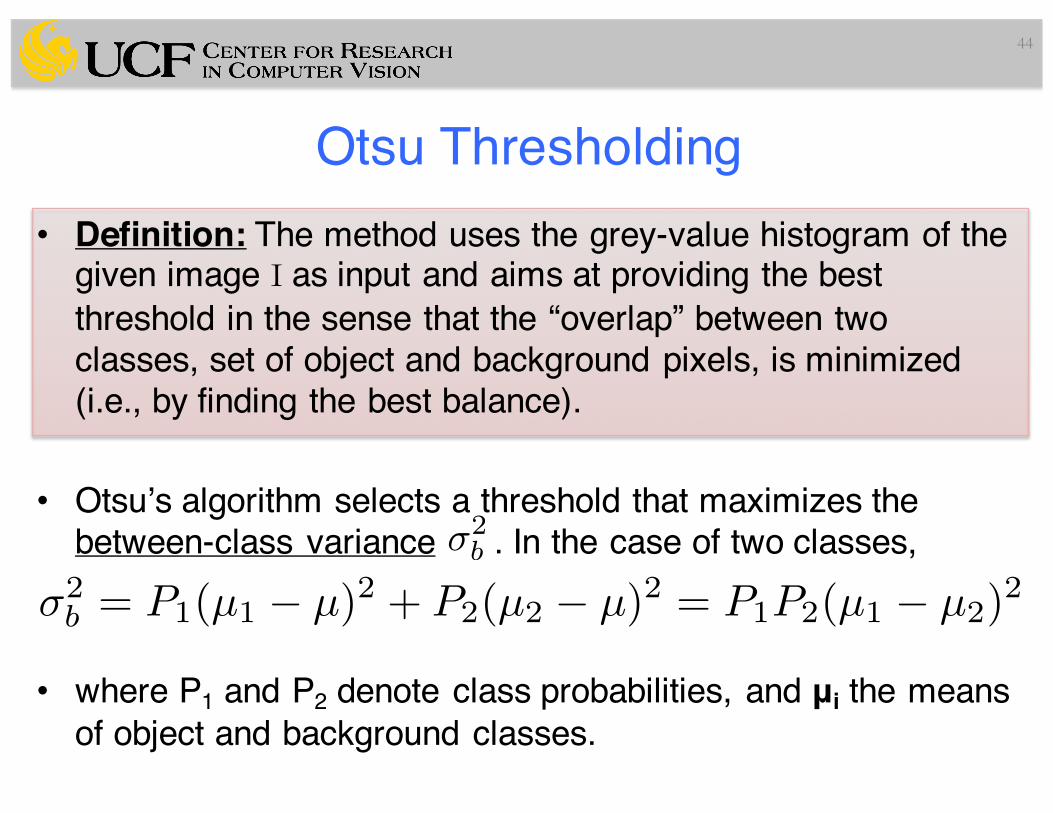
Otsu Thresholding• Definition: The method uses the grey-value histogram of the
given image I as input and aims at providing the best threshold in the sense that the “overlap” between two classes, set of object and background pixels, is minimized (i.e., by finding the best balance).
• Otsu’s algorithm selects a threshold that maximizes the between-class variance . In the case of two classes,
• where P1 and P2 denote class probabilities, and μi the means of object and background classes.
44
�2b
�2b = P1(µ1 � µ)2 + P2(µ2 � µ)2 = P1P2(µ1 � µ2)
2
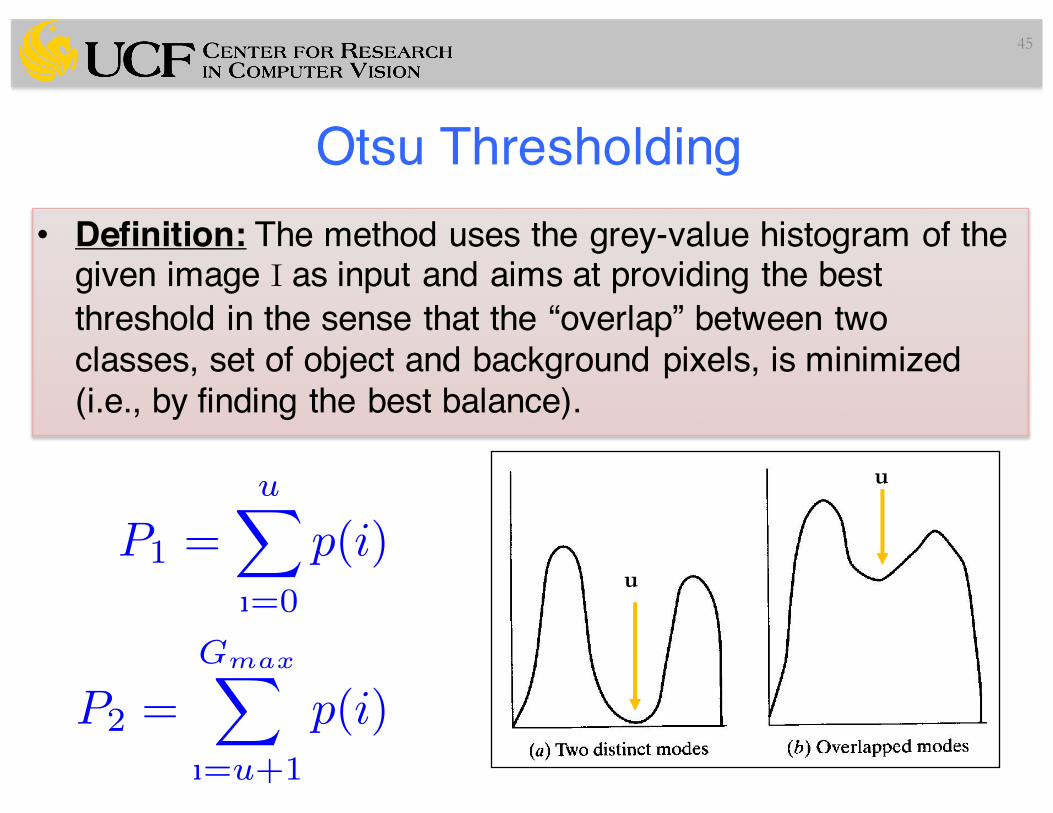
Otsu Thresholding• Definition: The method uses the grey-value histogram of the
given image I as input and aims at providing the best threshold in the sense that the “overlap” between two classes, set of object and background pixels, is minimized (i.e., by finding the best balance).
45
P1 =uX
ı=0
p(i)
P2 =G
maxX
ı=u+1
p(i)
u
u
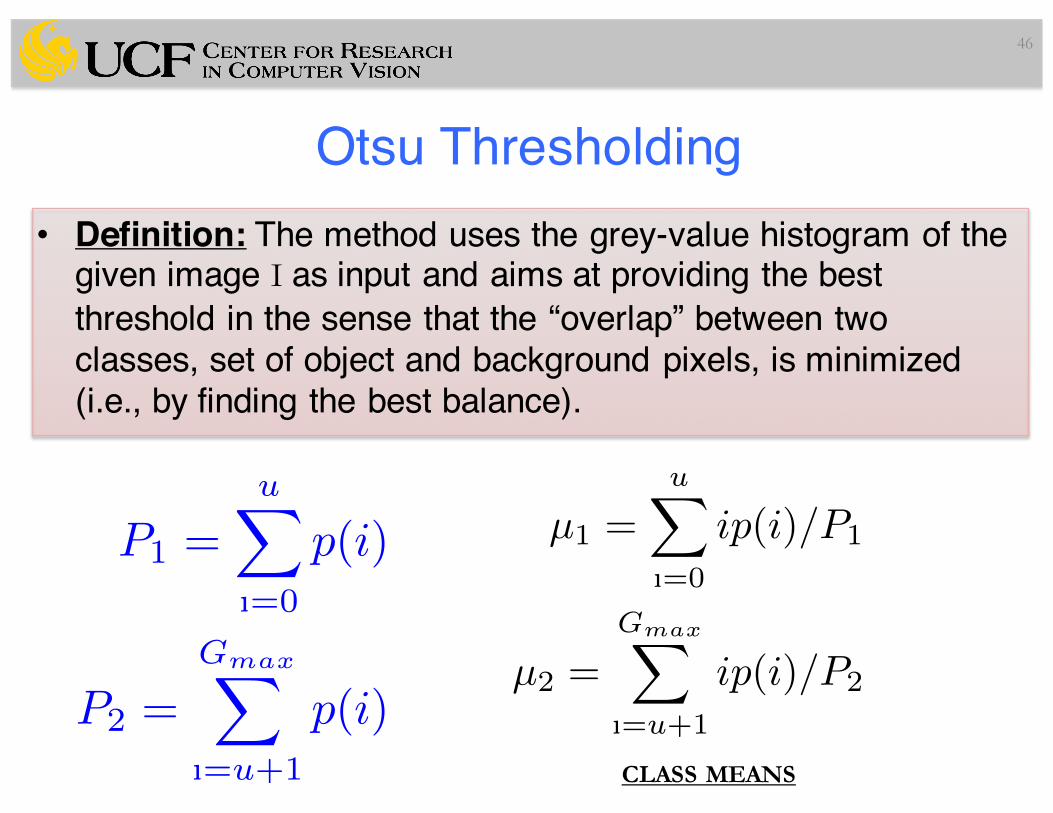
Otsu Thresholding• Definition: The method uses the grey-value histogram of the
given image I as input and aims at providing the best threshold in the sense that the “overlap” between two classes, set of object and background pixels, is minimized (i.e., by finding the best balance).
46
P1 =uX
ı=0
p(i)
P2 =G
maxX
ı=u+1
p(i)
µ1 =uX
ı=0
ip(i)/P1
µ2 =G
maxX
ı=u+1
ip(i)/P2
CLASS MEANS
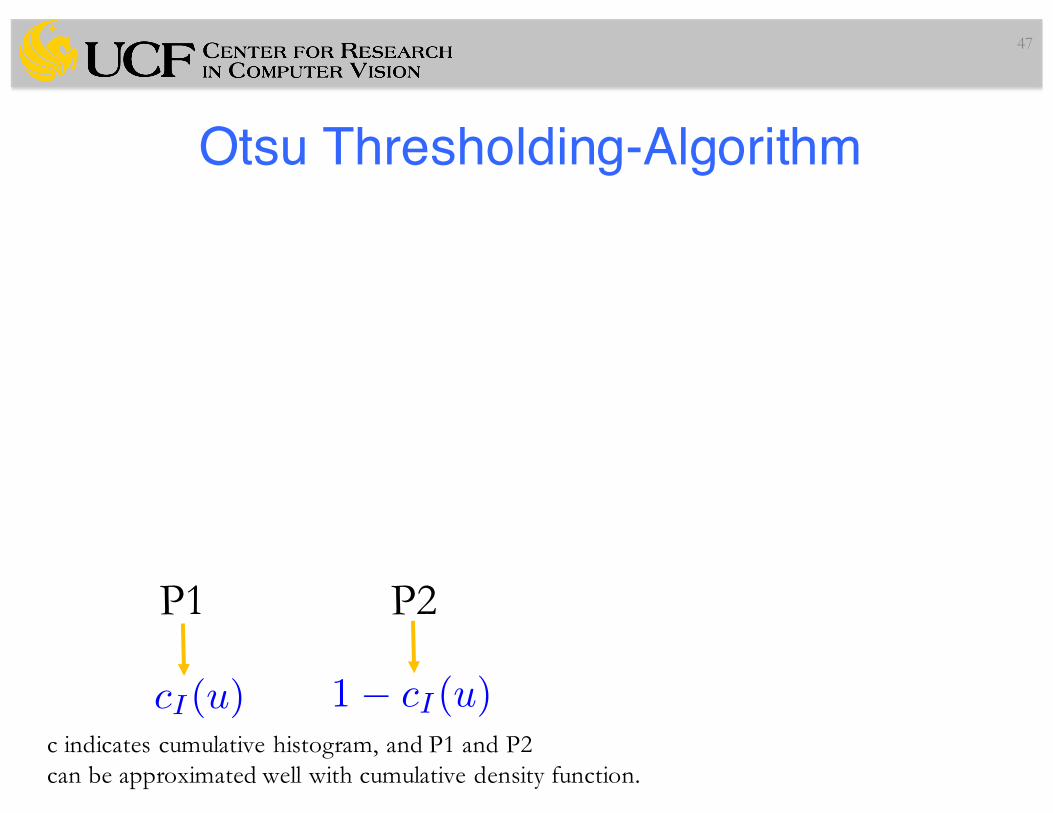
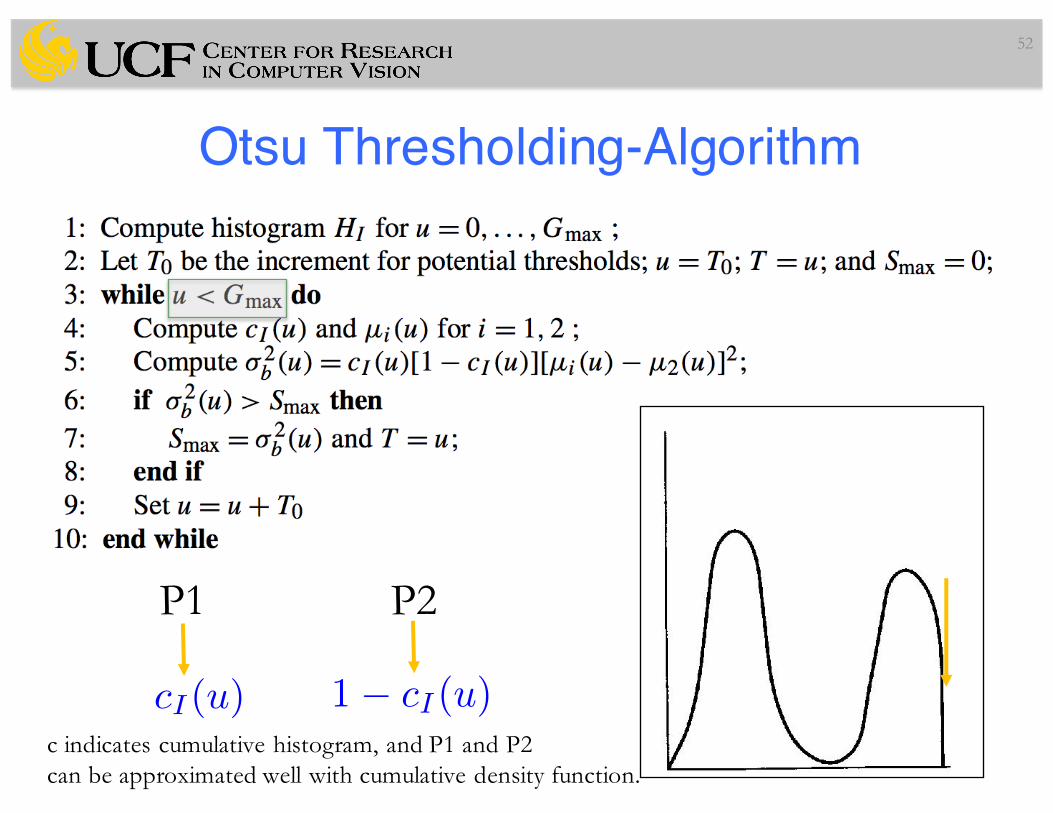
Otsu Thresholding-Algorithm
47
cI(u) 1� cI(u)
P1 P2
c indicates cumulative histogram, and P1 and P2can be approximated well with cumulative density function.
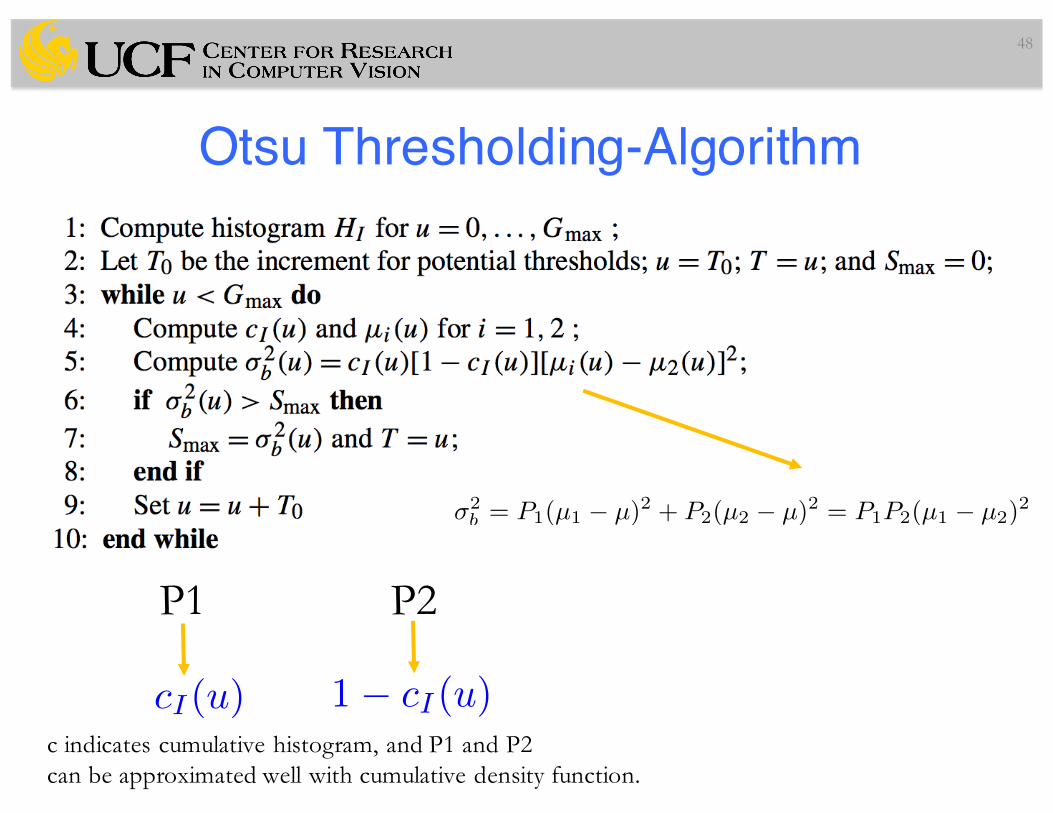
Otsu Thresholding-Algorithm
48
cI(u) 1� cI(u)
P1 P2
c indicates cumulative histogram, and P1 and P2can be approximated well with cumulative density function.
�2b = P1(µ1 � µ)2 + P2(µ2 � µ)2 = P1P2(µ1 � µ2)
2
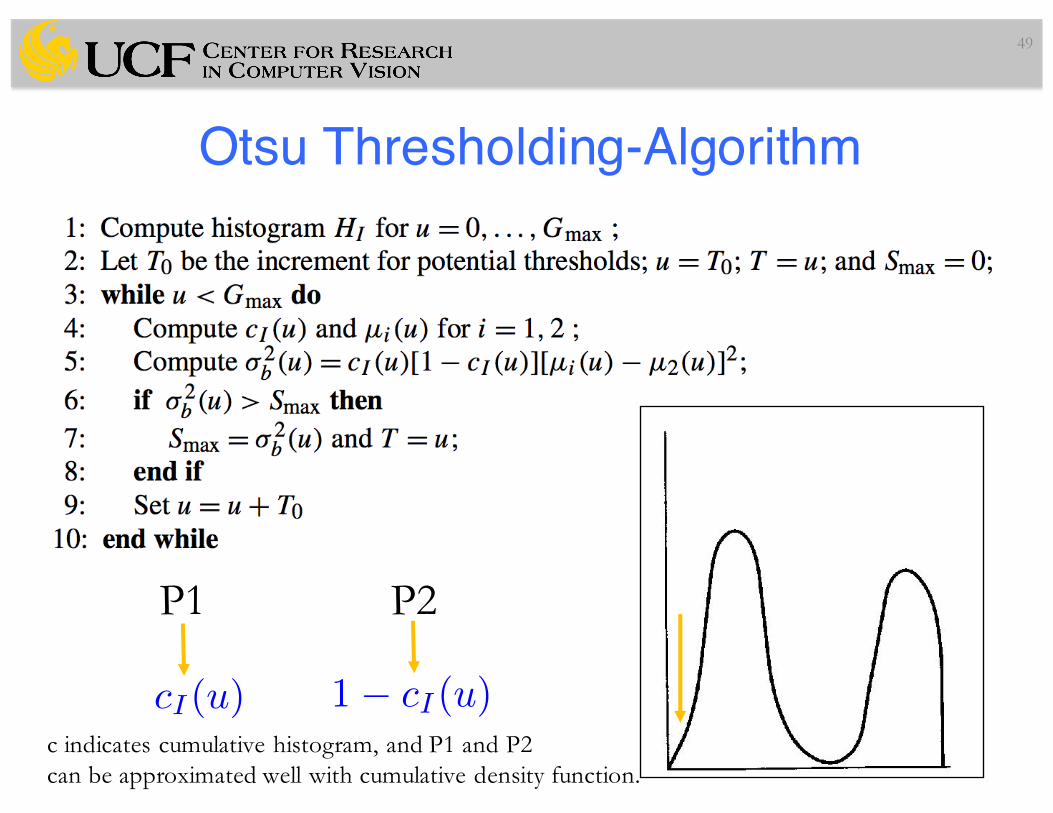
Otsu Thresholding-Algorithm
49
cI(u) 1� cI(u)
P1 P2
c indicates cumulative histogram, and P1 and P2can be approximated well with cumulative density function.
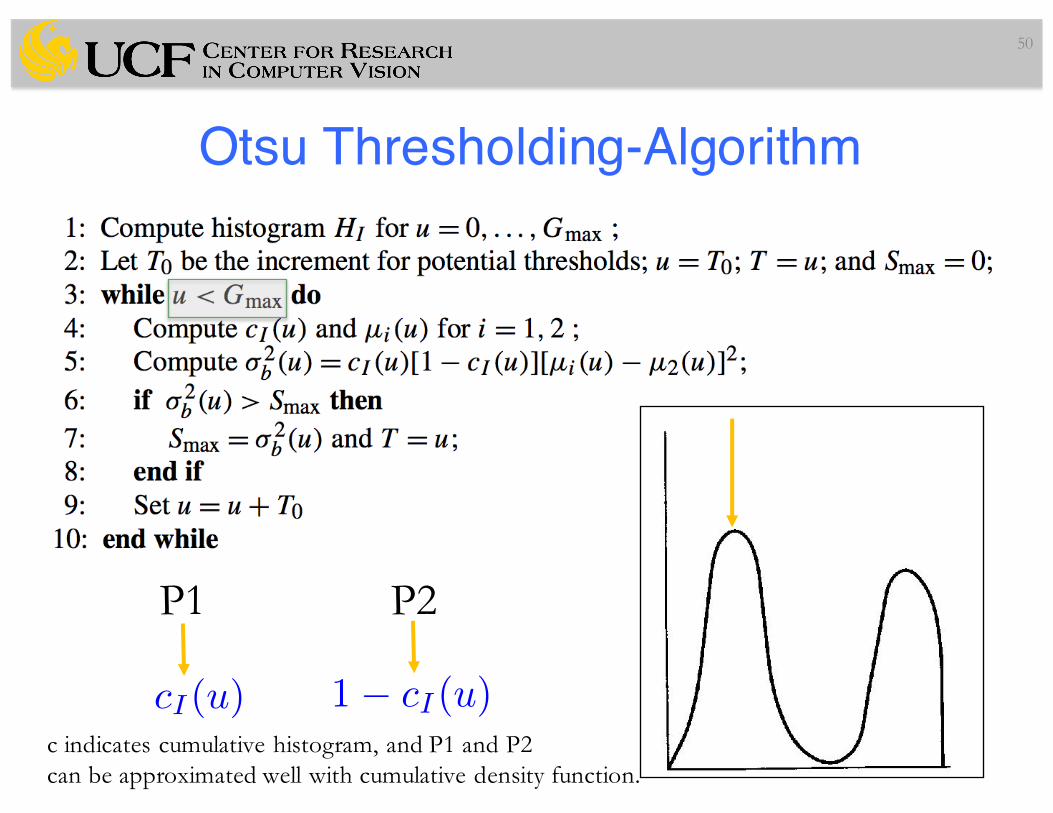
Otsu Thresholding-Algorithm
50
cI(u) 1� cI(u)
P1 P2
c indicates cumulative histogram, and P1 and P2can be approximated well with cumulative density function.
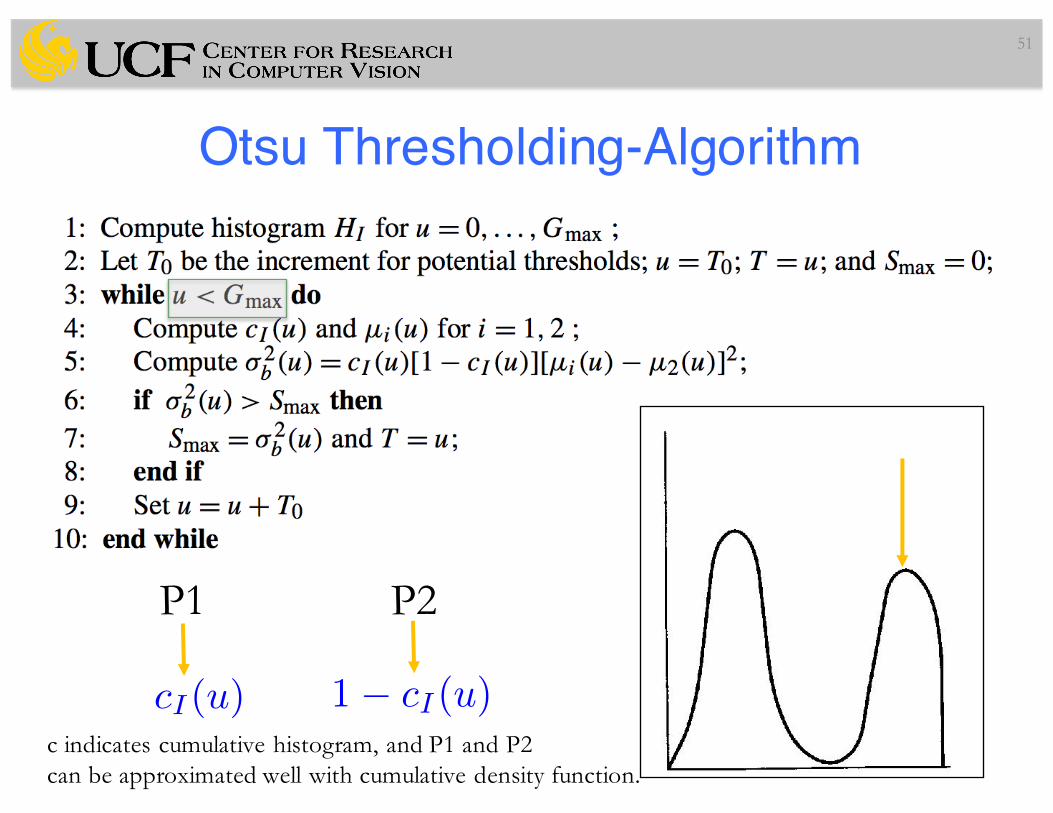
Otsu Thresholding-Algorithm
51
cI(u) 1� cI(u)
P1 P2
c indicates cumulative histogram, and P1 and P2can be approximated well with cumulative density function.
Otsu Thresholding-Algorithm
52
cI(u) 1� cI(u)
P1 P2
c indicates cumulative histogram, and P1 and P2can be approximated well with cumulative density function.
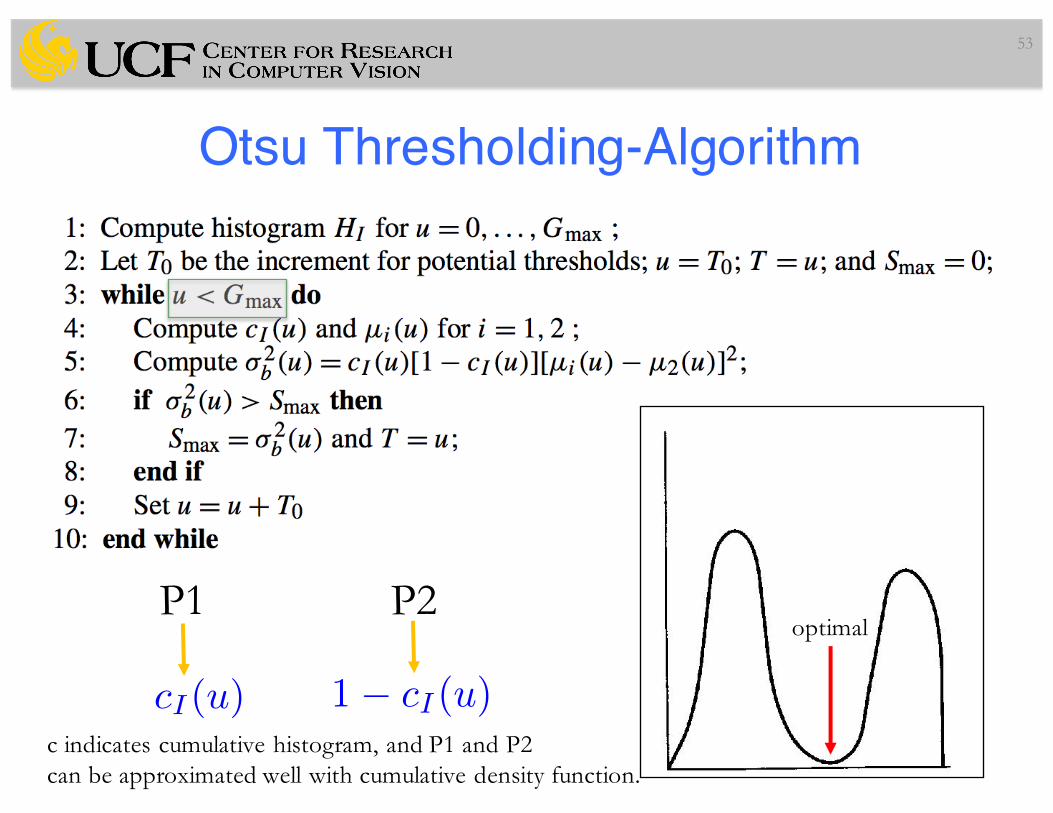
Otsu Thresholding-Algorithm
53
cI(u) 1� cI(u)
P1 P2
c indicates cumulative histogram, and P1 and P2can be approximated well with cumulative density function.
optimal
Parametric Method for Optimal Thresholding
• Assuming again a two-class problem and assuming that the distribution of gray levels for each class can be modeled by a normal distribution with mean and variance
54
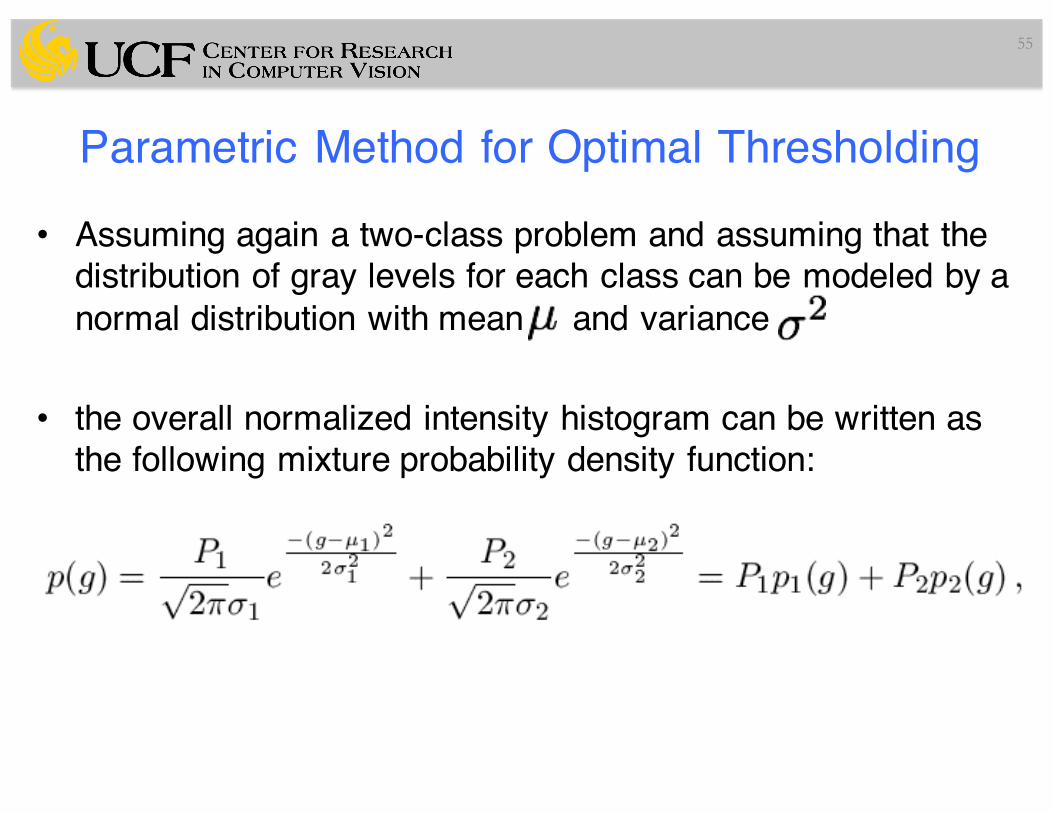
Parametric Method for Optimal Thresholding
• Assuming again a two-class problem and assuming that the distribution of gray levels for each class can be modeled by a normal distribution with mean and variance
• the overall normalized intensity histogram can be written as the following mixture probability density function:
55
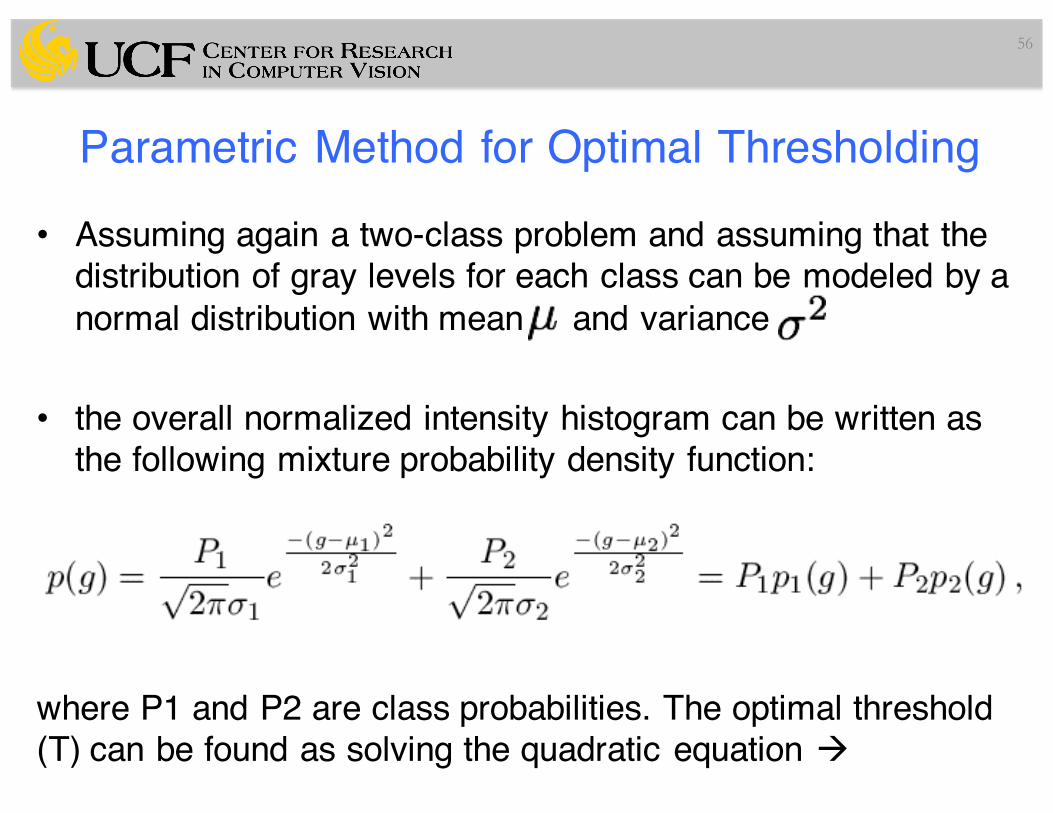
Parametric Method for Optimal Thresholding
• Assuming again a two-class problem and assuming that the distribution of gray levels for each class can be modeled by a normal distribution with mean and variance
• the overall normalized intensity histogram can be written as the following mixture probability density function:
where P1 and P2 are class probabilities. The optimal threshold (T) can be found as solving the quadratic equation à
56
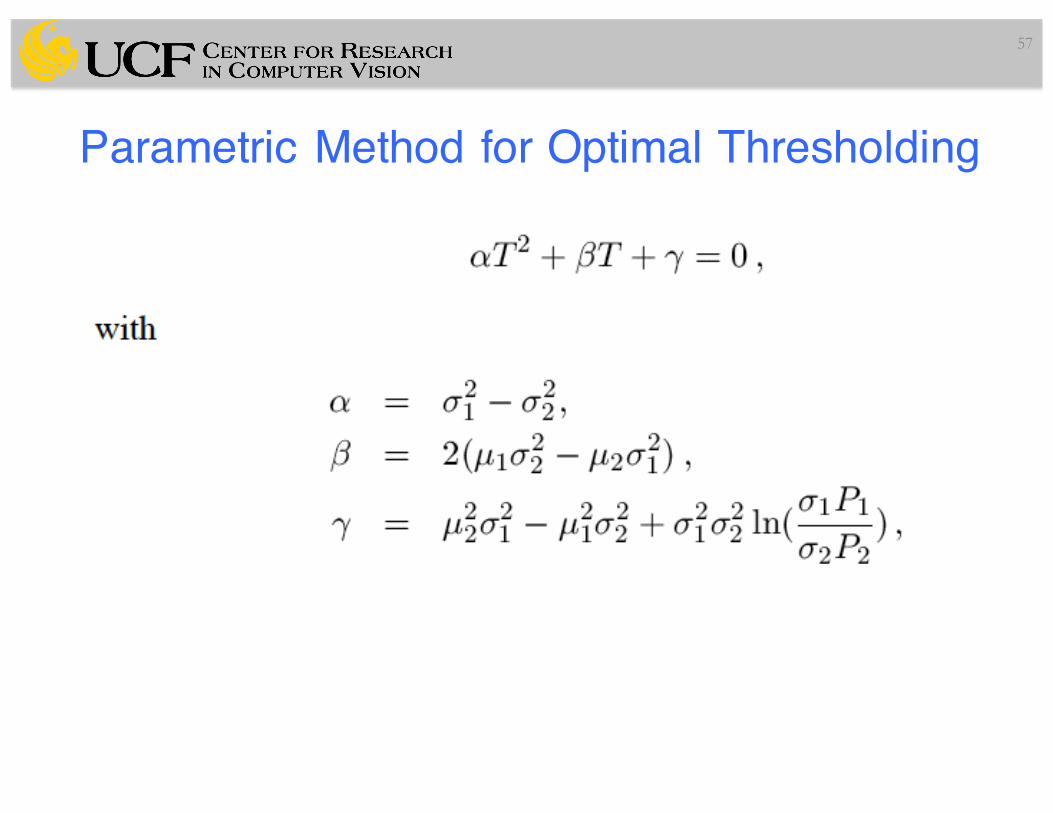
Parametric Method for Optimal Thresholding
57
Parametric Method for Optimal Thresholding
58
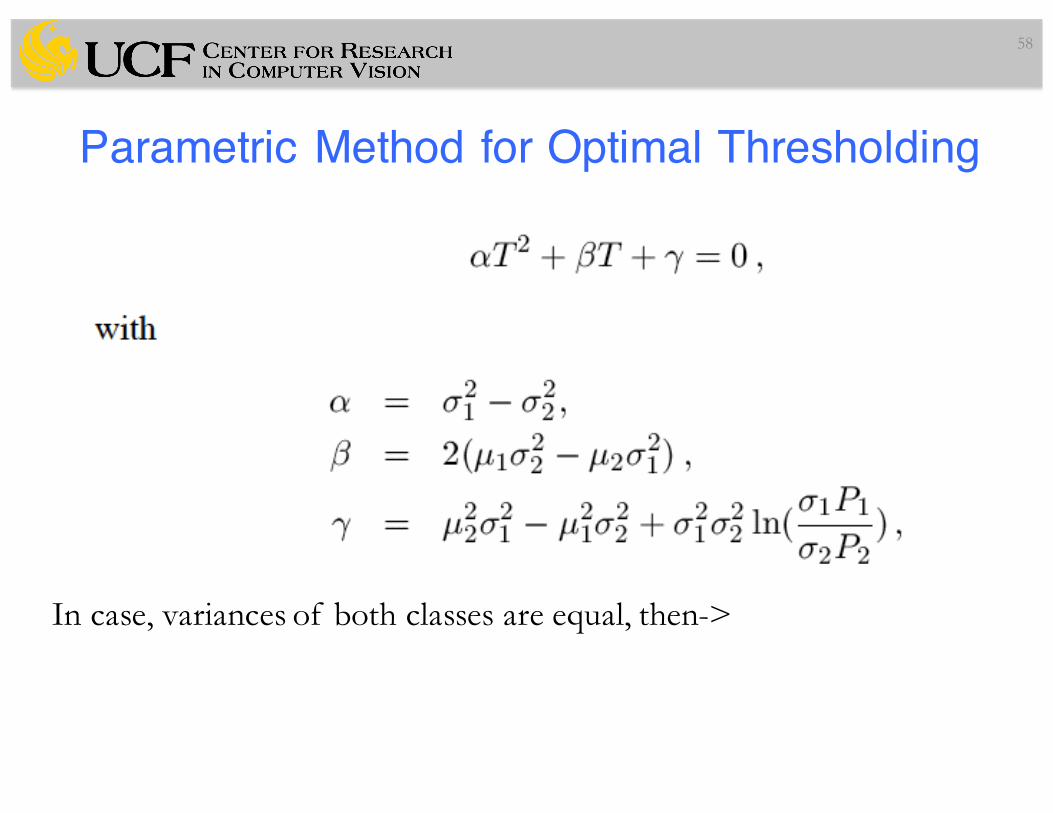
In case, variances of both classes are equal, then->
Parametric Method for Optimal Thresholding
59
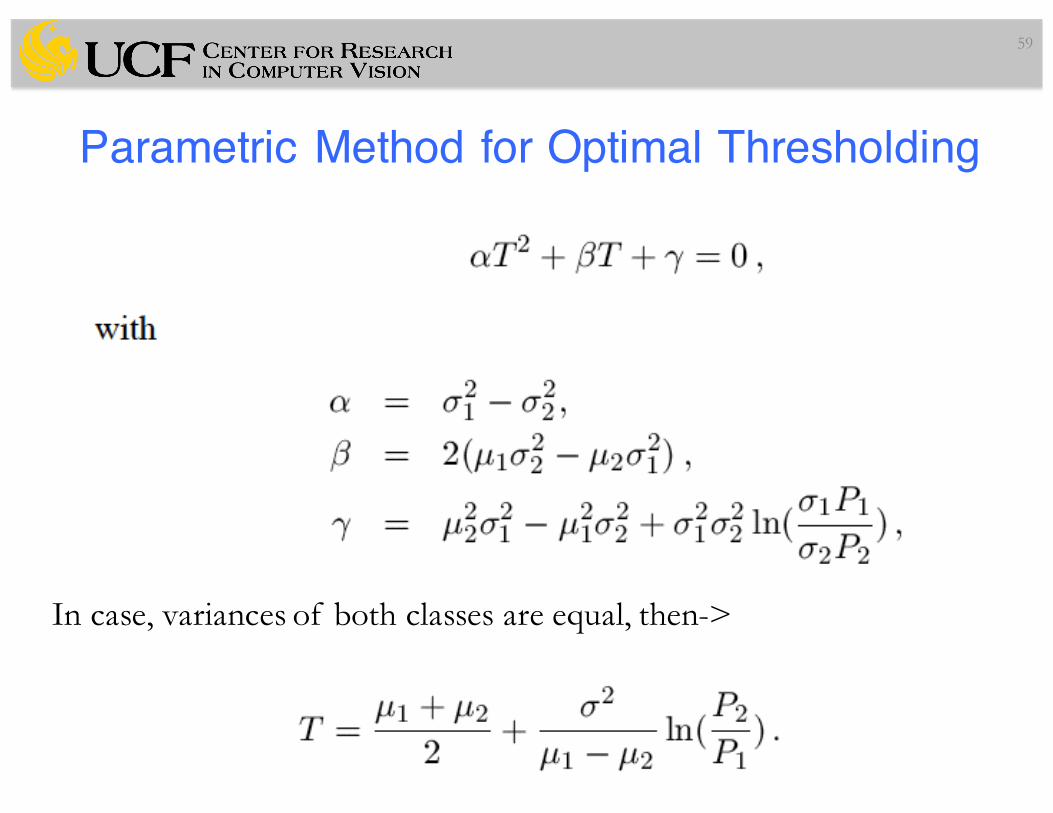
In case, variances of both classes are equal, then->
Thresholding methods for PET Image Segmentation
• Due to the nature of PET images (i.e., low resolution with high contrast), thresholding-based methods are suitable – because the local or global intensity histogram usually provides a
sufficient level of information for separating the foreground (object of interest) from the background. (Foster, Bagci, et al., CBM 2014)
60
Thresholding methods for PET Image Segmentation
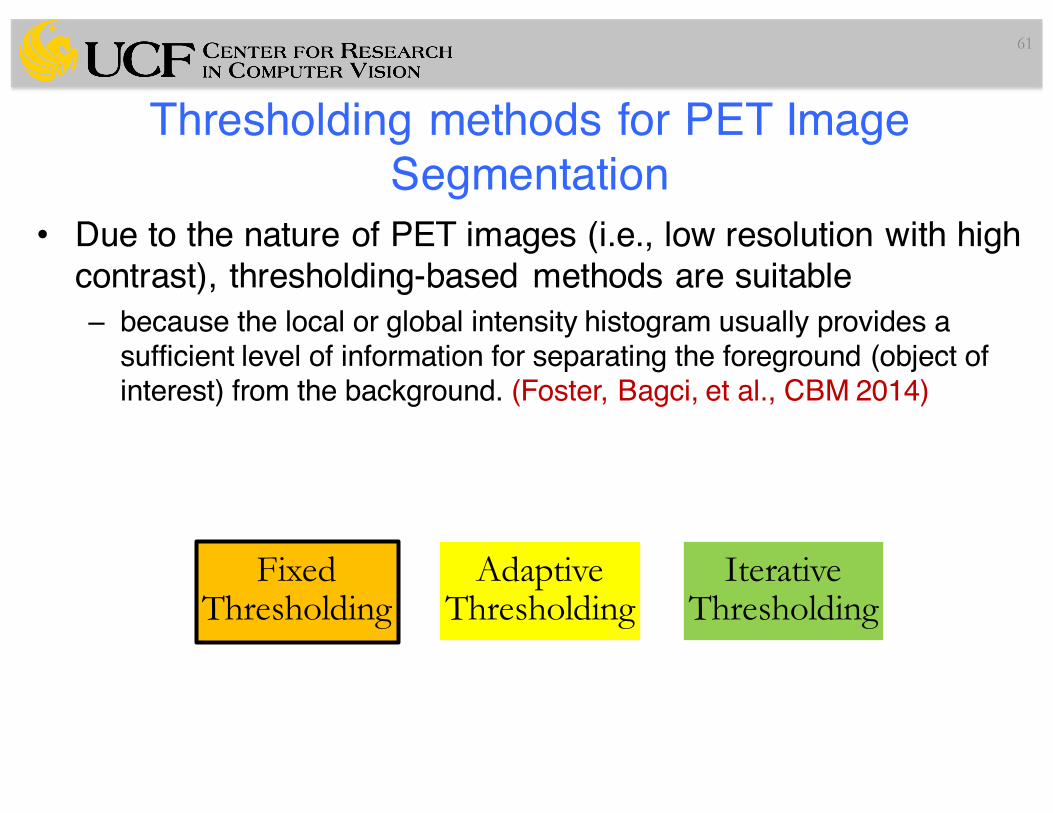
• Due to the nature of PET images (i.e., low resolution with high contrast), thresholding-based methods are suitable – because the local or global intensity histogram usually provides a
sufficient level of information for separating the foreground (object of interest) from the background. (Foster, Bagci, et al., CBM 2014)
61
Fixed Thresholding
Adaptive Thresholding
Iterative Thresholding
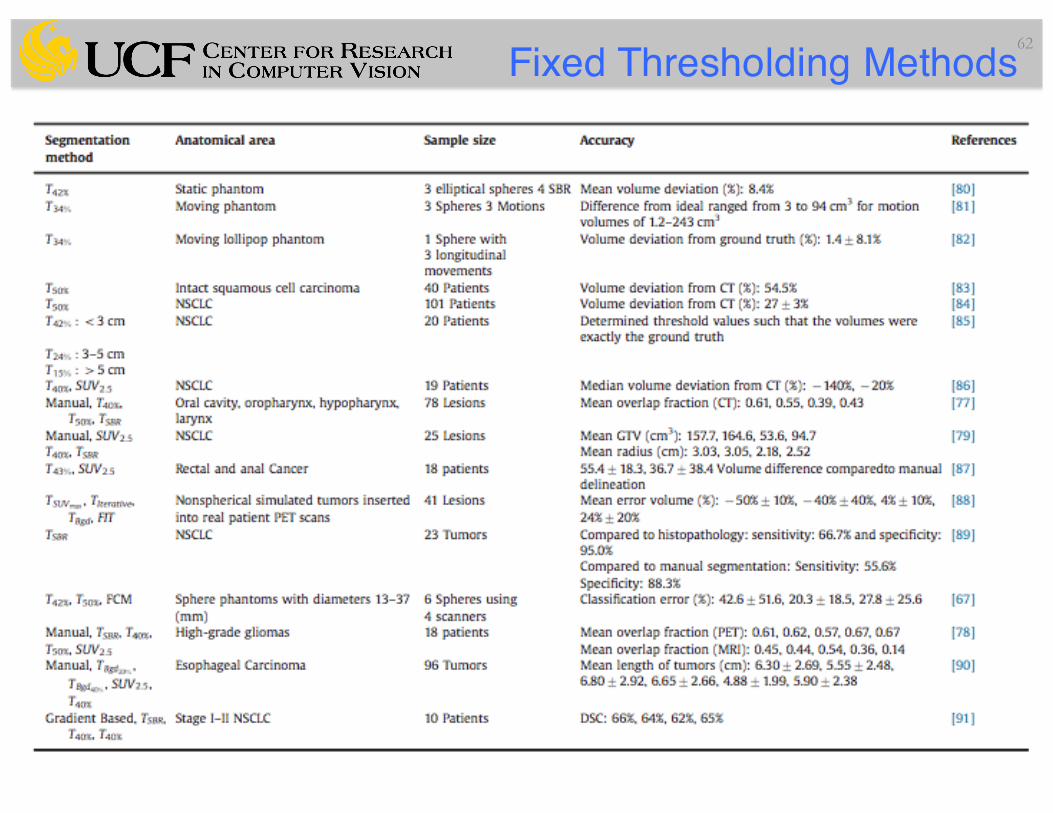
Fixed Thresholding Methods
• Due to the nature of PET images (i.e., low resolution with high contrast), thresholding-based methods are suitable – because the local or global intensity histogram usually provides a
sufficient level of information for separating the foreground (object of interest) from the background. (Foster, Bagci, et al., CBM 2014)
62
Thresholding methods for PET Image Segmentation
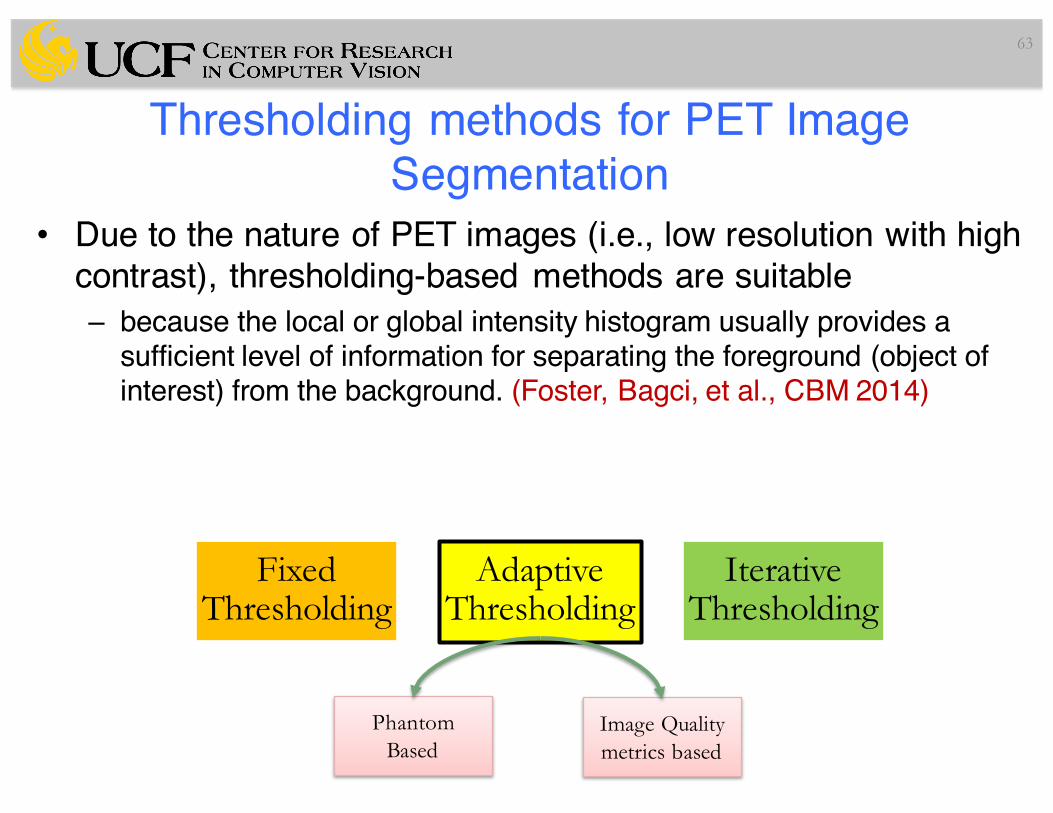
• Due to the nature of PET images (i.e., low resolution with high contrast), thresholding-based methods are suitable – because the local or global intensity histogram usually provides a
sufficient level of information for separating the foreground (object of interest) from the background. (Foster, Bagci, et al., CBM 2014)
63
Fixed Thresholding
Adaptive Thresholding
Iterative Thresholding
Phantom Based
Image Quality metrics based
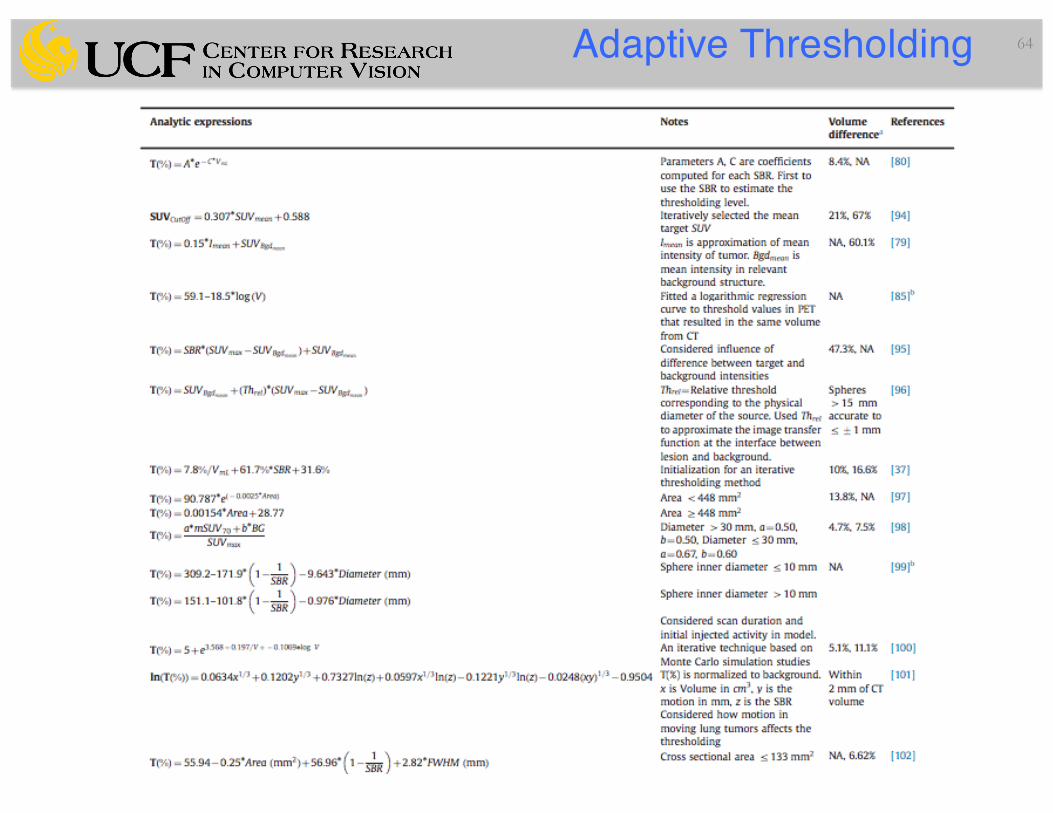
Adaptive Thresholding 64
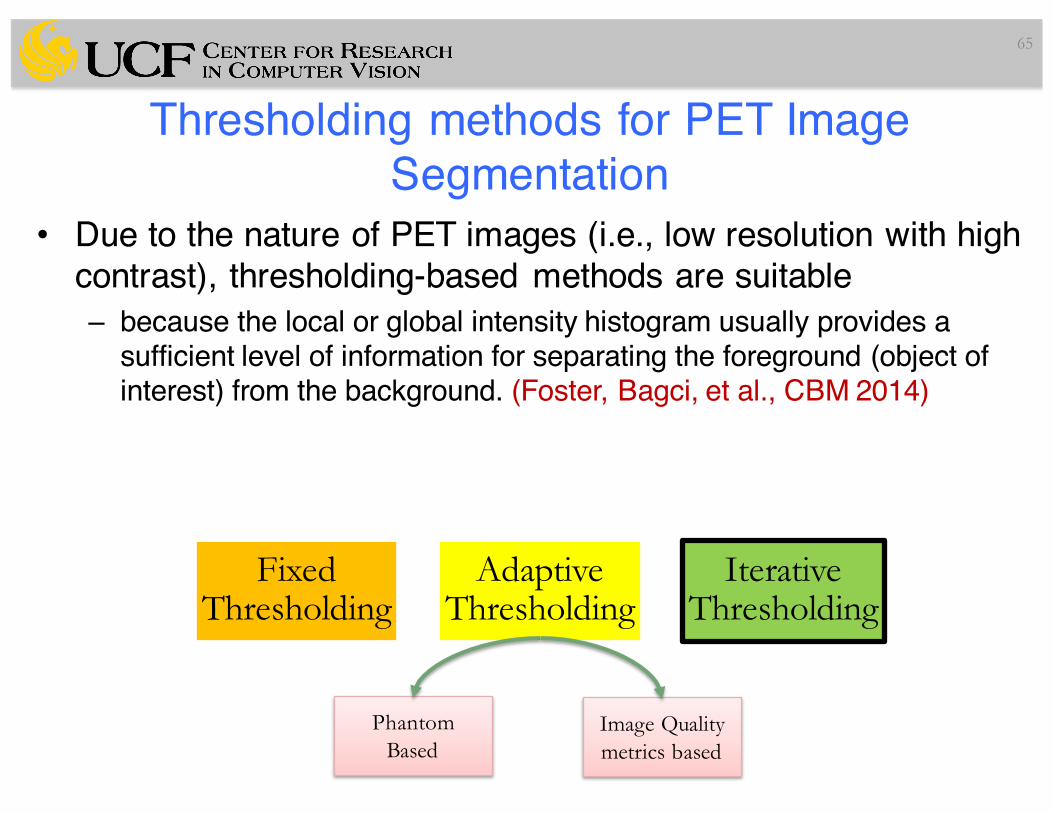
Thresholding methods for PET Image Segmentation
• Due to the nature of PET images (i.e., low resolution with high contrast), thresholding-based methods are suitable – because the local or global intensity histogram usually provides a
sufficient level of information for separating the foreground (object of interest) from the background. (Foster, Bagci, et al., CBM 2014)
65
Fixed Thresholding
Adaptive Thresholding
Iterative Thresholding
Phantom Based
Image Quality metrics based
Iterative Thresholding Method (ITM)
66
S/B: Source to background ratio.
The method is based on calibrated threshold-volume curves at varying S/B ratio acquired by phantom measurements using spheres of known volumes.
Iterative Thresholding Method (ITM)
67
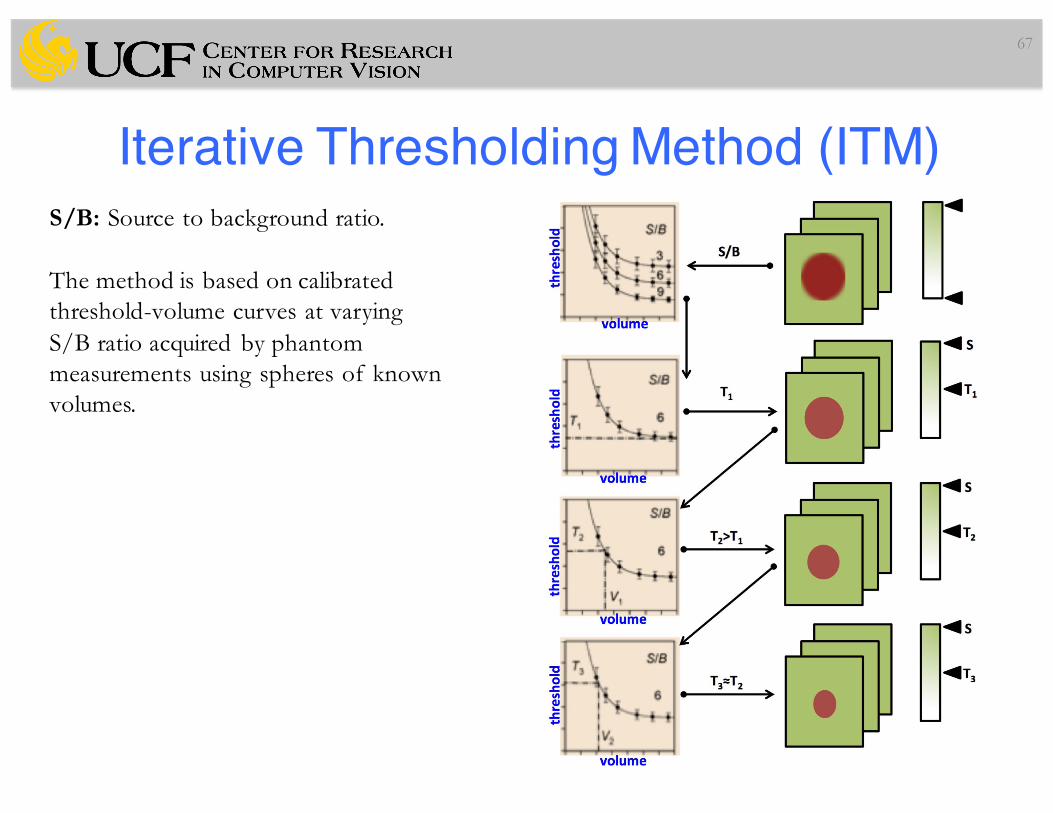
S/B: Source to background ratio.
The method is based on calibrated threshold-volume curves at varying S/B ratio acquired by phantom measurements using spheres of known volumes.
Iterative Thresholding Method (ITM)
68
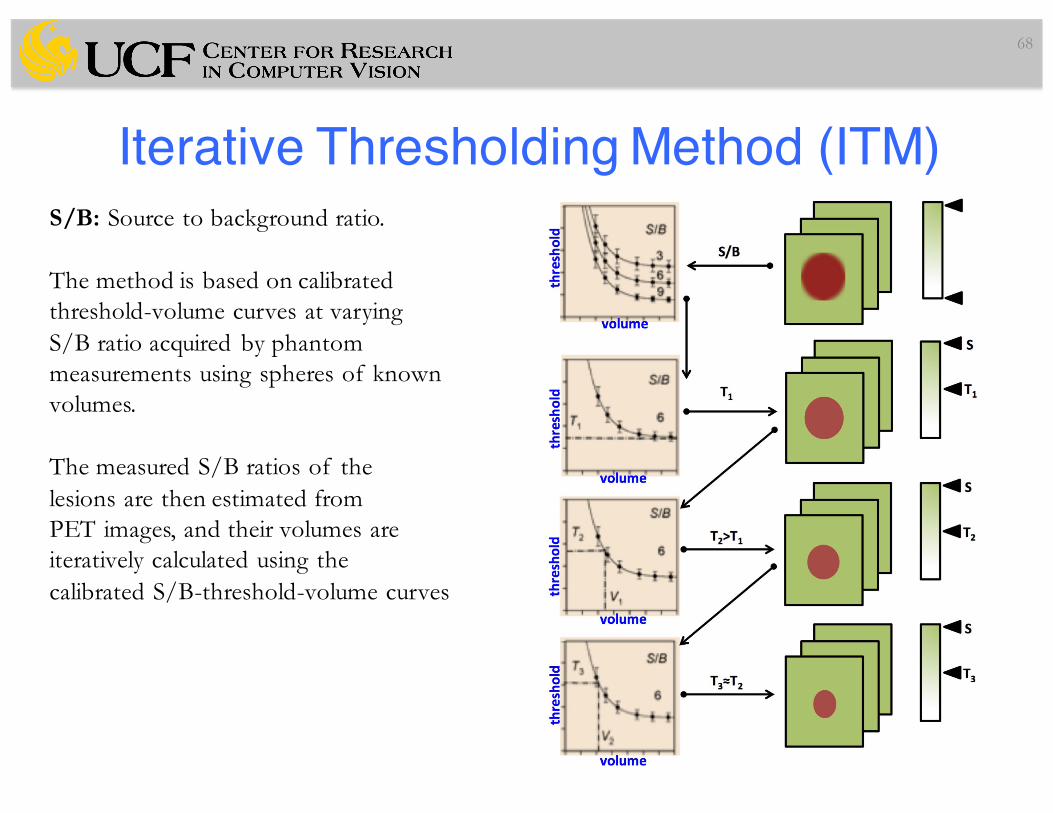
S/B: Source to background ratio.
The method is based on calibrated threshold-volume curves at varying S/B ratio acquired by phantom measurements using spheres of known volumes.
The measured S/B ratios of the lesions are then estimated from PET images, and their volumes are iteratively calculated using the calibrated S/B-threshold-volume curves
Iterative Thresholding Method (ITM)
69
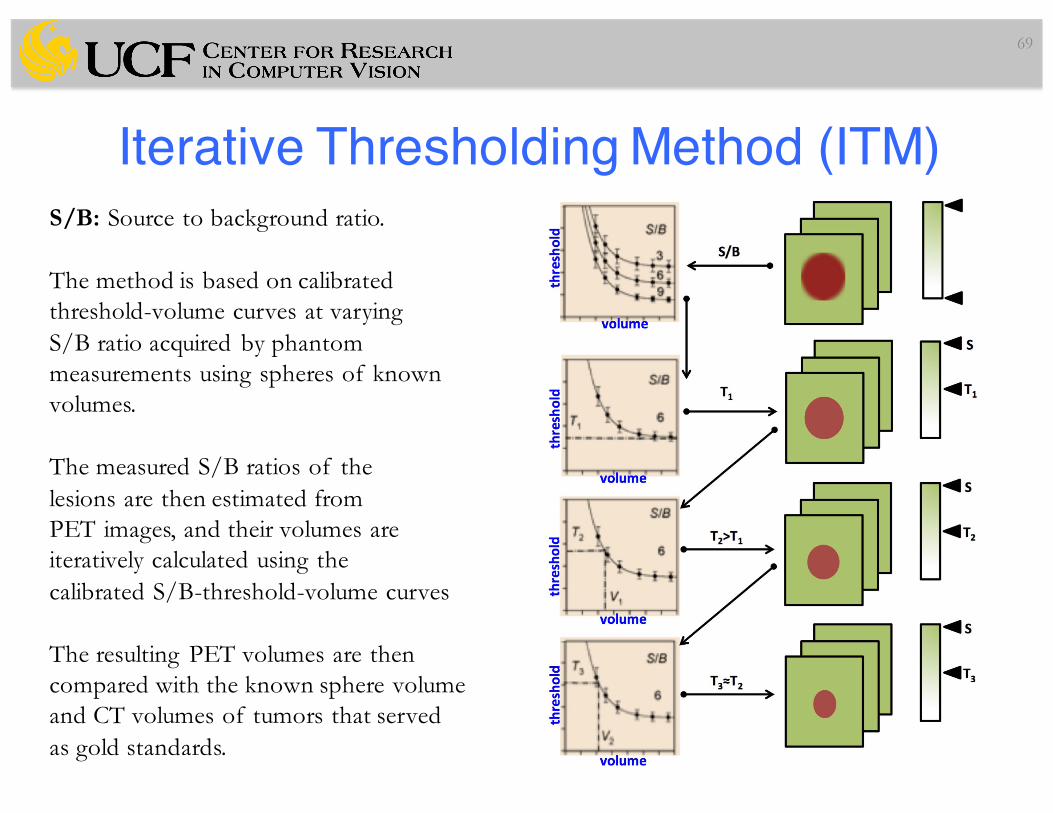
S/B: Source to background ratio.
The method is based on calibrated threshold-volume curves at varying S/B ratio acquired by phantom measurements using spheres of known volumes.
The measured S/B ratios of the lesions are then estimated from PET images, and their volumes are iteratively calculated using the calibrated S/B-threshold-volume curves
The resulting PET volumes are then compared with the known sphere volume and CT volumes of tumors that served as gold standards.
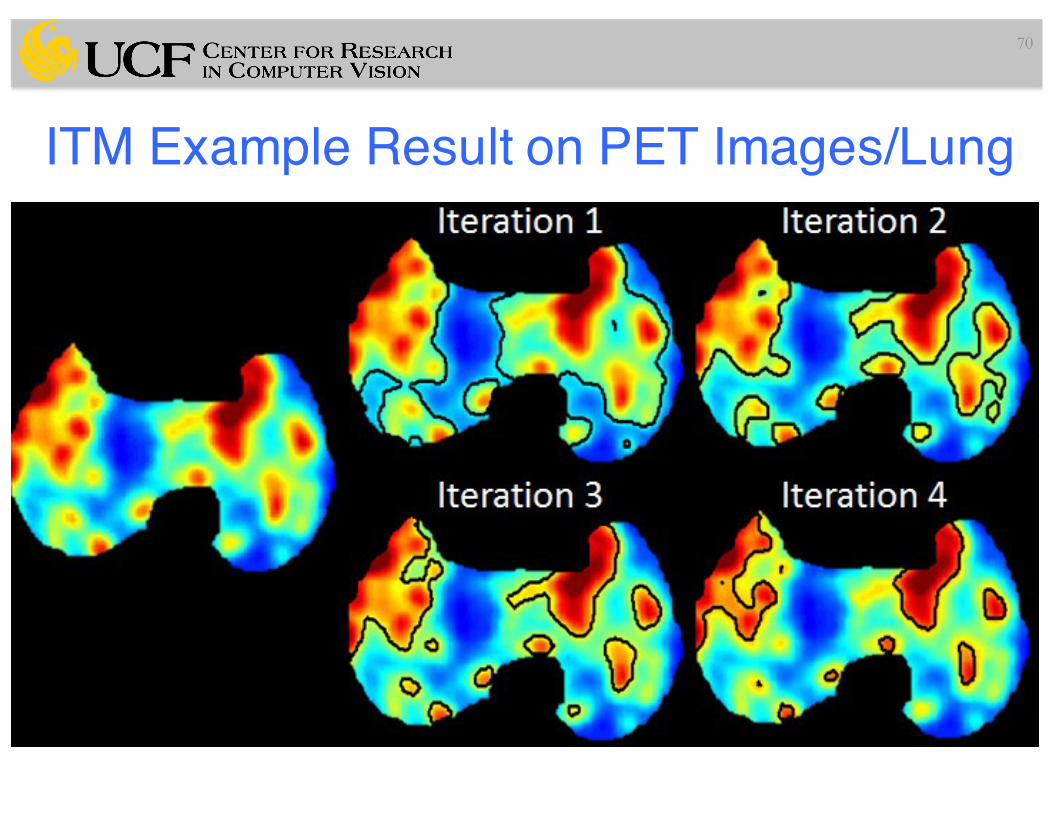
ITM Example Result on PET Images/Lung
70
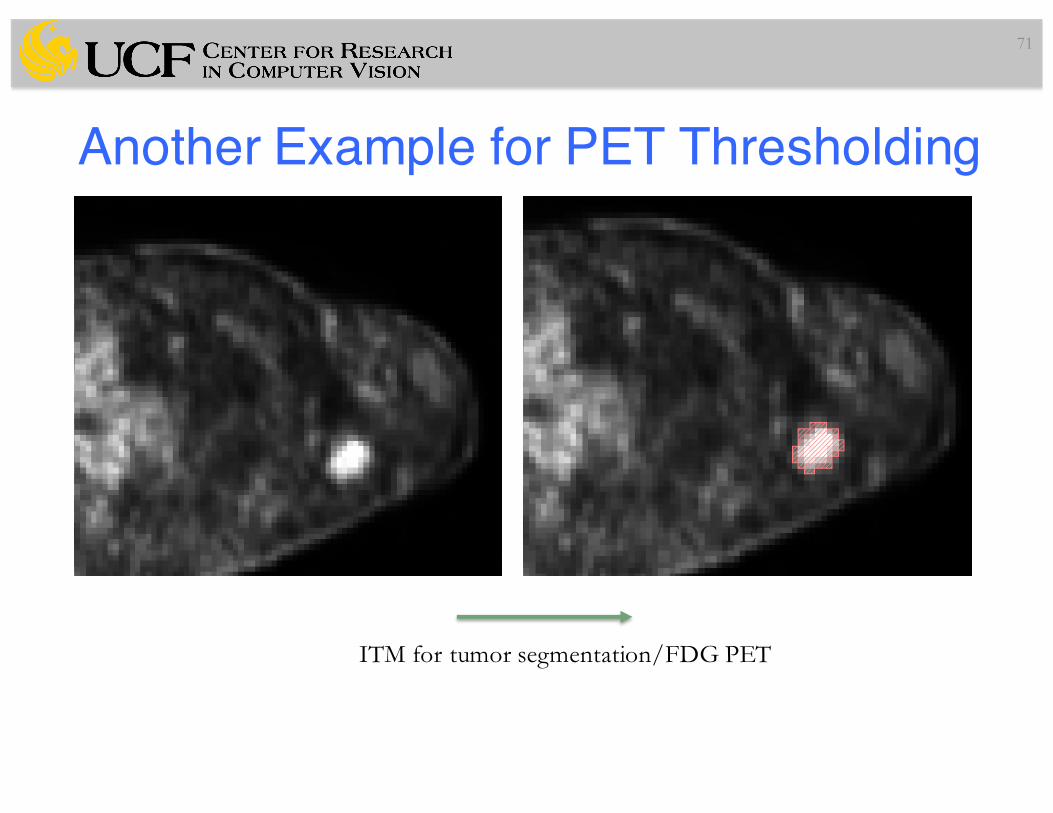
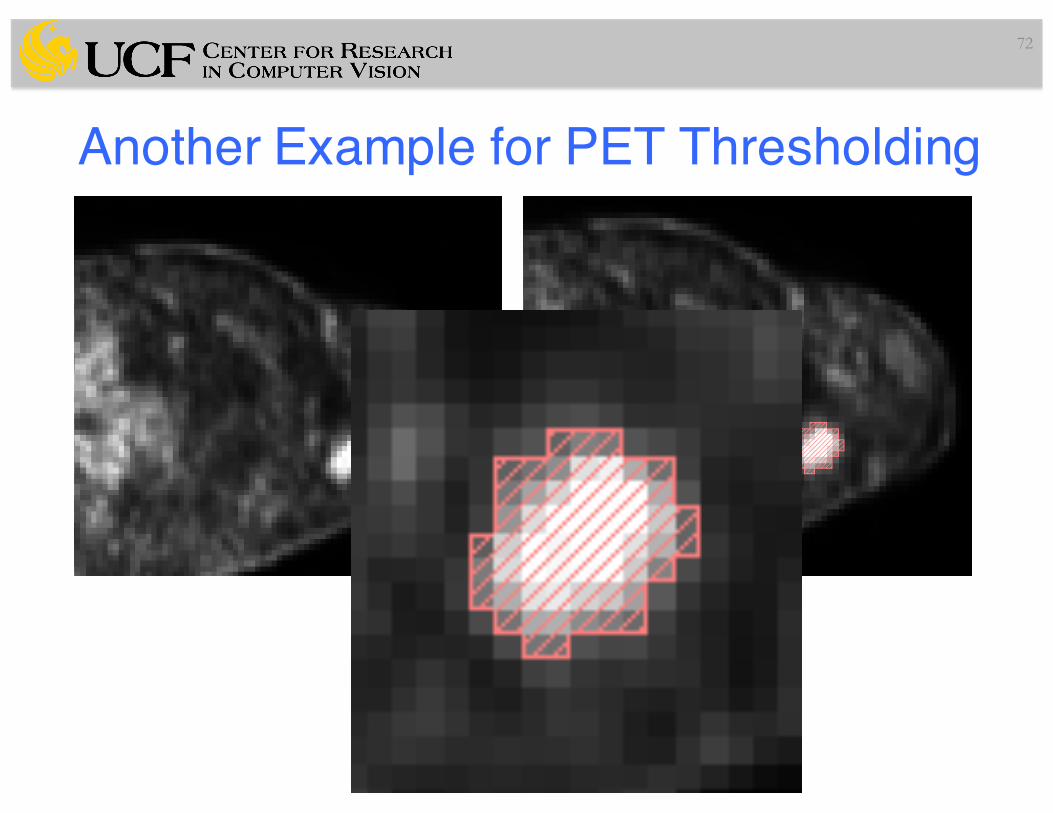
Another Example for PET Thresholding
71
ITM for tumor segmentation/FDG PET
Another Example for PET Thresholding
72
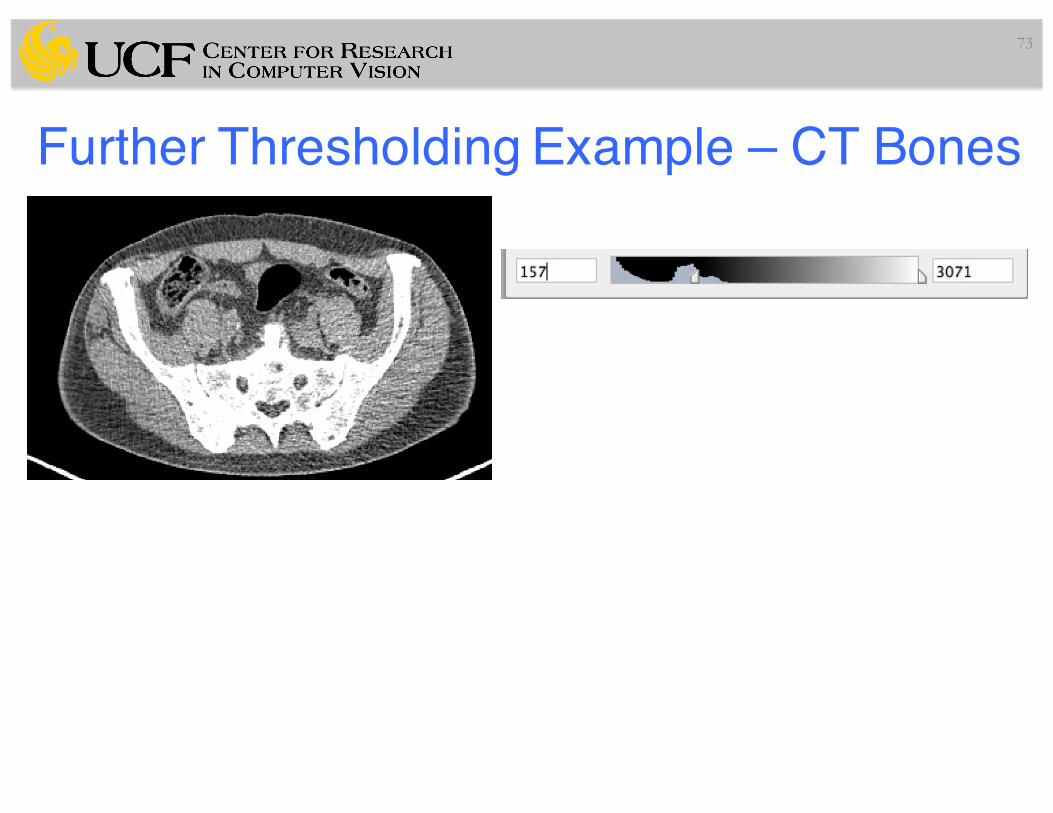
Further Thresholding Example – CT Bones
73
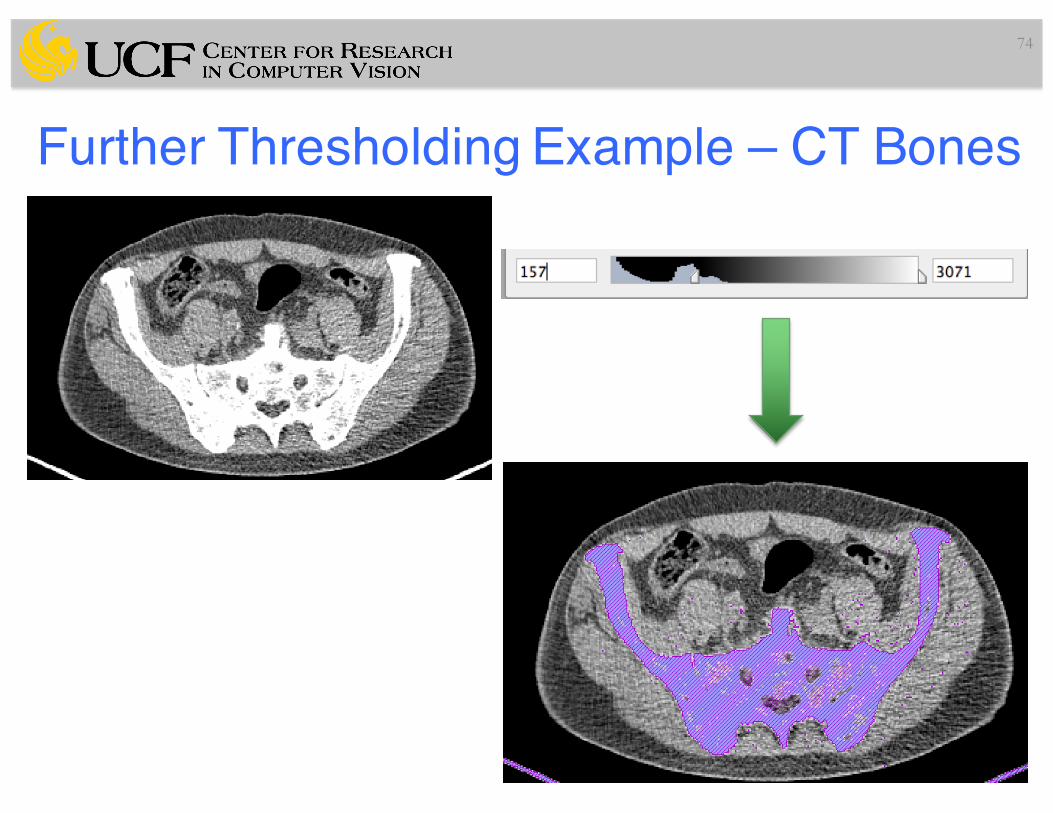
Further Thresholding Example – CT Bones
74
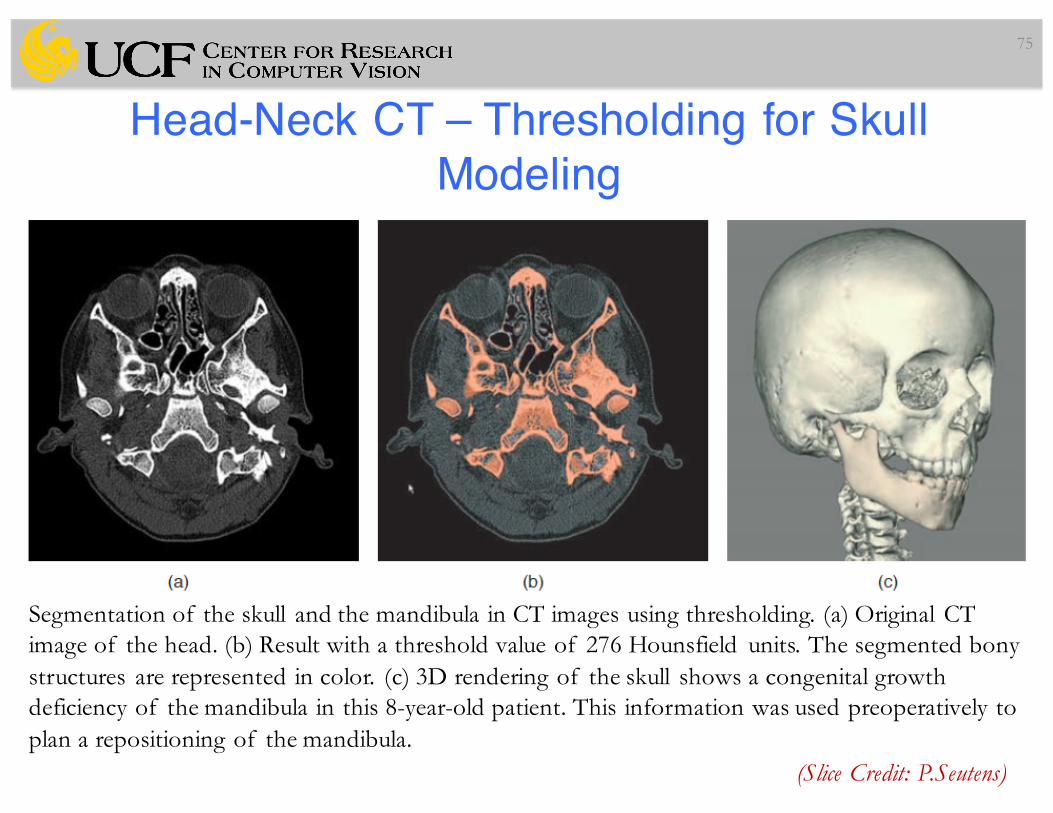
Head-Neck CT – Thresholding for Skull Modeling
75
(Slice Credit: P.Seutens)
Segmentation of the skull and the mandibula in CT images using thresholding. (a) Original CT image of the head. (b) Result with a threshold value of 276 Hounsfield units. The segmented bony structures are represented in color. (c) 3D rendering of the skull shows a congenital growth deficiency of the mandibula in this 8-year-old patient. This information was used preoperatively to plan a repositioning of the mandibula.
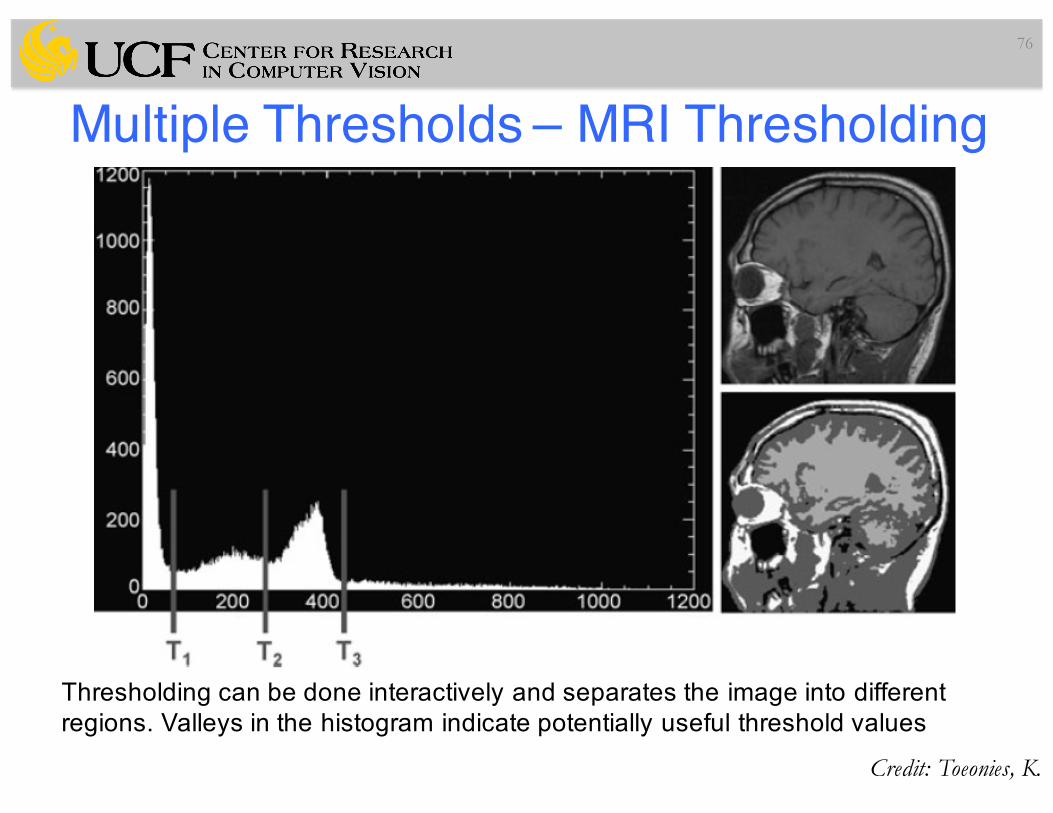
Multiple Thresholds – MRI Thresholding
76
Thresholding can be done interactively and separates the image into different regions. Valleys in the histogram indicate potentially useful threshold values
Credit: Toeonies, K.
Summary of today’s lecture• Introduction into the Medical Image Segmentation• Recognition and Delineation concepts in Segmentation• Simplest Segmentation method: Thresholding
– Otsu– Parametric method for optimal thresholding– PET Image thresholding
• ITM, fixed thresholding, etc.
77
Slide Credits and References• Jayaram K. Udupa, MIPG of University of Pennsylvania, PA.• P. Suetens, Fundamentals of Medical Imaging, Cambridge
Univ. Press.
• Foster, B., et al. CBM, Review paper, 2014.• Kaus, et al. Radiology 2001.• Toeonies, K., Medical Image Analysis.• Farraher, et al., Radiology 2005• Zaidi, H., Quantitative Analysis in Nuclear Medicine Imaging.• Bailey et al. Positron Emission Tomography, Springer.• Dawood, M., et al. Correction Techniques in Emission
Tomography
78