Embed Size (px)
Citation preview

Lecture # 8GIS Data and Input

GIS data
Obtaining data is an important part of any GIS projectYou need to know
What types of data you can use with GISHow to evaluate itWhere to find itAnd how to create it yourself

Data Sources
Two types of data sourcesPrimary data
Data measured directly by surveys, field data collection, remote sensing
Secondary dataData obtained from existing maps, tables or other data sources
Primary data
We cannot usually observe the spatial distribution of a variable throughout the study areaTherefore we need to sample:
Take measurements of a subset of the features in the area that best captures the actual spatial variation

Sampling
The sampling density determines the resolution of the dataSamples taken at 1 km intervals will miss variation smaller than 1 kmStandard approaches to sampling:
RandomSystematicStratified

Random samples
Every location is equally likely to be chosen

Systematic samples
Sample points are spaced at regular intervals

Stratified samples
Requires knowledge about distinct, spatially defined sub-populationsMore sample points are chosen in areas where higher variability is expected

Stratified samples

Secondary data
More and more ready-made digital GIS data sets become availableGovernment agencies: census geographyTopographic surveysPrivate companies

Secondary data
Meta-data: “data about the data”Procedures used to collect or compile the dataData lineageAccuracy and measurement standardsCoding schemes
Required for both spatial and attribute data

Secondary data
Meta-data often absentThis leads to
MisinterpretationMisuseFalse perception of accuracy

Data sources
Framework dataSocioeconomic dataEnvironmental data

Framework data
Reference data to provide context for other dataRoads, rivers, elevation contoursTopographic survey

Topographic Map

Framework data
Digital Chart of the World (DCW)Largest scale consistent digital data set for the whole world (1:1 million)Designed for air navigation -> not necessarily appropriate for other uses

Socioeconomic data
Data about humans, human activities, and the space and/or structures to conduct human activities
Demographic dataMigrationHousingTransportationEconomic activity

305
306304
303
302
154 156
157
160
155
158159
Socioeconomic data
Referenced by
- Administrative units
- Settlements / villages
- Individual houses or facilities

Data input
Data input involves digital encoding of both geographic and attribute data

Data input
For attribute data:SpreadsheetsDatabase management systems
For geographic data:Coordinate entryDigitizingScanning

Data input
Conversion of hardcopy to digital maps is the most time-consuming task in GIS
Up to 80% of project costsEstimated to be a US $10 billion annual marketLabor intensive, tedious and error-proneDatabase development sometimes becomes an end in itself

GIS DATA INPUT SYSTEMTo do transfers of data (entities and attributes) from design to computer.Allows input in either vector or raster form of geographic entities.It is desirable to have a Cartesian grid and a projection system.Capability to link graphic elements and attribute editing

Seven rules of data inputKnow the userKnow the use (the objective or purpose)Avoid "exotic" data sourcesUse the best, most accurate, data necessary for your taskRemember the law of diminishing returns when considering accuracy levelsInput multiple coverages from the same map sheetEach coverage should be as specific as possible

Data Preparation

Input Devices

Coordinate conversion
Latitude is y-coordinate, longitude is x-coordinate Often need to convert from degrees, minutes, seconds (DMS) to degrees decimal (DD)
DD = D + M * (1/60) + S * (1/3600)

Global Positioning Systems
Determine current position based on signals sent by a number of satellitesGPS readings are in digital form -can be read directly into the GIS

Global positioning systemGPS uses satellite signals to obtain exact latitude/longitude coordinate

Handheld GPS are now available for about US $300.

Manual digitizing
Digitizing tables25 x 25cm to 200 x 150cmCost 300$ to 5000$Most common formof coordinate datainput

Digitizing steps
Fix map or aerial photograph on digitizing tableSelect control points (tics): easily identifiable points with known real-world coordinates (e.g., road intersections, graticule intersections, mountain peaks)

Digitizing steps
Trace features to be digitized with pointing device (cursor)Point mode: click at positions where direction changesStream mode: digitizer automatically records position at regular intervals or when cursor moved a fixed distance
Digitizing steps
Point mode: requires judgment by the userStream mode: creates lots of redundant coordinates

y
x
Digitizing table
Grid of wires in the table creates a magnetic field which is detected by thecursorx/y coordinates indigitizing units arefed directly into GISHigh precision in coordinate recording

Digitizing errors
Undershoots
Dangles
Spurious polygons

Digitizing errors
Any digitized map requires considerable post-processingCheck for missing featuresConnect linesRemove spurious polygonsSome of these steps can be automated
Scanning
Scanner output is a raster data setUsually needs to be converted into a vector representation
Manually (on-screen digitizing)Automated (raster-vector conversion) line-tracing - e.g., MapScan
Often requires considerable editing

ScanningAutomated vectorization: operator sets “global parameters” and system converts entire mapInteractive line following: operator points at specific line and system follows and converts the line

Heads-Up Digitizing II:
Raster-scanned image on computer screenOperator follows lines on-screen in vector mode

Scanning
Pre-processing can reduce editing requiredE.g., trace important features manually first (re-drafting)Scan clearer, simpler map

Scanning
Direct use of scanned imagesE.g., scanned air-photosDigital topographic maps in raster format

Digitizing / scanning
Source map is registered in a real world coordinate system with a projection and associated parameters; usually recorded in meters or feetDigitized coordinates are recorded in digitizing units (e.g., cm or inches from the table’s origin)
++
+
++
Settlements
Admin.Units
Reference Grid
Rivers
Longitude
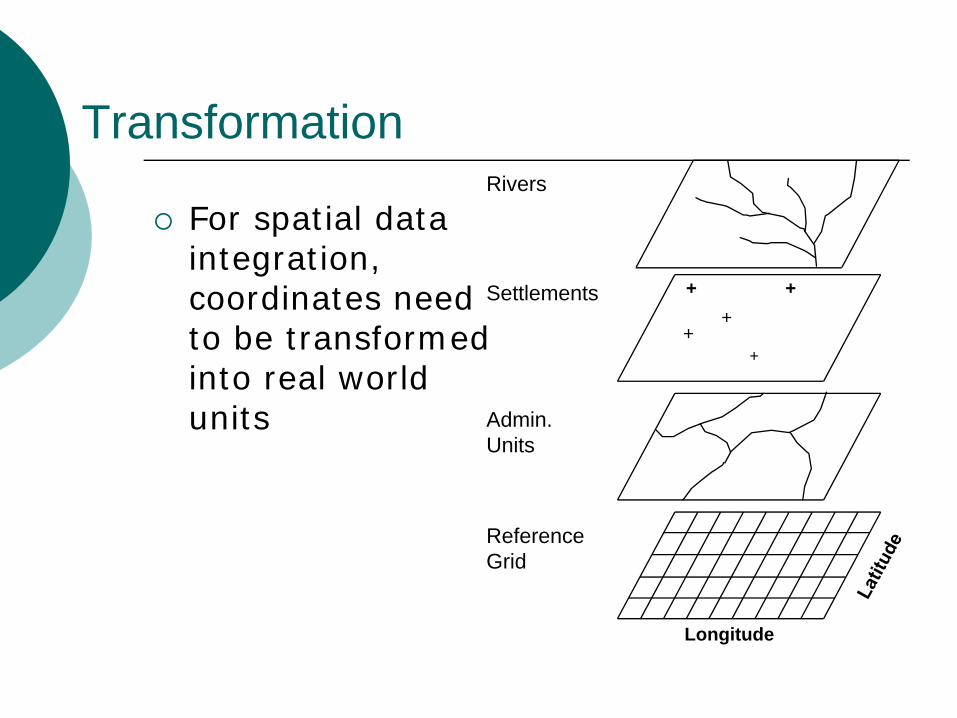
Transformation
For spatial data integration, coordinates need to be transformed into real world units