Embed Size (px)
Citation preview

Systems Medicine Lecture notes Uri Alon (Spring 2020)
Lecture 1 - Epidemiology of COVID-19
Welcome to Systems Medicine! We will explore the amazing world of the human body, how its circuitry works, and how it fails during aging and diseases. We will see how mathematics can help us make sense of the basic principles of human physiology and medicine. Let's start right away with our first feedback loop. We can be in a relaxed state. The relaxed state is good for this course, because it has better listening, learning and memory than a stressed state. In the relaxed state our nervous system and hormones ensure a specific body response. For example, our breathing is deep and slow, with long outbreaths. Now, as human beings, we have the ability to take deep breaths at any moment we choose. Doing this increases the probability of entering the relaxed state. That's why in this course I’ll invite you to take deep sighs of relief once in a while- to improve learning. Of course, you don't have to. But if you do, I promise it will feel good. So, let's all together take a nice deep sigh of relief :) We will have 12 lectures on Tuesdays 14:15-16:00 Israel time (GMT+3) that will be recorded and posted online. Note that Tuesday April 28 is a Memorial Day and we will not have a lecture. We will have exercises every two weeks. I admit that I'm right now very involved in understanding the coronavirus epidemic (COVID19) and so I'll start with that in the first lecture, just to get it out of my system. This will also demonstrate our simple mathematical approach, which we will use in the next lectures too. Starting from lecture 2, the course outline will lead us on a journey across the body, across the lifespan from childhood to old age, and across many types of diseases and their possible remedies. We will end with a grand summary, a periodic table of diseases. Course outline Lecture 1. COVID-19 and epidemics Part 1: Hormone circuits Lectures 2-3: the circuit that controls blood glucose (diabetes) Lectures 4-5: The human stress response (addiction, bipolar disorder) Part 2: Defenses Lecture 6: The origin of autoimmune diseases (type 1- diabetes, thyroiditis) Lecture 7: Inflammation and fibrosis as a bistable system Lecture 8: Cancer and evolutionary trade-offs Part 3: Aging Lecture 9-11: Why and how we age, and the origin of age-related diseases
Figure 1.1

Lecture 12: Periodic table of diseases You, the students, differ from one another in what you studied, and in your level of biology and math. I dont assume any biology and assume basic math skills. For example, for some of you this sentence is easy, for others it is mysterious:
“The viral genome is a 30Kbp single-stranded RNA which is translated to make an RNA-replicase.”
It means something like: the genetic material - or genome- of the virus is a long string of 30,000 letters which encodes a machine that can make new copies of the genome. On the other hand, for some of you the following equation is easy, while others need a refresher:
𝑑𝑥/𝑑𝑡 = 𝛼𝑥 whose solution is 𝑥(𝑡) = 𝑥(0)𝑒𝑥𝑝(𝛼𝑡)
In fact, this is the main equation we will use in this lecture: the rate of change of x(t) is equal to x(t) times a number, 𝛼. If 𝛼is greater than zero, 𝛼>0, we have explosive exponential growth. More x means that x grows faster, which makes even more x, and so on. In contrast, if 𝛼 is negative, we have exponential decline with time. The system thus lives on a knife's edge - changes in 𝛼 can make it either explode or die off. Heterogeneity in a class is usually thought to be an obstacle to teaching. I believe that it can be a resource. We will use your different skills as an asset. How? At certain moments, you will teach each other! Like right now as we go into breakout rooms. Please find out each other's name, what is your bachelor degree, what is your math and biology level, what do you expect from this course. *Pair and share, breakout rooms* More course facts: we have a gifted teaching associate Dr. Avi Mayo. We have been working together for years. Feel free to email him with questions: [email protected]. These lecture notes will be posted on my website, as well as the course videos and exercises. Biology of COVID-19 And now let's start with the biology of coronavirus, and then go to the dynamics of the epidemic and what we can do about it. Right now, it looks like a peak in cases, after a couple of months of exponential rise and a lot of physical distancing and lockdown here in Israel and in many other countries (I’m looking forward to rereading this when the epidemic is just a memory).
Figure 1.2

This coronavirus, called SARS-CoV-2, has spread across the globe. Let's compare it to other epidemics caused by viruses. We will compare how lethal the virus is, namely the fraction of infected people that die. We will also compare how fast it spreads. An important number is called the basic replication number, Ro. It is the number of people infected by an infected individual, assuming that the population is completely susceptible. Imagine the early days of an epidemic, a carrier arrives and infects Ro people on average, each of which infects Ro others and so on. If Ro>1, we have exponential spreading - an epidemic. Let's take a look at famous viruses. Measles spreads fast with Ro~15, but isn't very lethal. Ebola spreads more slowly but is much more lethal. In fact, it is so lethal that people get sick very soon and don't get out of bed to infect others. The seasonal flu spreads slowly with Ro=1.3, and kills ‘only’ 0.1%. Our virus, CoV2, spreads faster than the flu, with Ro=2-3, and is also more deadly, killing about 1%. There seems to be an approximate tradeoff- the more you spread the less deadly. We will discuss such evolutionary trade-offs in depth in one of the lectures in this course. Usually, viruses become less and less lethal as they evolve, until they reach an equilibrium and become endemic- widespread but less lethal (like the common cold). However, such evolution can take years. Viruses like the flu mutate rapidly and thus are different every season (requiring new vaccines). In contrast, Cov2 seems so far to mutate more slowly and I hope it stays that way. The spreading rate Ro can be affected by weather - for example, flu spreads faster in winter-spring, making it seasonal. The basic replication number Ro is the number of people infected by an infectious person, in a world where everyone is susceptible (early phase of the epidemic). Deep sigh of relief.
Basic replication number Ro Figure 1.3 Source: https://www.nytimes.com/interactive/2020/world/asia/china-coronavirus-contain.html

CoV2 coronavirus biology The virus is a replication machine. It uses our cells to make new copies of itself. Cov2 enters host cells - in the airway and lung. It enters a cell in 10 min, hijacks its biosynthesis machinery, and makes about 1000 new copies of itself (virions) in about 10 hours. These new viruses exit the cell and go on to infect new cells. Some of these virions are defective, since virus production is typically error prone. However, many are able to infect new cells. The virus count in the body
therefore rises exponentially. After about three days (the latent period), the virus counts rise so high that a person begins to infect others, because the virus is carried outside in exhaled droplets. When virus counts in the body become high, the immune system reacts, using for example antibodies to inactivate the virus. Other immune cells attempt to kill infected cells before they release the virions. We will discuss the immune system in part 2 of the course in more depth. In COVID19, some think that some of the major symptoms are due to overreaction of the immune system, in addition to the damaged lung cells. Immune reactions cause fluid to fill the lungs, causing acute respiratory distress and death in about 1% of infected people. The antibody response is the way vaccines work: introducing a weak version of the virus to cause an immune response and immune memory- that if the real virus is encountered, antibodies are made rapidly and effectively, blocking the illness.
Figure 1.4 Source: https://www.sinobiological.com/research/virus/coronavirus-replication

Another hope is drugs that stop the virus. To see how they might work, we can look at the mechanism of viral replication. The virus inserts its genome into the cell. Only a single protein is made at first- a replicase that can copy this genome (unlike our DNA genome, this virus has an RNA genome). All other viral proteins, about 20 of them, are produced from the replicated genomes (technically the complementary strand to the original RNA genome). These proteins include the spike protein that forms the “crown” around the virus and allows it to attach to cells, and the N protein that wraps up the viral genome for packaging. The virus takes over a piece of membrane in the cell and uses it to make a sphere that encloses a copy of its genome to make new virions. These are then exported out of the cell (exocytosed). To make a drug, we need a small molecule that gets into the cell and interferes with one of the viral proteins. It is important that this molecule does not interact strongly with any of our normal human proteins. If it did, we might have side-effects. Luckily, the virus makes some proteins that are not found in any of our cells- like the replicase that duplicates the RNA genome. Indeed, the replicase is targeted by drugs developed against Ebola (another RNA-virus) that are now being tested for COVID19. The age distribution of deaths from COVID-19 is not uniform. Older people, and those with chronic illness, are more susceptible than the young. We will discuss why incidence of many diseases rises with age in part 3 of this course. Still, a considerable fraction of deaths is below age 60. Men seem more at risk than women. Interestingly, many other viral epidemics have different age distributions. Seasonal flu is lethal for young children as well as for the old. The 1918 flu pandemic had three groups that were at high risk: the very young, the very old, and those between age 20-40. In the figure below, the death rate per age group for the 1918 flu (full line) is compared to pneumonia (dashed line). The 1918 flu has a W-shape curve, and pneumonia has a more typical U-shaped curve. One hypothesis is that the 1918 flu killed by an immune overreaction (cytokine storm), and that this overreaction was strongest in those with the strongest immune system- the young adults.
Figure 1.5
Figure 1.6 (sources:Figure 1: (a) Schematic diagram showing the W-shaped mortality-age..., https://www.bbc.com/news/health-52197594)

Epidemic curves Many of us have been staring at the curves of new cases rising as a function of the days and weeks since the epidemic started. Understanding such dynamics has a long history. A big step was taken in the early 20th century, based on mathematical models. These models helped to make breakthroughs in control of diseases like malaria. A modern version of the same models was influential in convincing many governments to take strong measures against COVID19. An important simulation study by Imperial college (2020) for example, predicted that if governments take no action, the number of cases would rise exponentially, peak in about three months, and then drop. With a death rate of about 1%, it predicted millions of deaths in the US. Hospitals would be flooded at far above their capacity, causing a serious health crisis. The model also suggested that interventions like closing schools, banning large events, testing, isolation of cases can help. The objective was to flatten the curve: make the peak go below the capacity of hospitals. Indeed strong measures were taken in many countries, with substantial damage to society and the economy. Lockdown causes massive unemployment, which affects physical and mental health. Non-COVID-related health problems are not attended to sufficiently, leading to massive health problems. Today, many governments are in a dilemma - to stop lockdown means easing up on the economy and society… but has the risk of resurgence, with a new wave of infections. This is demonstrated in the simulation showing how lockdown needs to restart with every resurgence. So let’s understand these models, and what they tell us about epidemics. These models can also help us figure out creative ways to address the COVID19 epidemic. I hope they will have you students prepared for the next pandemic. It might be even worse - spreads like measles and kills like Ebola? Kills young as well as old? Let’s be prepared.
Figure 1.7
Figure 1.8
Figure 1.9 Source:https://www.imperial.ac.uk/media/imperial-college/medicine/sph/ide/gida-fellowships/Imperial-College-COVID19-NPI-modelling-16-03-2020.pdf
*Deep sigh of relief. * *Song: we shall overcome* Math models- SIr (Kermac and Mckendric , 1927) This classic model divides the population into three compartments. S(t)=susceptible fraction which means those vulnerable to be infected, I(t)=infected fraction, r(t)=removed fraction (recovered, dead, isolated- no longer can infect others). It is customary to name the ‘removed’ compartment capital “R(t)”, but I’ll use lower case “r(t)” to avoid confusion with the replication number Ro. These S, I and r denote fractions of the total population, each between zero and one. Note that these compartments sum up to one, the total population:
S(t)+I(t)+r(t)=1. The basic process of spread in the SIr model is interactions between susceptible and infected people. The rate of infections is modeled just like molecules colliding in a well-mixed chemical reaction. This is a limitation of compartment models- in reality there is a social network of interactions (social structure), which usually makes the epidemic go slower. But the model is still qualitatively useful. So just like molecules, the probability of interaction is the product of S and I, and thus infection rate is
rate of infection=𝛽𝑆𝐼. This is the rate at which susceptible people become infected. The transmission parameter is 𝛽, whose units are 1/time. Note that if there are no susceptible people, S=0, there are no infections. The same is true if there are no infected people, I=0. As a result, the rate of change of S with time, dS/dt, is just -𝛽𝑆𝐼, with the minus sign signifying reduction:
(1)𝑑𝑆/𝑑𝑡 = −𝛽𝑆𝐼 The production of new infected people is 𝛽𝑆𝐼. Infected people are removed, that is they recover or die, at rate 𝛾𝐼 . The removal parameter 𝛾 has units of 1/time. The typical time that an infected person takes to recover is 1/𝛾. Thus, the rate of change of I(t) is the production minus the removal rates:
(2)𝑑𝐼/𝑑𝑡 = 𝛽𝑆𝐼 − 𝛾𝐼 Finally, the accumulation rate of removed people is just 𝛾𝐼
(3)𝑑𝑟/𝑑𝑡 = 𝛾𝐼 In this model, the basic replication number Ro is the rate of transmission 𝛽 times the typical time a person is infected 1/𝛾, giving:
(4)𝑅8 = 𝛽/𝛾 For CoV2, we can estimate roughly that 1/𝛾~ 7d. This parameter comes from the following observations: the majority of cases recover and stop being infectious within about a week, with the vast majority in less than 2 weeks. The rare severe cases may take a month or more to recover. If Ro=2, we get from Equation 4 a transmission parameter of 𝛽~0.3/day. If we interact with, say, 10 people a day on average, the probability per per day to infect a given person is not
Figure 1.8

that large, 𝛽/10 ≈ 0.03/𝑑𝑎𝑦. That's why household members are not always infected by a sick person. To simplify things, let's use the replication number 𝑅8 = 𝛽/𝛾 to rewrite the main equation 2. We take gamma I out of the parenthesis:
𝑑𝐼/𝑑𝑡 = 𝛽𝑆𝐼 − 𝛾𝐼 = 𝐼(𝛽𝑆 − 𝛾) = 𝛾𝐼(𝛽𝑆/𝛾 − 1) And finally:
𝑑𝐼/𝑑𝑡 = 𝛾(𝑅8𝑆 − 1)𝐼 Let's begin our analysis with the early days of the epidemic. In the beginning, almost everyone is susceptible (true today April 20 in most countries). Thus S~1. We then can write, to an excellent approximation, S=1 and have
𝑑𝐼/𝑑𝑡 = 𝛾(𝑅8 − 1)𝐼 This equation has the familiar form of our exponential growth equation: rate of change of I(t) is I(t) times a number, 𝛾(𝑅8 − 1). Solution: an exponential growth of infectious people in the early days of an epidemic,
𝐼(𝑡) = 𝐼(0)𝑒𝑥𝑝(𝛼𝑡)𝑤𝑖𝑡ℎ𝛼 = 𝛾(𝑅8 − 1) If cases triple every week, we have 𝛼~1/7d, which means Ro~2. We see that we have an epidemic - defined by a growing number of cases with time - when replication number exceeds one, Ro>1 We have an exponential decline of cases if Ro<1. SO, TO CONTROL THE EPIDEMIC, WE JUST NEED Ro<1! Not to push replication all the way down to zero, but just to nudge it below one. This is a hopeful message that has helped to control many epidemics in the past.
*Deep sigh of relief. * We can discuss how some of the epidemiological measures against COVID work. We want to push down Ro, and thus to reduce transmission 𝛽 or increase removal 𝛾. Reducing transmission is aided by hygiene like hand washing. Similarly, physical distancing to 2m and masks reduce transmission. Measures such as lockdown and quarantine prevent meeting many people, pushing 𝛽down. We can also think of how to raise the removal parameter 𝛾 in order to reduce Ro, since Ro=𝛽/𝛾. For example, by rapid testing and isolation of infected people and their contacts, we can quicken the time that an infected person is ‘removed’- namely isolated. If we include such isolated people in the removed compartment, reasoning they can’t infect others, isolation raises 𝛾. This strategy works well in South Korea for example, especially when the number of cases is low. Similarly, once we have good treatments that reduce infectiousness we can raise 𝛾.
Figure 1.9

Pair and Share! What happens after exponential growth - how does the epidemic go away? If we don't manage to get Ro<1, the epidemic will reach herd immunity - so many people will be infected, and recover, that the rate of new infections will slow down. There just won't be enough susceptible people around for rapid transmission. Here is a typical simulation, showing how I(t) rises exponentially, causing a drop in susceptible fraction S. This makes I(t) reach a peak and then drop. Throughout the process, the removed fraction r(t) keeps accumulating. Let’s understand this mathematically. The equation is
𝑑𝐼/𝑑𝑡 = 𝛾(𝑅8𝑆 − 1)𝐼 So, the peak of infectious people, I(t) occurs at a time when dI/dt=0. After all, that is how we find the maximum of a function, its derivative is zero. This means that Ro S-1=0, which means the peak occurs when S(t)=1/Ro. That is, for Ro=2 , when 50% have already been infected. This is a very large number of people, and given the fatality rate of the disease, explains why herd immunity was not an option for many governments. Let's talk now about the end of the natural course of the epidemic: Does every susceptible person become infected at the end? Some lucky people will have genetics that make them not-susceptible to the disease in the first place. But let's leave these out of the discussion. Among those susceptible, what happens at the end? I originally guessed that the intuitive answer is yes… everyone will be infected. But here the math teaches us differently, and represents what happens in real epidemics. To see this, we will derive an equation for the number of susceptible people left at time equal infinity, 𝑆@ To do so, divide Eq. 1 by Eq. 3. As a result, and this is a bit tricky to understand at first, we have an equation for S as a function of r, written S(r), instead of as a function of time S(t):
𝑑𝑆/𝑑𝑟 = −𝑅8𝑆 Thus, the solution is an exponential of r:
(4)𝑆(𝑟) = 𝑒ABCD At the end of the infection, no one is infectious anymore, I=0, thus everyone is either removed or susceptible: 𝑟@ = 1 − 𝑆@ Plugining this into Eq 4, we find
𝑆@ = 𝑒ABC(EAFG) For Ro=2, we have, 𝑆@~20%. Not every susceptible person gets infected.
Figure 1.10 Source:https://www.researchgate.net/figure/SIR-model-Schematic-representation-differential-equations-and-plot-for-the-basic-SIR_fig2_47676805
Figure 1.11
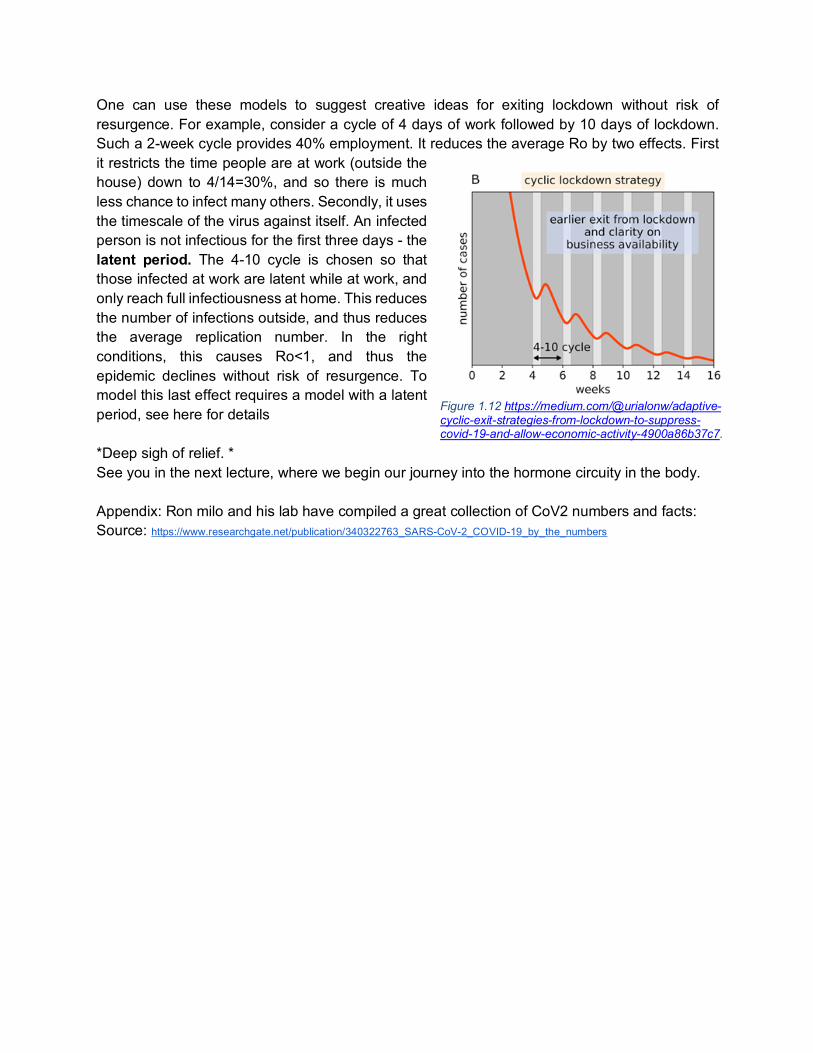
One can use these models to suggest creative ideas for exiting lockdown without risk of resurgence. For example, consider a cycle of 4 days of work followed by 10 days of lockdown. Such a 2-week cycle provides 40% employment. It reduces the average Ro by two effects. First it restricts the time people are at work (outside the house) down to 4/14=30%, and so there is much less chance to infect many others. Secondly, it uses the timescale of the virus against itself. An infected person is not infectious for the first three days - the latent period. The 4-10 cycle is chosen so that those infected at work are latent while at work, and only reach full infectiousness at home. This reduces the number of infections outside, and thus reduces the average replication number. In the right conditions, this causes Ro<1, and thus the epidemic declines without risk of resurgence. To model this last effect requires a model with a latent period, see here for details *Deep sigh of relief. * See you in the next lecture, where we begin our journey into the hormone circuity in the body. Appendix: Ron milo and his lab have compiled a great collection of CoV2 numbers and facts: Source: https://www.researchgate.net/publication/340322763_SARS-CoV-2_COVID-19_by_the_numbers
Figure 1.12 https://medium.com/@urialonw/adaptive-cyclic-exit-strategies-from-lockdown-to-suppress-covid-19-and-allow-economic-activity-4900a86b37c7.

Exercises (with student feedback)
Systems Medicine Uri Alon (Spring 2020)
Exercise 1
1) In the SIr model, show using equations (1)-(3) that S(t)+I(t)+r(t)=1 at all times. Hint: use the initial conditions in which this sum equals one at time t=0.
2) Choose a non-corona virus whose name starts with the first letter of your last name (if there is none, the first letter of your given name). Read about its mechanism of entry into the cell and replication inside the cell, and summarize in 100 words. A list of Human viruses and associated pathologies can be found here: https://viralzone.expasy.org/678, Further data can be also found here https://talk.ictvonline.org/.
3) Simulation: a. Plot the infection curve as a function of time for I(0)=0.01, S(0)=0.99, and Ro=2.
Assume β=0.3 /day, and 𝞬=1/7day. b. What is the value of I(t) at its maximum? c. Plot also S(t) and r(t). Check whether the maximum infection is reached at the
point mentioned in the lecture, and whether the susceptible fraction at long times matches the lecture prediction.
d. Assuming a death rate of 1%, and a population of 1 million, approximately how many fatalities are expected at the end of the epidemic based on this simulation? Hint: r(t) is defined as the fraction recovered or dead. At long times when the epidemic is over, everyone that has been infected has either recovered or died from the disease.
e. Plot the infection curve for a small value of Ro (choose a value of β that makes Ro slightly larger than 1) and a large value of Ro. What do you observe about the curves? (100 words).
f. Plot the infection curve as in a., but now Ro drops to Ro=0.9 at t=5 days due to a lockdown. What do you observe (50 words)?
Resources: Tutorials and sample computer code provided in Mathematica, Python, Matlab and R in the AlonLab website https://www.weizmann.ac.il/mcb/UriAlon/systems-medicine-course-2020


![[Uri Alon] an Introduction to Systems Biology Des(BookFi.org)](https://img.pdfslide.net/doc/110x75/5452e96bb1af9f7c318b5453/uri-alon-an-introduction-to-systems-biology-desbookfiorg.jpg)