Embed Size (px)
Citation preview
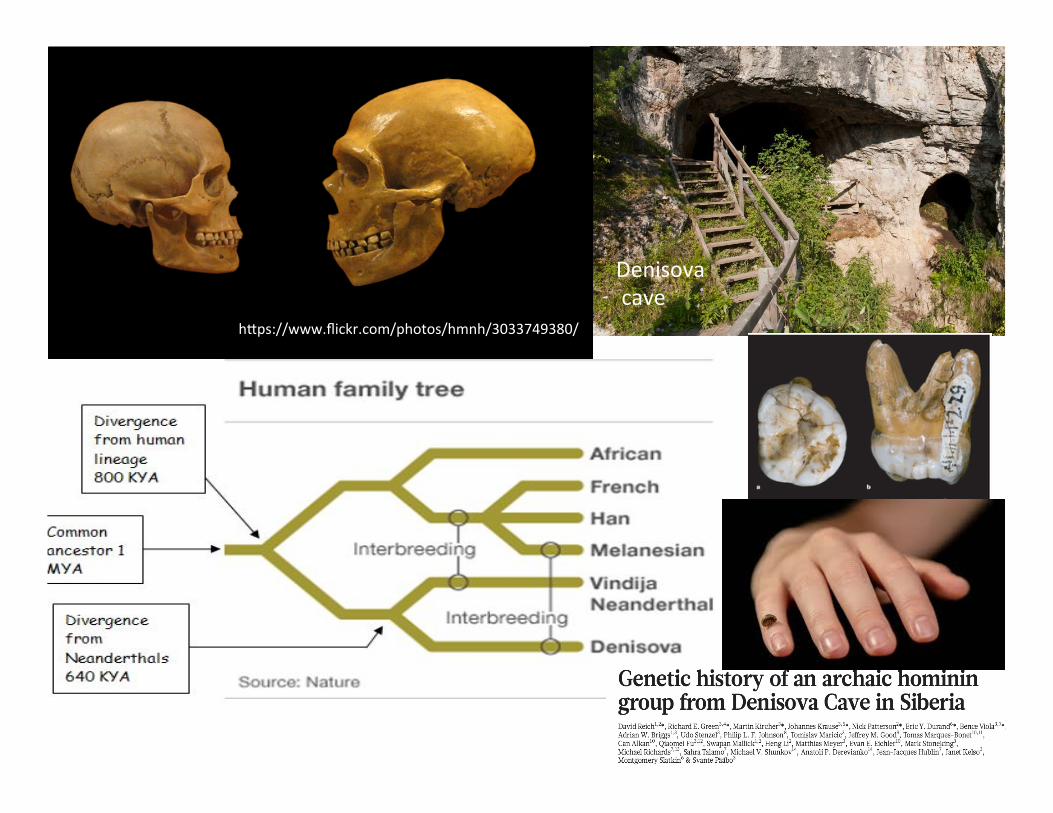
Denisova cave
h,ps://www.flickr.com/photos/hmnh/3033749380/
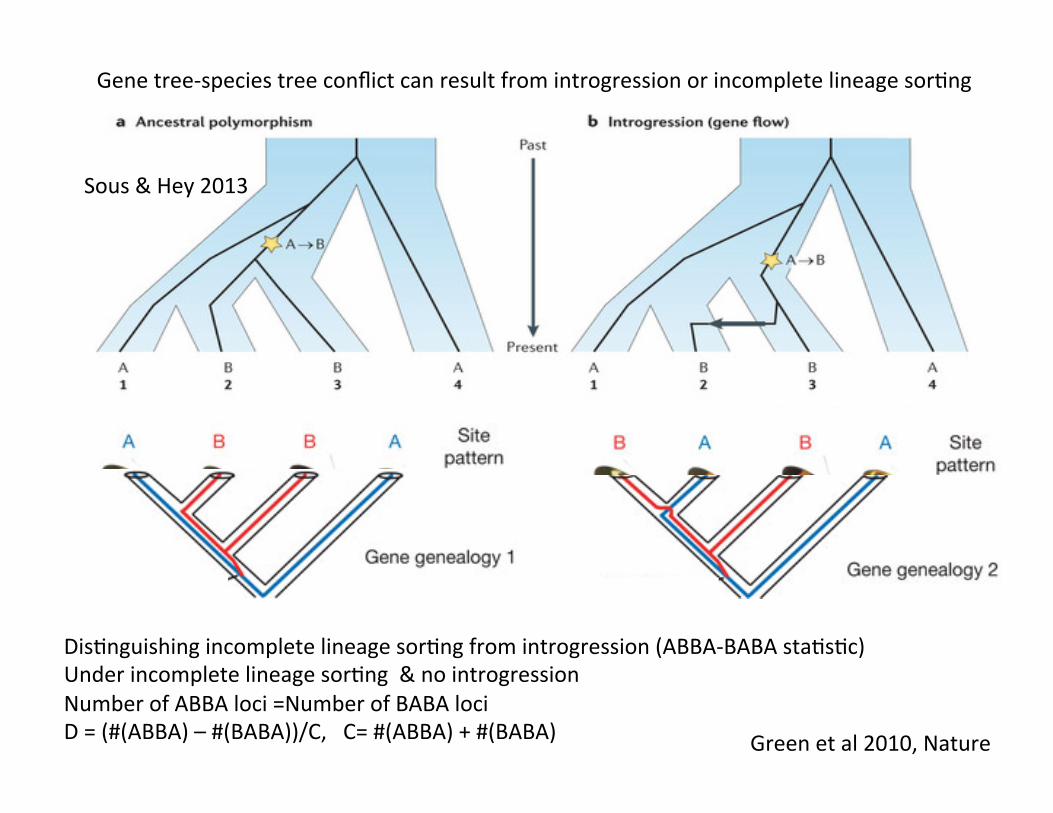
Gene tree-‐species tree conflict can result from introgression or incomplete lineage sorCng
DisCnguishing incomplete lineage sorCng from introgression (ABBA-‐BABA staCsCc) Under incomplete lineage sorCng & no introgression Number of ABBA loci =Number of BABA loci D = (#(ABBA) – #(BABA))/C, C= #(ABBA) + #(BABA)
Sous & Hey 2013
Green et al 2010, Nature
the group to which this individual belonged Denisovans in analogy toNeanderthals, as Denisovans are described for the first time based onmolecular data from Denisova Cave just as Neanderthals were firstdescribed based on skeletal remains retrieved in the Neander Valleyin Germany.
No Denisovan gene flow into all EurasiansWe have previously shown that Vindija Neanderthals share morederived alleles with non-Africans than with Africans, consistent withNeanderthals contributing 1–4% of the genomes of present-dayhumans across Eurasia8. To investigate the extent to which theDenisova individual shares this pattern, we examined alignments ofsets of four genomes, each consisting of an African (Yoruba or San),a Eurasian (French or Han), an archaic hominin (Neanderthal orDenisovan) and the chimpanzee. We randomly sampled one allele fromeach of the three hominins, and counted all transversion differencesbetween the African and the Eurasian where the archaic individualcarries the derived allele (the ‘D statistics’ of ref. 8). Neanderthals matchthe French genome on average 4.6 6 0.7% more often than they matchthe Yoruba genome (Table 1). Although the Denisova individual alsomatches the French more than the Yoruba genome, this skew is signifi-cantly less strong at 1.8 6 0.5%. The estimates of D statistics werequantitatively consistent (within two standard deviations) for all otherchoices of Eurasian and African populations (Table 1). These findingsindicate that the archaic component of the Eurasian gene pool is lessclosely related to the Denisova individual than to Neanderthals.
We also examined 13 genomic regions that we previously identifiedas candidates for a contribution of archaic genetic material into non-Africans, based on their deeper genetic divergences in non-Africansthan in Africans8. Using ‘tag SNPs’ that are informative about whethera haplotype is from the lineage unique to non-Africans, we find thatthe Denisova individual matches the deeply diverged non-Africanhaplotype in 6 cases, whereas Neanderthals do so in 11 cases (Su-pplementary Information section 7). Thus, both Neanderthals andDenisovans are more related than would be expected by chance tothese genomic segments, but the signal in Denisovans is weaker.
These analyses indicate that Neanderthals are more closely relatedthan Denisovans to the population that contributed to the gene poolof the ancestors of present-day Eurasians. The fact that Eurasiansshare some additional affinity with the Denisova individual relativeto Africans is compatible with a scenario in which Denisovans sharedsome of their history with Neanderthals before the gene flow fromNeanderthals into modern humans occurred.
Denisovan gene flow into the ancestors of MelanesiansAlthough the Denisova individual derives from a population that wasnot directly involved in the gene flow from Neanderthals to Eurasians,it is possible that Denisovans admixed with the ancestors of present-day people in some parts of the Old World. To investigate this, weanalysed the relationship of the Denisova genome to the genomes of938 present-day humans from 53 populations that have been geno-typed at 642,690 single nucleotide polymorphisms (SNPs)35. We
Table 1 | Sharing of derived alleles between present-day and archaic homininsSample H1 Sample H2 Source of data
for H1 and H2
D(H1, H2, Neanderthal, chimpanzee) D(H1, H2, Denisova, chimpanzee)
nBABA nABBA D (%) s.e. (%) Z-score nBABA nABBA D (%) s.e. (%) Z-score
Eurasian/Eurasian*French Han Ref. 8 17,214 17,602 21.1 0.8 21.4 27,250 27,265 0.0 0.6 0.0Karitiana Sardinian This study 1,116 1,085 1.4 2.1 0.7 1,559 1,627 22.1 1.8 21.2Karitiana Cambodian This study 1,683 1,707 20.7 1.8 20.4 2,371 2,460 21.8 1.5 21.2Karitiana Mongolian This study 1,128 1,195 22.9 2.2 21.3 1,765 1,742 0.7 1.8 0.4Sardinian Cambodian This study 2,592 2,670 21.5 1.5 21.0 3,935 3,925 0.1 1.2 0.1Sardinian Mongolian This study 1,966 2,027 21.5 1.6 20.9 3,036 3,057 20.3 1.3 20.3Cambodian Mongolian This study 2,811 2,804 0.1 1.4 0.1 4,442 4,342 1.1 1.2 1.0
African/African*San Yoruba Ref. 8 23,690 23,855 20.3 0.6 20.6 39,042 39,019 0.0 0.5 0.1
Melanesian/Melanesian*Papuan2 Bougainville This study 3,351 3,284 1.0 1.3 0.8 5,319 5,140 1.7 1.1 1.5
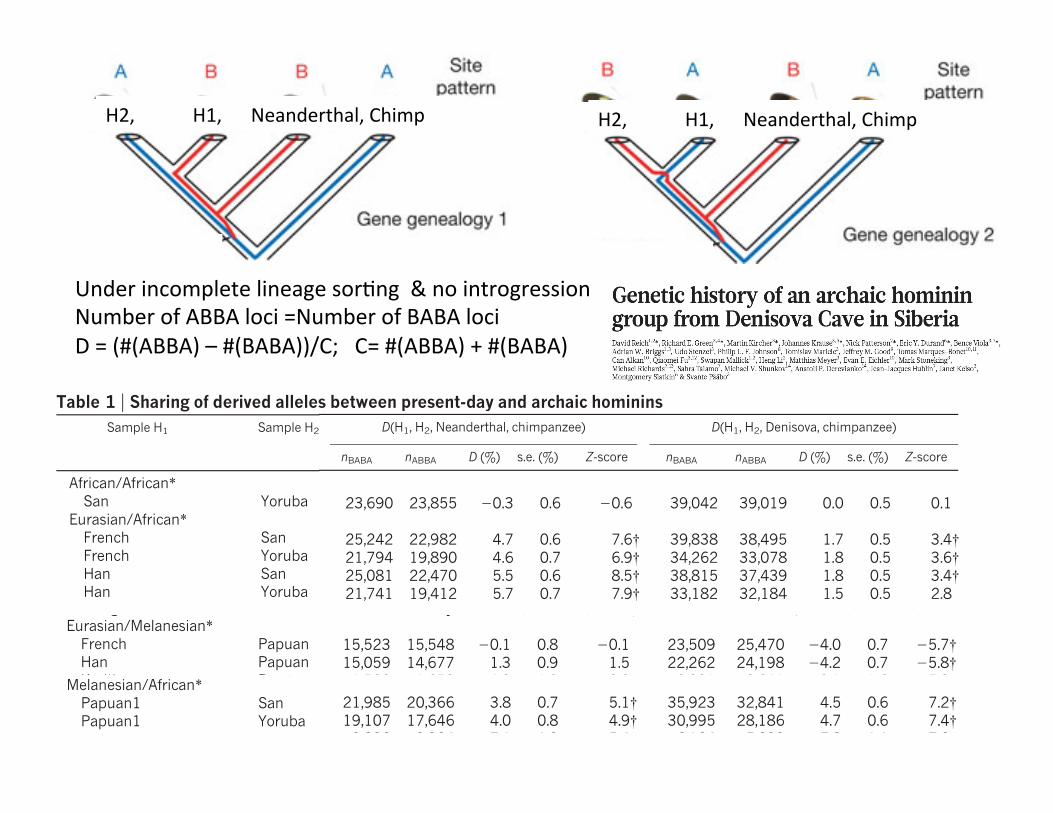
Eurasian/African*French San Ref. 8 25,242 22,982 4.7 0.6 7.6{ 39,838 38,495 1.7 0.5 3.4{French Yoruba Ref. 8 21,794 19,890 4.6 0.7 6.9{ 34,262 33,078 1.8 0.5 3.6{Han San Ref. 8 25,081 22,470 5.5 0.6 8.5{ 38,815 37,439 1.8 0.5 3.4{Han Yoruba Ref. 8 21,741 19,412 5.7 0.7 7.9{ 33,182 32,184 1.5 0.5 2.8Karitiana Mbuti This study 1,577 1,473 3.4 1.9 1.8 2,368 2,360 0.2 1.5 0.1Sardinian Mbuti This study 2,562 2,400 3.3 1.5 2.2 4,028 3,784 3.1 1.2 2.6Cambodian Mbuti This study 4,235 3,641 7.5 1.2 6.5{ 6,329 5,850 3.9 1.0 4.0{Mongolian Mbuti This study 3,077 2,765 5.3 1.4 3.9{ 4,514 4,505 0.1 1.1 0.1
Eurasian/Melanesian*French Papuan1 Ref. 8 15,523 15,548 20.1 0.8 20.1 23,509 25,470 24.0 0.7 25.7{Han Papuan1 Ref. 8 15,059 14,677 1.3 0.9 1.5 22,262 24,198 24.2 0.7 25.8{Karitiana Papuan2 This study 1,522 1,658 24.3 1.9 22.2 2,201 2,641 29.1 1.6 25.8{Karitiana Bougainville This study 1,577 1,717 24.3 1.8 22.4 2,229 2,671 29.0 1.5 25.9{Sardinian Papuan2 This study 2,447 2,647 23.9 1.5 22.6 3,714 4,150 25.5 1.2 24.5{Sardinian Bougainville This study 2,531 2,762 24.4 1.5 23.0 3,877 4,336 25.6 1.1 24.9{Cambodian Papuan2 This study 3,713 3,891 22.3 1.3 21.8 5,457 6,272 26.9 1.1 26.5{Cambodian Bougainville This study 3,847 3,994 21.9 1.2 21.6 5,751 6,333 24.8 1.0 24.7{Mongolian Papuan2 This study 2,783 2,852 21.2 1.5 20.8 4,192 4,758 26.3 1.2 25.3{Mongolian Bougainville This study 2,813 3,066 24.3 1.5 22.9 4,234 4,847 26.8 1.1 26.0{
Melanesian/African*Papuan1 San Ref. 8 21,985 20,366 3.8 0.7 5.1{ 35,923 32,841 4.5 0.6 7.2{Papuan1 Yoruba Ref. 8 19,107 17,646 4.0 0.8 4.9{ 30,995 28,186 4.7 0.6 7.4{Papuan2 Mbuti This study 3,832 3,324 7.1 1.3 5.4{ 6,124 5,233 7.8 1.1 7.2{Bougainville Mbuti This study 4,216 3,596 7.9 1.2 6.8{ 6,498 5,633 7.1 1.1 6.7{
We present the D statistic D(H1, H2, X, chimpanzee), the normalized difference between the number of sites at which the derived allele in an archaic read from X matches human sample H1 (nBABA) and humansample H2 (nBABA); thus, its value is D 5 (nBABA 2 nABBA)/(nBABA 1 nABBA). We restrict to autosomal transversion substitutions, compute standard errors (s.e.) from a block jackknife, and highlight (dagger symbol)the D statistics that are more than Z . 3 s.d. from zero. Both Neanderthals and Denisovans match Eurasians more than the Africans, but the signals are consistently and significantly stronger when X 5 Neanderthalthan when X 5 Denisova. The slight numerical differences with Table 4 of ref. 8 are due to differences in the data filtering. Here we restrict to comparisons of present-day human samples that were sequenced by thesame protocol (the five individuals sequenced in ref. 8, or the seven in this study); Supplementary Table 8.2 presents the complete set of pairwise comparisons.*Comparison.{D statistics that are more than Z . 3 s.d. from zero.
RESEARCH ARTICLE
1 0 5 6 | N A T U R E | V O L 4 6 8 | 2 3 / 3 0 D E C E M B E R 2 0 1 0
Macmillan Publishers Limited. All rights reserved©2010
the group to which this individual belonged Denisovans in analogy toNeanderthals, as Denisovans are described for the first time based onmolecular data from Denisova Cave just as Neanderthals were firstdescribed based on skeletal remains retrieved in the Neander Valleyin Germany.
No Denisovan gene flow into all EurasiansWe have previously shown that Vindija Neanderthals share morederived alleles with non-Africans than with Africans, consistent withNeanderthals contributing 1–4% of the genomes of present-dayhumans across Eurasia8. To investigate the extent to which theDenisova individual shares this pattern, we examined alignments ofsets of four genomes, each consisting of an African (Yoruba or San),a Eurasian (French or Han), an archaic hominin (Neanderthal orDenisovan) and the chimpanzee. We randomly sampled one allele fromeach of the three hominins, and counted all transversion differencesbetween the African and the Eurasian where the archaic individualcarries the derived allele (the ‘D statistics’ of ref. 8). Neanderthals matchthe French genome on average 4.6 6 0.7% more often than they matchthe Yoruba genome (Table 1). Although the Denisova individual alsomatches the French more than the Yoruba genome, this skew is signifi-cantly less strong at 1.8 6 0.5%. The estimates of D statistics werequantitatively consistent (within two standard deviations) for all otherchoices of Eurasian and African populations (Table 1). These findingsindicate that the archaic component of the Eurasian gene pool is lessclosely related to the Denisova individual than to Neanderthals.
We also examined 13 genomic regions that we previously identifiedas candidates for a contribution of archaic genetic material into non-Africans, based on their deeper genetic divergences in non-Africansthan in Africans8. Using ‘tag SNPs’ that are informative about whethera haplotype is from the lineage unique to non-Africans, we find thatthe Denisova individual matches the deeply diverged non-Africanhaplotype in 6 cases, whereas Neanderthals do so in 11 cases (Su-pplementary Information section 7). Thus, both Neanderthals andDenisovans are more related than would be expected by chance tothese genomic segments, but the signal in Denisovans is weaker.
These analyses indicate that Neanderthals are more closely relatedthan Denisovans to the population that contributed to the gene poolof the ancestors of present-day Eurasians. The fact that Eurasiansshare some additional affinity with the Denisova individual relativeto Africans is compatible with a scenario in which Denisovans sharedsome of their history with Neanderthals before the gene flow fromNeanderthals into modern humans occurred.
Denisovan gene flow into the ancestors of MelanesiansAlthough the Denisova individual derives from a population that wasnot directly involved in the gene flow from Neanderthals to Eurasians,it is possible that Denisovans admixed with the ancestors of present-day people in some parts of the Old World. To investigate this, weanalysed the relationship of the Denisova genome to the genomes of938 present-day humans from 53 populations that have been geno-typed at 642,690 single nucleotide polymorphisms (SNPs)35. We
Table 1 | Sharing of derived alleles between present-day and archaic homininsSample H1 Sample H2 Source of data
for H1 and H2
D(H1, H2, Neanderthal, chimpanzee) D(H1, H2, Denisova, chimpanzee)
nBABA nABBA D (%) s.e. (%) Z-score nBABA nABBA D (%) s.e. (%) Z-score
Eurasian/Eurasian*French Han Ref. 8 17,214 17,602 21.1 0.8 21.4 27,250 27,265 0.0 0.6 0.0Karitiana Sardinian This study 1,116 1,085 1.4 2.1 0.7 1,559 1,627 22.1 1.8 21.2Karitiana Cambodian This study 1,683 1,707 20.7 1.8 20.4 2,371 2,460 21.8 1.5 21.2Karitiana Mongolian This study 1,128 1,195 22.9 2.2 21.3 1,765 1,742 0.7 1.8 0.4Sardinian Cambodian This study 2,592 2,670 21.5 1.5 21.0 3,935 3,925 0.1 1.2 0.1Sardinian Mongolian This study 1,966 2,027 21.5 1.6 20.9 3,036 3,057 20.3 1.3 20.3Cambodian Mongolian This study 2,811 2,804 0.1 1.4 0.1 4,442 4,342 1.1 1.2 1.0
African/African*San Yoruba Ref. 8 23,690 23,855 20.3 0.6 20.6 39,042 39,019 0.0 0.5 0.1
Melanesian/Melanesian*Papuan2 Bougainville This study 3,351 3,284 1.0 1.3 0.8 5,319 5,140 1.7 1.1 1.5
Eurasian/African*French San Ref. 8 25,242 22,982 4.7 0.6 7.6{ 39,838 38,495 1.7 0.5 3.4{French Yoruba Ref. 8 21,794 19,890 4.6 0.7 6.9{ 34,262 33,078 1.8 0.5 3.6{Han San Ref. 8 25,081 22,470 5.5 0.6 8.5{ 38,815 37,439 1.8 0.5 3.4{Han Yoruba Ref. 8 21,741 19,412 5.7 0.7 7.9{ 33,182 32,184 1.5 0.5 2.8Karitiana Mbuti This study 1,577 1,473 3.4 1.9 1.8 2,368 2,360 0.2 1.5 0.1Sardinian Mbuti This study 2,562 2,400 3.3 1.5 2.2 4,028 3,784 3.1 1.2 2.6Cambodian Mbuti This study 4,235 3,641 7.5 1.2 6.5{ 6,329 5,850 3.9 1.0 4.0{Mongolian Mbuti This study 3,077 2,765 5.3 1.4 3.9{ 4,514 4,505 0.1 1.1 0.1
Eurasian/Melanesian*French Papuan1 Ref. 8 15,523 15,548 20.1 0.8 20.1 23,509 25,470 24.0 0.7 25.7{Han Papuan1 Ref. 8 15,059 14,677 1.3 0.9 1.5 22,262 24,198 24.2 0.7 25.8{Karitiana Papuan2 This study 1,522 1,658 24.3 1.9 22.2 2,201 2,641 29.1 1.6 25.8{Karitiana Bougainville This study 1,577 1,717 24.3 1.8 22.4 2,229 2,671 29.0 1.5 25.9{Sardinian Papuan2 This study 2,447 2,647 23.9 1.5 22.6 3,714 4,150 25.5 1.2 24.5{Sardinian Bougainville This study 2,531 2,762 24.4 1.5 23.0 3,877 4,336 25.6 1.1 24.9{Cambodian Papuan2 This study 3,713 3,891 22.3 1.3 21.8 5,457 6,272 26.9 1.1 26.5{Cambodian Bougainville This study 3,847 3,994 21.9 1.2 21.6 5,751 6,333 24.8 1.0 24.7{Mongolian Papuan2 This study 2,783 2,852 21.2 1.5 20.8 4,192 4,758 26.3 1.2 25.3{Mongolian Bougainville This study 2,813 3,066 24.3 1.5 22.9 4,234 4,847 26.8 1.1 26.0{
Melanesian/African*Papuan1 San Ref. 8 21,985 20,366 3.8 0.7 5.1{ 35,923 32,841 4.5 0.6 7.2{Papuan1 Yoruba Ref. 8 19,107 17,646 4.0 0.8 4.9{ 30,995 28,186 4.7 0.6 7.4{Papuan2 Mbuti This study 3,832 3,324 7.1 1.3 5.4{ 6,124 5,233 7.8 1.1 7.2{Bougainville Mbuti This study 4,216 3,596 7.9 1.2 6.8{ 6,498 5,633 7.1 1.1 6.7{
We present the D statistic D(H1, H2, X, chimpanzee), the normalized difference between the number of sites at which the derived allele in an archaic read from X matches human sample H1 (nBABA) and humansample H2 (nBABA); thus, its value is D 5 (nBABA 2 nABBA)/(nBABA 1 nABBA). We restrict to autosomal transversion substitutions, compute standard errors (s.e.) from a block jackknife, and highlight (dagger symbol)the D statistics that are more than Z . 3 s.d. from zero. Both Neanderthals and Denisovans match Eurasians more than the Africans, but the signals are consistently and significantly stronger when X 5 Neanderthalthan when X 5 Denisova. The slight numerical differences with Table 4 of ref. 8 are due to differences in the data filtering. Here we restrict to comparisons of present-day human samples that were sequenced by thesame protocol (the five individuals sequenced in ref. 8, or the seven in this study); Supplementary Table 8.2 presents the complete set of pairwise comparisons.*Comparison.{D statistics that are more than Z . 3 s.d. from zero.
RESEARCH ARTICLE
1 0 5 6 | N A T U R E | V O L 4 6 8 | 2 3 / 3 0 D E C E M B E R 2 0 1 0
Macmillan Publishers Limited. All rights reserved©2010
H2, H1, Neanderthal, Chimp H2, H1, Neanderthal, Chimp
Under incomplete lineage sorCng & no introgression Number of ABBA loci =Number of BABA loci D = (#(ABBA) – #(BABA))/C; C= #(ABBA) + #(BABA)
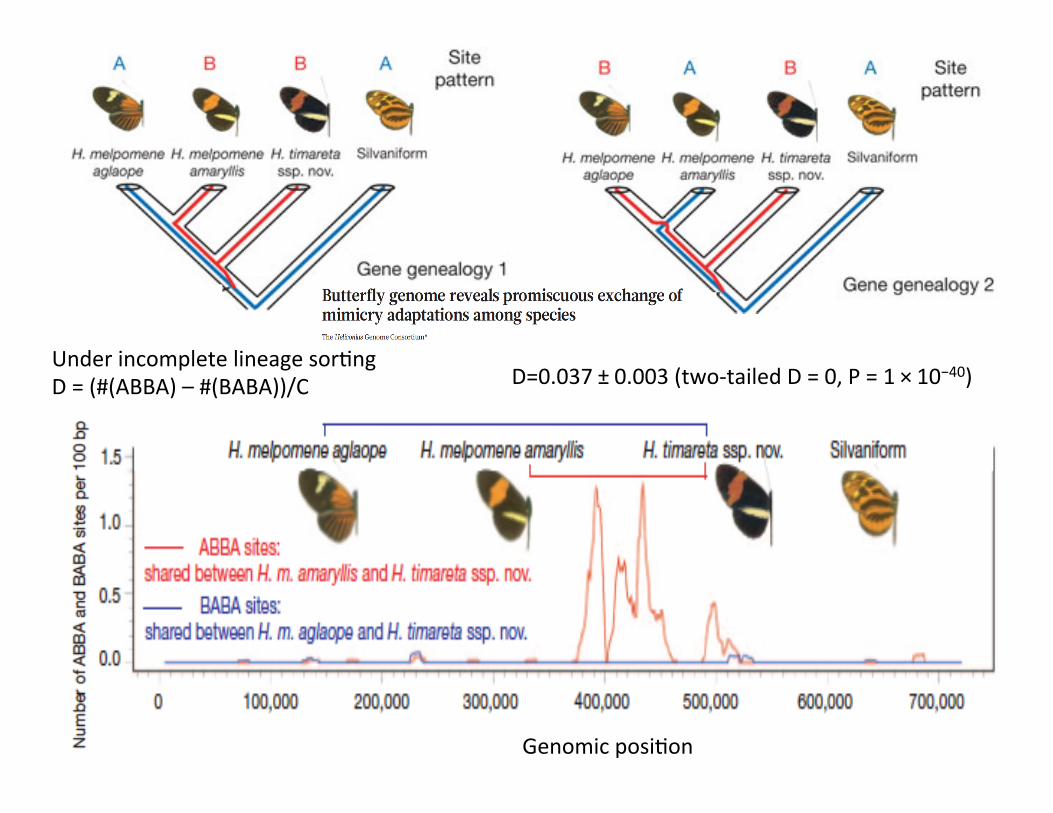
Under incomplete lineage sorCng D = (#(ABBA) – #(BABA))/C
D=0.037 ± 0.003 (two-‐tailed D = 0, P = 1 × 10−40)
Genomic posiCon

Phenotypic Resemblance between relaCves
• Covariance
• CorrelaCon
• Slope of linear regression
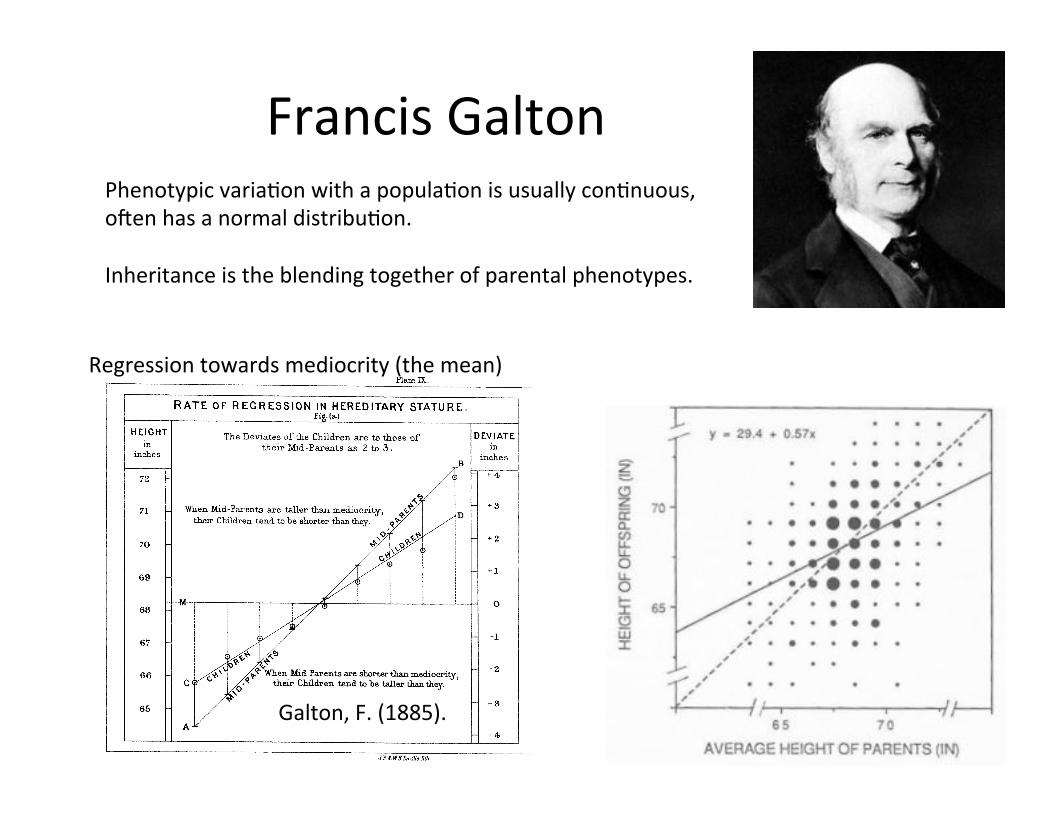
Francis Galton Phenotypic variaCon with a populaCon is usually conCnuous, o`en has a normal distribuCon. Inheritance is the blending together of parental phenotypes.
Galton, F. (1885).
Regression towards mediocrity (the mean)
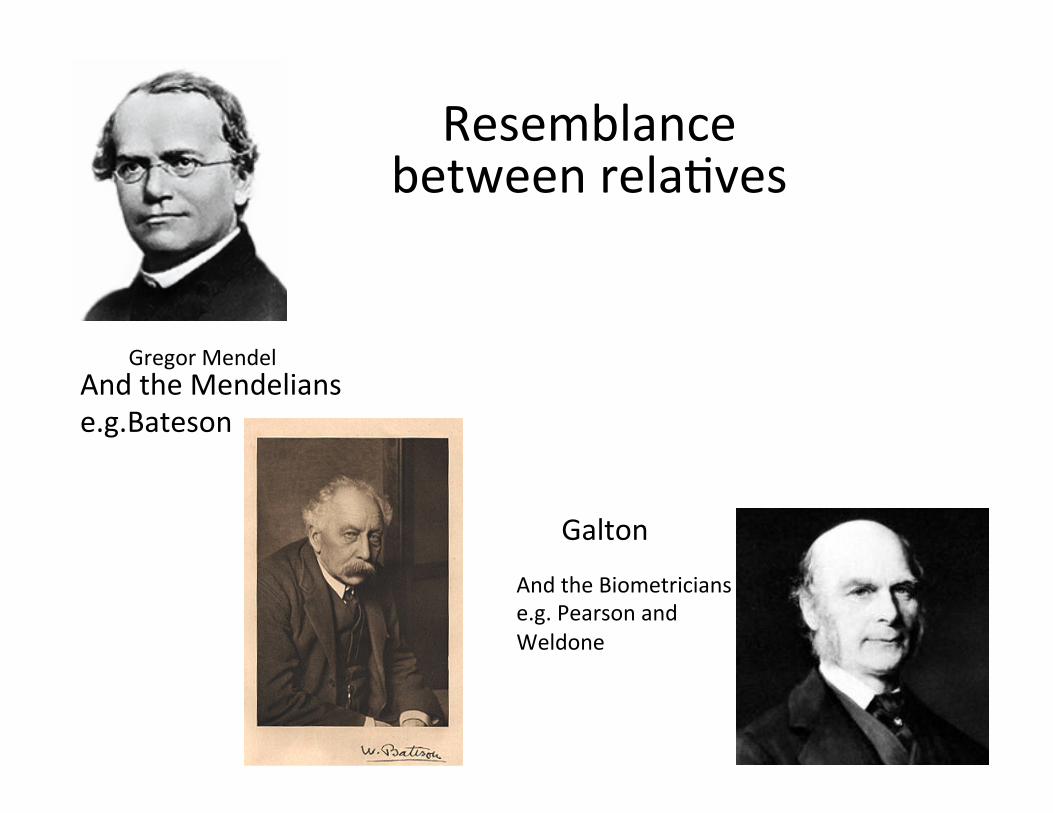
Resemblance between relaCves
And the Biometricians e.g. Pearson and Weldone
Galton
Gregor Mendel
And the Mendelians e.g.Bateson
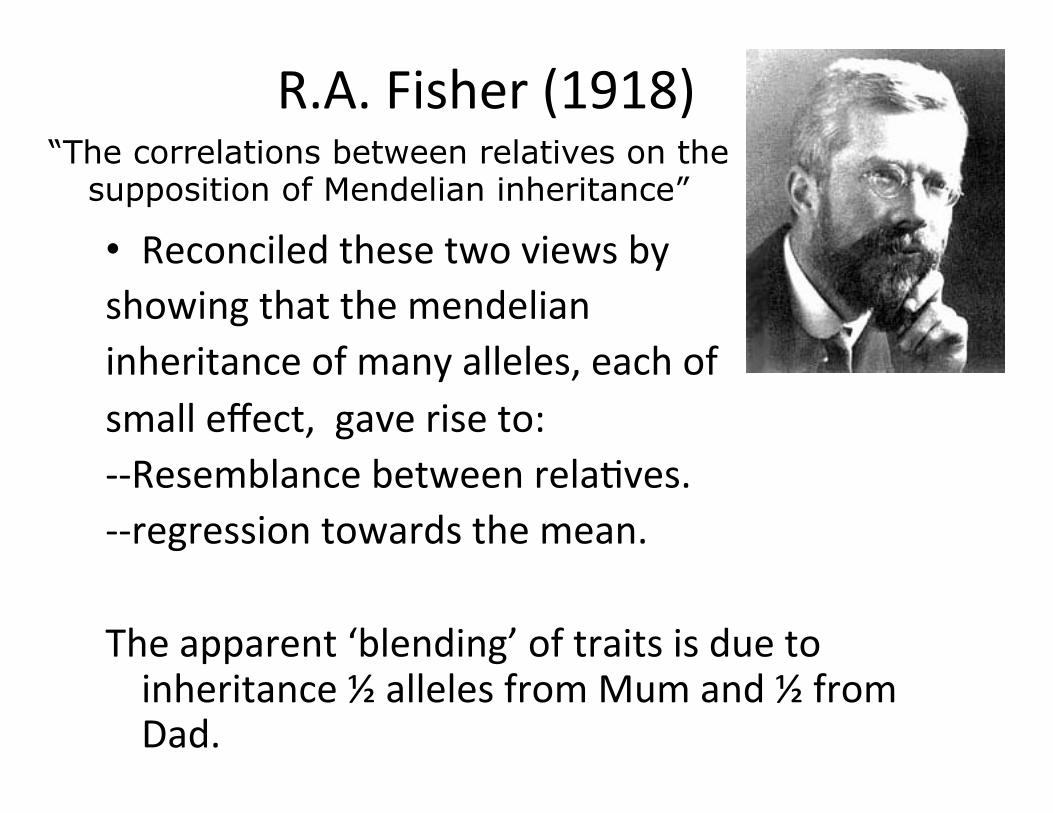
R.A. Fisher (1918)
• Reconciled these two views by showing that the mendelian inheritance of many alleles, each of small effect, gave rise to: -‐-‐Resemblance between relaCves. -‐-‐regression towards the mean. The apparent ‘blending’ of traits is due to inheritance ½ alleles from Mum and ½ from Dad.
“The correlations between relatives on the supposition of Mendelian inheritance”
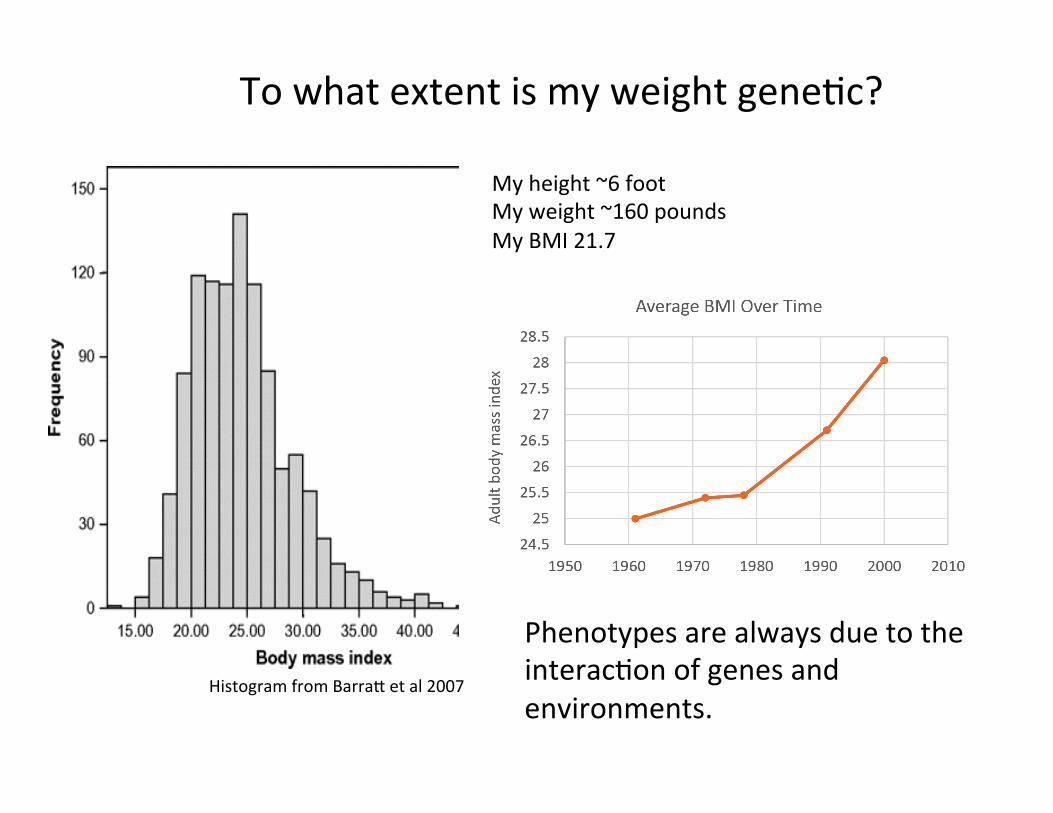
Histogram from Barra, et al 2007
To what extent is my weight geneCc?
My height ~6 foot My weight ~160 pounds My BMI 21.7
Phenotypes are always due to the interacCon of genes and environments.

My BMI is 22.4 Top 6 Alleles associated with BMI: SNP name My Genotype Avg. Effect on BMI* rs3751812 GT 0.33 for each T rs10871777 AA 0.2 for each G rs13130484 CC 0.19 for each T rs4788102 GG 0.15 for each A rs10838738 AA 0.07 for each G rs3101336 CT 0.1 for each C There are likely to be hundreds more geneFc variants contribuFng to BMI. *Calculated by 23&Me. Histogram from Barra, et al 2007
The heritability BMI (h2) in Europeans is between 0.5 and 0.70
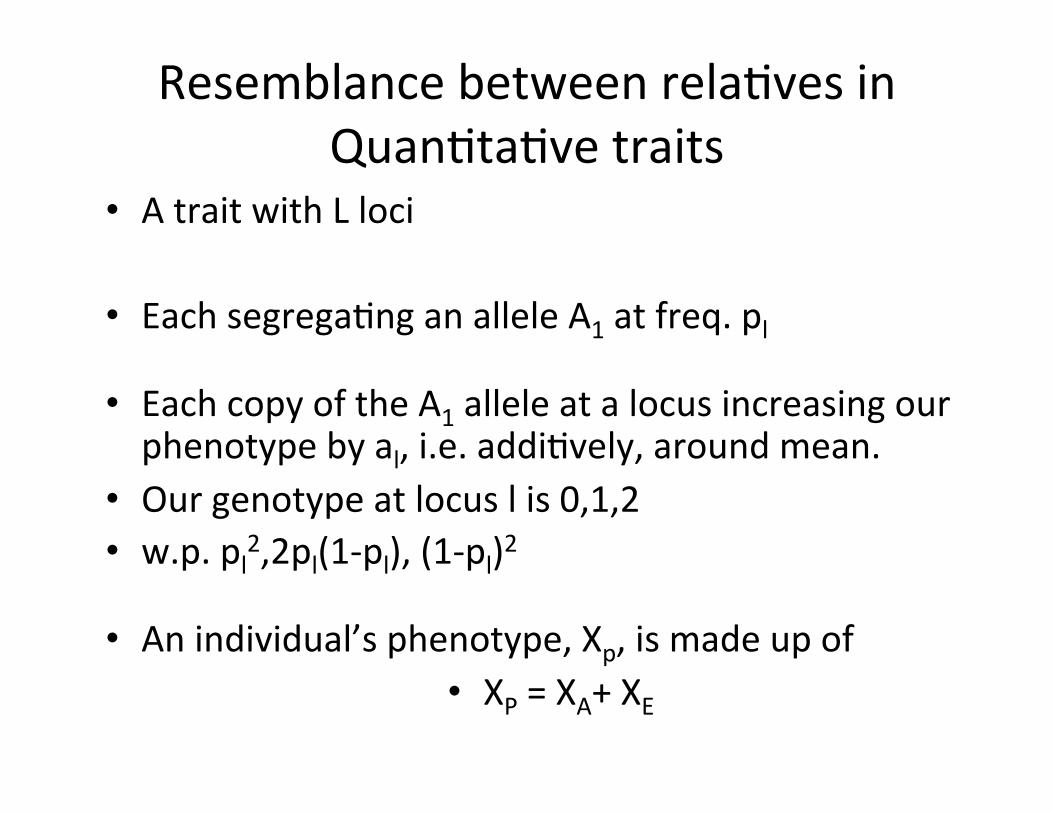
Resemblance between relaCves in QuanCtaCve traits
• A trait with L loci
• Each segregaCng an allele A1 at freq. pl
• Each copy of the A1 allele at a locus increasing our phenotype by al, i.e. addiCvely, around mean.
• Our genotype at locus l is 0,1,2 • w.p. pl2,2pl(1-‐pl), (1-‐pl)2
• An individual’s phenotype, Xp, is made up of • XP = XA+ XE
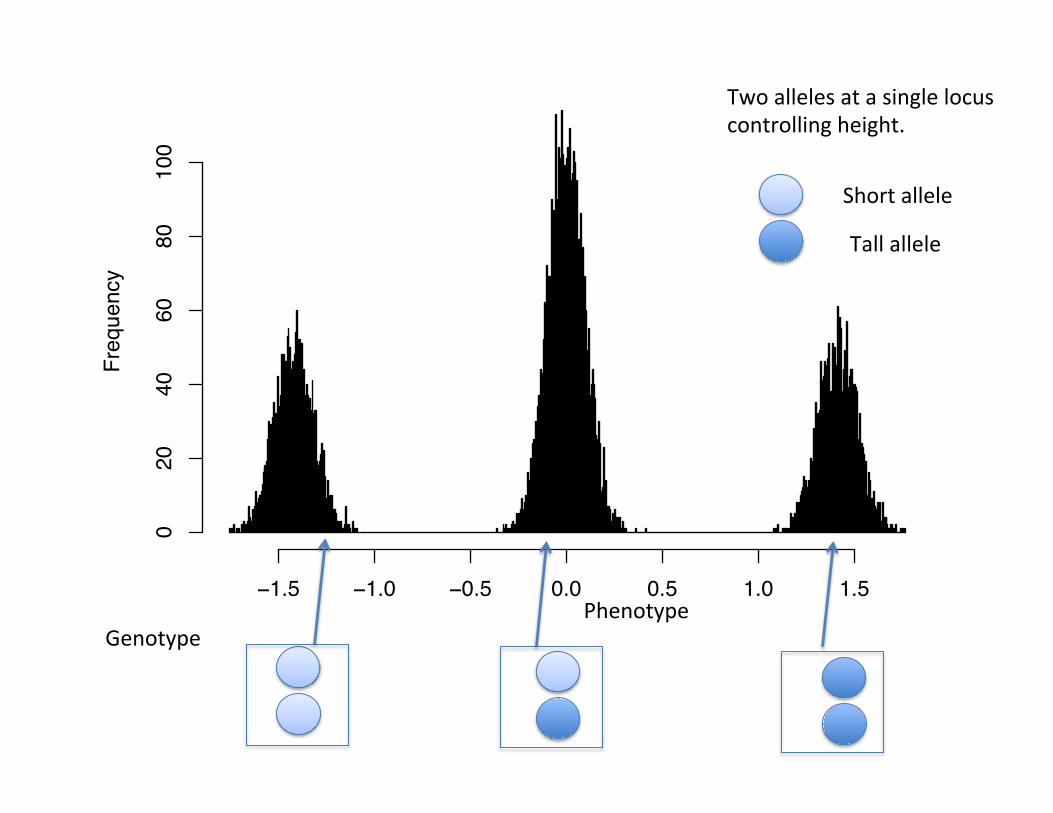
Phenotype
Frequency
−1.5 −1.0 −0.5 0.0 0.5 1.0 1.5
020
40
60
80
100
Genotype
Two alleles at a single locus controlling height.
Short allele
Tall allele
Phenotype
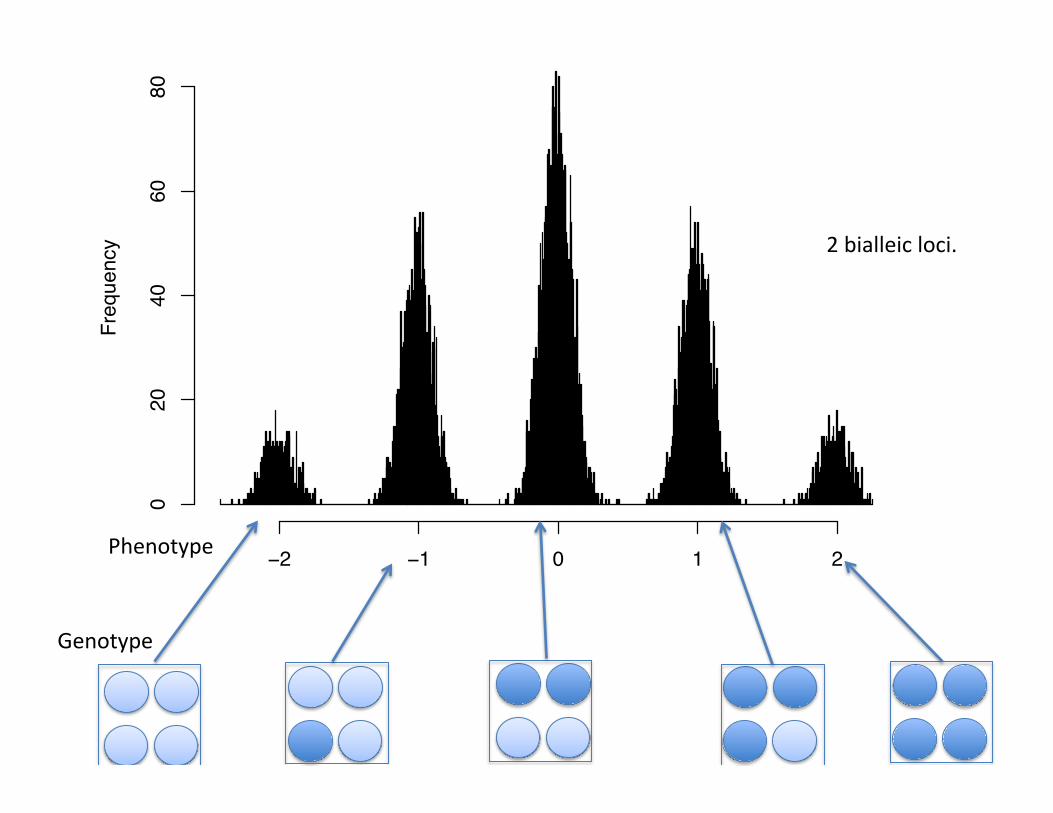
Phenotype
Frequency
−2 −1 0 1 2
020
40
60
80
Genotype
Phenotype
2 bialleic loci.
Phenotype
Frequency
−4 −2 0 2 4
010
20
30
40
50
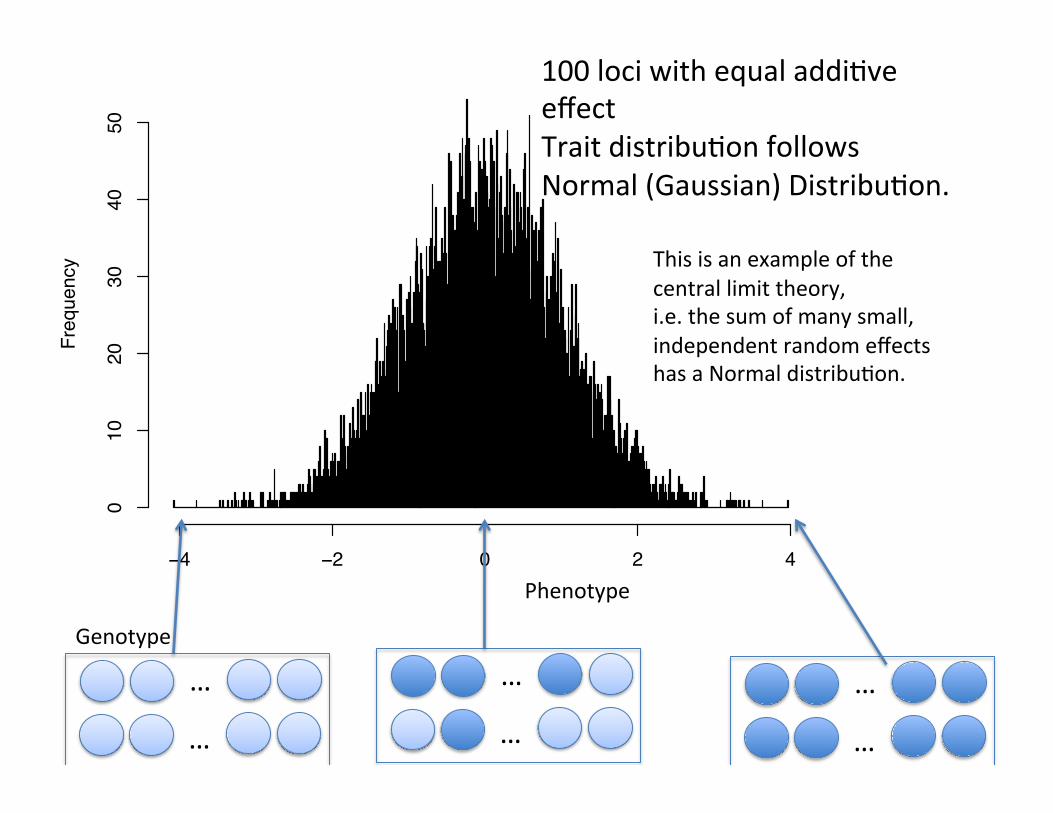
100 loci with equal addiCve effect Trait distribuCon follows Normal (Gaussian) DistribuCon.
…
…
…
…
Genotype
Phenotype
…
…
This is an example of the central limit theory, i.e. the sum of many small, independent random effects has a Normal distribuCon.
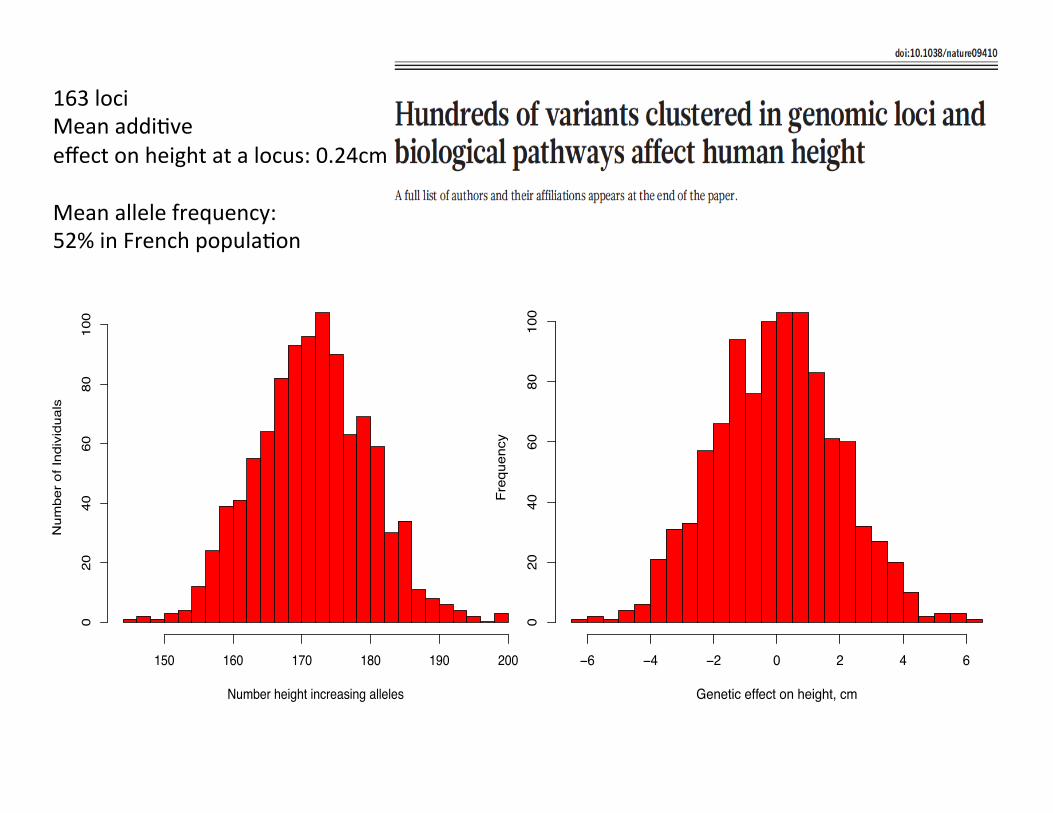
Genetic effect on height, cm
Freq
uenc
y
−6 −4 −2 0 2 4 6
020
4060
8010
0
Number height increasing alleles
Num
ber o
f Ind
ivid
uals
150 160 170 180 190 200
020
4060
8010
0163 loci Mean addiCve effect on height at a locus: 0.24cm Mean allele frequency: 52% in French populaCon
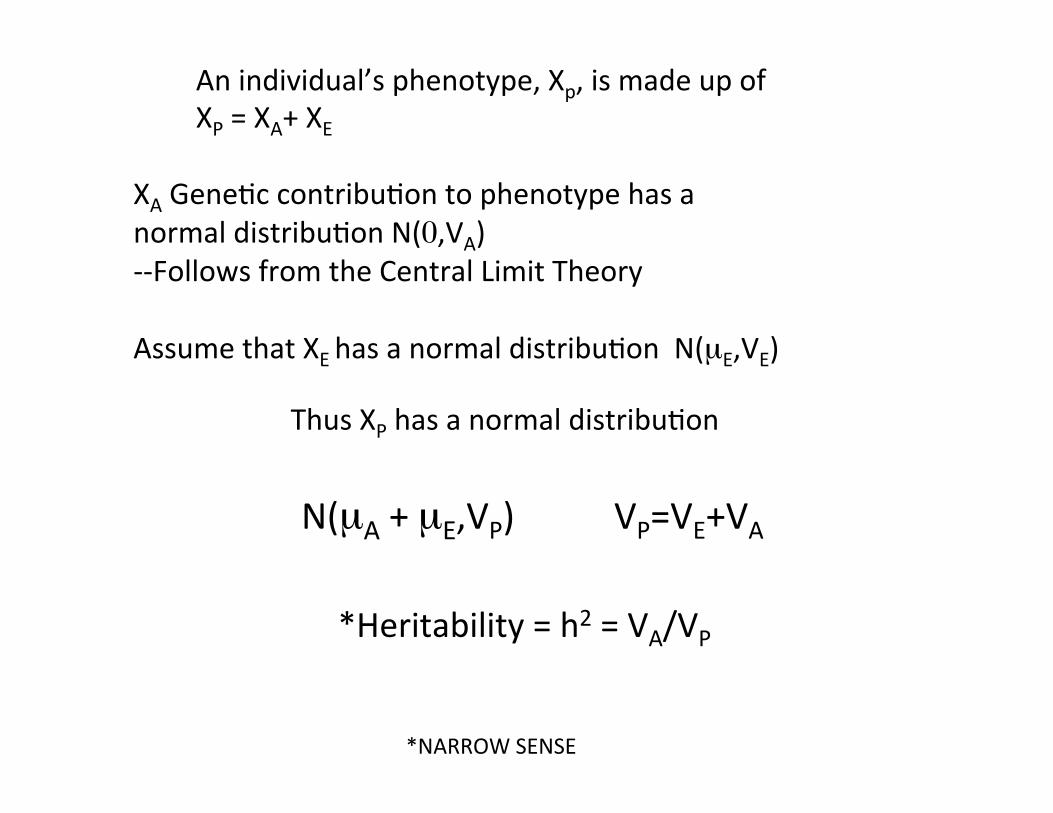
N(µA + µE,VP) VP=VE+VA
An individual’s phenotype, Xp, is made up of XP = XA+ XE
XA GeneCc contribuCon to phenotype has a normal distribuCon N(0,VA) -‐-‐Follows from the Central Limit Theory Assume that XE has a normal distribuCon N(µE,VE)
Thus XP has a normal distribuCon
*Heritability = h2 = VA/VP
*NARROW SENSE
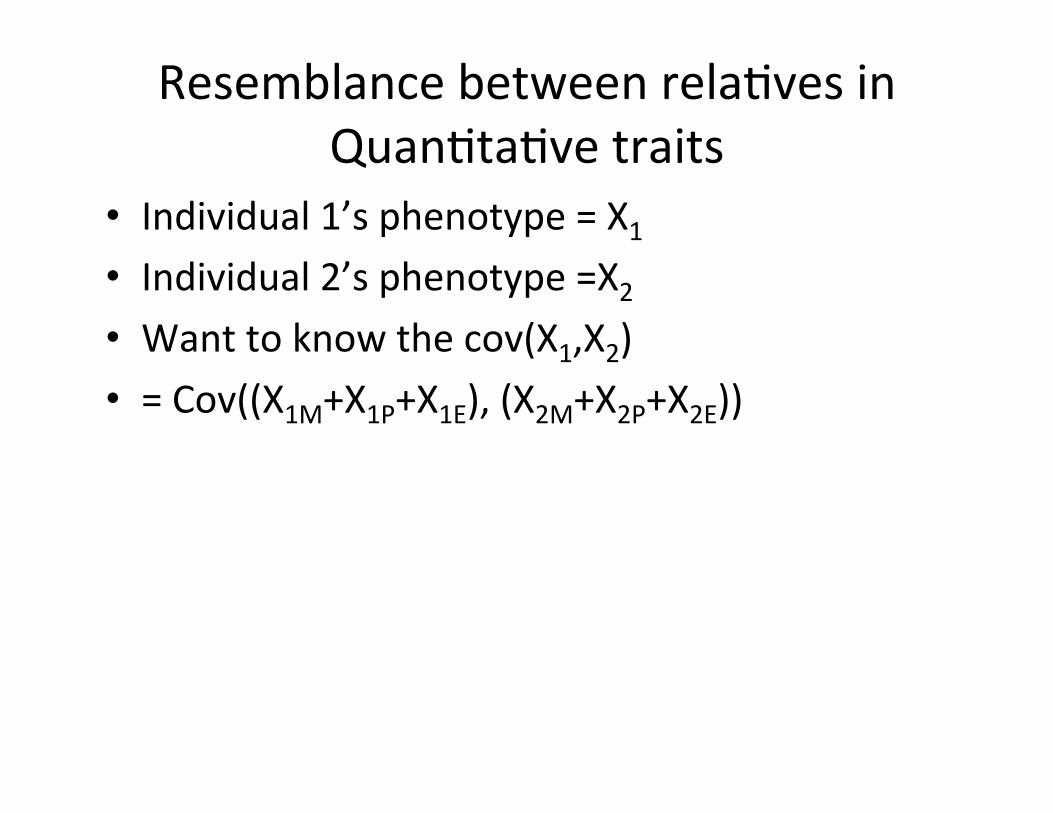
Resemblance between relaCves in QuanCtaCve traits
• Individual 1’s phenotype = X1 • Individual 2’s phenotype =X2 • Want to know the cov(X1,X2) • = Cov((X1M+X1P+X1E), (X2M+X2P+X2E))
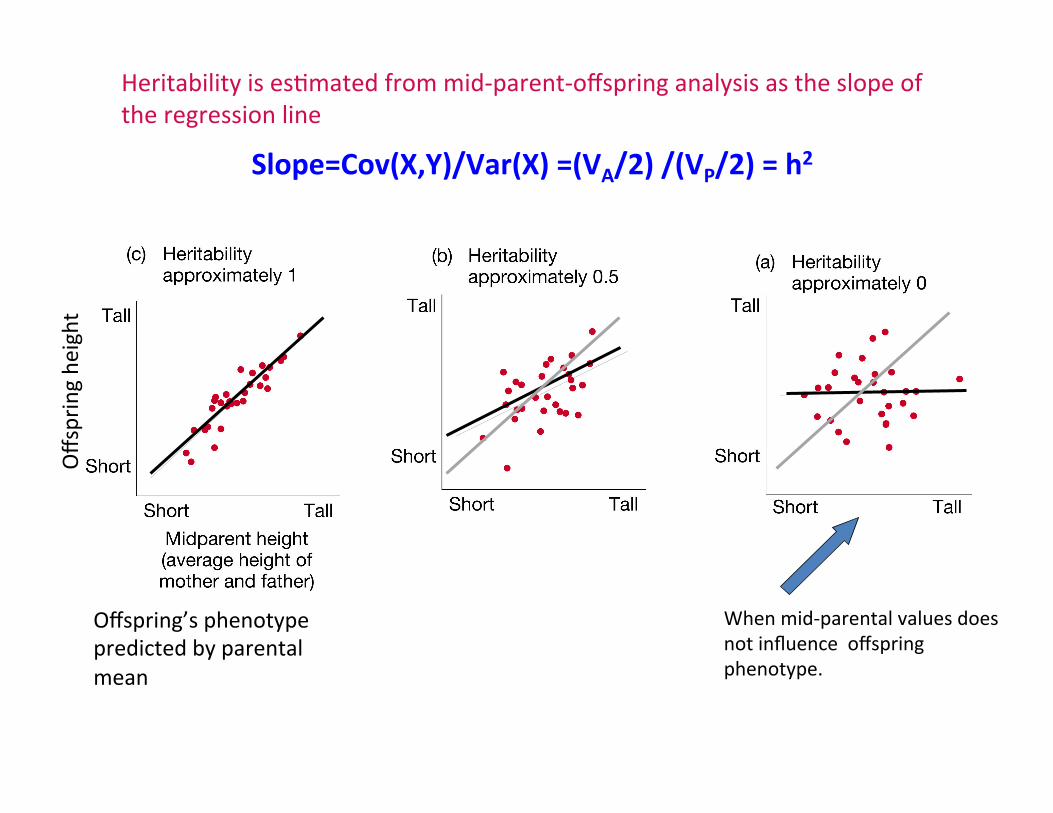
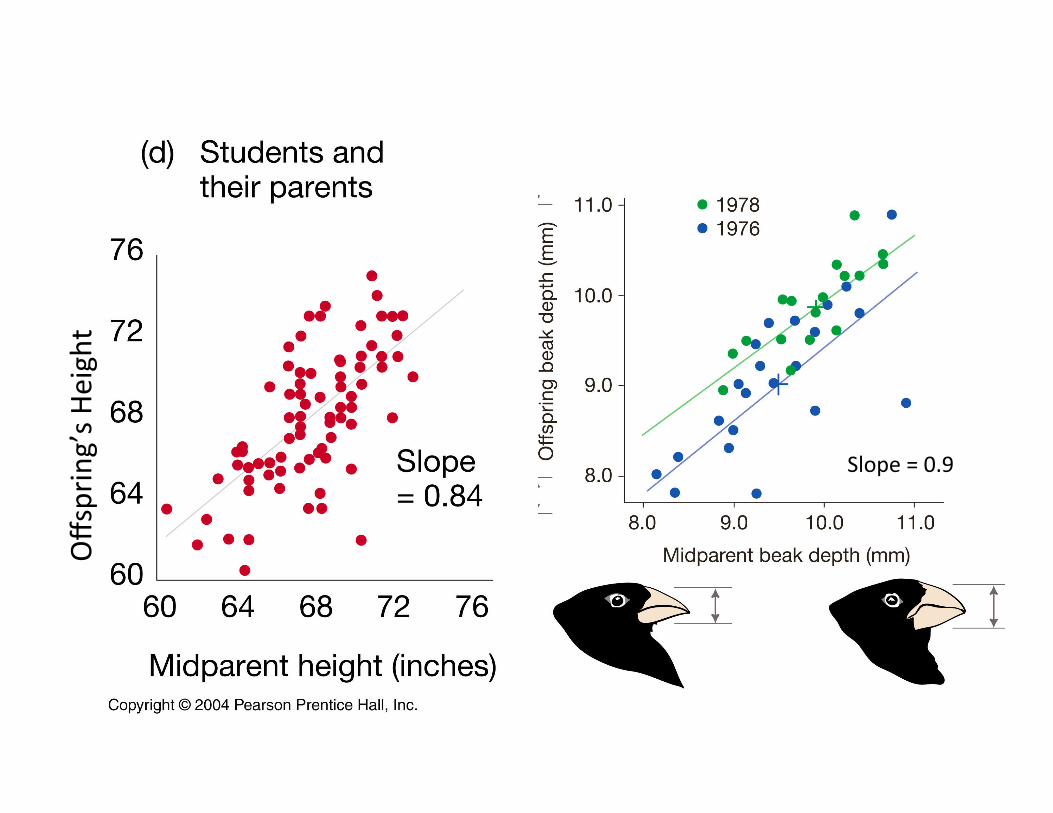
Heritability is esCmated from mid-‐parent-‐offspring analysis as the slope of the regression line
When mid-‐parental values does not influence offspring phenotype.
Offspring’s phenotype predicted by parental mean
Slope=Cov(X,Y)/Var(X) =(VA/2) /(VP/2) = h2
Offspring he
ight
Offspring’s H
eight
Slope = 0.9
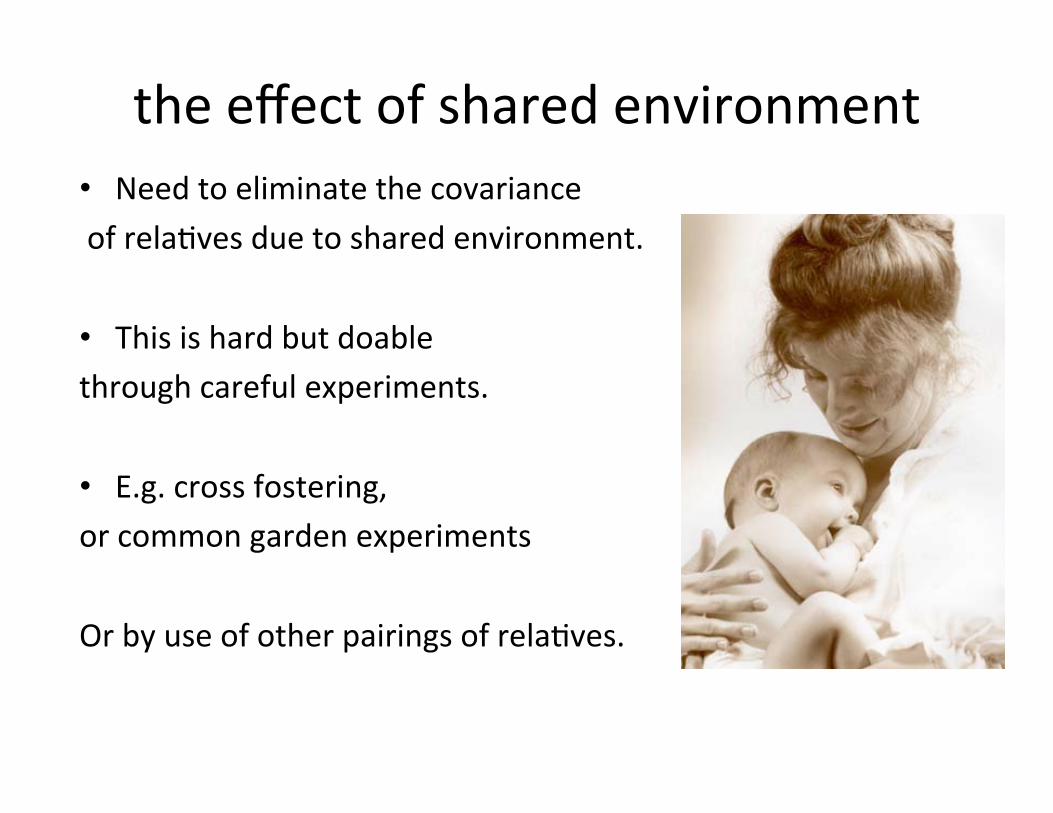
the effect of shared environment • Need to eliminate the covariance of relaCves due to shared environment.
• This is hard but doable through careful experiments.
• E.g. cross fostering, or common garden experiments Or by use of other pairings of relaCves.