Embed Size (px)
Citation preview

Chapter 8: HospitalsFirst Half
Lecturer: Monika M. Wahi, MPH, CPH

Learning Objectives
Name at least one reason for the expansion of U.S. hospitals, and at least one reason for downsizing them later
Describe one hospital stakeholder group, and how that group exerts influence on how a hospital operates
Be able to name and calculate at least one hospital utilization measure
At the end of this lecture, student should be able to:

Introduction to Hospitals
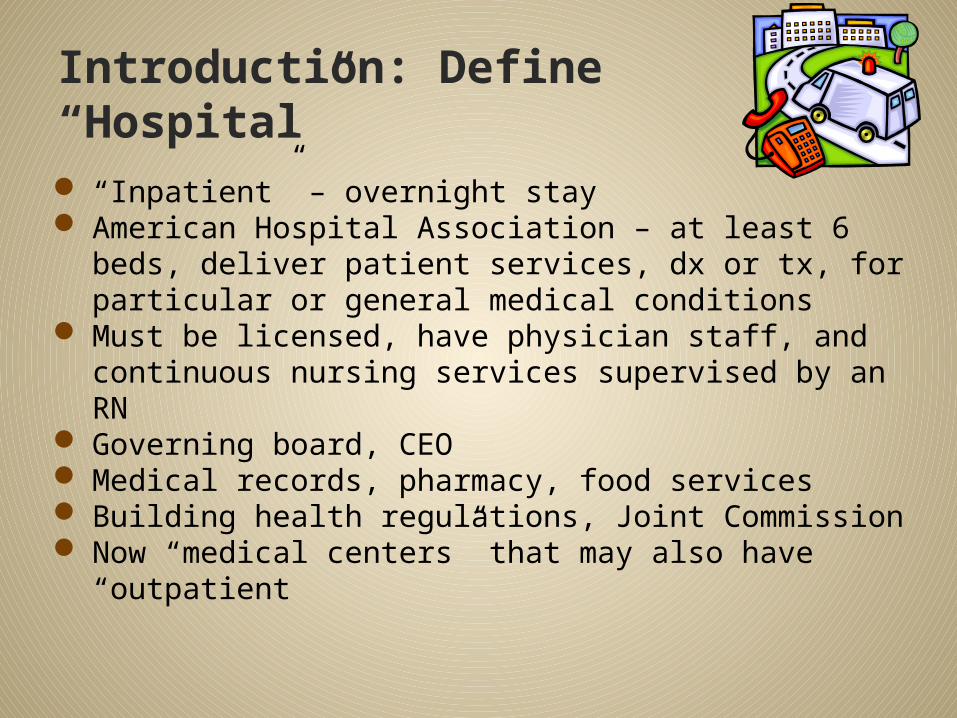
Introduction: Define “Hospital” “Inpatient” – overnight stay American Hospital Association – at least 6 beds,
deliver patient services, dx or tx, for particular or general medical conditions
Must be licensed, have physician staff, and continuous nursing services supervised by an RN
Governing board, CEO Medical records, pharmacy, food services Building health regulations, Joint Commission Now “medical centers” that may also have
“outpatient

Major Stages of Hospital Evolution
1 <1850 Almshouses as primarily institutions of social welfare
2 Late 1800s
Community-owned private hospitals as charitable institutions supported by affluent donors
3 Late 1800s
Medical services/training serving all members of society, make profit
4 Early 1900s
Small number of physician-owned proprietary hospitals emerge
5 Mid 1900s
University-based centers of medical research
6 1990+Emergence of medical systems providing a large array of health services
From Exhibit 8.1 (page 186)

The Expansion and Downsizing of America’s
Hospitals
Expansion and Downsizing of Hospitals
.
.
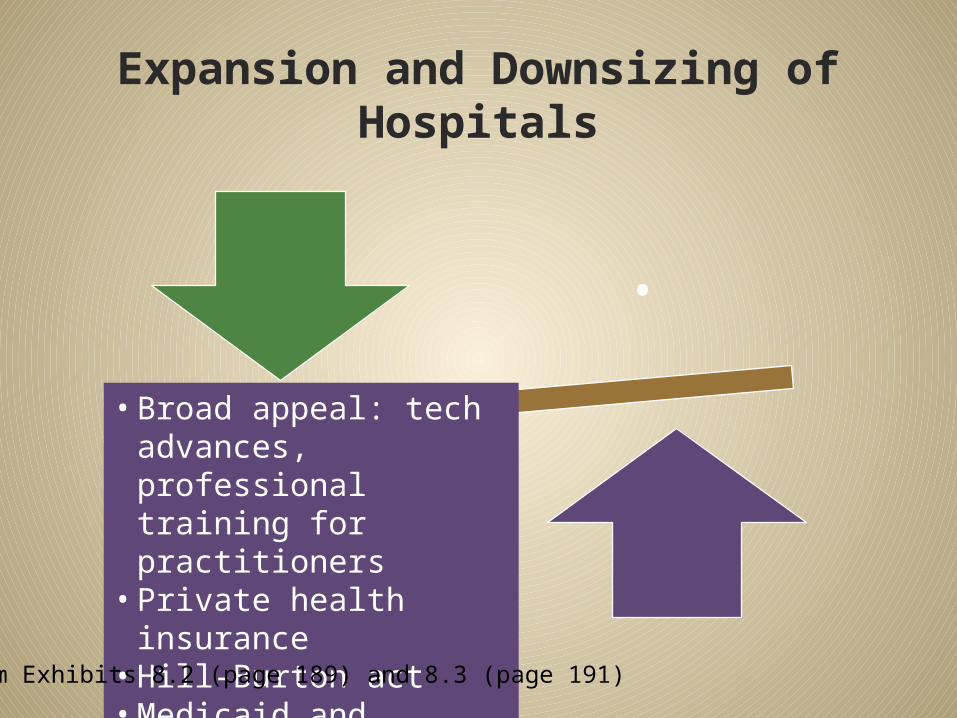
• Broad appeal: tech advances, professional training for practitioners• Private health
insurance• Hill-Burton act• Medicaid and MedicareFrom Exhibits 8.2 (page 189) and 8.3 (page 191)
First - Expansion
<1930
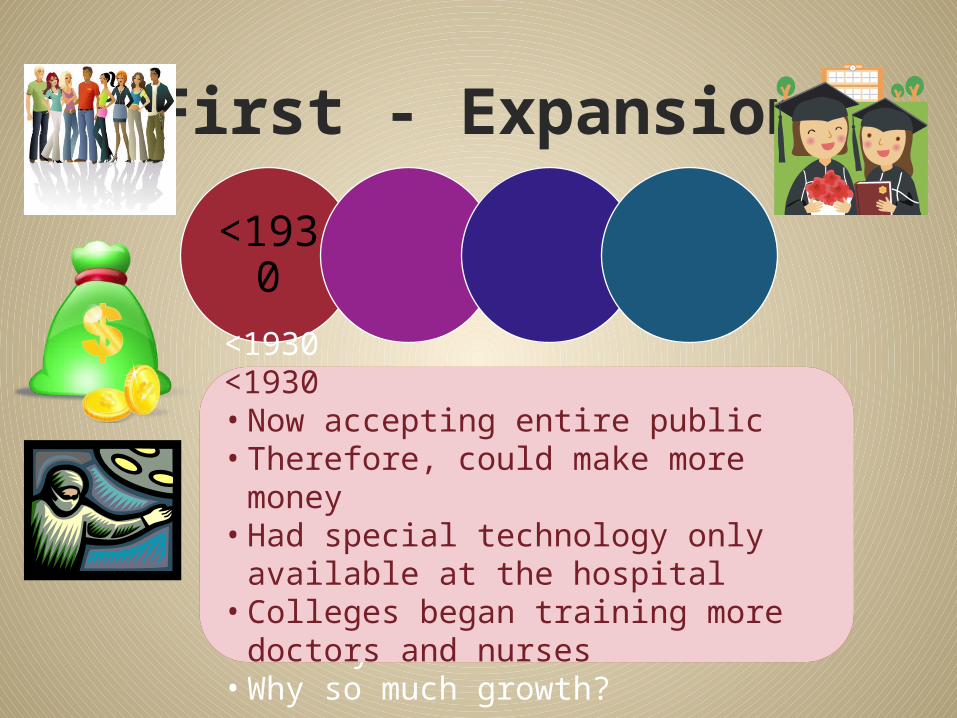
<1930• Number of hospital beds in US grew
from 35k in 1872 to 907k in 1929• Yes, that is 872k beds! • Yes, that is over 25 x the beds! • Yes, that only took around 60
years!• Why so much growth?
<1930• Now accepting entire public• Therefore, could make more money• Had special technology only
available at the hospital• Colleges began training more
doctors and nurses
First - Expansion
<1930
1930s
1930s• Private health insurance widely
available• Paying for hospital services out-of-
pocket became increasingly unaffordable due to high cost• Just having insurance generated
new demand• Covered mainly inpatient, few
restrictions
Moral hazard! Provider-induced demand!
First - Expansion
<1930
1930s
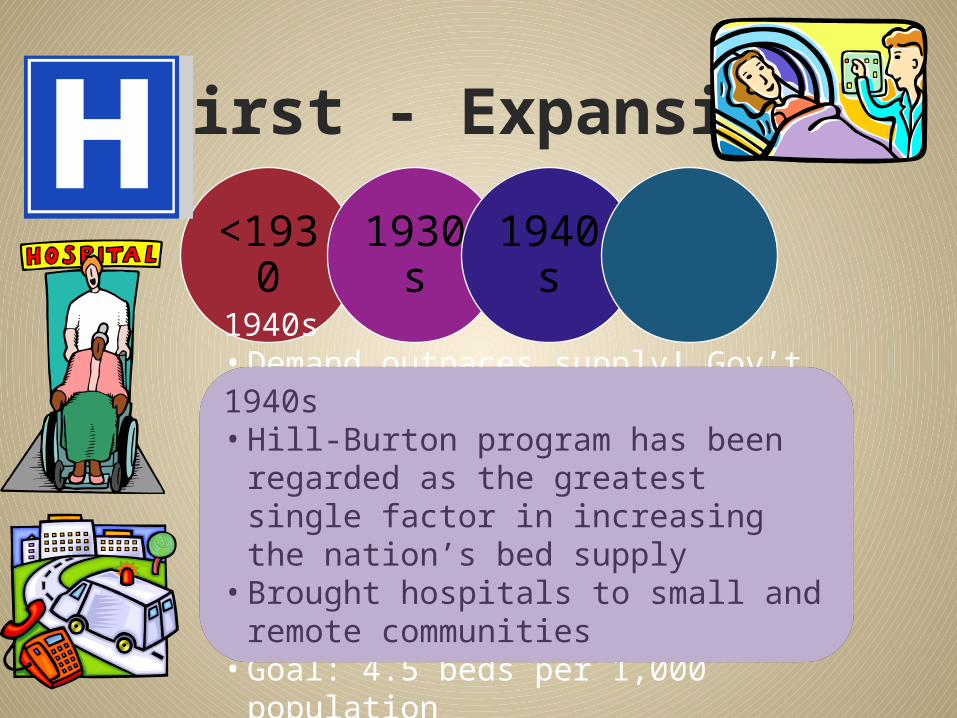
1940s
1940s• Demand outpaces supply! Gov’t
recognizes severe shortage of hospitals• Congress passed the Hospital
Survey and Construction Act of 1946 (Hill-Burton Act)• Federal grants to states to build
hospitals• Goal: 4.5 beds per 1,000 population
1940s• Hill-Burton program has been
regarded as the greatest single factor in increasing the nation’s bed supply• Brought hospitals to small and
remote communities

1965• Creation of Medicaid and Medicare
made public insurance available to a large segment of the population• 1965 to 1980, community hospitals
added almost 250,000 beds and reached the 4.5 beds/1,000 goal
First - Expansion
<1930
1930s
1940s
1965
Excuse me, but isn’t the ACA supposed to expand public health insurance to more people the way this effort did in 1965?

Proportion of Hospital Costs paid by Medicare went up
29%
71%
1970
% paid by Medicare% paid other ways
37%
63%
1980
% paid by Medicare% paid other ways
Who is paying for that extra part of the Medicare pie? And why?
Moral hazard! Provider-induced demand!
From Figure 8.1 (page 190).
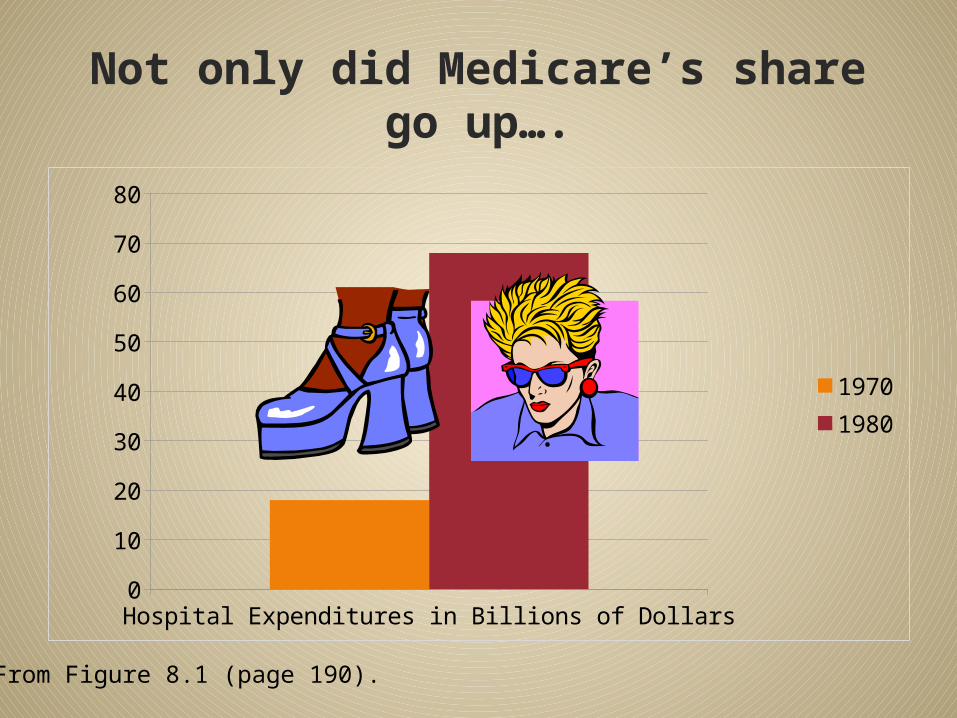
Not only did Medicare’s share go up….
Hospital Expenditures in Billions of Dollars0
10
20
30
40
50
60
70
80
19701980
From Figure 8.1 (page 190).

Expansion and Downsizing of Hospitals
.
.
• Medicare reimbursement changed to prospective method, shorter hospital stays• Hospital closings• Managed care’s cost
containment: more services outpatient, home health, skilled nursing care
• Broad appeal: tech advances, professional training for practitioners• Private health
insurance• Hill-Burton act• Medicaid and MedicareFrom Exhibits 8.2 (page 189) and 8.3 (page 191)

Now - Downsizing
1983
1983• Social Security Amendments of
1983• Stop retrospective reimbursement,
and start prospective reimbursement• DRGs as a way of reimbursement
forced hospitals to cut costs
1983• Hospitals now forced to discharge
patients more quickly• Some forced to close• Others continued to operate but
take unused beds out of service• PPS (prospective payment system)
triggered the downsizing phase

Now - Downsizing
1983
1990s
1990s• Managed care curtailed inpatient
use further• Emphasized cost containment and
efficient delivery of care• Early discharges plus home health
or skilled nursing homes• Also, divert to outpatient all who
qualify

Now - Downsizing
1983 1990s
2000s
2000s• Rates of growth in spending
declined after 1983 due to PPS• Rates of growth in spending slowed
even more in the 1990s due to managed care• But rates of growth in spending are
not the same as rates of spending!
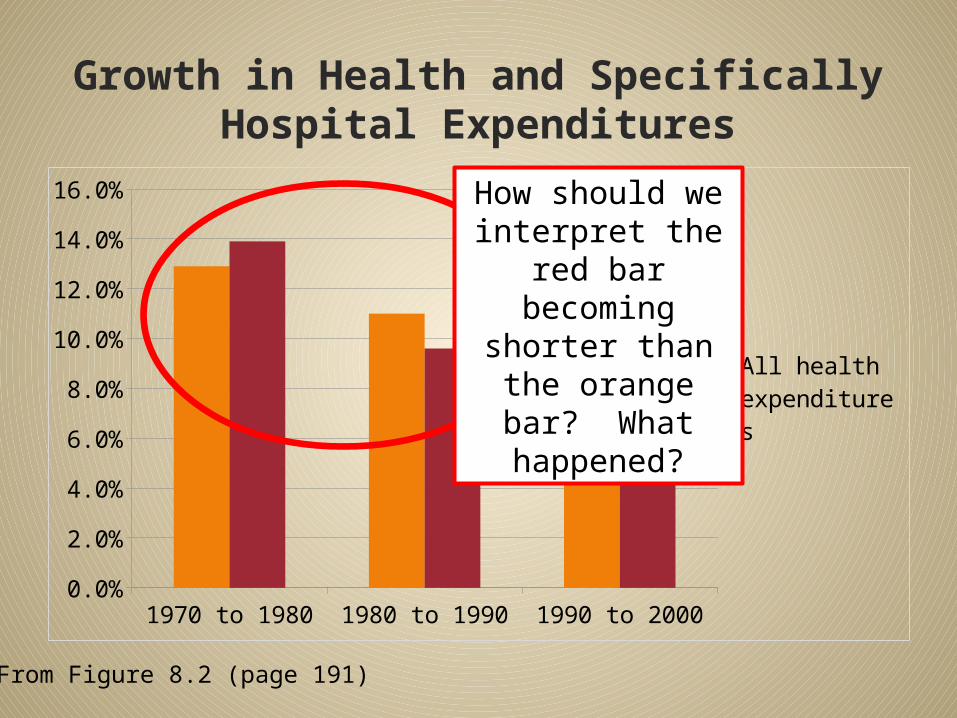
Growth in Health and Specifically Hospital Expenditures
1970 to 1980 1980 to 1990 1990 to 20000.0%
2.0%
4.0%
6.0%
8.0%
10.0%
12.0%
14.0%
16.0%
All health expendi-tures
Hospital care ex-penditures only
From Figure 8.2 (page 191)
How should we interpret the red
bar becoming shorter than the
orange bar? What
happened?

Access and Utilization Measures

Measure of Access: Discharges How do you figure out how many
people received hospital inpatients services? Discharges!
Rates of discharge per 1,000 population
Discharges do not include newborns
“Total number of patients released from a hospital’s acute care beds during a given period” including in-hospital deaths

Measures of Utilization: Days of Care
Inpatient-day (or patient-day, or hospital-day) = night spent in hospital by patient Same-day procedure? Not an inpatient-
day – and no discharge Length-of-stay (LOS) = number of
inpatient-days for a patient Average length-of-stay (ALOS) =
average number of inpatient days (per place per time period)
Days of care (per place per time period) = discharges x ALOS

Simple ExamplePatient Treatment Date of
AdmissionDate of Discharge
LOS
Jane Doe Hysterectomy
9/27/2007 9/29/2007 2 days
Juana Dos Trauma tx 9/27/2007 10/3/2007 6 days
Jeanne Deux
Infection tx 9/27/2007 10/7/2007 10 days
• If these were the only 3 discharges between 9/27/2007 and 10/7/2007 for Hospital Q• For that Hospital Q for 9/27/2007-10/7/2007,
the ALOS would be 2 + 6 + 10 divided by 3 (average) = 6 days
• Discharges x ALOS = 3 x 6 = 18 days of care at Hospital Q for 9/27/2007 through 10/7/2007

Days of Care in the U.S.
National days of care per 1,000 population
show older people spend more time in
hospitals than younger people
Women admitted to hospitals more often than men, but men incur longer stays
(after adjustment for childbearing)
• Hospital use higher among blacks vs. whites
• Higher among poor vs. nonpoor
• Why?

Why these differences ALOS for different populations?CAUSES MORE MORTALITY & MORBIDITY/DAYS OF CARE Low education Low income Smoking/tobacco use Substance abuse Poor diet, obesity, lack
of exercise Poor access to
primary care
CAUSES LESS MORTALITY AND MORBIDITY/DAYS OF CARE High education High income Not smoking/no
tobacco No substance abuse Good diet, normal
weight, regular exercise
Good access to primary care
Hey, aren’t those the
same people on Medicare
and Medicaid?

Efforts to Curb Hospital Costs Reduced ALOS
Since 2003, ALOS for community hospitals has been 4.8 days, lowest ever recorded
PPS (prospective reimbursement) had an impact
Managed care in the 1990s Growth of home health and subacute
long-term care enabling earlier discharge
Did this shift harm patients? Since the development of facilities
and advanced technology, quicker discharge did not cause medical harm to patients
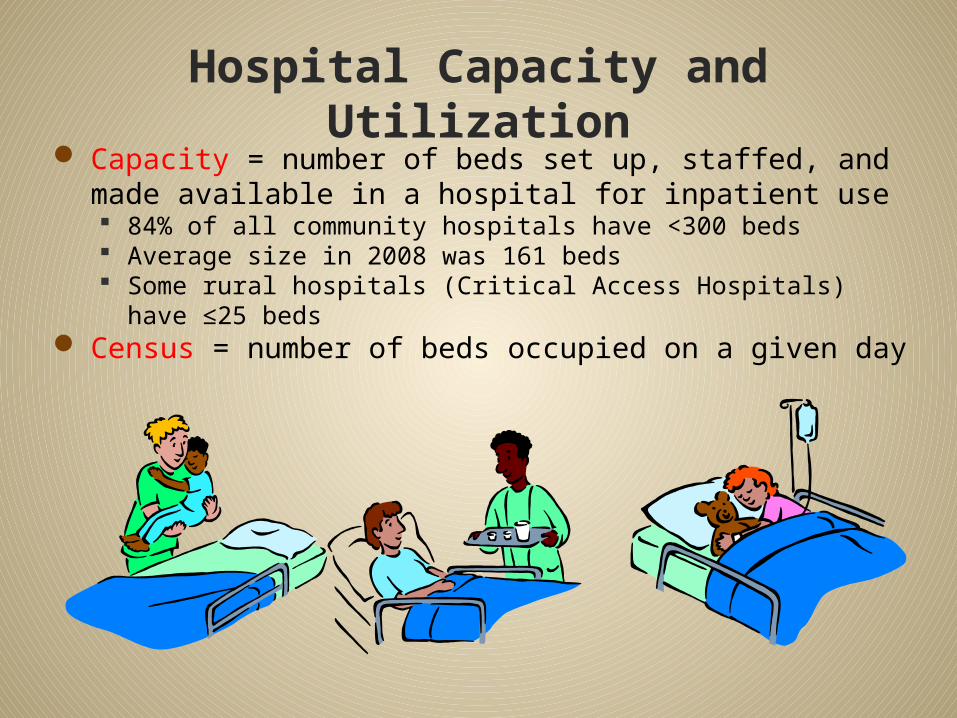
Hospital Capacity and Utilization
Capacity = number of beds set up, staffed, and made available in a hospital for inpatient use 84% of all community hospitals have <300 beds Average size in 2008 was 161 beds Some rural hospitals (Critical Access Hospitals) have
≤25 beds Census = number of beds occupied on a given day

More on Capacity Cumulative census over a period of time = patient
days or days of care Can also calculate an average census over a period of
time Select a time frame (e.g., a June 2012) Count number of days of care over that month (e.g., number
of days of care in June added up = 3,300) Divide by number of days in period (e.g., 3,300/30 = 110)
Occupancy rate = % of capacity used during a given time For our hospital above, if total bed = 200, we would have an
occupancy rate of 110/200=0.55 or 55% In 2008, U.S. community hospital occupancy rate = 66.4% Book gives another example
Why so low?

Licensure, Magnet Recognition Program, and
Hospital Organization

Licensure, Certification and Accreditation
Must have state license from the Department of Health Building codes, fire safety, etc. Minimum standards for personnel,
equipment Must have certification from
federal government to get Medicaid/Medicare patients “Conditions of participation” are to
meet certain standards Joint Commission or the American
Osteopathic Association accredited hospitals are “deemed “ to meet these
Joint Commission Formed in 1951 as a private
non-profit with the approval of various medical and hospital organizations
Accredits different facilities (hospitals, substance abuse programs, etc.) if they meet standards Different standards apply to
different facilities More recently, greater
emphasis on quality of careWhat about before 1951?
Magnet Recognition Program 1994 – American Nurses Association conferred
Magnet status on hospitals (“Magnet hospitals”) Strict standards on quality of patient care Leadership in creating health work environments
through nursing excellence and innovations Research shows Magnets attract and promote
retention of well-qualified nurses, resulting in quality patient care
Only 400 (7%) U.S. hospitals are Magnet Several are near: Boston Children’s, MGH,
South Shore Hospital, Dana-Farber Cancer Institute, others

Hospitals have to Answer to Many Stakeholders
Community Government
MCOs Accreditation Agencies

Cast of Characters in Hospital Organization
Board of trustees – group that hires/directs CEO
CEO – Responsible for managing the hospital Senior execs as staff (VP of Nursing, VP of
HR, VP of Rehav Svcs, etc.) Non-physician providers often report to
these execs Chief of Staff/Medical Director – Actually
the head of another organizational structure Physicians report to Medical Director
Non-physician providers administratively accountable to CEO, but professionally accountable to Medical Director

Hennepin County Medical CenterMinneapolis, MNNURSES, TECHS, HR, ETC. HOSPITAL EMPLOYEES
PHYSICIANS MEMBERS OF HENNEPIN FACULTY ASSOCIATES
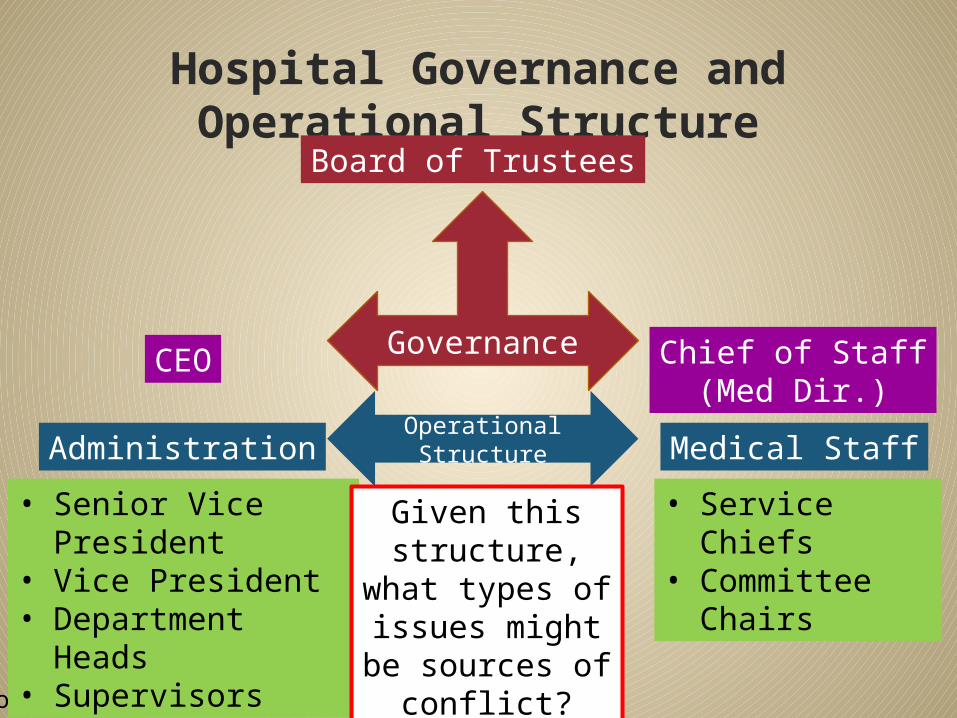
Hospital Governance and Operational Structure
From Figure 8.4, page 204.
Board of Trustees
CEO Chief of Staff(Med Dir.)
Governance
Administration Medical StaffOperational Structure
• Senior Vice President
• Vice President• Department
Heads• Supervisors
• Service Chiefs• Committee
Chairs
Given this structure, what types of issues
might be sources of conflict?
Some Exceptions VA hospitals employ all their
own staff Some hospitals employ a
number of salaried hospitalists (they do not work for the physician group)
Physician group may employ a handful of non-physicians (nurses, administrative support)

Ethics and Public Trust in Hospitals

Moral Responsibilities of Beneficence and Non-Maleficence
BENEFICENCE Obligation to do all it
can to alleviate ill health caused by illness or injury
Includes essential services (such as ER services) to those who are too poor to pay
NON-MALEFICENCE Do not harm patients Physicians must use
best possible judgment to maximize health benefits and minimize risk of all interventions
In what situations in the hospital might these two responsibilities compete?
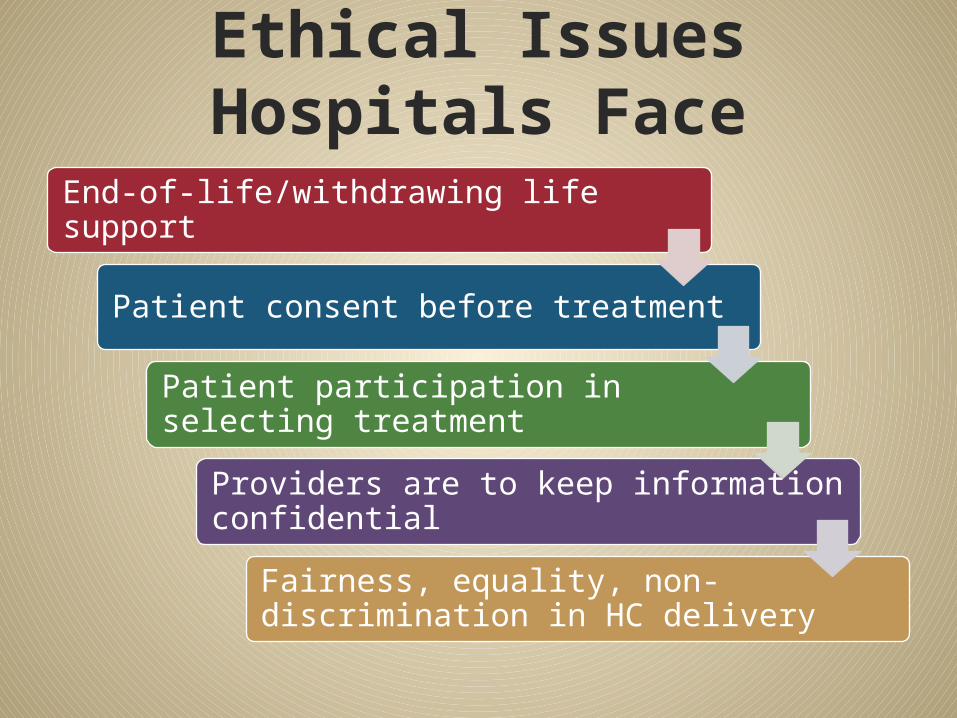
Ethical Issues Hospitals Face
End-of-life/withdrawing life support
Patient consent before treatment
Patient participation in selecting treatment
Providers are to keep information confidential
Fairness, equality, non-discrimination in HC delivery

How Hospitals Address Ethical Issues
Hospital Ethics Committee• Develops guidelines/standards, makes
decisions• Interdisciplinary: phys., nurses, clergy, SW,
legal/ethicsPatient Self-Determination Act of 1990• Applies to all facilities participating in
Medicare/Medicaid• All patients must be given patients’ rights
informationInformed Consent• Every patient has a right to make an informed
choice• Physicians must provide information to
mentally capableAdvance Directives• Patients expressing wishes before becoming
incompetent• Much preferred to alternative, but rarely done in
practice

Hospitals and Public Trust
Hospital’s mission is to benefit the community, whether public or private Hospital administrators are charged with acting
prudently with fiduciary responsibility Hospital to be viewed as a community asset When such a viewpoint is lost, and hospitals put
other priorities (especially financial concerns) above serving the community, a breach of public trust can occur.
Hospitals must be integrated in the HC system Growing emphasis on holding hospitals
accountable for the health of their communities
Conclusion Hospitals have undergone a major
evolution in the U.S. health care system First, a period of expansion Next, a period of downsizing
Several utilization metrics have been developed to compare hospitals fairly
Many hospitals face unique challenges of governance, licensure, and ethical issues
Hospitals will continue to evolve and will play an important role in the future of the U.S. HC system
Learning Objectives
Name at least one reason for the expansion of U.S. hospitals, and at least one reason for downsizing them later
Describe one hospital stakeholder group, and how that group exerts influence on how a hospital operates
Be able to name and calculate at least one hospital utilization measure
At the end of this lecture, student should be able to: