Embed Size (px)
Citation preview
Building on LEED Cheng, Esener, King, Larsen
Building On LEED
Improving the Evaluation of Green Buildings
Completed for “Energy & Energy Policy”
Professors George Tolley & Steve Berry
Authors:
Likwan ChengAlp Esener
Kathryn KingErika Larsen
LEED, 1
Building on LEED Cheng, Esener, King, Larsen
Executive Summary
LEED (Leadership in Energy and Environmental Design) is a certification and standard-
setting programme designed to improve the environmental sustainability of buildings and
encourage the spread of “Green Buildings.” The success of this program could be
instrumental in achieving US energy and emission reduction goals; buildings contribute a
significant percentage of both US energy and carbon dioxide emissions. The current
version of LEED should be commended for its entrepreneurial progress; it has
undoubtedly contributed to considerable reductions in energy use and emissions.
However, in order for LEED to achieve its full potential and evolve from a benchmark
into a mandate, two key areas of improvement need to be addressed:
Point Alignment: The current version of LEED was designed to be a helpful
benchmark for commissioners who desired to build environmentally sustainable
buildings. It was not intended to be a mandate for all new buildings. As a result,
the point allocations are somewhat unsystematic and not directly correlated to
energy and emission reduction. To ensure that the LEED program achieves the
highest potential environmental improvements, we argue that the current point
system needs to be redesigned such that the points align with actual energy
savings over the lifecycle of the technology. Ultimately, the energy savings and
appropriate point allocation should be calculated and weighted using Life Cycle
Analysis (LCA).
Incorporating Appropriate Standards for Lab Buildings: Currently, analysts
are able to be reasonably accurate in projecting energy performance for most
LEED certified buildings. However, for high energy-use buildings (such as labs),
LEED, 2
Building on LEED Cheng, Esener, King, Larsen
the projections do not correlate well with actual performance. Without an
accurate understanding of future performance, it is difficult to design appropriate
LEED standards for high energy buildings. Thus, we recommend efforts to
improve the current knowledge base in relation to Lab buildings. In addition, we
propose establishing a separate point-allocation system specific to lab buildings;
like LEED for average buildings, this system should allocate points based on
actual energy savings.
The current LEED system has achieved a great deal and started us on a path towards
environmental sustainability in buildings. However, it is critical that we continue to
build on this success and allow LEED to have the greatest impact possible.
1.1 Background
LEED was designed by the U.S. Green Building Council (USGBC) in 1998.
Since then it has grown and been modified substantially, with the current version being
labelled LEED 2.2.1 Currently there are over 14,000 projects with LEED certification
and many government agencies have been promoting LEED by implementing its
standards in their own buildings. For example, a recent legislative initiative aims to
require LEED certification in all newly built public schools.
From an environmental standpoint LEED’s goal of reducing the environmental
impact of buildings is extremely important. In North America, where LEED is most
predominant, buildings account for 20% of all energy usage.2 Buildings also account for
72% of all electricity and 54% of all natural gas consumption. They also contribute 37%
1 There also exists a preliminary working paper open to public evaluation for LEED 3.0.2 National Academy of Sciences. (2008)
LEED, 3
Building on LEED Cheng, Esener, King, Larsen
of North American carbon dioxide emissions3 To put this into context, this means that US
buildings alone emit more carbon dioxide than any other entire country except China. To
encourage reductions in these environmental impacts of buildings, a system of standards
monitoring energy reduction and increase “greenness” of buildings is necessary. The
introduction of LEED was a first step in developing these standards; it was designed to be
used as a benchmark to be used by building commissioners who wished to be more
environmentally friendly. This effort has been largely successful; by 2006, 642 million
square feet of building space had achieved LEED certification.4 These buildings have
been proven to use significantly less energy and emit less carbon dioxide than non-
certified buildings. However, with success and expansion have come new challenges.
Because LEED is emerging as a mandated industry standard, it must be re-evaluated; its
initial ‘benchmark’ design needs to be adjusted to account for builders who may not be as
motivated. Furthermore, it needs to be made as effective as possible; despite the increase
in LEED certifications, emissions from buildings have, since 1990, continued to grow at
about 2.1% a year.5
1.2 Overview of the LEED Certification Process
LEED (2.2) certification is known as a “menu-based system”. Each building-
commissioner can choose from a list of projects and items (such as installing on-site
renewable energy facilities or improving insulation) to implement in the construction (or
renovation) of the building. The building is then awarded points for these projects/items.
3 Globally this figure is 10%.4 Housing Commission Documents (2007)5 McMahon, J.E (2007)
LEED, 4
Building on LEED Cheng, Esener, King, Larsen
With the exception of seven prerequisite requirements (to which no points are awarded
but which must be installed to become LEED certified) and two “special” items (which
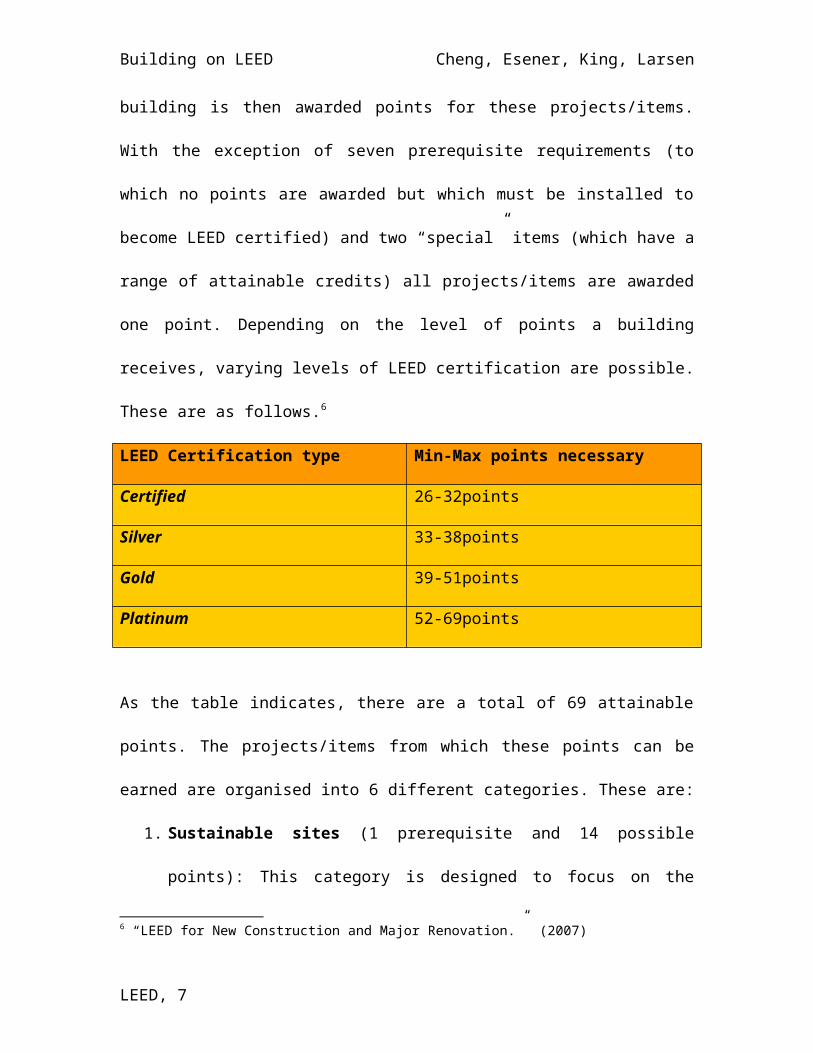
have a range of attainable credits) all projects/items are awarded one point. Depending on
the level of points a building receives, varying levels of LEED certification are possible.
These are as follows.6
LEED Certification type Min-Max points necessary
Certified 26-32points
Silver 33-38points
Gold 39-51points
Platinum 52-69points
As the table indicates, there are a total of 69 attainable points. The projects/items from
which these points can be earned are organised into 6 different categories. These are:
1. Sustainable sites (1 prerequisite and 14 possible points): This category is
designed to focus on the sustainability of buildings by reducing the impact of the
buildings to the surrounding environment and by encouraging less
environmentally damaging modes of transport. For example, points are awarded
for locations close to public transportation.
2. Water Efficiency (5 possible points): This category is included to encourage
more efficient use of water and waste treatment. For example, points would be
awarded for installing low-flow water fixtures.
6 “LEED for New Construction and Major Renovation.” (2007)
LEED, 5

Building on LEED Cheng, Esener, King, Larsen
3. Energy and Atmosphere (3 prerequisites, 17 possible points, one item with 1-10
point range and one item with 1-3 point range. 4 more items worth 1 point each):
This is the largest and most important category and will be the main focus of this
paper. This category deals with a variety of issues, ranging from improvements in
commissioning (ensuring the building operates as planned), to items dealing with
the way the building optimises its energy. The methodology is two-fold; there are
points awarded for the use of ‘green’ and on-site renewable energies, as well as
points for technologies that reduce emissions and refrigerants.
4. Materials and Resources (1 prerequisite and 13 possible points): This category
deals primarily with building maintenance. Its purpose is to encourage the use of
sustainable and environmentally friendly materials in new constructions and
renovations. For example, points in this category are awarded for providing on-
site recycling facilities.
5. Indoor Environmental Quality (2 prerequisites and 15 possible points): Points
in this category are designed to improve health conditions in the building and to
reduce indoor pollution. Points are awarded for a range of items; these range from
following certain ventilation standards to use of low-emitting substances for
interior design (such as more environmentally friendly forms of paint) to windows
with better exposure to light and outside views.
6. Innovation and Design (5 possible points): This category awards points to
buildings that adhere to certain LEED innovation and design codes, including one
for inclusion of LEED certified member(s) on the building-project team.
LEED, 6
Building on LEED Cheng, Esener, King, Larsen
Applicants who wish to become LEED certified can submit an application (by mail or
online) during the design, construction or operational (post-completion) phase of the
building, after which a panel from USGBC will review the building and award it points
accordingly. USGBC requires that the building be inspected at least every 5 years to
maintain certification, but recommends doing so annually.
LEED also has slightly different auxiliary versions for specific types of buildings.
While the general guidelines mentioned above are primarily used for commercial
buildings (which are currently the main LEED adopters). For example, in January 2008
USGBC released a LEED for Homes Rating system that is principally the same as the
general LEED 2.2 but has some modifications to accommodate specific factors relevant
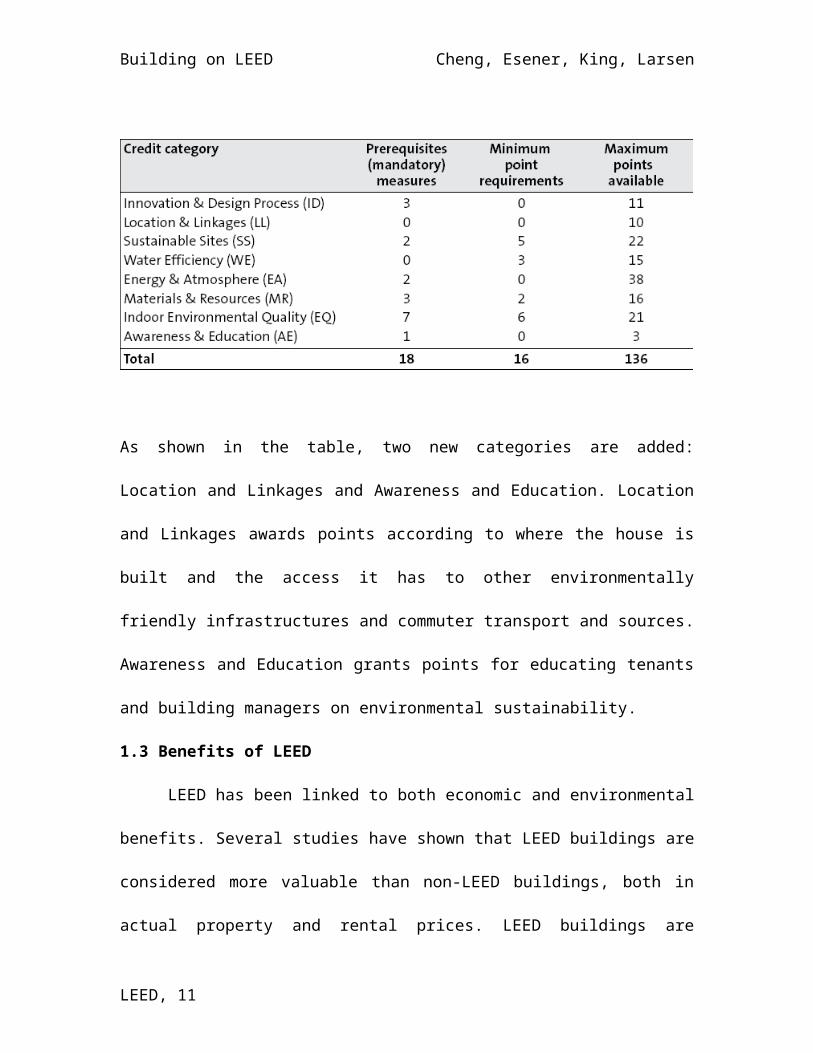
in residential buildings. The modified point system is as follows:7
As shown in the table, two new categories are added: Location and Linkages and
Awareness and Education. Location and Linkages awards points according to where the
house is built and the access it has to other environmentally friendly infrastructures and
7 “LEED for Homes Rating System”. (2008)
LEED, 7
Building on LEED Cheng, Esener, King, Larsen
commuter transport and sources. Awareness and Education grants points for educating
tenants and building managers on environmental sustainability.
1.3 Benefits of LEED
LEED has been linked to both economic and environmental benefits. Several
studies have shown that LEED buildings are considered more valuable than non-LEED
buildings, both in actual property and rental prices. LEED buildings are perceived to be
more fashionable among environmentally conscious buyers and renters and this is a
reputation component that can add prestige to the building. Because of this and their
lower energy costs, LEED buildings command a sales premium of $171 per square foot
and a rental premium of $11.28 per square foot when compared to non-LEED. They also
have a 3.8% higher occupancy rate. Perhaps even more importantly, research has also
determined that on average a LEED building saves 25-50% in energy, confirming its
environmentally friendlier status.8 Another possible, albeit less verified, benefit is that
certain materials that award LEED points also tend to increase the life potential of the
building, leading to fewer needs of renovation and maintenance9.
Finally, it has also been claimed that the work and living environment within LEED
buildings is healthier and contributes to higher productivity among individuals inside
it.10.This is difficult to verify; such conditions are rather difficult to isolate from other
variables.. Nonetheless, it can be reasonably assumed that some health benefits are
derived from the reduction in toxic substances throughout the building.
1.4 Costs of LEED
8 Turner, C. and Frankel, M. (2008). CoStar. (2007) 9 “Green Buildings,”.(2007) “LEED Certification for Buildings”.(2007) 10 “LEED Certification Program Leads to Potential Benefits”. (2007)
LEED, 8
Building on LEED Cheng, Esener, King, Larsen
Despite these benefits and increasing enthusiasm for LEED, obstacles to LEED
expansion remain. In fact, a large number of LEED projects are frequently abandoned or
halted before LEED certification is awarded. This is due to increased construction and
administrative costs that are difficult to quantify but may discourage potential contractors
and building commissioners from implementing the changes needed to obtain LEED
certification.
There are, primarily, costs for installing and/or constructing the items necessary to
gain LEED points towards certification. Because the LEED system is a point-based
system, these can be a variety of different materials or installations, ranging from types
of paint and insulation to different methods of deriving on-site energy (such as solar
panels). One study estimates these costs to add anywhere between 2-6% to the initial
construction cost of buildings. As mentioned before, LEED buildings sell at a premium
that may more than compensate for these expenses. However, this is only part of the
actual cost of obtaining LEED certification. The less quantifiable costs come from
increased administrative challenges. These can be categorised into commissioning,
documentation/administrative tasks and energy modelling and design. One study
estimates that energy modelling is not a very significant cost (about 0.1% increase in
construction costs), but that the other three categories may increase construction costs by
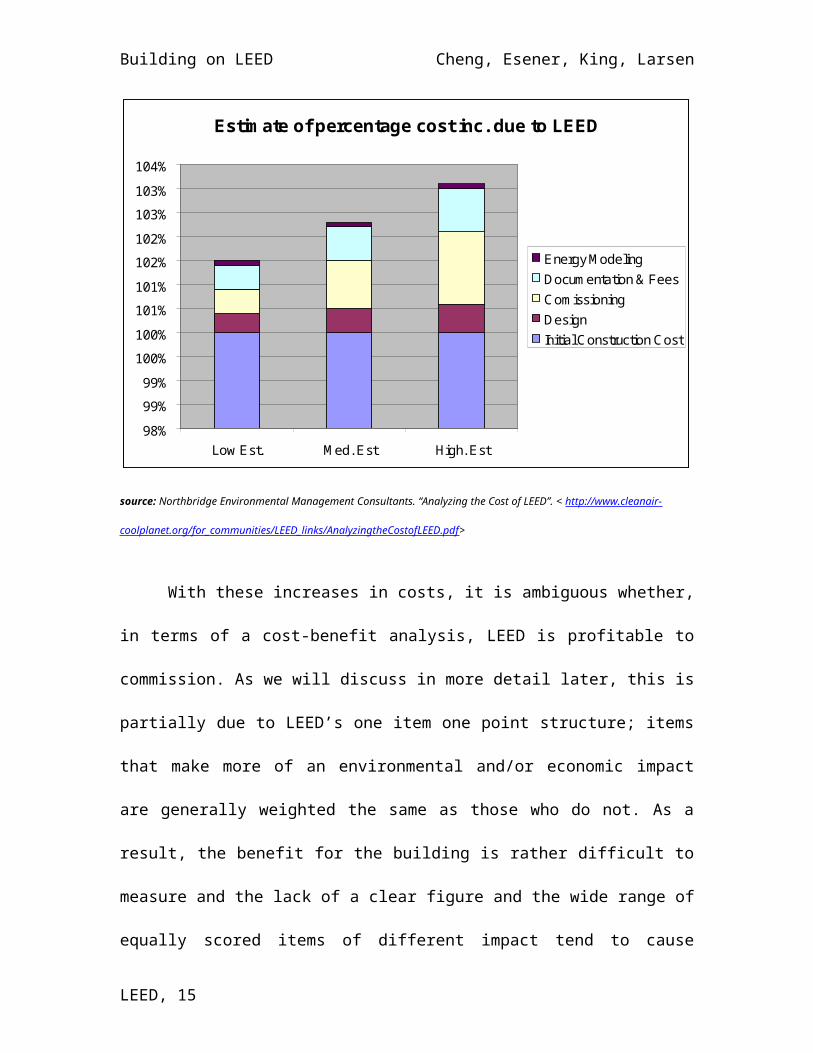
3-5%11. Below is a table explaining this in better detail:
11 Northbridge Environmental Management Consultants.
LEED, 9
Building on LEED Cheng, Esener, King, Larsen
Estimate of percentage cost inc. due to LEED
98%
99%
99%
100%
100%
101%
101%
102%
102%
103%
103%
104%
Low Est. Med. Est High. Est
Energy ModelingDocumentation & FeesComissioningDesignInitial Construction Cost
source: Northbridge Environmental Management Consultants. “Analyzing the Cost of LEED”. < http://www.cleanair-
coolplanet.org/for_communities/LEED_links/AnalyzingtheCostofLEED.pdf>
With these increases in costs, it is ambiguous whether, in terms of a cost-benefit
analysis, LEED is profitable to commission. As we will discuss in more detail later, this
is partially due to LEED’s one item one point structure; items that make more of an
environmental and/or economic impact are generally weighted the same as those who do
not. As a result, the benefit for the building is rather difficult to measure and the lack of a
clear figure and the wide range of equally scored items of different impact tend to cause
prospective commissioners to shy away from attempting to attain LEED certification. In
addition, there is always the issue of discount rates; some of LEED’s benefits, such as
reduced energy bills, accrue in the future. If consumers place too high of a discount rate
on the future, then LEED will not be profitable. Nevertheless, the existing premium for
LEED, 10
Building on LEED Cheng, Esener, King, Larsen
LEED buildings suggests that either this is not the case, or the reputational benefits are
enough to override the discount.
1.5 Need for Life Cycle Focus
The above sections discussed near-term costs and benefits of LEED. However, to
truly understand the costs and benefits of LEED, it is necessary that we understand to
understand its impact over an entire building life-cycle. This type of analysis is known as
the life-cycle approach (LCA) and looks at the benefits and costs of a LEED building
over its entire lifetime, discounted to reveal its true present value. Using LCA, it is
possible take into account the item’s production, maintenance and other costs.
Discounting it over its lifetime, meanwhile, will allow for better comparison of the item
with other alternative opportunities.12
1.6 Other barriers to LEED expansion/adoption
In addition to the above mentioned cost issues, there are also other barriers that
are not measured in direct financial costs For example, obtaining LEED certification
requires a great deal of time investment. One study concluded that, on average, it takes
300 days for a project to become fully certified. Another found that it took over 225
hours to complete the documentation process. Furthermore, administrative obstacles
depend highly on the level of expertise and can cost up to $70,000 per project. This is
quite a high opportunity cost as it causes the commissioner to forego possibly more
productive activities.13
12 Of course what the exact discount rate is, is often subject to debate. 3% is usually an assumed benchmark for the long term, with current economic and monetary trends determining more short-term rates.13 Northbridge Environmental Management Consultants. Pise, M. N (2006)Johnson, B.T. (2005)
LEED, 11
Building on LEED Cheng, Esener, King, Larsen
Another significant barrier is expertise. Unfortunately, given that LEED is only a
10 year old concept, a lack of knowledge regarding its codes and practices exists among
the community of architects, engineers and other contractors for buildings. While this
community often has a reasonable base of knowledge in specific LEED components,
there is a lack of cross-functional expertise and coordination14. Indeed, often a one size
fits-all approach is taken, which does not take into account locational, financial and
dimensional difference between different buildings. In some ways, this problem will be
difficult to rectify without more and better training for professionals involved in the
construction sector. Nevertheless, in terms of LEED implementation, changes can be
made to the current regulations in order to streamline the process. In particular, as
mentioned before, the one-item one-point system is not an effective measure of a
building’s environmental and energy efficiency and does not create the most efficient
incentives for obtaining certification. Furthermore, it bogs down the administrative
process. Instead of focusing on high-impact easy to certify components, the one point
system shifts the focus toward more tedious, less consistent items. These inconsistencies
compound the coordination issues and lower the incentives for learning and adopting the
necessary expertise.
1.7 Overview Summary
Overall, the LEED system has been shown to have several important benefits and has
expanded accordingly. However, the one item-one point system does not efficiently
allocate points. Moreover, direct costs and administrative barriers could be reduced to
facilitate even greater uptake of LEED certification.
14 Johnson, B.T. (2005)
LEED, 12
Building on LEED Cheng, Esener, King, Larsen
SECTION 2: POINT REALLOCATION
2.1 Overview
As discussed in section 1, LEED encourages a whole-building approach to
sustainability by awarding points in five key areas of human and environmental health.15
One of the central performance areas of LEED is energy efficiency, which is recognized
in the Energy and Atmosphere (EA) section of the LEED scorecard. However, there
have been critiques of the current LEED EA section16 that recommend LEED points need
to be allocated based on an overall environmental and economic impact instead of just an
energy savings. The objective of this section is to articulate critiques of the LEED point
system and suggest improvements that will include both economic and environmental
impacts.
2.2 EA: Credit 1 Allocation
According to the USGBC, LEED Rating Systems are developed through an open,
consensus-based process led by a group of qualified committees.17 The current rating
system for the EAc1 section for LEED-NC sets a minimum performance requirement,
based on the ASHRAE 90.1-2004 standard. This baseline is then compared to the
percent savings that is calculated using the ASHRAE 90.1-2004 appendix G. This
quantification system of point allocation based energy savings does provide an overall
metric for reducing energy consumption. However, one of the biggest critiques of the
LEED scorecard is that most items are worth one point18, even though some items have a
15 (Energy Star)16 (Tolley and Sabina, April 2009)17 (Energy Star)18 (Chris W. Scheuer , Gregory A. Keoleian)
LEED, 13
Building on LEED Cheng, Esener, King, Larsen
greater environmental/economic impact. 19. To illustrate this issue, the following section
will compare two energy savings strategies that incur the same energy efficiencies, but
have very different economic impact.
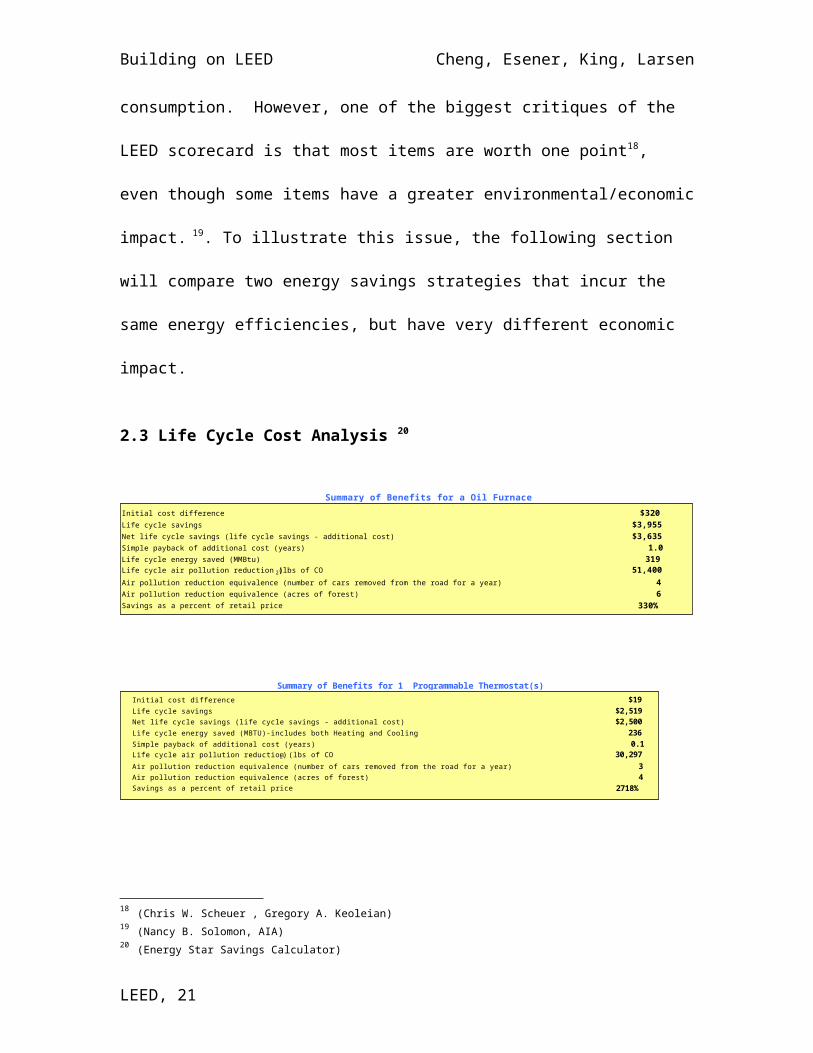
2.3 Life Cycle Cost Analysis 20
One potential modification of LEED would be to take into account the economic
impact of a given technology over its entire lifecycle. This type of analysis is called Life
Cycle Cost analysis, or LCC. For example, according to Energy Star data, both an
Energy Star programmable thermostat and an oil furnace are predicted to be
approximately 18 percent more efficient than conventional appliances.21 However, these
two technologies should not be assumed to be equal; when their Life Cycle Costs (LCC)
19 (Nancy B. Solomon, AIA)20 (Energy Star Savings Calculator)21 (Energy Star Calculator) The 18% was calculated by finding the percent reduction in BTU’s of both technologies. These numbers are presented on the energy star calculation spreadsheet.
LEED, 14
Initial cost difference $320Life cycle savings $3,955Net life cycle savings (life cycle savings - additional cost) $3,635Simple payback of additional cost (years) 1.0Life cycle energy saved (MMBtu) 319Life cycle air pollution reduction (lbs of CO2) 51,400Air pollution reduction equivalence (number of cars removed from the road for a year) 4Air pollution reduction equivalence (acres of forest) 6Savings as a percent of retail price 330%
Summary of Benefits for a Oil Furnace
Initial cost difference $19Life cycle savings $2,519Net life cycle savings (life cycle savings - additional cost) $2,500Life cycle energy saved (MBTU)-includes both Heating and Cooling 236Simple payback of additional cost (years) 0.1Life cycle air pollution reduction (lbs of CO2) 30,297Air pollution reduction equivalence (number of cars removed from the road for a year) 3Air pollution reduction equivalence (acres of forest) 4Savings as a percent of retail price 2718%
Summary of Benefits for 1 Programmable Thermostat(s)
Building on LEED Cheng, Esener, King, Larsen
are compared side by side, there is a significant difference between their economic
impacts.
For example, the Energy Star graphs above calculate the Life Cycle Cost of an
efficient furnace by first, taking the cost difference between an Energy Star furnace and a
conventional furnace. Then, this difference of $320 is discounted by the rate of 4% over a
17-year life span. The final calculation for the Energy Star furnace is a 330%, dollar
savings over the life of the furnace compared to the retail price. On the other hand, with
the thermostat, Energy Star assumed a cost difference of $19 between a conventional
thermostat and an Energy Star thermostat, discounted by the rate of 4% over a 17-year
life span. Ultimately, the Energy Star thermostat, with the same 18% energy savings s
the furnace, results in a 2718% dollar savings in relation to the retail price. Clearly, these
technologies should be provided with different point allocations. However, LEED does
not address economic impacts, only energy savings. For LEED to take a more holistic
approach the USGBC committees need to weight technologies according to the economic
impact they produce. Additionally, a more holistic point structure would not only include
the economic impacts but also incorporate energy costs consumed during the life of a
technology.
2.4 Benefits of Point allocation based on Life Cycle Analysis
A second critique of the LEED EA point system is that the cost savings formula does not
account for the real energy costs of a given technology; it fails to incorporate the energy
costs of production, transportation, and other steps in the supply chain. The
quantification method for this is called Life Cycle Analysis (LCA). According to
Boustead Consulting, the concept of LCA originated in the 1960’s when architects
LEED, 15
Building on LEED Cheng, Esener, King, Larsen
realized the importance of examining the performance of industrial systems through their
entire life cycle, not just during operation.22 The analysis of a building’s energy life cycle
begins with calculating the energy needed to extract raw materials from the earth, energy
needed to transport the materials, energy needed for operation, and finally the energy
needed to dispose of the materials. This has also been referred to as “cradle to grave”
analysis.23 LCA is becoming nationally and internationally more recognized as a best
practice model for understanding the total environmental impact of building construction.
The Environmental Protection Agency (EPA), along with other international
leaders in energy reduction, has recently placed heavy emphasis on refining and requiring
a decision-making tool based on LCA.24 The reason for this emphasis is that an
implemented building technology, with the intention to reduce energy consumption,
could potentially consume more energy through its entire life cycle then it will reduce
during its operational life. If an analyst is well trained and using up to date software,
LCA is a very reliable method for architects and builders to identify and manage the total
environmental impact of implementing energy technologies, and is thus a good way to
assign LEED points in the EAc1 section.
LCA aligns well with sustainability because it addresses one of the main goals of
LEED; reduce a building’s total environmental impact. It also would serve a key role in
increasing awareness of the true impacts of different technologies. If the LEED EA point
system was made more equitable by using output from interpretation of LCA data, the
point system will encourage engineers to gain knowledge about what designs are worth
22 http://www.boustead-consulting.co.uk/introduc.htm23 (Barbara Nebel)24 (Kenneth R. Stone)
LEED, 16
Building on LEED Cheng, Esener, King, Larsen
replicating in the long run based how much economic and environmental life cycle
impact they will have during their life, not just while they are in operation. Since
engineers’ recommendations are incorporated into all phases of a building’s lifecycle, not
just the design, this knowledge would have significant impact.25 Another benefit of LCA
is it isolates the technologies that will have the highest Energy Return on Energy Invested
(EROEI). EROEI is the ratio of the amount of usable energy gained from a technology
compared to the amount of energy expended to obtain that technology. To increase its
impact and continue its leadership in the green community, LEED should weight points
based on LCA analysis, incorporating the life cycle energy consumption of new
technologies into their point structure.
2.4 Methods of Calculating LCA
There are many high quality Life Cycle Analysis software applications. However,
‘GABI 4’ is one of the most used and recognized applications.26 Other tools include:
Tool for the Reduction and Assessment of Chemical and Other Environmental Impacts
(TRACI), developed by EPA27 and Building for Economic and Environmental
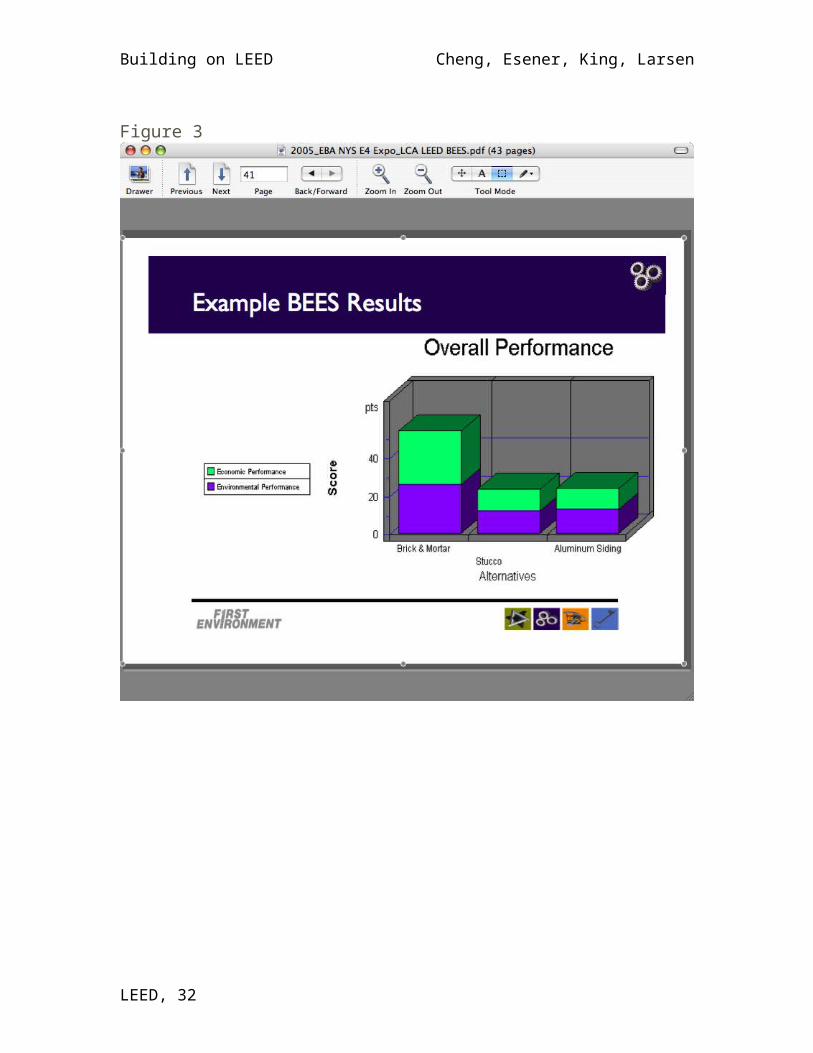
Sustainability (BEES) developed by the U.S. federal government.28 All of these
computer applications are able to calculate many different environmental and economic
outcomes from the entire life cycle of the materials used in green buildings (see figures
1,2,&3). The software’s data base includes most common building technologies,
however if the data you need is not in the data base it can be entered in the form of an
excel spreadsheet. Currently the biggest drawback of LCA is a lack of databases for the
25 (Scot W. Horst1, Wayne B. Trusty, MA2)26 (Michael Ivanovich)27 (S. Shyam Sunder, Barbara C. Lippiatt and Jennifer F. Helgeson )28 (Barbara lippiatt / NIST)
LEED, 17
Building on LEED Cheng, Esener, King, Larsen
most cutting edge technologies, in addition to the required training necessary for
professionals to interpret the findings and apply them appropriately. Proponents of LEED
should work to advocate for investment in the development of these databases; greater
amounts of knowledge incorporated into LCA analysis will eventually translate into
greater environmental gains from LEED certification.
2.5 Case Study: LCA costs for a Solar Panel
As mentioned in previous section, the current LEED point system only includes
the energy savings during the operation of the technology, not during the entire life cycle.
According to a resident case study, a Photovoltaic (PV) Solar Panel of 2.5 Kw is
estimated to yield a 10% annual energy savings for a house of approximately 2500 square
feet.29 However, this energy savings does not take into account potential energy used or
saved during manufacturing and transportation, as compared to alternative sources of
energy. An example of an LCA GABI software quantification of energy used, based on
national averages, for the Balance of system (BOS)30 of PV solar panel is shown in Fig. 1.
From the chart we see that a total of 542 MJ/mw of energy are used during the Life Cycle
of the BOS of a PV. For LEED to take the next steps for implementing a holistic point
system the energy needed to create, transport and disposal of the materials should be
subtracted from the predicted energy performance used in calculating the original savings
analysis.
2.6 Costs of implementing a more sophisticated point system
29 (Energy Efficiency Contractor)
30 (Vasilis M. Fthenakis and Hyung-Chul Kim)
LEED, 18
Building on LEED Cheng, Esener, King, Larsen
Although LCA would contribute significantly to the efficiency of the LEED point
allocation, it comes with its on set of costs. One of these costs is complexity. A more
sophisticated LEED point system yields a more accurate environmental impact, but it
may not be easily understood by architects and homeowners. Moreover, there will be
costs involved in building the required knowledge base. As mentioned above, the biggest
drawback of LCA is a lack of databases for the most cutting-edge technologies. In
addition, it will be necessary to invest in training to enable professionals to interpret the
findings and apply them appropriately. However, if USGBC committees are able to
conduct a complete Economic and Environmental impact analysis and equate the LEED
point system to these quantifications, USGBC will move much closer to a fully
sustainable green building approach. Ultimately, the benefits of this approach should
extend far beyond the initial cost.
2.7 Recommendation Summary
USGBC is continually working toward improving their point system to reflect
relevant environmental impacts. However, the LEED points in the EA section lack net
energy reductions and fail to incorporate economic impacts that accrue over the
technology life cycle. The next step is for USGBC to create benchmarks based on LCC
and LCA that can be applied as a new point LEED structure.
LEED, 19
Building on LEED Cheng, Esener, King, Larsen
LEED, 20
QuickTime™ and aTIFF (Uncompressed) decompressor
are needed to see this picture.
Building on LEED Cheng, Esener, King, Larsen
Figure 3
LEED, 21
Building on LEED Cheng, Esener, King, Larsen
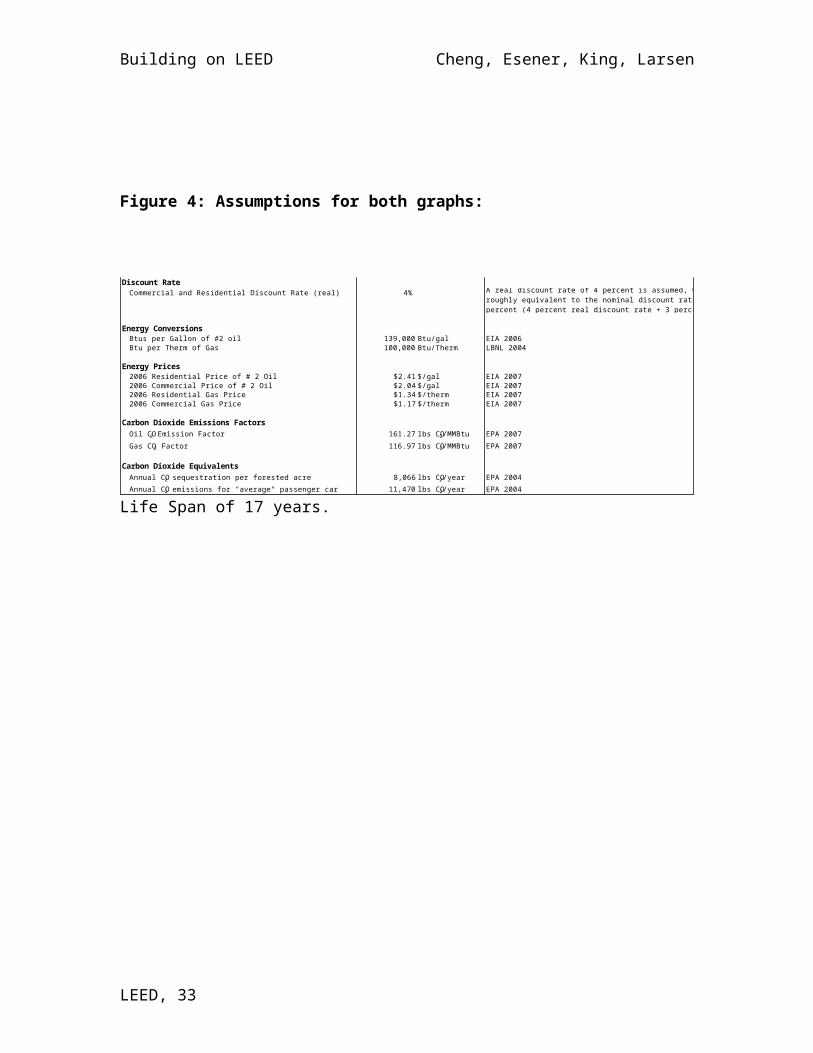
Figure 4: Assumptions for both graphs:
Life Span of 17 years.
LEED, 22
Discount RateCommercial and Residential Discount Rate (real) 4% A real discount rate of 4 percent is assumed, which is
roughly equivalent to the nominal discount rate of 7 percent (4 percent real discount rate + 3 percent inflation
Energy ConversionsBtus per Gallon of #2 oil 139,000 Btu/gal EIA 2006Btu per Therm of Gas 100,000 Btu/Therm LBNL 2004
Energy Prices2006 Residential Price of # 2 Oil $2.41 $/gal EIA 20072006 Commercial Price of # 2 Oil $2.04 $/gal EIA 20072006 Residential Gas Price $1.34 $/therm EIA 20072006 Commercial Gas Price $1.17 $/therm EIA 2007
Carbon Dioxide Emissions FactorsOil CO2 Emission Factor 161.27 lbs CO2/MMBtu EPA 2007Gas CO2 Factor 116.97 lbs CO2/MMBtu EPA 2007
Carbon Dioxide EquivalentsAnnual CO2 sequestration per forested acre 8,066 lbs CO2/year EPA 2004Annual CO2 emissions for "average" passenger car 11,470 lbs CO2/year EPA 2004
Building on LEED Cheng, Esener, King, Larsen
SECTION 3: LEED AND LABORATORY BUILDINGS; QUANTIFYING THE
IMPACTS OF LAB OPERATIONS ON BUILDING ENERGY PERFORMANCE
3.1 Background: Energy Performance of LEED Buildings
As discussed throughout this paper, a central goal of the LEED system is to
achieve energy savings. However, optimal energy savings are not achieved by merely
installing an energy-efficient technology. In the life-cycle energy consumption of a
building, the operation of the building occupies a dominant portion.31 As a result, the
success of LEED ultimately relies on the energy performance of the building after LEED
certification. While LEED certification is based on a point scheme, the effectiveness of
LEED as a system should not be judged by the amount of points achieved, but by the
actual energy performance of LEED buildings in comparison to average buildings of the
same type. Indeed, at first glance, LEED performs quite well. In 2008, the first
comprehensive post-occupancy assessment of LEED-certified buildings was published;32
this study, together with an earlier, smaller-scale similar study, has provided the first
evidence of LEED building performance.33 They show that LEED buildings of median
energy usage—offices, schools, libraries, etc.—are 25% more energy efficient than non-
LEED buildings of the same types. These studies also show that, on average, the actual
energy performances of LEED buildings are highly correlated with their design
projections. In Fig. 1, the energy usage intensities of LEED buildings from Diamond et al
31 Scheuer et al, 200332 Turner and Frankel, 200833 Diamond et al, 2006
LEED, 23
Building on LEED Cheng, Esener, King, Larsen
(2006) and Tuner and Frankel (2008) are shown; for median energy usage buildings,
good correlations are shown between design projections and actual measurements.
Nevertheless, despite the success of LEED with median energy usage buildings,
these studies also reveal significant discrepancies between design and actual
performances in high energy usage buildings, predominantly scientific laboratories. The
actual energy consumptions of these buildings generally exceed design projections.
Furthermore, their performances show significant inconsistency. In Fig. 1, the energy
performance data of laboratory buildings from Diamond et al (2006) and Tuner and
Frankel (2008) are also shown. Ultimately, its clear that the understanding in this area is
lacking.
3.2 Current Knowledge in Laboratory Building Energy Performance
The causes of the ‘poor’ performances in laboratory buildings are presently not
fully understood. In presenting their data, Tuner and Frankel (2008) observe that “the
characteristics [of laboratory buildings] are not well understood by the design
community,” and this understanding “has significant implications on [building] life-cycle
cost analysis.” They conclude rightly that “there is a need for significant additional
research into the performance characteristics of [laboratory] buildings”
This need is made even more significant when the high quantities of energy
consumption of laboratories are considered. An extensive study of laboratory energy
consumptions, covering 4 million sq. ft. of laboratory spaces on five campuses of the
University of California system, indicates that laboratories on average use 5 times more
LEED, 24
Building on LEED Cheng, Esener, King, Larsen
electricity and 5 times more fuel than non-laboratory spaces.34 The majority of recent
literature concurs with this estimation; in particular, the design guide by National
Institute of Building Sciences estimates that laboratory buildings consume 4 to 8 times
more energy than non-laboratory buildings.
This need to increase understanding of lab building performance is also made
urgent by the present boom in green laboratory constructions. Driven by increased
consciousness to energy conservation and legislative mandates, and coinciding with
intensified investments in research facilities by research universities, the number of new
construction (NC) LEED laboratories has significantly increased in the last few years.
3.3 Current Status of LEED for Laboratory Buildings
As discussed in Section 2, LEED evaluates the energy performance of a building
quantitatively. The method sets a minimum performance requirement, or baseline, based
on the energy use intensity (EUI) of the ASHRAE 90.1-2004 standard for the energy-
efficient design of buildings. Then, the provision in ASHRAE 90.1-2004 Appendix G is
used to demonstrate a percentage improvement over the baseline performance for LEED-
NC, Energy and Atmosphere Credit 1, optimize energy performance (EAc1). This
process is used in both projecting building performance during design and in evaluating
actual performance after construction. During design, EAc1 credits are awarded based on
the percentage of energy savings calculated from a required computer simulation.35
34 Mills et al, 199635 The simulation is an hour-by-hour whole building energy analysis using approved software.
LEED, 25
Building on LEED Cheng, Esener, King, Larsen
Given the differences in energy usage, it was recognized that the LEED scheme
for non-laboratory buildings is not suitable for laboratories. In 2005, a task force was
charged to create a LEED system specifically for laboratory buildings, called LEED
Application Guide for Laboratories (LEED-AGL). Nevertheless, progress has been
limited. As of May 2008, these guidelines are yet to be released for implementation.
Presently, practitioners rely on Laboratory for the Twenty-First Century (Labs21), an
alternative energy performance benchmark scheme developed by the EPA, for laboratory
design (US EPA, 2000). However, there is no official relationship between LEED and
Labs21; these can lead to coordination issues and sub-optimal evaluation.
3.3 Objective of Study: Connecting Operations and Whole-Building Consumption
To help understand the energy performance of laboratory buildings, we examine
the critical, but so far unexamined, connection between laboratory operations and energy
consumption at the whole-building level. Specifically, we ask the question: To what
extent do variations in laboratory operations (in the form of instrument plug loads)
account for, and therefore potentially explain, the observed variations in laboratory
building energy usage? Ultimately, answering this question will help to quantify the
contribution of laboratory operations to whole-building energy usage. It will help the
design community develop appropriate design strategies and measurement
methodologies, while also facilitating the ongoing development of LEED-AGL. Finally,
it will be critical in helping researchers, technicians, and laboratory building managers to
identify energy saving opportunities and adapt energy efficient work practices.
LEED, 26
Building on LEED Cheng, Esener, King, Larsen
3.4 Methods & Data Analysis; Composition and Characteristics of Laboratory
Energy Loads
In order to evaluate LEED performance in lab buildings, it is first necessary to
understand the energy usage, or “energy load” of this type of building. The energy load
of a laboratory building is composed of the building HVAC system, cooling, heating,
space lighting, and instrument plug and process loads. Compared to non-laboratory
commercial buildings, the HVAC load is significantly larger due to health and safety
regulations, and the plug-in and process loads are also significantly larger because of
large power requirements of experimental research equipments. Equally importantly,
laboratory operations do not follow regular schedules like those in offices and homes;
they are instead determined by the need of specific experiments being conducted. As a
result, compared to non-laboratory commercial buildings, energy consumption of
laboratory buildings are often both highly irregular and highly intense.
3.5 Methods & Data Analysis: “Bottom-Up” Approach for Evaluating Laboratory
Energy Usage
Given that buildings are integrated systems, building energy consumptions should
be evaluated at the whole-building level. However, to understand the underlying causes
of energy consumptions, one must begin by looking at individual plug sources, and how
they interact with the building system level. Therefore, a bottom-up model of energy
usage is needed.
LEED, 27
Building on LEED Cheng, Esener, King, Larsen
For this evaluation, we adopt the bottom-up approach of Tanimoto et al (2008). In
this approach, bottom-level detailed data on occupant activities, appliances usages and
their electric power ratings, and schedule of usage are collected or estimated. These data
are then used as inputs to a model which calculates the overall energy usage at the whole
building level. This approach is validated in that the modeled energy consumptions are in
good agreement with actual metered values.
3.6 Methods & Data Analysis: Data Collection
Data on laboratory instrument types and their electrical power ratings in operation
and stand-by modes was collected from several chemistry, condensed-matter physics, and
molecular biology research laboratories at Gordon Center in May 2008. Information of
laboratory spaces and working schedules was also collected from Gordon Center.
Additional instrument information was obtained from manufacture specification sheets.
3.7 Methods & Data Analysis: Model of an “Average” Laboratory
In order to create the model of a broadly representative, sufficiently complex and
energy dependent laboratory, we have chosen to “average” a more energy intensive
surface physics laboratory and a less energy intensive analytical chemistry laboratory.
The main instruments in the surface physics laboratory are the ultra-high vacuum
chamber (UHV) system with associated molecular beam deposition devices. The main
instruments in the analytical chemistry laboratory are the spectrometers and
chromatographers. The “average” laboratory is created by taking the means instrument
LEED, 28
Building on LEED Cheng, Esener, King, Larsen
loads of the two laboratories; common instruments, such as ultrasonic cleaner, are then
added into the equation..
The instrument details and their loads at the high and low usage conditions are
shown in Table 3.2. The EUI of the average laboratory under high and low usage
conditions are calculated by dividing the loads by the floor area of the laboratory, of
1,000 sq. ft.; these values are 38.4 and 13.1 kWh/sf (per year), respectively.
3.8 Methods & Data Analysis: Energy Analysis
We must now evaluate how the instrument plug loads summed up from Table 3.1 interact
with the building HVAC. In order to calculate this interaction, we rely on the energy
analysis presented for a typical Labs21 laboratory.36 Regardless of the climate zone of a
building, laboratory plug and process loads add to building HVAC loads. To evaluate
building system loads, we use data extracted from this Labs21 model to create a plug
intensity vs. building system intensity plot (Fig. 3.2); a linear fit to this plot gives the
equation y = 0.18x + 26.1, where x is the plug intensity and y is the system intensity.37
This equation provides the dependence of system intensity on the plug intensity, in
kWh/sf (per year). We use this relation to calculate the system EUI corresponding to the
high and low instrument plug intensities for the modeled average laboratory.
Subsequently, a range for the total EUI (instrument plus building system) is obtained
between the high and low usage periods; this range is 55.6 kWh/sf, or 190 kBtu/sf. The
range in this value represents the intrinsic uncertainty in total laboratory EUI due to
36 Enermodal Engineering and NREL, 200337 Enermodal Engineering and NREL, 2003
LEED, 29
Building on LEED Cheng, Esener, King, Larsen
variations in laboratory operations intensities; it is inherent to the nature of the usual
practice of scientific research. This range is graphically imposed in dash lines in the
design-vs.-measurement intensity plot in Fig. 3.1.
3.9 Discussion: Implications in Energy Design Strategies and Performance
Interpretation
This study confirms and quantifies the inherent nature of irregular energy usage in
laboratory research operations. Its finding should have significant implications in
laboratory energy performance in both the design and the evaluation phases. For the
design phase, the characteristic size of the EUI variation, of 190 kBtu/sf as determined for
our model, implies that the traditional ‘right sizing’ approach to energy savings
commonly used for office and apartment buildings is inadequate for laboratory design.
Instead, emphasis must be placed on implementing variable building system capabilities
that are capable of adjusting to the irregular nature of research operations intensities.
On the other hand, for building energy performance evaluation, evaluators must
recognize that the apparent discrepancies between measured EUI and design-projected
EUI might be due to irregularities in laboratory operations intensities and should not
necessarily be attributed to design failure. It is important to note that, in Fig. 3.1, if the
empirical uncertainty from the non-laboratory building data (where statistics are
sufficient) is added to the operations-induced uncertainties (y = ±95), most of the
laboratory data points would indeed fall within this uncertainty from the y = x line.
LEED, 30
Building on LEED Cheng, Esener, King, Larsen
In addition to instrument loads, variations in other laboratory end-use loads not
considered in this analysis may also contribute, although usually to a less extent, to
changes in whole-building EUI; these include lighting schedule, occupancy, and the habit
of operating the laboratory fume hood (discussed in further detail below). Ultimately,
any evaluation mechanism must be able to adjust to variations in instrument usage.
3.10 Discussion: Savings-Weighted LEED Point Allocation; A Case Study of the
Fume Hood
The present study also has implications in rational LEED point allocation. To encourage
variable building system measures that can adjust to frequent irregular activity demands,
LEED points should be awarded to implementing adjustable HVAC savings measures.
To illustrate this point, we use the example of the fume hood, a dominant HVAC
component that directly interfaces with laboratory spaces and activities. On average, a
fume hood consumes over 450 MBtu of energy (2.5 times that of a home) and has an
annual operations cost of over $5,000.38 Already, high-performance fume hood has been
identified as an item for LEED point allocation. However, present LEED schemes fall
short of correlating point quantities to the amounts of energy saved by a measure, an area
in which improvement has been exhibited.39
In general, fume hood energy savings are achieved by reducing air flow volume during
inactive periods, which statistically account for most of the hours of a day. Two EPA
Labs21-recommended measures serve this purpose—(1) closing down hood sash window
38 Mills et al 199639 Tolley and Shaikh, 2008
LEED, 31
Building on LEED Cheng, Esener, King, Larsen
with an automatic sash controller (ASC), and (2) reducing hood fan power with a variable
air volume (VAV) system. Fig. 3.3a and 3.3b show fume hood energy usages as a
function of sash opening height at constant fan powers, and energy usages as a function
of fan power at constant sash heights. These calculations are done using a model
developed by Lawrence Berkeley National Laboratory and are for the climate of
Chicago.40 Based on Fig. 3.3a and 3.3b, energy savings from reducing sash height from 6
inch to 0.25 inch using ASC and from reducing fan power from 1.8 W/cfm to 0.8 W/cfm
using VAV are calculated and shown in Table 2. Also shown is a comparative life-cycle
economic cost-benefits analysis for ASC and VAV.
As a further demonstration of this principle, Table 2 also illustrates saving-weighted
LEED point allocations proportional to the size of benefits. These point allocations are
done at three, increasingly broad economic levels—(1) based on energy savings only, (2)
based on net cost benefits, and (3) based on net cost benefits plus the benefits of
reductions in carbon emission. In this particular example, if we were calculating LEED
points based on energy savings alone, reducing the sash height alone would be worth 1
point, while reducing the fan power would be worth .4 points. However, if we took into
account net cost benefits and the reductions in carbon emissions, reduction in fan power
would only be worth 1/10 of the 1 point that should be awarded to reducing the sash
height. Hence, this savings-weighted point allocation method inherently spells out the
relative efficiencies among the eligible measures. It serves to steer consumers toward the
best measure and still retains a reasonable simplicity for practical implementation.
40 Mills and Sartor, 2006
LEED, 32
Building on LEED Cheng, Esener, King, Larsen
In summary, using instrument power and laboratory operations data, we have shown that
variations in laboratory operations induce an uncertainty in whole-building energy usage
intensity that is of the order of 200 kBtu/sf. This finding implies the importance of
employing variable system measures for energy savings. The principle of savings-
weighted LEED point allocations for variable savings measures has also been
demonstrated with the case of fume hood.
CONCLUSION
The LEED standard has accomplished a great deal; despite the oft-heard criticisms the
pioneers of LEED should be commended for their efforts to develop a standardized
evaluation mechanism for green buildings. Undoubtedly, these efforts have led to
dramatic reduction in energy usage and emissions within certified buildings.
Nevertheless, as LEED evolves from a general benchmark into a more widespread
mandate, two critical changes should be made: 1) the point system should take into
account relative energy savings across the entire life cycle of a given technology and 2) a
modified LEED evaluation system should be developed for energy-intensive/lab
buildings; this system should be developed using savings weighted point allocations that
award points for variable savings measures. One issue not directly addressed in our
paper, but that still needs a great deal of consideration, is quantifying and weighting
LEED points based on green house gas emission from both building materials and new
technologies. Ultimately, if these recommendations are adopted, LEED certification will
allow commissioners around the world to more efficiently build toward a better future.
LEED, 33
Building on LEED Cheng, Esener, King, Larsen
ACKNOWLEDGEMENT
We thank C. Turner of the New Buildings Institute for providing data referenced in
Turner and Frankel (2008).
SECTION 1 REFERENCES
Section 1 References
CoStar (2007). “Commercial Real Estate and the Environment”. <http://www.costar.com/partners/costar-green-study.pdf >
Johnson, B.T. (2005). “Barriers to Certification for LEED Registered Project. <http://www.ibe.colostate.edu/projects/theses/johnson_thesis.pdf
(2007) “Green Buildings, LEED certification proves cost-effective, ready to expand”. <http://sbt.siemens.com/customerlounge/whatsnew/press.249.asp>
(2007) “LEED Certification for Buildings”. <http://www.epa.gov/perftrac/members/Summary_LEEDs.htm>
(2007) “LEED Certification Program Leads to Potential Benefits”. <http://www.nuwireinvestor.com/articles/leed-program-leads-to-potential-profits-51367.aspx>
(2008) “LEED for Homes Rating System”. <http://www.usgbc.org/ShowFile.aspx?DocumentID=3638>
(2005) “LEED for New Construction and Major Renovation.” <http://www.usgbc.org/ShowFile.aspx?DocumentID=1095>
McMahon, J.E. “Chapter 9”. The First state of the Carbon Cycle Report http://www.climatescience.gov/Library/sap/sap2-2/final-report/sap2-2-final-chapter9.pdf
National Academy of Sciences. 2008. “What you need to know about Energy”.
Northbridge Environmental Management Consultants. 2003. “Analyzing the Cost of LEED”. < http://www.cleanair-coolplanet.org/for_communities/LEED_links/AnalyzingtheCostofLEED.pdf>
LEED, 34
Building on LEED Cheng, Esener, King, Larsen
Pise, M. N. 2006. “LEED Documentation Process: Implementation Barriers for School Projects”. <http://www.chple.arch.vt.edu/CHPLE%20Research%20files/ETD_Madhulika.pdf>
Turner, C. and Frankel, M. “Energy performance of LEED for new construction buildings”. New Buildings Institute Report (2008).
SECTION 2 REFERENCES
Dudley, Chris. Real Energy “How does renewable energy change the way we do things?”.(2008).http://mdsolar.blogspot.com/2008/01/eroie.html
Energy Efficiency Contractor. Residential Case Study. (2003)http://www.evnut.com/solar.htm
Energy Star. Saving Calculators. (2007).http://www.energystar.gov/index.cfm?c=furnaces.pr_furnace
EPA. System Analyst Reseach. (2007).http://www.epa.gov/nrmrl/std/sab/traci/
First Environment. “Life Cycle Assessment Case Study:BEES Software”.http://www.firstenvironment.com/html/lca_and_bees.html
Fthenakis .Vasilis M. and Hyung-Chul Kim. PV EH&S Research CenterBrookhaven National Laboratory. “Life Cycle Analysis of Photovoltaic Systems”.
Horst1, Scot W. and Wayne B. Trusty, MA2. “Integrating LCA Tools in LEED: First Steps”.
Ivanovich, Micheal. Engineering Innovation. (2007).
Lippiatt, Barbara. NIST. Office of Applied Economics. (2007)www.bfrl.nist.gov/oae/software/bees.html
Nebel, Barbara. White Paper – “Life Cycle Assessment And The Building And Construction industry”. (2006).
Scheuer , Chris W. and Gregory A. Keoleian. “Evaluation of LEED Using Life Cycle Assessment Methods”. (2002).
Solomon, Nancy B. AIA. Green Sources Magizine. McGraw Hill construction (2008) http://archrecord.construction.com/features/green/archives/0506edit-3.asp
LEED, 35
Building on LEED Cheng, Esener, King, Larsen
Stone, Kenneth R. What EPA Means When it Says, "Life Cycle Assessment". (2007)
Sunder, S. Shyam, Barbara C. Lippiatt and Jennifer F. Helgeson “NIST Metrics and Tools for Tall and Green Buildings”. (2008).
The Free Dictionary. Definition of EROEI. (2008).http://encyclopedia.thefreedictionary.com/Energy+returned+on+energy+invested
Tolley, G.S. and S.L. Shaikh. The greening of buildings. “RFF Weekly Policy” Commentary. (2008).
U.S Department of Energy. Building Energy Software Tools. Directory. (2008)
U.S Department of Housing and Urban development BD&C LCA .White paper, “Final Report Assessing Their Applicability to the Home Building Industry Life Cycle Assessment Tools to Measure Environmental Impacts”.
Working Group B (LCA Methodology); Interim Report #1. “ Integrating LCA into LEED”. (November 2006).
SECTION 3 REFERENCES
Diamond, R., M. Optiz, T. Hicks, B. Von Neida, and S. Herrera, Evaluating the energy performance of first-generation LEED-certified commercial buildings. Proceedings of ACEEE Summer Study of Energy Efficiency in Buildings (2006).
Enermodal Engineering and National Renewable Energy Laboratory, Laboratories for the 21st Century: Energy Analysis. Department of Energy Report DOE/GO-102003-1694 (2003).
Mills, E., G. Bell, D. Sartor, A. Chan, D. Avery, M. Siminovitch, S. Greenberg, G. Marton, A. de Almeida, and L.E. Lock, Energy efficiency in California laboratory-type facilities. Lawrence Berkeley National Laboratory Report LBNL-39061 (1996).
Mills, E. and D. Sartor, Energy use and savings potential for laboratory fume hoods. Lawrence Berkeley National Laboratory Report LBNL-55400 (2006).
Sartor, D. and M.A. Piette, W. Tschudi, and S. Fok, Strategies for energy benchmarking in cleanrooms and laboratory-type facilities. Proceedings of ACEEE Summer Study on Energy Efficiency in Buildings (2000).
LEED, 36
Building on LEED Cheng, Esener, King, Larsen
Scheuer, C., G.A. Keoleian, and P. Reppe. Life cycle energy and environmental performance of a university building: Modeling challenges and design implications. Energy and Buildings 35, 1049 (2003).
Tanimoto, J., A. Hagishima, and H. Sagara, Validation of methodology for utility demand prediction considering actual variations in inhabitant behavior schedules. Journal of Building Performance Simulation 1, 31 (2008).
Tolley, G.S. and S.L. Shaikh. The greening of buildings. RFF Weekly Policy Commentary. April 14, 2008.
Turner, C/ and M. Frankel, Energy performance of LEED for new construction buildings. New Buildings Institute Report. Also sourced in personal communications (2008).
U.S. EPA Federal Energy Management Program, Laboratories for the 21st century: An introduction to Low-energy design (2000).
LEED, 37
Building on LEED Cheng, Esener, King, Larsen
TABLE 1. Laboratory instruments and their powers and loads during high and low usage conditions.
Devices Power Maximum
(Resting) (W)
Low Usage Load
(kWh/yr)
High Usage Load
(kWh/yr)General Instruments
Refrigerator (40) 350 350Freezer 1,000 320 320
Oven 1,400 525 525Balance 240 10 85
Stirrer 1,300 100 1,000Ultrasonic cleaner 150 40 85
Computers (4) 280 60 300Hood lighting 160 0 450
Glove box-Lighting 80 0 220Glove box-Freezers (2) 2,000 640 640
Glove box-Pumps (3) 900 250 3,150Total 2,295 7,125
Ultra-High Vacuum FacilityMechanical pump 300 250 1,050
Diffusion pump 9,000 5,700 20,000Turbo molecular pump 20,000 12,000 24,000
Chiller 2,600 0 1,350Heater (for baking) (6) 300 0 2,400
Effusion cell 600 75 290Sample manipulator 2,000 240 960
Gas injector 1,000 120 480Evaporation source bias 30 4 15
Evaporation filament 1,000 120 480Lighting (3) 180 20 85
Voltmeter 24 0 11Total 18,529 51,121
Analytical Chemistry FacilityHPLC-Temperature controller 960 0 850
HPLC-Pump 220 95 1,050HPLC-Chromatographer 180 77 155
HPLC-Degasser 35 0 30Mass spectrometer 16,000 3,850 13,800Bio-safety cabinet 1,600 1,300 1,300
Centrifuge 1,500 0 1,300Total 5,322 18,485
LEED, 38
Building on LEED Cheng, Esener, King, Larsen
TABLE 2. Comparisons of automatic sash controller (ASC) and variable air volume system (VAV) as two energy savings measures for a fume hood. All savings values are calculated with respect to operations parameters of sash height and fan power, (H, P) = (6in, 1.8 W/cfm), 24/7 and per annum.
Energy Savings Measures Reducing Sash Height (H)
Reducing Fan Power (P)
Both
Required Devices; Cost Automatic Sash Controller;
$1,500
Variable Air Volume
System; $1,000
ASC and VAV; $2,500
Operations Parameters (H, P) (0.25in, 1.8W/cfm)
(6in, 0.8W/cfm) (0.25in, 0.8W/cfm)
Energy Savings 5,765 kBtu 2,263 kBtu 5,860 kBtu
LEED Points Based on Energy Savings
1 0.4 1
Energy Cost Savings $1,034 $189 $1,042
Present Value of Life-Time Energy Cost Savings (Life, 15 years; Discount Rate, 5%)
$10,065 $1,839 $10,139
Net Benefits $8,565 $839 $7,639
LEED Points Based on Net Benefits
1 0.1 0.9
Fuel Savings 72 MBtu 0 72 MBtu
Carbon Emissions Due to Fuel 3,420 lb 0 3,420 lb
Carbon Cost Savings (CCX rate) $36 0 $36
Present Value of Life-Time Carbon Cost Savings (15 years; 5%)
$350 0 $350
Net Benefits Plus Carbon Cost Savings
$8,915 $839 $7,989
LEED Points Based on Net Benefits Plus Carbon Cost Savings
1 0.1 0.9
LEED, 39
Building on LEED Cheng, Esener, King, Larsen
Figure1. Correlation plots between design and actual energy usage intensities for non-
laboratory buildings (blue) and laboratory buildings (red). The dash lines indicate the
upper and lower limits of a variation of 190 kBtu/sf in laboratory energy intensity due to
variations in laboratory activities (see text). Raw data are from Diamond et al (2006) and
Turner and Frankel (2008).
LEED, 40
Building on LEED Cheng, Esener, King, Larsen
Figure 2. Building system EUI caused by laboratory plug and process EUI, based on a
laboratory model in Enermodal Engineering and NREL (2003).
Figure 3a. Dependences of fume hood energy usage on fan powers at constant sash
heights.
LEED, 41
Building on LEED Cheng, Esener, King, Larsen
Figure 3b. Dependences of fume hood energy usage on sash heights at constant fan
powers.
LEED, 42