Embed Size (px)
Citation preview

Distribution Number 168
Legal & General Managed Monthly Income Trust
Interim Manager's Reportfor the period ended22 August 2019 (Unaudited)

Contents
Page Number
1
Manager's Investment Reportempty 2
Authorised Status 4
Directors’ Statement 4
Portfolio Statement 5
Statement of Total Return 14
Statement of Change in Net Assets attributable to Unitholders 14
Balance Sheet 15
Notes to the Financial Statements 16
Trust Information 17
Risk and Reward Profile 18
General Information 19
2
Manager's Investment Report
empty
Investment Objective and PolicyIn line with the updated rules and guidance for the asset management industry published by the Financial Conduct Authority (FCA) in February 2019, we have clarified the Investment Objectives and Policies for our UK regulated funds.
The revised Investment Objective and Policy came into effect on 7 August 2019. The previous and revised Investment Objective and Policy are set out below.
Prior to 7 August 2019The objective of the Trust is to provide a high income from a managed portfolio that includes fixed interest securities and Government and other public securities. Investments may be made in stocks traded on overseas markets.
The Trust may hold derivatives for the purpose of Efficient Portfolio Management.
From 7 August 2019The objective of the Trust is to provide a monthly income. The Trust aims to outperform the iBoxx Sterling Corporate Bond Index (the “Benchmark Index”) by 1.5% per annum. This objective is before the deduction of any charges and measured over rolling three year periods.
The Trust is actively managed and will invest at least 80% in investment grade bonds (corporate and government) from UK and overseas issuers. These are bonds with a credit rating from a nationally recognised statistical rating organisation (NRSRO) or non-rated bonds that are deemed equivalent by the Manager. The Trust may hold up to 20% in sub-investment grade bonds. Non-Sterling currency and interest rate risk exposures are hedged to Sterling.
The Trust may also invest in cash, permitted deposits, money market instruments (such as treasury bills), collective investment schemes, including those which are operated by the Manager or an associate of the Manager and securities with bond features such as contingent convertible bonds.
The Trust may only hold derivatives for the purpose of Efficient Portfolio Management.
Manager's Investment ReportDuring the period under review, the bid price of the Trust’s R-Class accumulation units rose by 7.21%. Over the same period, the iBoxx Sterling Corporates Overall Total Return Index rose by 7.46% (source: Bloomberg).
Past performance is not a guide to future performance.
The value of investments and any income from them may go down as well as up.
Exchange rate changes may cause the value of any overseas investments to rise or fall.
Market/Economic ReviewBonds gained ground over the review period, notably during May when investors became markedly more risk averse after the US-China trade dispute escalated. The shift to a more accommodative monetary policy from the major central banks has also underpinned bond markets. The Federal Reserve called a halt to its programme of interest rate hikes and investors correctly anticipated the rate cut at the end of July. Likewise, the European Central Bank has reassured investors that it would not raise interest rates at least until the middle of 2020. The Bank of Japan’s negative interest rate policy, and its announcement that it will intervene if necessary to keep the yield on
3
benchmark 10-year bonds at around 0%, underpinned Japanese government bonds.
On the political front, the election of Boris Johnson as UK Prime Minister resulted in growing fears of a hard Brexit, with the pound taking the brunt of the pain. Within credit, UK banks suffered, as did domestically orientated equities, while gilt yields continued to move lower. US/China trade tensions simmered throughout the month, boiling over once again at the beginning of August. Japan and South Korea also had a lower-profile trade spat. The Middle East, particularly Iran, continued to hit the headlines, leading to further oil price volatility. There was some good news in the US, where agreement was reached to extend the debt ceiling.
In the UK, investors have begun to factor in the possibility that the Bank of England may sanction a cut in interest rates before the end of the year. Index-linked gilts outperformed their conventional counterparts, benefiting from their longer maturity profile and ongoing demand from UK institutional investors. Sterling-denominated corporate bonds outperformed conventional gilts, driven by the lower interest rate outlook and the lower borrowing costs this implies for companies.
Trust ReviewThe Trust delivered a positive return over the period.
The new issues market has largely remained robust over the period, with most deals attracting strong investor interest and subsequently performing well.
Among such primary market issues, we bought into deals from mobile operators Verizon Communications, Vodafone Group and America Movil, as well as drinks group Diageo Finance and financial services companies such as HSBC and RBS. In the secondary market, we have taken the opportunity to largely add exposure to companies in which we hold the most confidence. Early in the period, we reduced exposure to high yield bonds across certain names including pharmaceuticals firm Teva Pharmaceutical Finance Netherlands II. Elsewhere, we also lowered our weightings across the autos sector via sales of bonds issued by Volkswagen and Ford.
As central banks have once again introduced a willingness to entertain cutting interest rates and introducing easing programmes, we maintain long duration position (meaning that the Trust is less sensitive to interest rate movements).
OutlookLooking ahead, the escalation of trade tensions at the beginning of August once again implies downside growth risks. China’s policy response is important: whether they make life difficult for US companies operating in China and whether they choose to stimulate the economy and/or weaken the currency. Central banks are in supportive mode, but only the Federal Reserve has the room to significantly cut interest rates. Valuations remain close to recent highs across credit and equity markets, which suggest downside risk should the macro backdrop deteriorate.
Legal & General Investment Management Limited(Investment Adviser) 3 September 2019
Manager's Investment Report continued
Authorised Status
4
Authorised StatusThis Trust is an Authorised Unit Trust Scheme as defined in section 243 of the Financial Services and Markets Act 2000 and is a UCITS Retail Scheme within the meaning of the FCA Collective Investment Schemes sourcebook.
Directors’ StatementWe hereby certify that this Manager's Report has been prepared in accordance with the requirements of the FCA Collective Investment Schemes sourcebook.
A. J. C. Craven L. W. Toms(Director) (Director)
Legal & General (Unit Trust Managers) Limited11 September 2019

Portfolio Statement
5
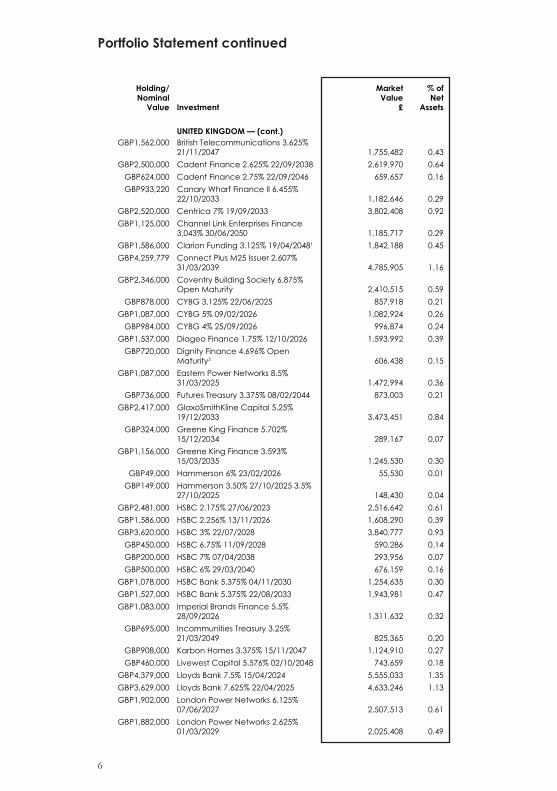
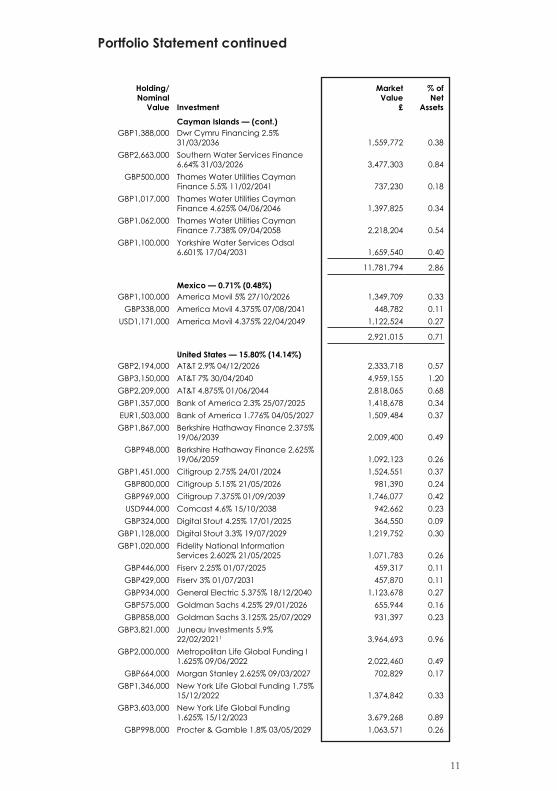
Portfolio Statement as at 22 August 2019All investments are in investment grade securities unless otherwise stated. The percentages in brackets show the equivalent holdings at 22 February 2019.
Holding/ Nominal
Value Investment
Market Value
£
% of Net
Assets
TestCORPORATE BONDS — 92.09% (91.19%) Test TestUNITED KINGDOM — 52.78% (48.74%)
GBP1,217,000 Accent Capital 2.625% 18/07/2049 1,313,256 0.32GBP1,039,000 Anglian Water Services Financing
1.625% 10/08/2025 1,049,459 0.26GBP1,250,000 Anglian Water Services Financing
4.5% 22/02/2026 1,392,666 0.34GBP1,293,000 Anglian Water Services Financing
2.625% 15/06/2027 1,293,363 0.31GBP942,000 Anglian Water Services Financing
2.75% 26/10/2029 1,035,965 0.25GBP3,417,000 Annington Funding 3.184%
12/07/2029 3,643,069 0.88GBP816,000 Annington Funding 3.685%
12/07/2034 906,491 0.22GBP471,000 Annington Funding 3.935%
12/07/2047 541,127 0.13GBP2,000,700 Arqiva Financing 4.882% 31/12/2032 2,305,107 0.56
GBP579,000 Arqiva Financing 5.34% 30/12/2037 714,211 0.17GBP563,078 Aspire Defence Finance 4.674%
31/03/2040 749,260 0.18GBP859,000 Aster Treasury 4.5% 18/12/2043 1,213,767 0.29
GBP2,380,000 Aviva 6.125% 14/11/2036 2,795,020 0.68GBP2,112,000 Aviva 6.625% 03/06/2041 2,284,487 0.55
GBP142,000 Aviva 4.375% 12/09/2049 151,163 0.04GBP2,563,000 Aviva 5.902% Open Maturity 2,623,871 0.64GBP3,100,000 Aviva 6.125% Open Maturity 3,331,855 0.81GBP1,175,000 Bank of Scotland 7.281% Open
Maturity 1,442,336 0.35GBP1,556,000 Barclays 2.375% 06/10/2023 1,563,108 0.38GBP1,132,000 Barclays 3% 08/05/2026 1,149,161 0.28
GBP670,000 Barclays 3.25% 17/01/2033 666,282 0.16GBP1,993,000 BAT International Finance 4%
04/09/2026 2,225,491 0.54GBP147,000 BAT International Finance 5.75%
05/07/2040 198,696 0.05GBP987,000 BAT International Finance 2.25%
09/09/2052 760,047 0.18GBP1,879,000 BAT International Finance 4%
23/11/2055 2,048,786 0.50GBP1,160,000 Bazalgette Finance 2.375%
29/11/2027 1,241,003 0.30GBP1,560,000 BP Capital Markets 1.827%
08/09/2025 1,613,656 0.39GBP4,734,000 Brit Insurance 6.625% 09/12/20301 4,812,111 1.17GBP1,932,000 British Telecommunications 3.125%
21/11/2031 2,099,191 0.51
Portfolio Statement continued
6
Holding/ Nominal
Value Investment
Market Value
£
% of Net
Assets
TestUNITED KINGDOM — (cont.) Test TestGBP1,562,000 British Telecommunications 3.625%
21/11/2047 1,755,482 0.43GBP2,500,000 Cadent Finance 2.625% 22/09/2038 2,619,970 0.64
GBP624,000 Cadent Finance 2.75% 22/09/2046 659,657 0.16GBP933,220 Canary Wharf Finance II 6.455%
22/10/2033 1,182,646 0.29GBP2,520,000 Centrica 7% 19/09/2033 3,802,408 0.92GBP1,125,000 Channel Link Enterprises Finance
3.043% 30/06/2050 1,185,717 0.29GBP1,586,000 Clarion Funding 3.125% 19/04/20481 1,842,188 0.45GBP4,259,779 Connect Plus M25 Issuer 2.607%
31/03/2039 4,785,905 1.16GBP2,346,000 Coventry Building Society 6.875%
Open Maturity 2,410,515 0.59GBP878,000 CYBG 3.125% 22/06/2025 857,918 0.21
GBP1,087,000 CYBG 5% 09/02/2026 1,082,924 0.26GBP984,000 CYBG 4% 25/09/2026 996,874 0.24
GBP1,537,000 Diageo Finance 1.75% 12/10/2026 1,593,992 0.39GBP720,000 Dignity Finance 4.696% Open
Maturity2 606,438 0.15GBP1,087,000 Eastern Power Networks 8.5%
31/03/2025 1,472,994 0.36GBP736,000 Futures Treasury 3.375% 08/02/2044 873,003 0.21
GBP2,417,000 GlaxoSmithKline Capital 5.25% 19/12/2033 3,473,451 0.84
GBP324,000 Greene King Finance 5.702% 15/12/2034 289,167 0.07
GBP1,156,000 Greene King Finance 3.593% 15/03/2035 1,245,530 0.30
GBP49,000 Hammerson 6% 23/02/2026 55,530 0.01GBP149,000 Hammerson 3.50% 27/10/2025 3.5%
27/10/2025 148,430 0.04GBP2,481,000 HSBC 2.175% 27/06/2023 2,516,642 0.61GBP1,586,000 HSBC 2.256% 13/11/2026 1,608,290 0.39GBP3,620,000 HSBC 3% 22/07/2028 3,840,777 0.93
GBP450,000 HSBC 6.75% 11/09/2028 590,286 0.14GBP200,000 HSBC 7% 07/04/2038 293,956 0.07GBP500,000 HSBC 6% 29/03/2040 676,159 0.16
GBP1,078,000 HSBC Bank 5.375% 04/11/2030 1,254,635 0.30GBP1,527,000 HSBC Bank 5.375% 22/08/2033 1,943,981 0.47GBP1,083,000 Imperial Brands Finance 5.5%
28/09/2026 1,311,632 0.32GBP695,000 Incommunities Treasury 3.25%
21/03/2049 825,365 0.20GBP908,000 Karbon Homes 3.375% 15/11/2047 1,124,910 0.27GBP460,000 Livewest Capital 5.576% 02/10/2048 743,659 0.18
GBP4,379,000 Lloyds Bank 7.5% 15/04/2024 5,555,033 1.35GBP3,629,000 Lloyds Bank 7.625% 22/04/2025 4,633,246 1.13GBP1,902,000 London Power Networks 6.125%
07/06/2027 2,507,513 0.61GBP1,882,000 London Power Networks 2.625%
01/03/2029 2,025,408 0.49
Portfolio Statement continued
7
Holding/ Nominal
Value Investment
Market Value
£
% of Net
Assets
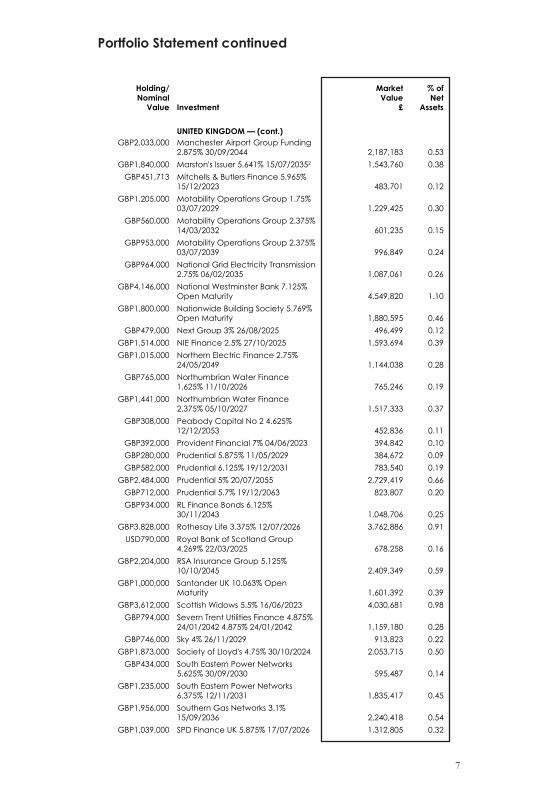
TestUNITED KINGDOM — (cont.) Test TestGBP2,033,000 Manchester Airport Group Funding
2.875% 30/09/2044 2,187,183 0.53GBP1,840,000 Marston's Issuer 5.641% 15/07/20352 1,543,760 0.38
GBP451,713 Mitchells & Butlers Finance 5.965% 15/12/2023 483,701 0.12
GBP1,205,000 Motability Operations Group 1.75% 03/07/2029 1,229,425 0.30
GBP560,000 Motability Operations Group 2.375% 14/03/2032 601,235 0.15
GBP953,000 Motability Operations Group 2.375% 03/07/2039 996,849 0.24
GBP964,000 National Grid Electricity Transmission 2.75% 06/02/2035 1,087,061 0.26
GBP4,146,000 National Westminster Bank 7.125% Open Maturity 4,549,820 1.10
GBP1,800,000 Nationwide Building Society 5.769% Open Maturity 1,880,595 0.46
GBP479,000 Next Group 3% 26/08/2025 496,499 0.12GBP1,514,000 NIE Finance 2.5% 27/10/2025 1,593,694 0.39GBP1,015,000 Northern Electric Finance 2.75%
24/05/2049 1,144,038 0.28GBP765,000 Northumbrian Water Finance
1.625% 11/10/2026 765,246 0.19GBP1,441,000 Northumbrian Water Finance
2.375% 05/10/2027 1,517,333 0.37GBP308,000 Peabody Capital No 2 4.625%
12/12/2053 452,836 0.11GBP392,000 Provident Financial 7% 04/06/2023 394,842 0.10GBP280,000 Prudential 5.875% 11/05/2029 384,672 0.09GBP582,000 Prudential 6.125% 19/12/2031 783,540 0.19
GBP2,484,000 Prudential 5% 20/07/2055 2,729,419 0.66GBP712,000 Prudential 5.7% 19/12/2063 823,807 0.20GBP934,000 RL Finance Bonds 6.125%
30/11/2043 1,048,706 0.25GBP3,828,000 Rothesay Life 3.375% 12/07/2026 3,762,886 0.91
USD790,000 Royal Bank of Scotland Group 4.269% 22/03/2025 678,258 0.16
GBP2,204,000 RSA Insurance Group 5.125% 10/10/2045 2,409,349 0.59
GBP1,000,000 Santander UK 10.063% Open Maturity 1,601,392 0.39
GBP3,612,000 Scottish Widows 5.5% 16/06/2023 4,030,681 0.98GBP794,000 Severn Trent Utilities Finance 4.875%
24/01/2042 4.875% 24/01/2042 1,159,180 0.28GBP746,000 Sky 4% 26/11/2029 913,823 0.22
GBP1,873,000 Society of Lloyd's 4.75% 30/10/2024 2,053,715 0.50GBP434,000 South Eastern Power Networks
5.625% 30/09/2030 595,487 0.14GBP1,235,000 South Eastern Power Networks
6.375% 12/11/2031 1,835,417 0.45GBP1,956,000 Southern Gas Networks 3.1%
15/09/2036 2,240,418 0.54GBP1,039,000 SPD Finance UK 5.875% 17/07/2026 1,312,805 0.32
Portfolio Statement continued
8
Holding/ Nominal
Value Investment
Market Value
£
% of Net
Assets
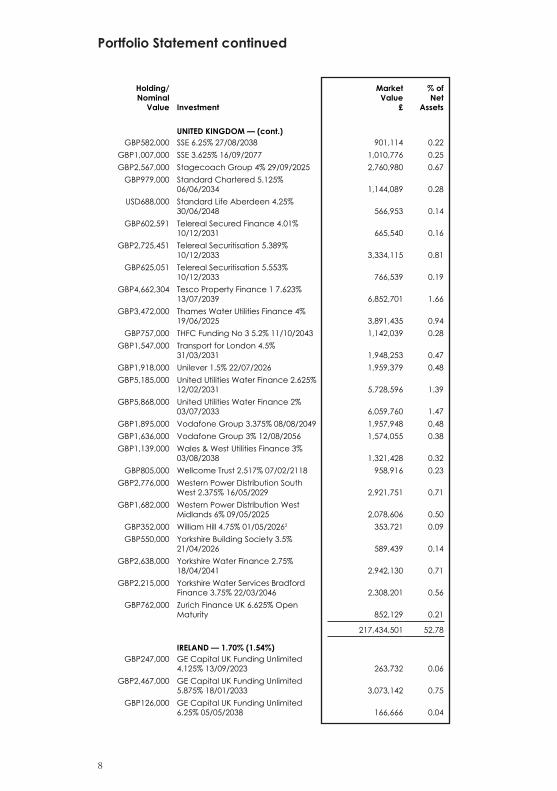
TestUNITED KINGDOM — (cont.) Test TestGBP582,000 SSE 6.25% 27/08/2038 901,114 0.22
GBP1,007,000 SSE 3.625% 16/09/2077 1,010,776 0.25GBP2,567,000 Stagecoach Group 4% 29/09/2025 2,760,980 0.67
GBP979,000 Standard Chartered 5.125% 06/06/2034 1,144,089 0.28
USD688,000 Standard Life Aberdeen 4.25% 30/06/2048 566,953 0.14
GBP602,591 Telereal Secured Finance 4.01% 10/12/2031 665,540 0.16
GBP2,725,451 Telereal Securitisation 5.389% 10/12/2033 3,334,115 0.81
GBP625,051 Telereal Securitisation 5.553% 10/12/2033 766,539 0.19
GBP4,662,304 Tesco Property Finance 1 7.623% 13/07/2039 6,852,701 1.66
GBP3,472,000 Thames Water Utilities Finance 4% 19/06/2025 3,891,435 0.94
GBP757,000 THFC Funding No 3 5.2% 11/10/2043 1,142,039 0.28GBP1,547,000 Transport for London 4.5%
31/03/2031 1,948,253 0.47GBP1,918,000 Unilever 1.5% 22/07/2026 1,959,379 0.48GBP5,185,000 United Utilities Water Finance 2.625%
12/02/2031 5,728,596 1.39GBP5,868,000 United Utilities Water Finance 2%
03/07/2033 6,059,760 1.47GBP1,895,000 Vodafone Group 3.375% 08/08/2049 1,957,948 0.48GBP1,636,000 Vodafone Group 3% 12/08/2056 1,574,055 0.38GBP1,139,000 Wales & West Utilities Finance 3%
03/08/2038 1,321,428 0.32GBP805,000 Wellcome Trust 2.517% 07/02/2118 958,916 0.23
GBP2,776,000 Western Power Distribution South West 2.375% 16/05/2029 2,921,751 0.71
GBP1,682,000 Western Power Distribution West Midlands 6% 09/05/2025 2,078,606 0.50
GBP352,000 William Hill 4.75% 01/05/20262 353,721 0.09GBP550,000 Yorkshire Building Society 3.5%
21/04/2026 589,439 0.14GBP2,638,000 Yorkshire Water Finance 2.75%
18/04/2041 2,942,130 0.71GBP2,215,000 Yorkshire Water Services Bradford
Finance 3.75% 22/03/2046 2,308,201 0.56GBP762,000 Zurich Finance UK 6.625% Open
Maturity 852,129 0.21
217,434,501 52.78
IRELAND — 1.70% (1.54%) GBP247,000 GE Capital UK Funding Unlimited
4.125% 13/09/2023 263,732 0.06GBP2,467,000 GE Capital UK Funding Unlimited
5.875% 18/01/2033 3,073,142 0.75GBP126,000 GE Capital UK Funding Unlimited
6.25% 05/05/2038 166,666 0.04

Portfolio Statement continued
9
Holding/ Nominal
Value Investment
Market Value
£
% of Net
Assets
TestIRELAND — (cont.) Test TestGBP2,312,000 GE Capital UK Funding Unlimited 8%
14/01/2039 3,477,916 0.85
6,981,456 1.70
CHANNEL ISLANDS — 3.39% (4.02%) GBP2,700,000 CPUK Finance 3.588% 28/02/2042 2,921,457 0.71
GBP464,000 CPUK Finance 7.239% 28/02/2042 566,292 0.14GBP2,990,000 Gatwick Funding 3.125% 28/09/2041 3,277,997 0.80
GBP214,000 Gatwick Funding 2.625% 07/10/2048 213,717 0.05GBP900,000 Heathrow Funding 6.75% 03/12/2028 1,213,355 0.29GBP468,000 Heathrow Funding 5.875%
13/05/2043 735,926 0.18GBP564,000 Heathrow Funding 4.625%
31/10/2046 798,099 0.19GBP3,210,000 HSBC Bank Capital Funding Sterling
1 5.844% Open Maturity 4,233,723 1.03
13,960,566 3.39
CONTINENTAL EUROPE — 14.85% (18.91%)
Test Belgium — 0.76% (0.77%) TestGBP1,018,000 Anheuser-Busch InBev 2.25%
24/05/2029 1,057,285 0.26GBP1,929,000 Anheuser-Busch InBev 2.85%
25/05/2037 2,057,587 0.50
3,114,872 0.76
France — 8.27% (8.37%) EUR1,648,000 AXA 3.25% 28/05/2049 1,713,652 0.42GBP1,252,000 AXA 5.453% Open Maturity 1,404,744 0.34
GBP462,000 AXA 6.686% Open Maturity 545,738 0.13GBP284,000 AXA 5.625% 16/01/2054 339,490 0.08GBP600,000 Banque Federative du Credit
Mutuel 2.25% 18/12/2023 624,031 0.15GBP1,773,000 BNP Paribas 3.375% 23/01/2026 1,927,513 0.47GBP4,700,000 Credit Agricole 8.125% Open
Maturity 4,743,616 1.15GBP50,000 Electricite de France 6.25%
30/05/2028 68,377 0.02GBP233,000 Electricite de France 5.875%
18/07/2031 329,956 0.08GBP5,000,000 Electricite de France 5.5%
17/10/2041 7,494,940 1.82GBP700,000 Electricite de France 5.125%
22/09/2050 1,062,730 0.26GBP1,300,000 Electricite de France 6% 23/01/2114 2,155,457 0.52
GBP400,000 Electricite de France 5.875% Open Maturity 432,000 0.10
GBP400,000 Electricite de France 6% Open Maturity 440,400 0.11
GBP2,200,000 Orange 3.25% 15/01/2032 2,495,064 0.61GBP2,569,000 Orange 5.875% Open Maturity 2,797,836 0.68GBP2,949,000 Sodexo 1.75% 26/06/2028 3,057,618 0.74GBP1,000,000 Vinci 2.25% 15/03/2027 1,062,878 0.26
Portfolio Statement continued
10
Holding/ Nominal
Value Investment
Market Value
£
% of Net
Assets
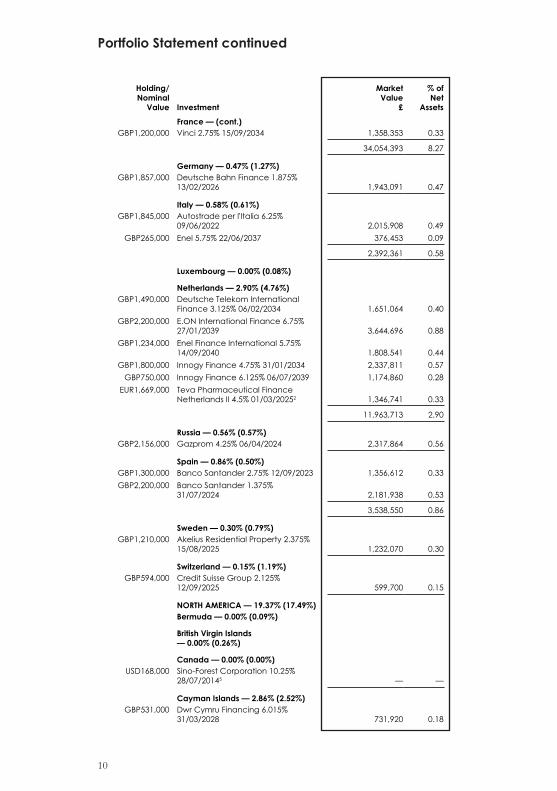
Test France — (cont.) Test TestGBP1,200,000 Vinci 2.75% 15/09/2034 1,358,353 0.33
34,054,393 8.27
Germany — 0.47% (1.27%) GBP1,857,000 Deutsche Bahn Finance 1.875%
13/02/2026 1,943,091 0.47
Italy — 0.58% (0.61%) GBP1,845,000 Autostrade per l'Italia 6.25%
09/06/2022 2,015,908 0.49GBP265,000 Enel 5.75% 22/06/2037 376,453 0.09
2,392,361 0.58
Luxembourg — 0.00% (0.08%)
Netherlands — 2.90% (4.76%) GBP1,490,000 Deutsche Telekom International
Finance 3.125% 06/02/2034 1,651,064 0.40GBP2,200,000 E.ON International Finance 6.75%
27/01/2039 3,644,696 0.88GBP1,234,000 Enel Finance International 5.75%
14/09/2040 1,808,541 0.44GBP1,800,000 Innogy Finance 4.75% 31/01/2034 2,337,811 0.57
GBP750,000 Innogy Finance 6.125% 06/07/2039 1,174,860 0.28EUR1,669,000 Teva Pharmaceutical Finance
Netherlands II 4.5% 01/03/20252 1,346,741 0.33
11,963,713 2.90
Russia — 0.56% (0.57%) GBP2,156,000 Gazprom 4.25% 06/04/2024 2,317,864 0.56
Spain — 0.86% (0.50%) GBP1,300,000 Banco Santander 2.75% 12/09/2023 1,356,612 0.33GBP2,200,000 Banco Santander 1.375%
31/07/2024 2,181,938 0.53
3,538,550 0.86
Sweden — 0.30% (0.79%) GBP1,210,000 Akelius Residential Property 2.375%
15/08/2025 1,232,070 0.30
Switzerland — 0.15% (1.19%) GBP594,000 Credit Suisse Group 2.125%
12/09/2025 599,700 0.15
TestNORTH AMERICA — 19.37% (17.49%) TestTest Bermuda — 0.00% (0.09%) Test
British Virgin Islands — 0.00% (0.26%)
Canada — 0.00% (0.00%) USD168,000 Sino-Forest Corporation 10.25%
28/07/20145 — —
Cayman Islands — 2.86% (2.52%) GBP531,000 Dwr Cymru Financing 6.015%
31/03/2028 731,920 0.18
Portfolio Statement continued
11
Holding/ Nominal
Value Investment
Market Value
£
% of Net
Assets
Test Cayman Islands — (cont.) Test TestGBP1,388,000 Dwr Cymru Financing 2.5%
31/03/2036 1,559,772 0.38GBP2,663,000 Southern Water Services Finance
6.64% 31/03/2026 3,477,303 0.84GBP500,000 Thames Water Utilities Cayman
Finance 5.5% 11/02/2041 737,230 0.18GBP1,017,000 Thames Water Utilities Cayman
Finance 4.625% 04/06/2046 1,397,825 0.34GBP1,062,000 Thames Water Utilities Cayman
Finance 7.738% 09/04/2058 2,218,204 0.54GBP1,100,000 Yorkshire Water Services Odsal
6.601% 17/04/2031 1,659,540 0.40
11,781,794 2.86
Mexico — 0.71% (0.48%) GBP1,100,000 America Movil 5% 27/10/2026 1,349,709 0.33
GBP338,000 America Movil 4.375% 07/08/2041 448,782 0.11USD1,171,000 America Movil 4.375% 22/04/2049 1,122,524 0.27
2,921,015 0.71
United States — 15.80% (14.14%) GBP2,194,000 AT&T 2.9% 04/12/2026 2,333,718 0.57GBP3,150,000 AT&T 7% 30/04/2040 4,959,155 1.20GBP2,209,000 AT&T 4.875% 01/06/2044 2,818,065 0.68GBP1,357,000 Bank of America 2.3% 25/07/2025 1,418,678 0.34EUR1,503,000 Bank of America 1.776% 04/05/2027 1,509,484 0.37GBP1,867,000 Berkshire Hathaway Finance 2.375%
19/06/2039 2,009,400 0.49GBP948,000 Berkshire Hathaway Finance 2.625%
19/06/2059 1,092,123 0.26GBP1,451,000 Citigroup 2.75% 24/01/2024 1,524,551 0.37
GBP800,000 Citigroup 5.15% 21/05/2026 981,390 0.24GBP969,000 Citigroup 7.375% 01/09/2039 1,746,077 0.42USD944,000 Comcast 4.6% 15/10/2038 942,662 0.23GBP324,000 Digital Stout 4.25% 17/01/2025 364,550 0.09
GBP1,128,000 Digital Stout 3.3% 19/07/2029 1,219,752 0.30GBP1,020,000 Fidelity National Information
Services 2.602% 21/05/2025 1,071,783 0.26GBP446,000 Fiserv 2.25% 01/07/2025 459,317 0.11GBP429,000 Fiserv 3% 01/07/2031 457,870 0.11GBP934,000 General Electric 5.375% 18/12/2040 1,123,678 0.27GBP575,000 Goldman Sachs 4.25% 29/01/2026 655,944 0.16GBP858,000 Goldman Sachs 3.125% 25/07/2029 931,397 0.23
GBP3,821,000 Juneau Investments 5.9% 22/02/20211 3,964,693 0.96
GBP2,000,000 Metropolitan Life Global Funding I 1.625% 09/06/2022 2,022,460 0.49
GBP664,000 Morgan Stanley 2.625% 09/03/2027 702,829 0.17GBP1,346,000 New York Life Global Funding 1.75%
15/12/2022 1,374,842 0.33GBP3,603,000 New York Life Global Funding
1.625% 15/12/2023 3,679,268 0.89GBP998,000 Procter & Gamble 1.8% 03/05/2029 1,063,571 0.26
Portfolio Statement continued
12
Holding/ Nominal
Value Investment
Market Value
£
% of Net
Assets
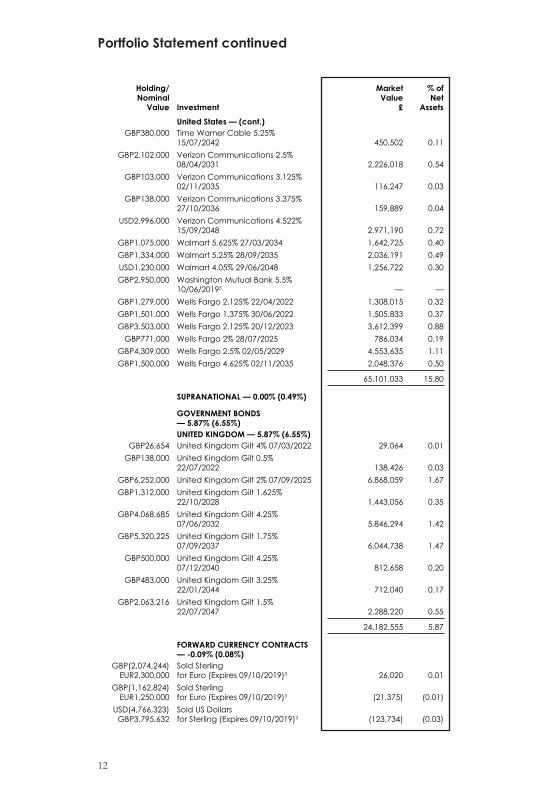
Test United States — (cont.) Test TestGBP380,000 Time Warner Cable 5.25%
15/07/2042 450,502 0.11GBP2,102,000 Verizon Communications 2.5%
08/04/2031 2,226,018 0.54GBP103,000 Verizon Communications 3.125%
02/11/2035 116,247 0.03GBP138,000 Verizon Communications 3.375%
27/10/2036 159,889 0.04USD2,996,000 Verizon Communications 4.522%
15/09/2048 2,971,190 0.72GBP1,075,000 Walmart 5.625% 27/03/2034 1,642,725 0.40GBP1,334,000 Walmart 5.25% 28/09/2035 2,036,191 0.49USD1,230,000 Walmart 4.05% 29/06/2048 1,256,722 0.30GBP2,950,000 Washington Mutual Bank 5.5%
10/06/20195 — —GBP1,279,000 Wells Fargo 2.125% 22/04/2022 1,308,015 0.32GBP1,501,000 Wells Fargo 1.375% 30/06/2022 1,505,833 0.37GBP3,503,000 Wells Fargo 2.125% 20/12/2023 3,612,399 0.88
GBP771,000 Wells Fargo 2% 28/07/2025 786,034 0.19GBP4,309,000 Wells Fargo 2.5% 02/05/2029 4,553,635 1.11GBP1,500,000 Wells Fargo 4.625% 02/11/2035 2,048,376 0.50
65,101,033 15.80
TestSUPRANATIONAL — 0.00% (0.49%) Test
GOVERNMENT BONDS — 5.87% (6.55%) UNITED KINGDOM — 5.87% (6.55%)
GBP26,654 United Kingdom Gilt 4% 07/03/2022 29,064 0.01GBP138,000 United Kingdom Gilt 0.5%
22/07/2022 138,426 0.03GBP6,252,000 United Kingdom Gilt 2% 07/09/2025 6,868,059 1.67GBP1,312,000 United Kingdom Gilt 1.625%
22/10/2028 1,443,056 0.35GBP4,068,685 United Kingdom Gilt 4.25%
07/06/2032 5,846,294 1.42GBP5,320,225 United Kingdom Gilt 1.75%
07/09/2037 6,044,738 1.47GBP500,000 United Kingdom Gilt 4.25%
07/12/2040 812,658 0.20GBP483,000 United Kingdom Gilt 3.25%
22/01/2044 712,040 0.17GBP2,063,216 United Kingdom Gilt 1.5%
22/07/2047 2,288,220 0.55
24,182,555 5.87
FORWARD CURRENCY CONTRACTS — -0.09% (0.08%)
GBP(2,074,244) EUR2,300,000
Sold Sterling for Euro (Expires 09/10/2019)3 26,020 0.01
GBP(1,162,824) EUR1,250,000
Sold Sterling for Euro (Expires 09/10/2019)3 (21,375) (0.01)
USD(4,766,323) GBP3,795,632
Sold US Dollars for Sterling (Expires 09/10/2019)3 (123,734) (0.03)
Portfolio Statement continued
13
Holding/ Nominal
Value Investment
Market Value
£
% of Net
Assets
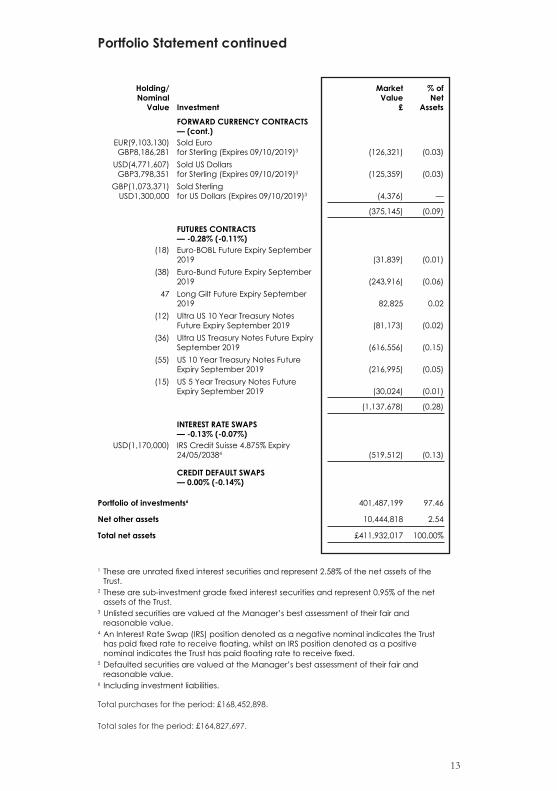
TestFORWARD CURRENCY CONTRACTS — (cont.) Test Test
EUR(9,103,130) GBP8,186,281
Sold Euro for Sterling (Expires 09/10/2019)3 (126,321) (0.03)
USD(4,771,607) GBP3,798,351
Sold US Dollars for Sterling (Expires 09/10/2019)3 (125,359) (0.03)
GBP(1,073,371) USD1,300,000
Sold Sterling for US Dollars (Expires 09/10/2019)3 (4,376) —
(375,145) (0.09)
FUTURES CONTRACTS — -0.28% (-0.11%)
(18) Euro-BOBL Future Expiry September 2019 (31,839) (0.01)
(38) Euro-Bund Future Expiry September 2019 (243,916) (0.06)
47 Long Gilt Future Expiry September 2019 82,825 0.02
(12) Ultra US 10 Year Treasury Notes Future Expiry September 2019 (81,173) (0.02)
(36) Ultra US Treasury Notes Future Expiry September 2019 (616,556) (0.15)
(55) US 10 Year Treasury Notes Future Expiry September 2019 (216,995) (0.05)
(15) US 5 Year Treasury Notes Future Expiry September 2019 (30,024) (0.01)
(1,137,678) (0.28)
INTEREST RATE SWAPS — -0.13% (-0.07%)
USD(1,170,000) IRS Credit Suisse 4.875% Expiry 24/05/20384 (519,512) (0.13)
CREDIT DEFAULT SWAPS — 0.00% (-0.14%)
Portfolio of investments6 401,487,199 97.46
Net other assets 10,444,818 2.54
Total net assets £411,932,017 100.00%
1 These are unrated fixed interest securities and represent 2.58% of the net assets of the Trust.
2 These are sub-investment grade fixed interest securities and represent 0.95% of the net assets of the Trust.
3 Unlisted securities are valued at the Manager’s best assessment of their fair and reasonable value.
4 An Interest Rate Swap (IRS) position denoted as a negative nominal indicates the Trust has paid fixed rate to receive floating, whilst an IRS position denoted as a positive nominal indicates the Trust has paid floating rate to receive fixed.
5 Defaulted securities are valued at the Manager’s best assessment of their fair and reasonable value.
6 Including investment liabilities.
Total purchases for the period: £168,452,898.
Total sales for the period: £164,827,697.
Financial Statements
14
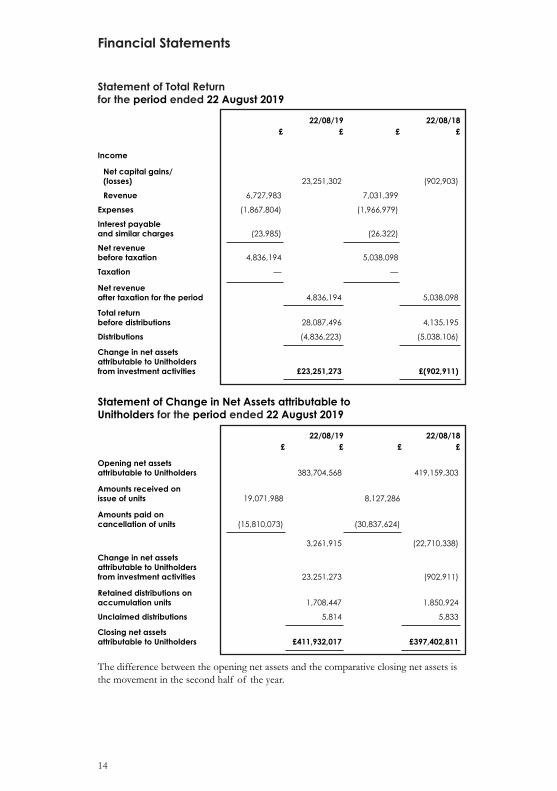
Statement of Total Returnfor the period ended 22 August 2019
22/08/19 22/08/18£ £ £ £
Income
Net capital gains/(losses) 23,251,302 (902,903)
Revenue 6,727,983 7,031,399
Expenses (1,867,804) (1,966,979)
Interest payable and similar charges (23,985) (26,322)
Net revenue before taxation 4,836,194 5,038,098
Taxation — —
Net revenue after taxation for the period 4,836,194 5,038,098
Total return before distributions 28,087,496 4,135,195
Distributions (4,836,223) (5,038,106)
Change in net assets attributable to Unitholders from investment activities £23,251,273 £(902,911)
Statement of Change in Net Assets attributable to Unitholders for the period ended 22 August 2019
22/08/19 22/08/18£ £ £ £
Opening net assets attributable to Unitholders 383,704,568 419,159,303
Amounts received on issue of units 19,071,988 8,127,286
Amounts paid on cancellation of units (15,810,073) (30,837,624)
3,261,915 (22,710,338)
Change in net assets attributable to Unitholders from investment activities 23,251,273 (902,911)
Retained distributions on accumulation units 1,708,447 1,850,924
Unclaimed distributions 5,814 5,833
Closing net assets attributable to Unitholders £411,932,017 £397,402,811
The difference between the opening net assets and the comparative closing net assets is the movement in the second half of the year.
Financial Statements continued
15
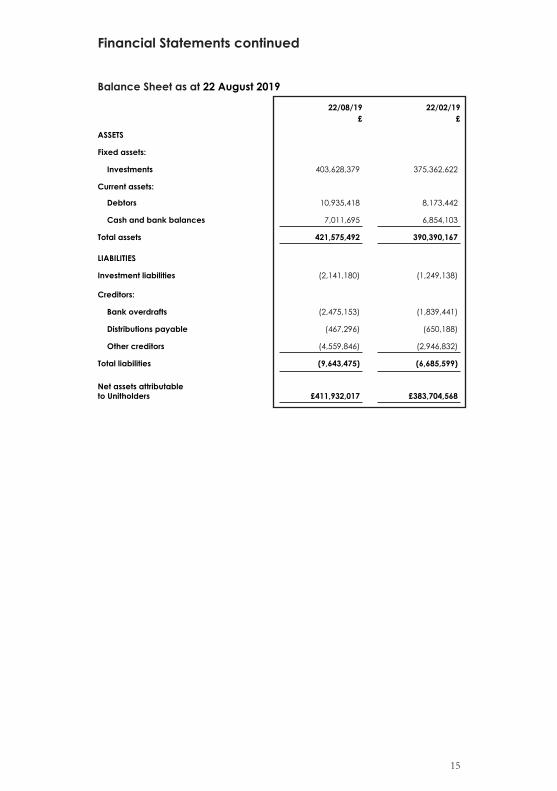
Balance Sheet as at 22 August 2019
22/08/19 22/02/19£ £
ASSETS
Fixed assets:
Investments 403,628,379 375,362,622
Current assets:
Debtors 10,935,418 8,173,442
Cash and bank balances 7,011,695 6,854,103
Total assets 421,575,492 390,390,167
LIABILITIES
Investment liabilities (2,141,180) (1,249,138)
Creditors:
Bank overdrafts (2,475,153) (1,839,441)
Distributions payable (467,296) (650,188)
Other creditors (4,559,846) (2,946,832)
Total liabilities (9,643,475) (6,685,599)
Net assets attributable to Unitholders £411,932,017 £383,704,568

Notes to the Financial Statements
16
1. Statement of ComplianceThe Financial Statements have been prepared in compliance with UK Financial Reporting Standard 102 (FRS 102) and in accordance with the Statement of Recommended Practice for UK Authorised Funds issued by the Investment Management Association in May 2014 (2014 SORP).
2. Accounting PoliciesThe accounting policies applied are consistent with the most recent annual Financial Statements.
(a) Basis of PreparationThe Financial Statements have been prepared on a going concern basis, under the historical cost convention as modified by the revaluation of certain financial assets and liabilities measured at fair value through profit or loss.
17
Trust Information
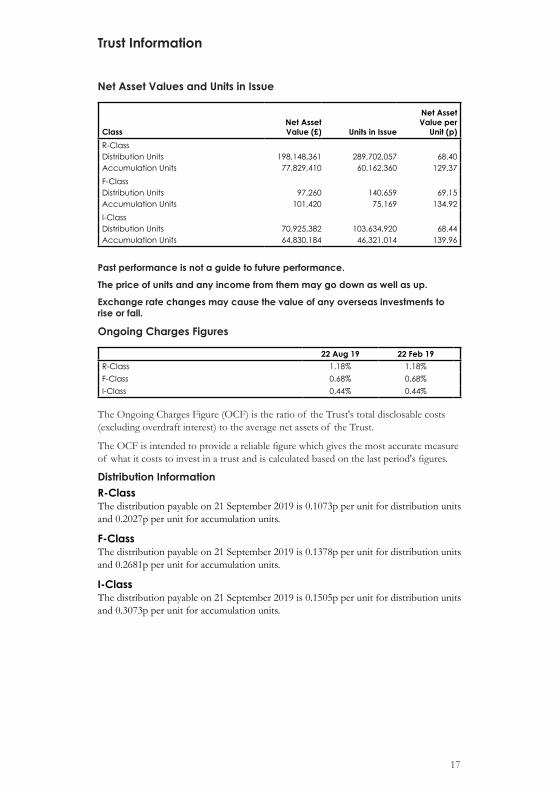
Net Asset Values and Units in Issue
ClassNet Asset Value (£) Units in Issue
Net Asset Value per
Unit (p)R-Class testDistribution Units 198,148,361 289,702,057 68.40Accumulation Units 77,829,410 60,162,360 129.37F-Class testDistribution Units 97,260 140,659 69.15Accumulation Units 101,420 75,169 134.92I-Class testDistribution Units 70,925,382 103,634,920 68.44Accumulation Units 64,830,184 46,321,014 139.96
Past performance is not a guide to future performance.
The price of units and any income from them may go down as well as up.
Exchange rate changes may cause the value of any overseas investments to rise or fall.
Ongoing Charges Figures
22 Aug 19 22 Feb 19R-Class test 1.18% 1.18%F-Class test 0.68% 0.68%I-Class test 0.44% 0.44%
The Ongoing Charges Figure (OCF) is the ratio of the Trust's total disclosable costs (excluding overdraft interest) to the average net assets of the Trust.
The OCF is intended to provide a reliable figure which gives the most accurate measure of what it costs to invest in a trust and is calculated based on the last period's figures.
Distribution InformationR-Class The distribution payable on 21 September 2019 is 0.1073p per unit for distribution units and 0.2027p per unit for accumulation units.
F-Class The distribution payable on 21 September 2019 is 0.1378p per unit for distribution units and 0.2681p per unit for accumulation units.
I-Class The distribution payable on 21 September 2019 is 0.1505p per unit for distribution units and 0.3073p per unit for accumulation units.
18
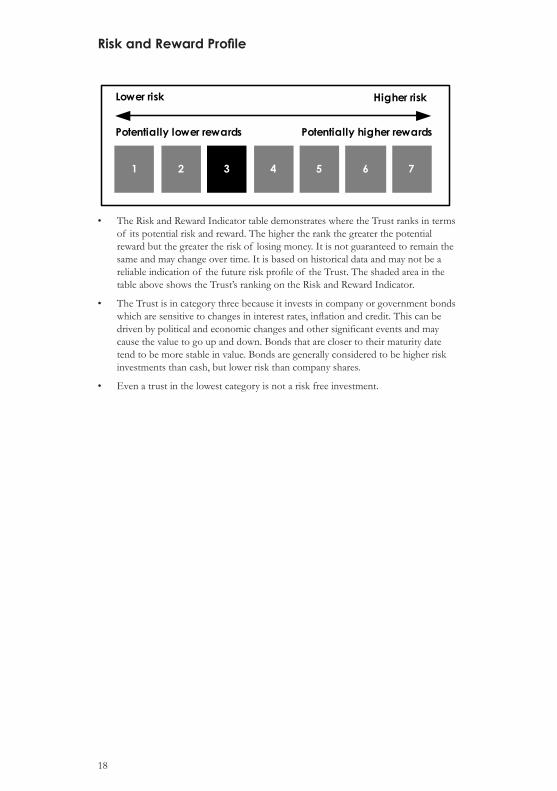
Risk and Reward Profile
1 2 3 4 5 6 7
Lower risk Higher risk
Potentially lower rewards Potentially higher rewards
• The Risk and Reward Indicator table demonstrates where the Trust ranks in terms of its potential risk and reward. The higher the rank the greater the potential reward but the greater the risk of losing money. It is not guaranteed to remain the same and may change over time. It is based on historical data and may not be a reliable indication of the future risk profile of the Trust. The shaded area in the table above shows the Trust’s ranking on the Risk and Reward Indicator.
• The Trust is in category three because it invests in company or government bonds which are sensitive to changes in interest rates, inflation and credit. This can be driven by political and economic changes and other significant events and may cause the value to go up and down. Bonds that are closer to their maturity date tend to be more stable in value. Bonds are generally considered to be higher risk investments than cash, but lower risk than company shares.
• Even a trust in the lowest category is not a risk free investment.
General Information
19
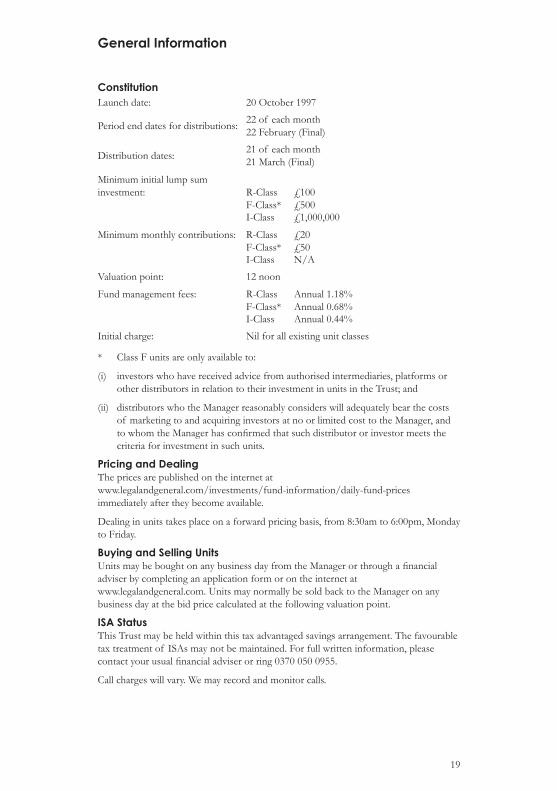
ConstitutionLaunch date: 20 October 1997
Period end dates for distributions: 22 of each month 22 February (Final)
Distribution dates: 21 of each month 21 March (Final)
Minimum initial lump sum investment: R-Class £100
F-Class* £500I-Class £1,000,000
Minimum monthly contributions: R-Class £20F-Class* £50I-Class N/A
Valuation point: 12 noon
Fund management fees: R-Class Annual 1.18%F-Class* Annual 0.68%I-Class Annual 0.44%
Initial charge: Nil for all existing unit classes
* Class F units are only available to:
(i) investors who have received advice from authorised intermediaries, platforms or other distributors in relation to their investment in units in the Trust; and
(ii) distributors who the Manager reasonably considers will adequately bear the costs of marketing to and acquiring investors at no or limited cost to the Manager, and to whom the Manager has confirmed that such distributor or investor meets the criteria for investment in such units.
Pricing and DealingThe prices are published on the internet at www.legalandgeneral.com/investments/fund-information/daily-fund-prices immediately after they become available.
Dealing in units takes place on a forward pricing basis, from 8:30am to 6:00pm, Monday to Friday.
Buying and Selling UnitsUnits may be bought on any business day from the Manager or through a financial adviser by completing an application form or on the internet at www.legalandgeneral.com. Units may normally be sold back to the Manager on any business day at the bid price calculated at the following valuation point.
ISA Status This Trust may be held within this tax advantaged savings arrangement. The favourable tax treatment of ISAs may not be maintained. For full written information, please contact your usual financial adviser or ring 0370 050 0955.
Call charges will vary. We may record and monitor calls.
General Information continued
20
Prospectus and Manager’s ReportsThe Manager will send to all persons on the Unitholder Register annual and interim short form reports.
Copies of the Prospectus and the most recent annual or interim reports are available free of charge by telephoning 0370 050 0955 or by writing to the Manager.
Do you have difficulty in reading information in print because of a disability? If so, we can help. We are able to produce information for our clients in large print and braille. If you would like to discuss your particular requirements, please contact us on0370 050 0955.
Call charges will vary. We may record and monitor calls.
EU Savings Directive The Trust has been reviewed against the requirements of the Directive 2003/48/EC on Taxation of savings in the form of interest payments (ESD), following the HM Revenue & Customs debt investment reporting guidance notes.
Under the Directive, information is collected about the payment of distributions to residents in certain other countries and is reported to HM Revenue & Customs to be exchanged with Tax authorities in those countries.
The Trust falls within the 25% debt investment reporting threshold. This means that details of all distributions and redemption proceeds paid to non UK investors will be reported by Legal & General (Unit Trust Managers) Limited to HM Revenue & Customs to be exchanged with the relevant Tax authorities.
Dual Pricing ArrangementThe Manager’s fixed dual pricing arrangement has a set spread to account for the costs of transacting in a particular Trust. Where the Manager operates a box through which unit subscriptions and unit redemptions are netted into a single trade instruction to the Trustee, the netting reduces the actual transaction costs and this generates a revenue to the Manager. The revenue generated from this activity is calculated on a monthly basis and returned to the Trust in the form of a payment from the Manager. This provides an enhanced return to the Trust, though the size of any return will be dependent on the size of subscriptions and redemptions.
Remuneration DisclosureIn accordance with the Undertakings for collective investment in transferable securities (UCITs) Directive, often referred to as the UCITs V Directive, the Legal & General Managed Monthly Income Trust, as a UCITs Scheme, is required to disclose the aggregate remuneration paid by the UCITs Manager and by the UCITs Scheme to Identified Staff, together with the number of beneficiaries, and, where relevant, performance fees paid by the UCITs Scheme. The aggregate amount of remuneration must be broken down by category of employees or other staff members and be split into fixed and variable remuneration.
The following provides information on the remuneration of persons whose professional activities have a material impact on the management company and the funds managed by it as at 31 December 2018:
General Information continued
21
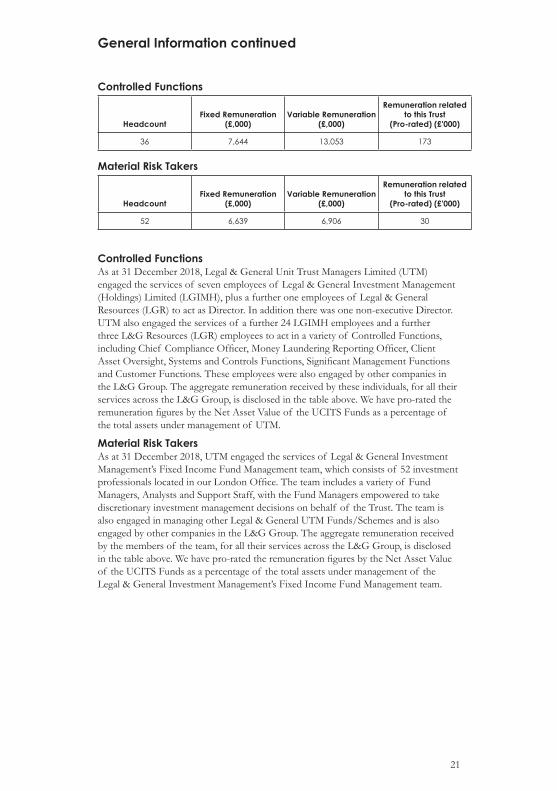
Controlled Functions
HeadcountFixed Remuneration
(£,000)Variable Remuneration
(£,000)
Remuneration related to this Trust
(Pro-rated) (£'000)
36 7,644 13,053 173
Material Risk Takers
HeadcountFixed Remuneration
(£,000)Variable Remuneration
(£,000)
Remuneration related to this Trust
(Pro-rated) (£'000)
52 6,639 6,906 30
Controlled FunctionsAs at 31 December 2018, Legal & General Unit Trust Managers Limited (UTM) engaged the services of seven employees of Legal & General Investment Management (Holdings) Limited (LGIMH), plus a further one employees of Legal & General Resources (LGR) to act as Director. In addition there was one non-executive Director. UTM also engaged the services of a further 24 LGIMH employees and a further three L&G Resources (LGR) employees to act in a variety of Controlled Functions, including Chief Compliance Officer, Money Laundering Reporting Officer, Client Asset Oversight, Systems and Controls Functions, Significant Management Functions and Customer Functions. These employees were also engaged by other companies in the L&G Group. The aggregate remuneration received by these individuals, for all their services across the L&G Group, is disclosed in the table above. We have pro-rated the remuneration figures by the Net Asset Value of the UCITS Funds as a percentage of the total assets under management of UTM.
Material Risk TakersAs at 31 December 2018, UTM engaged the services of Legal & General Investment Management’s Fixed Income Fund Management team, which consists of 52 investment professionals located in our London Office. The team includes a variety of Fund Managers, Analysts and Support Staff, with the Fund Managers empowered to take discretionary investment management decisions on behalf of the Trust. The team is also engaged in managing other Legal & General UTM Funds/Schemes and is also engaged by other companies in the L&G Group. The aggregate remuneration received by the members of the team, for all their services across the L&G Group, is disclosed in the table above. We have pro-rated the remuneration figures by the Net Asset Value of the UCITS Funds as a percentage of the total assets under management of the Legal & General Investment Management’s Fixed Income Fund Management team.

General Information continued
22
Significant ChangesChange in Investment Objective and PolicyIn line with the updated rules and guidance for the asset management industry published by the Financial Conduct Authority (FCA) in February 2019, we have clarified the Investment Objectives and Policies for our UK regulated funds.
The revised Investment Objective and Policy came into effect on 7 August 2019. The previous and revised Investment Objective and Policy are set out on page 2.
Publication of Short Report DiscontinuedWith effect from 7 September 2019, the Short Report for this Trust will no longer be issued.
General Information continued
23
Authorised Fund ManagerLegal & General (Unit Trust Managers) LimitedRegistered in England and Wales No. 01009418Registered office:One Coleman Street,London EC2R 5AATelephone: 0370 050 3350Authorised and regulated by the Financial Conduct Authority
Directors of the ManagerA. J. C. CravenS. Hynes H. MorrisseyH. SolomonL. W. TomsA. R. Toutounchi*M. J. Zinkula
*Non-executive Director
SecretaryJ. McCarthy
RegistrarLegal & General (Unit Trust Managers) LimitedP.O. Box 6080,Wolverhampton WV1 9RBAuthorised and regulated by the Financial Conduct Authority
Dealing: 0370 050 0956Enquiries: 0370 050 0955Registration: 0370 050 0955Call charges will vary. We may record and monitor calls.
Trustee Northern Trust Global Services SE UK BranchTrustee and Depositary Services50 Bank Street,Canary Wharf,London E14 5NT
Authorised by the Prudential Regulation Authority and regulated by the Financial Conduct Authority and the Prudential Regulation Authority
Independent AuditorsKPMG LLP 15 Canada Square,London E14 5GL
Investment AdviserLegal & General Investment Management LimitedOne Coleman Street,London EC2R 5AAAuthorised and regulated by the Financial Conduct Authority


Authorised and regulated by the Financial Conduct AuthorityLegal & General(Unit Trust Managers) LimitedRegistered in England and Wales No. 01009418Registered office:One Coleman Street,London EC2R 5AAwww.legalandgeneral.com