Embed Size (px)
Citation preview
Legal Immigration to California in 1999
This report highlights attributes of the immigrants granted legal permanent residence by the Immigration and Naturalization Service (INS) in 1999. A more complete analysis of recent immigrants is included in the companion report: They Came to California: Legal Immigration in 2000. Highlights of the 1999 Data:
Legal immigration to the United States was at the lowest level since 1988 due to an increasing delay in processing applications for legal permanent residence filed by persons already residing in the country.
California was home to the largest number (161,245 or 25 percent) of immigrants granted legal
permanent residence in 1999. New York, Florida, Texas, Illinois and New Jersey combined attracted 43 percent of the immigrants. These six magnet states accounted for over two-thirds of all immigrants.
Latin America and the Caribbean provided over half of the immigrants and over a third were born in
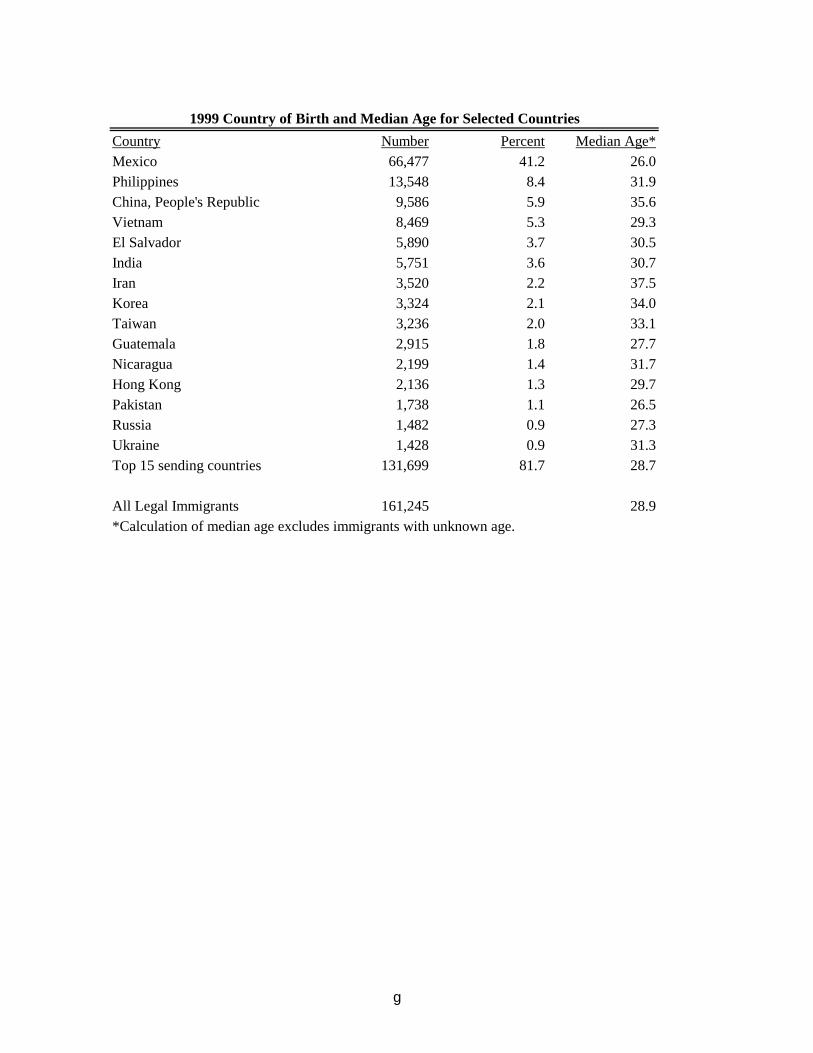
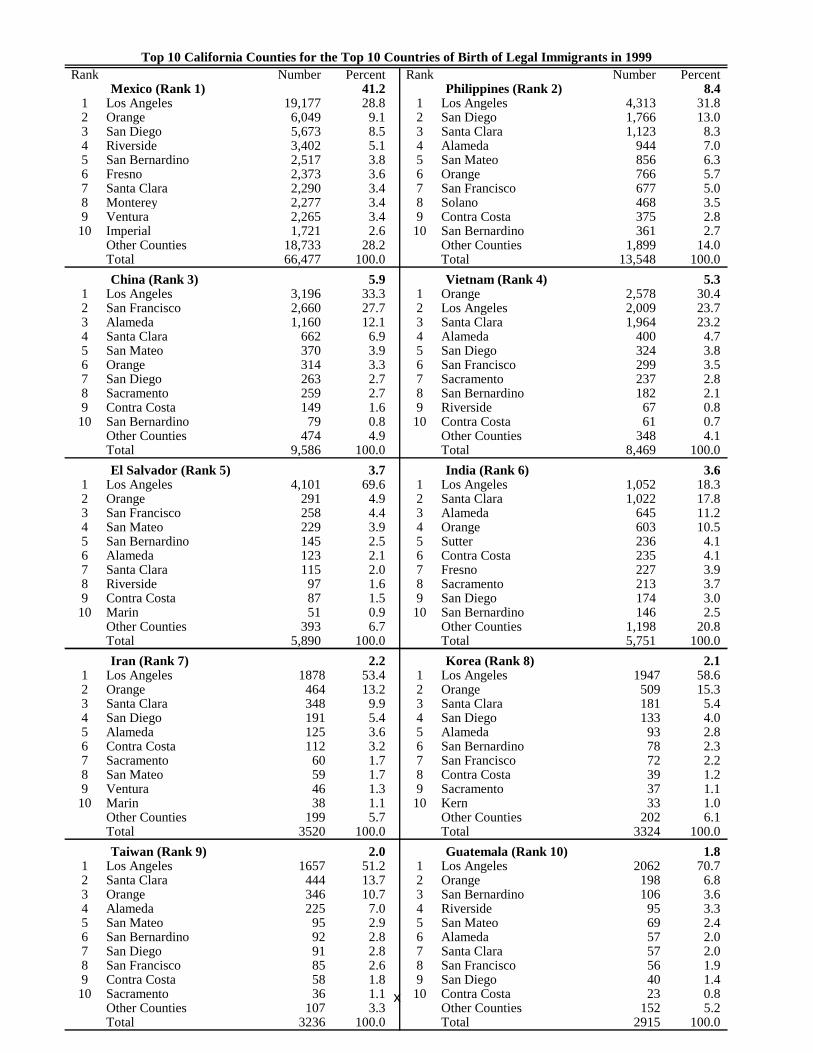
Asia. Ten countries contributed over 75 percent of the immigrants. Over 40 percent were born in Mexico. The next most prominent sending countries combined contributed another 35 percent of the total immigrants in 1999 (Philippines, China, Vietnam, El Salvador, India, Iran, Korea, Taiwan, and Guatemala).
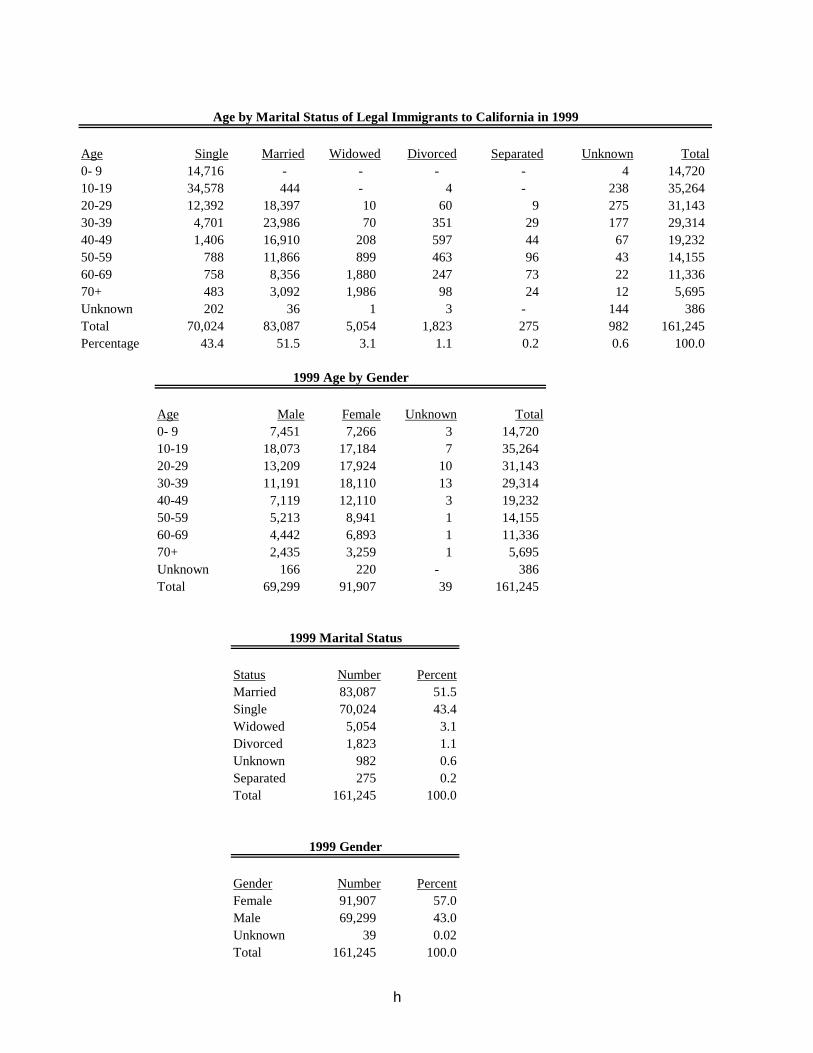
The majority of the new immigrants were married. And the majority, 57 percent, were female.
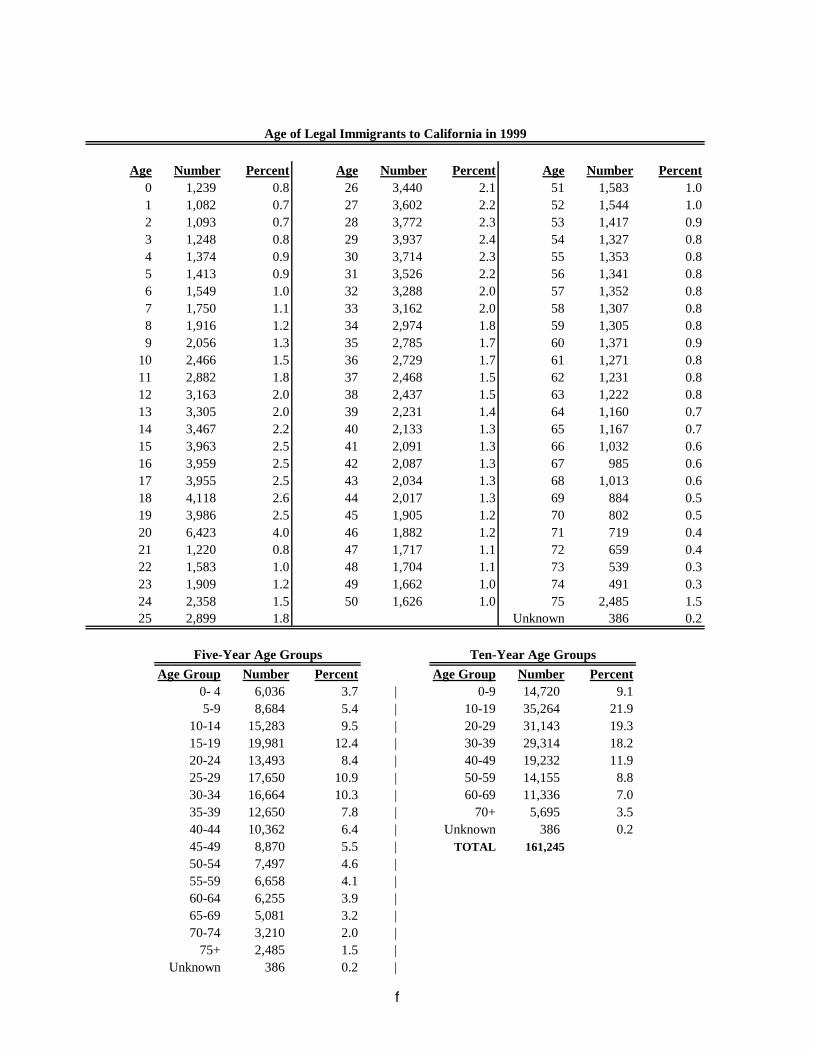
The median age was 28.9 years. More than one-third of the group was under 21 years old; most were in
the working ages, and about 10 percent were 60 years or older.
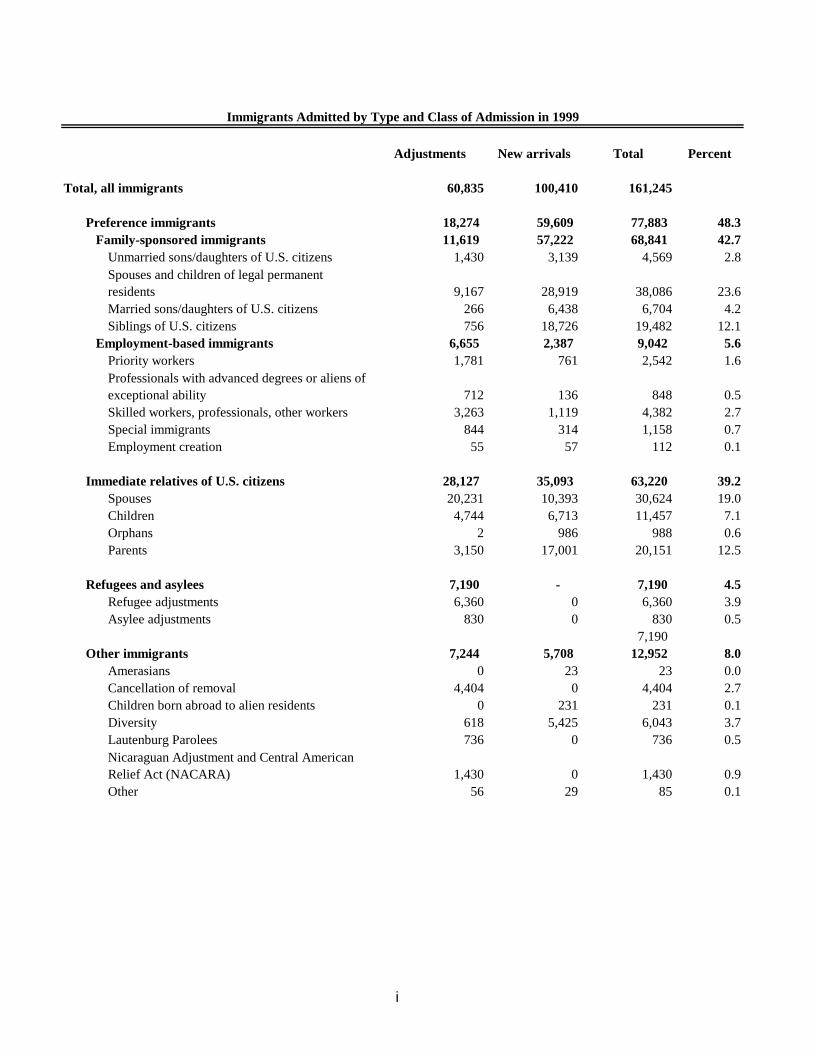
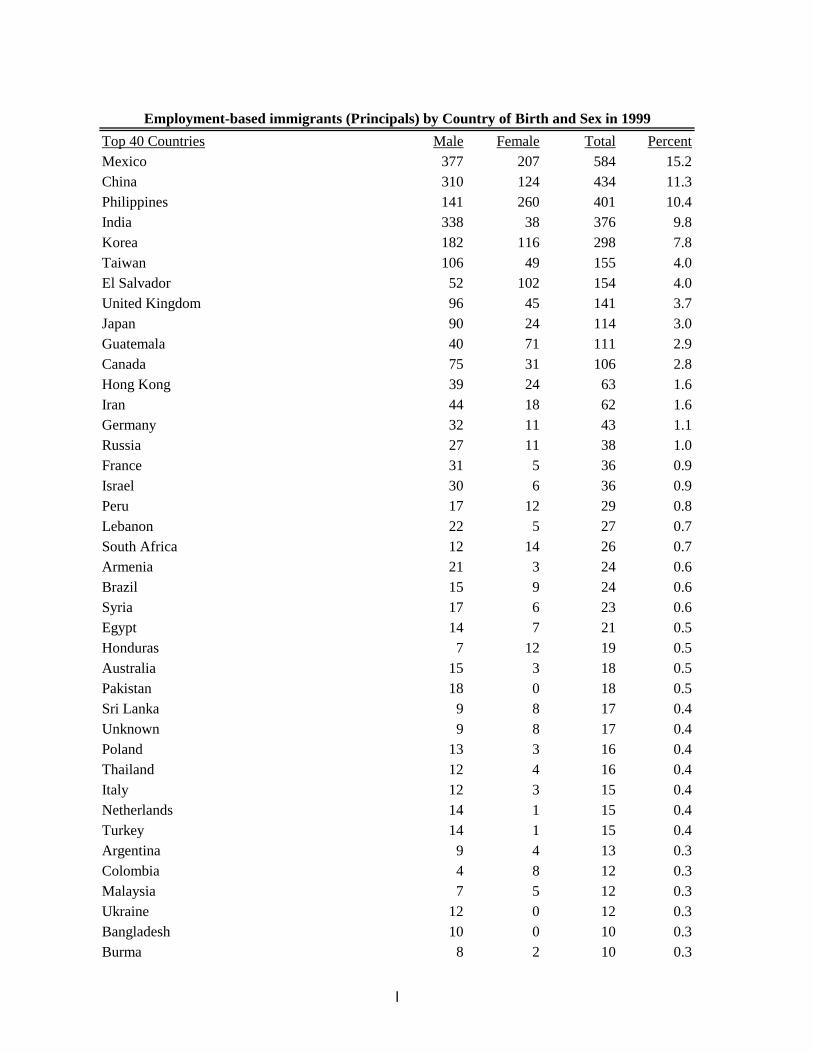
Over 80 percent of the immigrants were family members of U.S. citizens or legal permanent residents; about 6 percent were admitted based on employment preferences; 4 percent were refugees or asylees; and 8 percent were admitted in other categories.
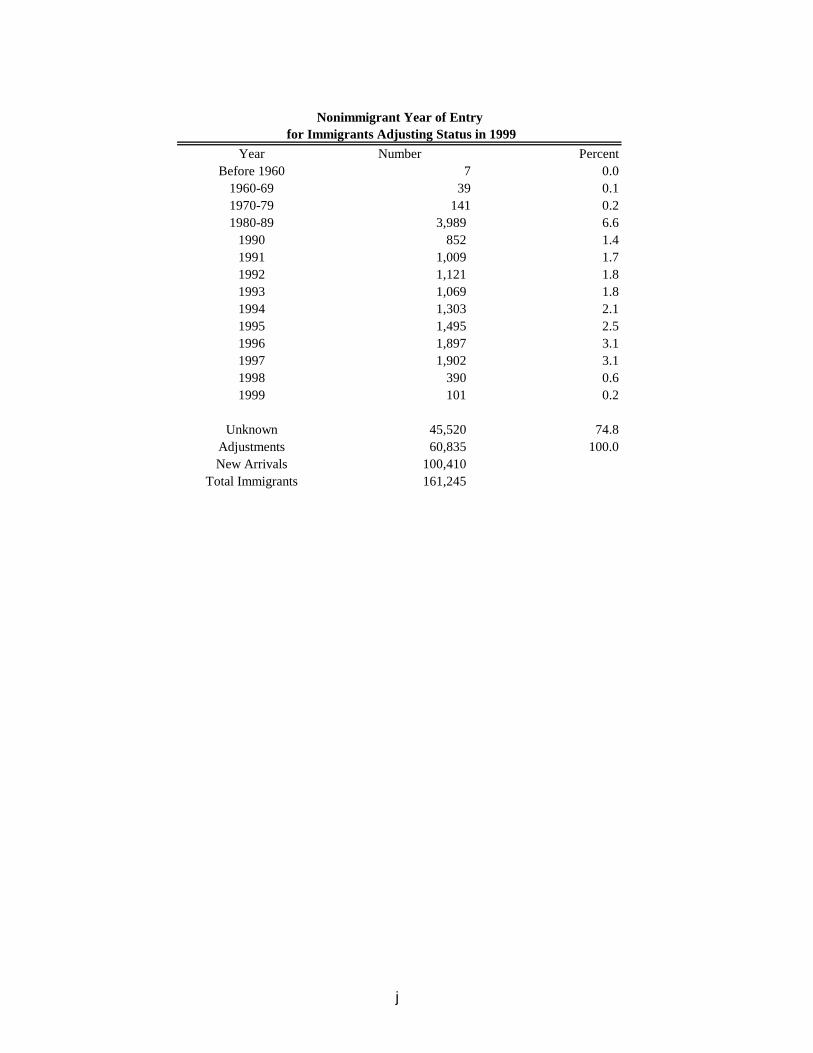
Over 60 percent of the 1999 immigrants were new arrivals to the United States while the remainder were
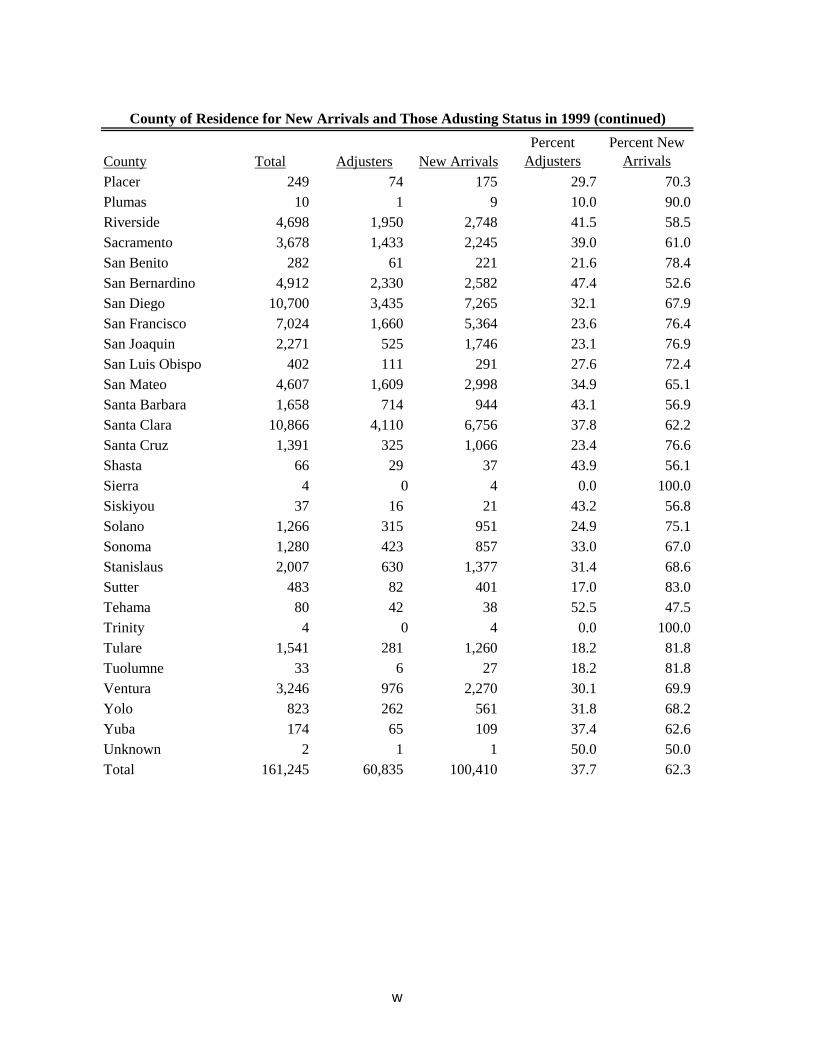
already living in the country (such as temporary workers and students) and adjusted their status with the INS. This is a notable difference from 2000 and 2001 immigrants who are more likely to be adjusting status following administrative backlogs in processing applications.
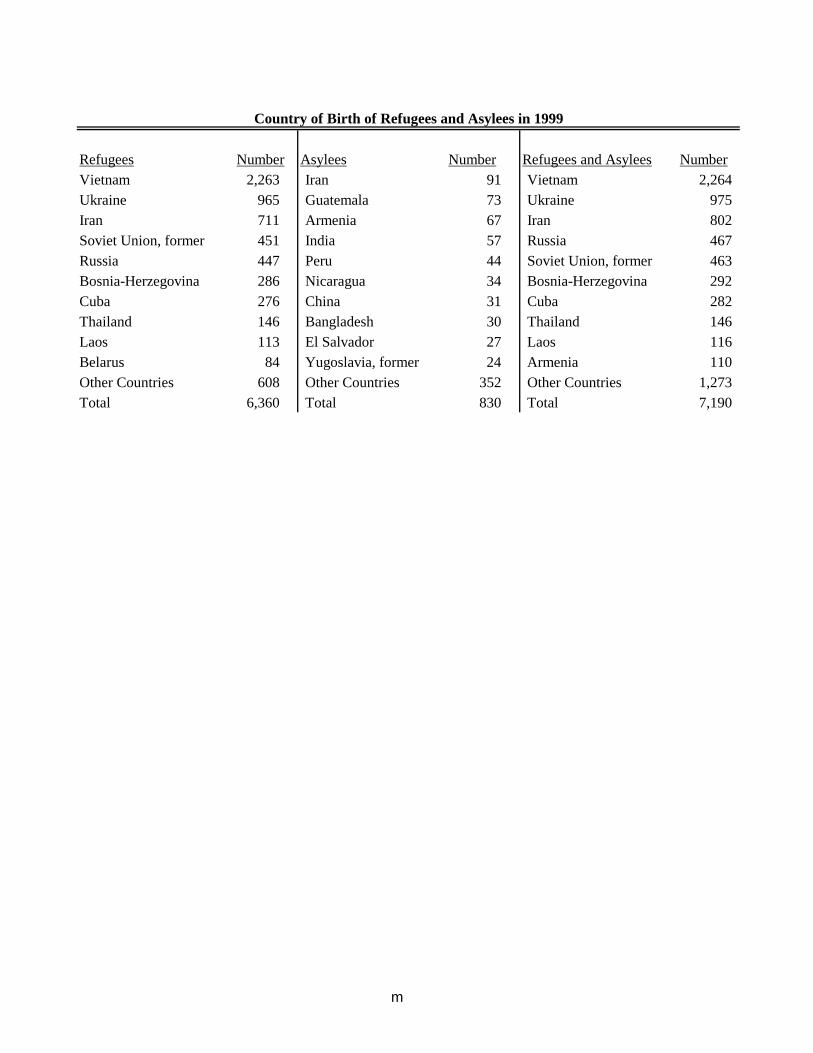
Almost 75 percent of the refugees and asylees settling in California were from Vietnam, Ukraine, Iran,
Russia, the former Soviet Union, and Bosnia-Herzegovina.
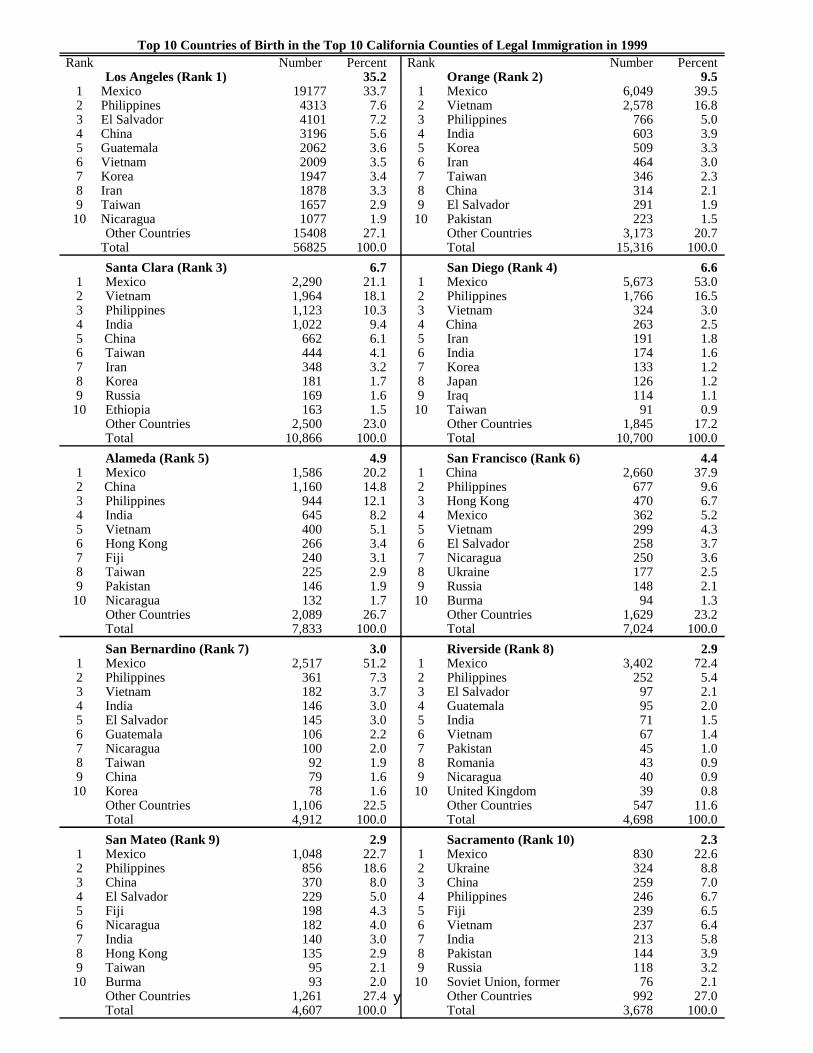
One-third of the immigrants settled in Los Angeles County; another one-third lived in Orange, Santa Clara, San Diego, Alameda and San Francisco counties.
2
List of Tables and Maps 1999 Immigrants
State of California Table 1. World Region of Birth.....................................................................................................a Table 2. Subregion of Birth ...........................................................................................................a Table 3. Country of Birth by World Region.............................................................................. b-c Table 4. Country of Birth Ranked by Country .......................................................................... d-e Table 5. Single Year of Age .......................................................................................................... f Table 6. Five-Year Age Groups..................................................................................................... f Table 7. Ten-Year Age Groups ..................................................................................................... f Table 8. Median Age .................................................................................................................... g Table 9. Age by Marital Status ..................................................................................................... h Table 10. Age by Gender................................................................................................................ h Table 11. Marital Status.................................................................................................................. h Table 12. Gender ............................................................................................................................ h Table 13. Type and Class of Admission.......................................................................................... i Table 14. Nonimmigrant Year of Entry........................................................................................... j Table 15. Occupation...................................................................................................................... k Table 16. Origins of Employment-based Immigrants ..................................................................... l Table 17. Origins of Refugees and Asylees................................................................................... m California Counties Table 18. Immigration Rates .......................................................................................................... n Table 19. Gender ......................................................................................................................... o-p Table 20. Immigrants Ranked by County....................................................................................... q Table 21. Age ............................................................................................................................... r-s Table 22. Marital Status................................................................................................................ t-u Table 23. New Arrivals and Adjusters ....................................................................................... v-w Table 24. Destinations of Immigrants from the Top 10 Countries ................................................. x Table 25. Immigrants to the Top 10 Destination Counties............................................................. y Sub-county Tables Table 26. Immigrants to Metropolitan Statistical Areas..................................................................z Table 27. California Cities with 1,000 or more Immigrants..........................................................aa
a
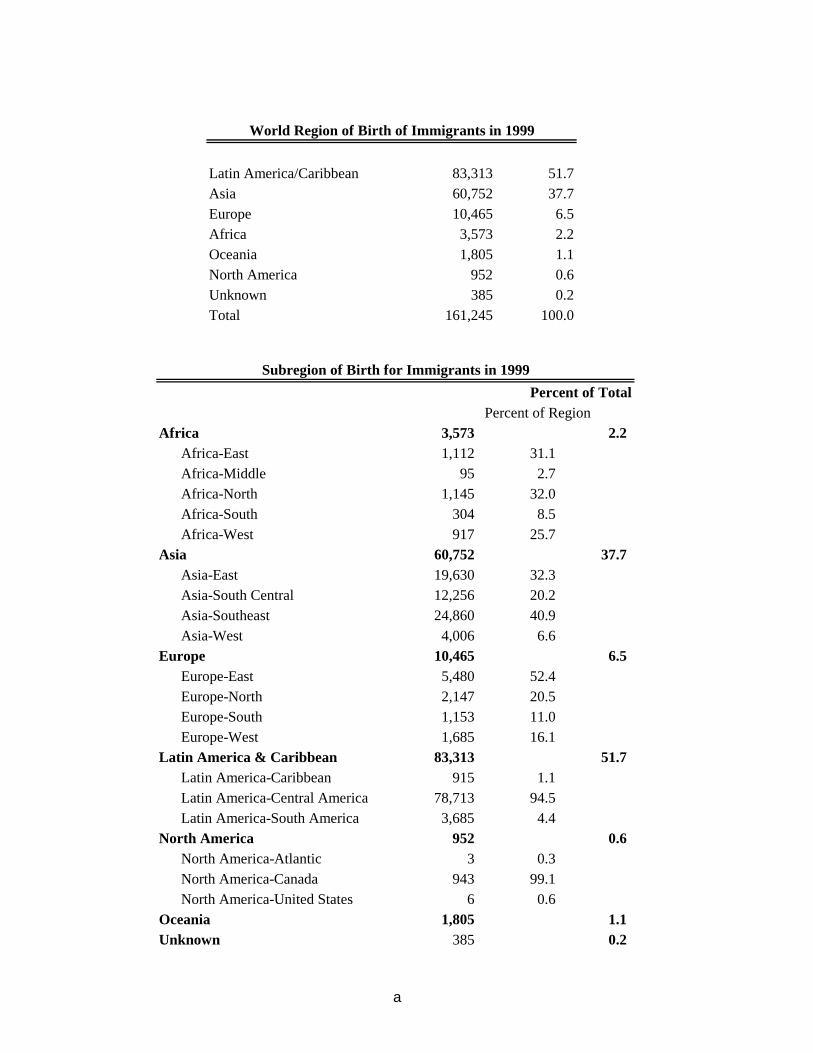
Latin America/Caribbean 83,313 51.7Asia 60,752 37.7Europe 10,465 6.5Africa 3,573 2.2Oceania 1,805 1.1North America 952 0.6Unknown 385 0.2Total 161,245 100.0
World Region of Birth of Immigrants in 1999
Percent of TotalPercent of Region
Africa 3,573 2.2 Africa-East 1,112 31.1 Africa-Middle 95 2.7 Africa-North 1,145 32.0 Africa-South 304 8.5 Africa-West 917 25.7
Asia 60,752 37.7 Asia-East 19,630 32.3 Asia-South Central 12,256 20.2 Asia-Southeast 24,860 40.9 Asia-West 4,006 6.6
Europe 10,465 6.5 Europe-East 5,480 52.4 Europe-North 2,147 20.5 Europe-South 1,153 11.0 Europe-West 1,685 16.1
Latin America & Caribbean 83,313 51.7 Latin America-Caribbean 915 1.1 Latin America-Central America 78,713 94.5 Latin America-South America 3,685 4.4
North America 952 0.6 North America-Atlantic 3 0.3 North America-Canada 943 99.1 North America-United States 6 0.6
Oceania 1,805 1.1 Unknown 385 0.2
Subregion of Birth for Immigrants in 1999
b
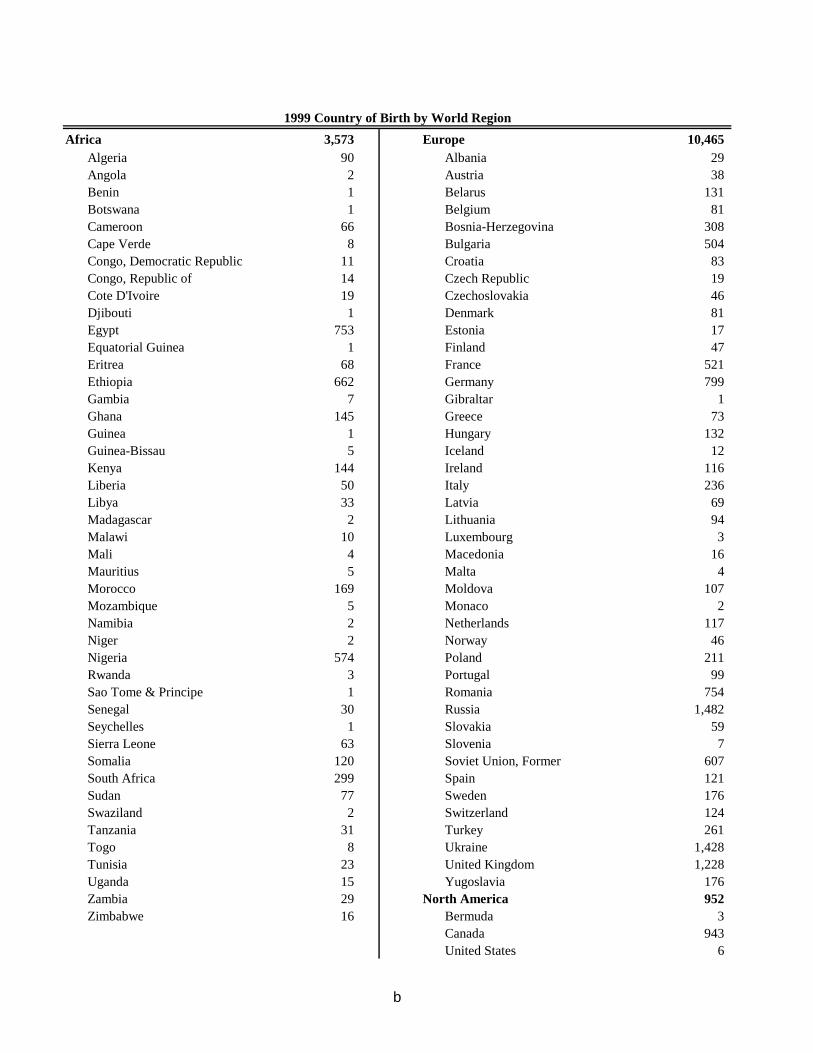
Africa 3,573 Europe 10,465 Algeria 90 Albania 29 Angola 2 Austria 38 Benin 1 Belarus 131 Botswana 1 Belgium 81 Cameroon 66 Bosnia-Herzegovina 308 Cape Verde 8 Bulgaria 504 Congo, Democratic Republic 11 Croatia 83 Congo, Republic of 14 Czech Republic 19 Cote D'Ivoire 19 Czechoslovakia 46 Djibouti 1 Denmark 81 Egypt 753 Estonia 17 Equatorial Guinea 1 Finland 47 Eritrea 68 France 521 Ethiopia 662 Germany 799 Gambia 7 Gibraltar 1 Ghana 145 Greece 73 Guinea 1 Hungary 132 Guinea-Bissau 5 Iceland 12 Kenya 144 Ireland 116 Liberia 50 Italy 236 Libya 33 Latvia 69 Madagascar 2 Lithuania 94 Malawi 10 Luxembourg 3 Mali 4 Macedonia 16 Mauritius 5 Malta 4 Morocco 169 Moldova 107 Mozambique 5 Monaco 2 Namibia 2 Netherlands 117 Niger 2 Norway 46 Nigeria 574 Poland 211 Rwanda 3 Portugal 99 Sao Tome & Principe 1 Romania 754 Senegal 30 Russia 1,482 Seychelles 1 Slovakia 59 Sierra Leone 63 Slovenia 7 Somalia 120 Soviet Union, Former 607 South Africa 299 Spain 121 Sudan 77 Sweden 176 Swaziland 2 Switzerland 124 Tanzania 31 Turkey 261 Togo 8 Ukraine 1,428 Tunisia 23 United Kingdom 1,228 Uganda 15 Yugoslavia 176 Zambia 29 North America 952 Zimbabwe 16 Bermuda 3
Canada 943 United States 6
1999 Country of Birth by World Region
c
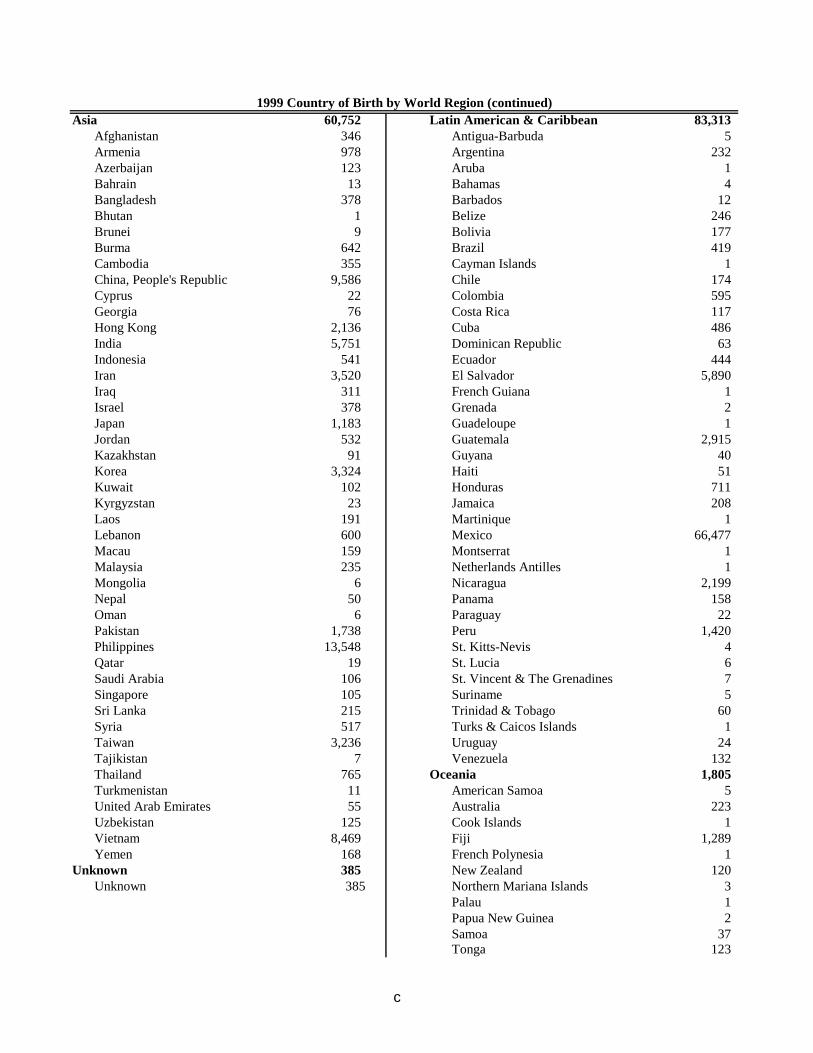
Asia 60,752 Latin American & Caribbean 83,313 Afghanistan 346 Antigua-Barbuda 5 Armenia 978 Argentina 232 Azerbaijan 123 Aruba 1 Bahrain 13 Bahamas 4 Bangladesh 378 Barbados 12 Bhutan 1 Belize 246 Brunei 9 Bolivia 177 Burma 642 Brazil 419 Cambodia 355 Cayman Islands 1 China, People's Republic 9,586 Chile 174 Cyprus 22 Colombia 595 Georgia 76 Costa Rica 117 Hong Kong 2,136 Cuba 486 India 5,751 Dominican Republic 63 Indonesia 541 Ecuador 444 Iran 3,520 El Salvador 5,890 Iraq 311 French Guiana 1 Israel 378 Grenada 2 Japan 1,183 Guadeloupe 1 Jordan 532 Guatemala 2,915 Kazakhstan 91 Guyana 40 Korea 3,324 Haiti 51 Kuwait 102 Honduras 711 Kyrgyzstan 23 Jamaica 208 Laos 191 Martinique 1 Lebanon 600 Mexico 66,477 Macau 159 Montserrat 1 Malaysia 235 Netherlands Antilles 1 Mongolia 6 Nicaragua 2,199 Nepal 50 Panama 158 Oman 6 Paraguay 22 Pakistan 1,738 Peru 1,420 Philippines 13,548 St. Kitts-Nevis 4 Qatar 19 St. Lucia 6 Saudi Arabia 106 St. Vincent & The Grenadines 7 Singapore 105 Suriname 5 Sri Lanka 215 Trinidad & Tobago 60 Syria 517 Turks & Caicos Islands 1 Taiwan 3,236 Uruguay 24 Tajikistan 7 Venezuela 132 Thailand 765 Oceania 1,805 Turkmenistan 11 American Samoa 5 United Arab Emirates 55 Australia 223 Uzbekistan 125 Cook Islands 1 Vietnam 8,469 Fiji 1,289 Yemen 168 French Polynesia 1
Unknown 385 New Zealand 120 Unknown 385 Northern Mariana Islands 3
Palau 1 Papua New Guinea 2 Samoa 37 Tonga 123
1999 Country of Birth by World Region (continued)
d
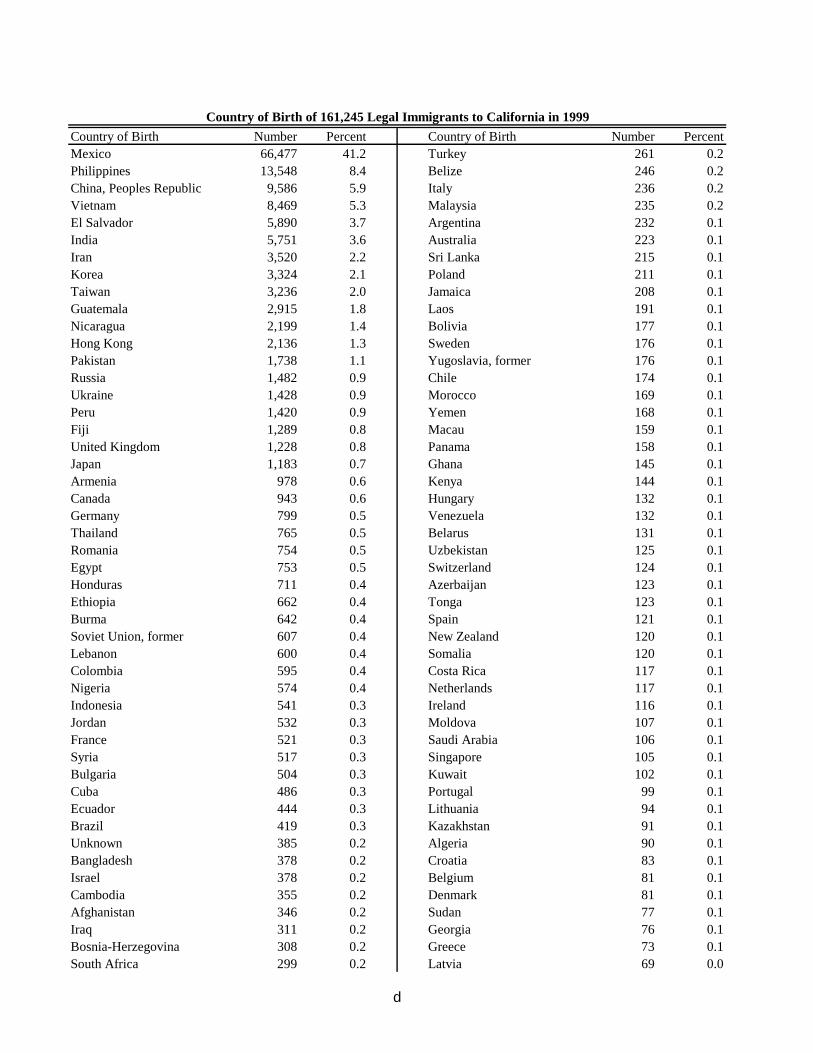
Country of Birth Number Percent Country of Birth Number PercentMexico 66,477 41.2 Turkey 261 0.2Philippines 13,548 8.4 Belize 246 0.2China, Peoples Republic 9,586 5.9 Italy 236 0.2Vietnam 8,469 5.3 Malaysia 235 0.2El Salvador 5,890 3.7 Argentina 232 0.1India 5,751 3.6 Australia 223 0.1Iran 3,520 2.2 Sri Lanka 215 0.1Korea 3,324 2.1 Poland 211 0.1Taiwan 3,236 2.0 Jamaica 208 0.1Guatemala 2,915 1.8 Laos 191 0.1Nicaragua 2,199 1.4 Bolivia 177 0.1Hong Kong 2,136 1.3 Sweden 176 0.1Pakistan 1,738 1.1 Yugoslavia, former 176 0.1Russia 1,482 0.9 Chile 174 0.1Ukraine 1,428 0.9 Morocco 169 0.1Peru 1,420 0.9 Yemen 168 0.1Fiji 1,289 0.8 Macau 159 0.1United Kingdom 1,228 0.8 Panama 158 0.1Japan 1,183 0.7 Ghana 145 0.1Armenia 978 0.6 Kenya 144 0.1Canada 943 0.6 Hungary 132 0.1Germany 799 0.5 Venezuela 132 0.1Thailand 765 0.5 Belarus 131 0.1Romania 754 0.5 Uzbekistan 125 0.1Egypt 753 0.5 Switzerland 124 0.1Honduras 711 0.4 Azerbaijan 123 0.1Ethiopia 662 0.4 Tonga 123 0.1Burma 642 0.4 Spain 121 0.1Soviet Union, former 607 0.4 New Zealand 120 0.1Lebanon 600 0.4 Somalia 120 0.1Colombia 595 0.4 Costa Rica 117 0.1Nigeria 574 0.4 Netherlands 117 0.1Indonesia 541 0.3 Ireland 116 0.1Jordan 532 0.3 Moldova 107 0.1France 521 0.3 Saudi Arabia 106 0.1Syria 517 0.3 Singapore 105 0.1Bulgaria 504 0.3 Kuwait 102 0.1Cuba 486 0.3 Portugal 99 0.1Ecuador 444 0.3 Lithuania 94 0.1Brazil 419 0.3 Kazakhstan 91 0.1Unknown 385 0.2 Algeria 90 0.1Bangladesh 378 0.2 Croatia 83 0.1Israel 378 0.2 Belgium 81 0.1Cambodia 355 0.2 Denmark 81 0.1Afghanistan 346 0.2 Sudan 77 0.1Iraq 311 0.2 Georgia 76 0.1Bosnia-Herzegovina 308 0.2 Greece 73 0.1South Africa 299 0.2 Latvia 69 0.0
Country of Birth of 161,245 Legal Immigrants to California in 1999
e
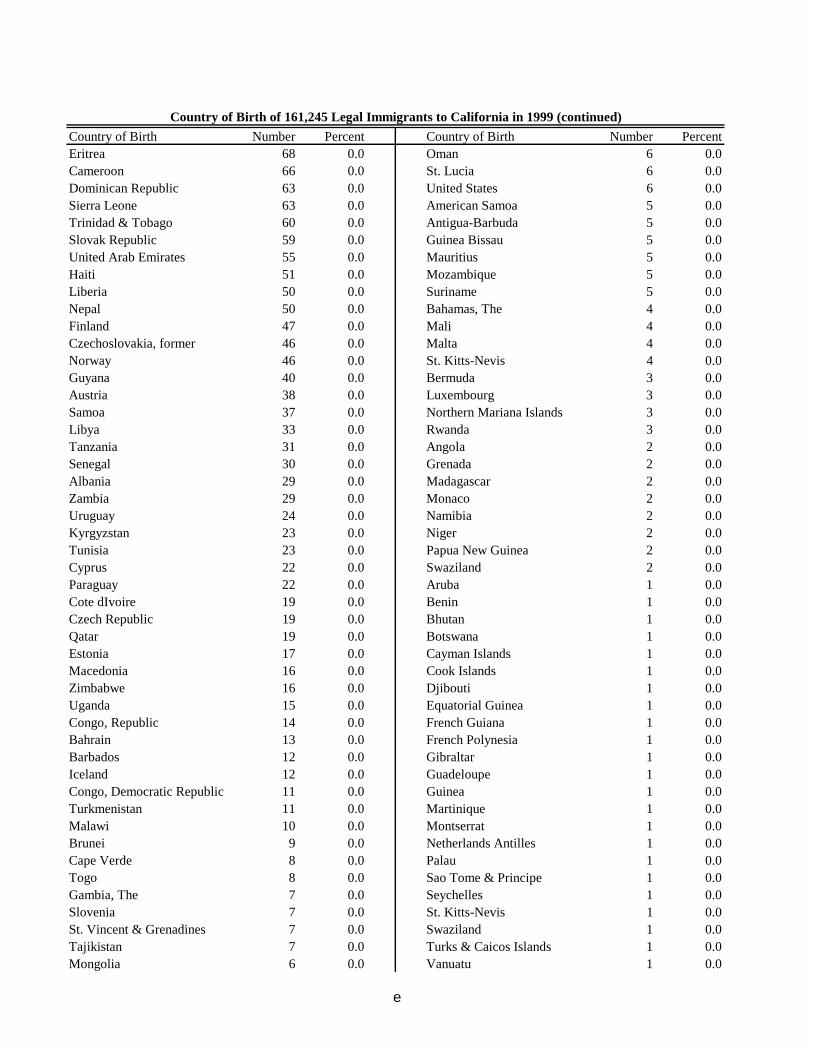
Country of Birth Number Percent Country of Birth Number PercentEritrea 68 0.0 Oman 6 0.0Cameroon 66 0.0 St. Lucia 6 0.0Dominican Republic 63 0.0 United States 6 0.0Sierra Leone 63 0.0 American Samoa 5 0.0Trinidad & Tobago 60 0.0 Antigua-Barbuda 5 0.0Slovak Republic 59 0.0 Guinea Bissau 5 0.0United Arab Emirates 55 0.0 Mauritius 5 0.0Haiti 51 0.0 Mozambique 5 0.0Liberia 50 0.0 Suriname 5 0.0Nepal 50 0.0 Bahamas, The 4 0.0Finland 47 0.0 Mali 4 0.0Czechoslovakia, former 46 0.0 Malta 4 0.0Norway 46 0.0 St. Kitts-Nevis 4 0.0Guyana 40 0.0 Bermuda 3 0.0Austria 38 0.0 Luxembourg 3 0.0Samoa 37 0.0 Northern Mariana Islands 3 0.0Libya 33 0.0 Rwanda 3 0.0Tanzania 31 0.0 Angola 2 0.0Senegal 30 0.0 Grenada 2 0.0Albania 29 0.0 Madagascar 2 0.0Zambia 29 0.0 Monaco 2 0.0Uruguay 24 0.0 Namibia 2 0.0Kyrgyzstan 23 0.0 Niger 2 0.0Tunisia 23 0.0 Papua New Guinea 2 0.0Cyprus 22 0.0 Swaziland 2 0.0Paraguay 22 0.0 Aruba 1 0.0Cote dIvoire 19 0.0 Benin 1 0.0Czech Republic 19 0.0 Bhutan 1 0.0Qatar 19 0.0 Botswana 1 0.0Estonia 17 0.0 Cayman Islands 1 0.0Macedonia 16 0.0 Cook Islands 1 0.0Zimbabwe 16 0.0 Djibouti 1 0.0Uganda 15 0.0 Equatorial Guinea 1 0.0Congo, Republic 14 0.0 French Guiana 1 0.0Bahrain 13 0.0 French Polynesia 1 0.0Barbados 12 0.0 Gibraltar 1 0.0Iceland 12 0.0 Guadeloupe 1 0.0Congo, Democratic Republic 11 0.0 Guinea 1 0.0Turkmenistan 11 0.0 Martinique 1 0.0Malawi 10 0.0 Montserrat 1 0.0Brunei 9 0.0 Netherlands Antilles 1 0.0Cape Verde 8 0.0 Palau 1 0.0Togo 8 0.0 Sao Tome & Principe 1 0.0Gambia, The 7 0.0 Seychelles 1 0.0Slovenia 7 0.0 St. Kitts-Nevis 1 0.0St. Vincent & Grenadines 7 0.0 Swaziland 1 0.0Tajikistan 7 0.0 Turks & Caicos Islands 1 0.0Mongolia 6 0.0 Vanuatu 1 0.0
Country of Birth of 161,245 Legal Immigrants to California in 1999 (continued)
f
Age Number Percent Age Number Percent Age Number Percent0 1,239 0.8 26 3,440 2.1 51 1,583 1.01 1,082 0.7 27 3,602 2.2 52 1,544 1.02 1,093 0.7 28 3,772 2.3 53 1,417 0.93 1,248 0.8 29 3,937 2.4 54 1,327 0.84 1,374 0.9 30 3,714 2.3 55 1,353 0.85 1,413 0.9 31 3,526 2.2 56 1,341 0.86 1,549 1.0 32 3,288 2.0 57 1,352 0.87 1,750 1.1 33 3,162 2.0 58 1,307 0.88 1,916 1.2 34 2,974 1.8 59 1,305 0.89 2,056 1.3 35 2,785 1.7 60 1,371 0.9
10 2,466 1.5 36 2,729 1.7 61 1,271 0.811 2,882 1.8 37 2,468 1.5 62 1,231 0.812 3,163 2.0 38 2,437 1.5 63 1,222 0.813 3,305 2.0 39 2,231 1.4 64 1,160 0.714 3,467 2.2 40 2,133 1.3 65 1,167 0.715 3,963 2.5 41 2,091 1.3 66 1,032 0.616 3,959 2.5 42 2,087 1.3 67 985 0.617 3,955 2.5 43 2,034 1.3 68 1,013 0.618 4,118 2.6 44 2,017 1.3 69 884 0.519 3,986 2.5 45 1,905 1.2 70 802 0.520 6,423 4.0 46 1,882 1.2 71 719 0.421 1,220 0.8 47 1,717 1.1 72 659 0.422 1,583 1.0 48 1,704 1.1 73 539 0.323 1,909 1.2 49 1,662 1.0 74 491 0.324 2,358 1.5 50 1,626 1.0 75 2,485 1.525 2,899 1.8 Unknown 386 0.2
Number Percent Number Percent0- 4 6,036 3.7 | 0-9 14,720 9.15-9 8,684 5.4 | 10-19 35,264 21.9
10-14 15,283 9.5 | 20-29 31,143 19.315-19 19,981 12.4 | 30-39 29,314 18.220-24 13,493 8.4 | 40-49 19,232 11.925-29 17,650 10.9 | 50-59 14,155 8.830-34 16,664 10.3 | 60-69 11,336 7.035-39 12,650 7.8 | 70+ 5,695 3.540-44 10,362 6.4 | Unknown 386 0.245-49 8,870 5.5 | TOTAL 161,24550-54 7,497 4.6 |55-59 6,658 4.1 |60-64 6,255 3.9 |65-69 5,081 3.2 |70-74 3,210 2.0 |
75+ 2,485 1.5 |Unknown 386 0.2 |
Age of Legal Immigrants to California in 1999
Age Group Age GroupFive-Year Age Groups Ten-Year Age Groups
g
Country Number Percent Median Age*Mexico 66,477 41.2 26.0Philippines 13,548 8.4 31.9China, People's Republic 9,586 5.9 35.6Vietnam 8,469 5.3 29.3El Salvador 5,890 3.7 30.5India 5,751 3.6 30.7Iran 3,520 2.2 37.5Korea 3,324 2.1 34.0Taiwan 3,236 2.0 33.1Guatemala 2,915 1.8 27.7Nicaragua 2,199 1.4 31.7Hong Kong 2,136 1.3 29.7Pakistan 1,738 1.1 26.5Russia 1,482 0.9 27.3Ukraine 1,428 0.9 31.3Top 15 sending countries 131,699 81.7 28.7
All Legal Immigrants 161,245 28.9*Calculation of median age excludes immigrants with unknown age.
1999 Country of Birth and Median Age for Selected Countries
h
Age Single Married Widowed Divorced Separated Unknown Total0- 9 14,716 - - - - 4 14,720 10-19 34,578 444 - 4 - 238 35,264 20-29 12,392 18,397 10 60 9 275 31,143 30-39 4,701 23,986 70 351 29 177 29,314 40-49 1,406 16,910 208 597 44 67 19,232 50-59 788 11,866 899 463 96 43 14,155 60-69 758 8,356 1,880 247 73 22 11,336 70+ 483 3,092 1,986 98 24 12 5,695 Unknown 202 36 1 3 - 144 386 Total 70,024 83,087 5,054 1,823 275 982 161,245 Percentage 43.4 51.5 3.1 1.1 0.2 0.6 100.0
Age Male Female Unknown Total0- 9 7,451 7,266 3 14,720 10-19 18,073 17,184 7 35,264 20-29 13,209 17,924 10 31,143 30-39 11,191 18,110 13 29,314 40-49 7,119 12,110 3 19,232 50-59 5,213 8,941 1 14,155 60-69 4,442 6,893 1 11,336 70+ 2,435 3,259 1 5,695 Unknown 166 220 - 386 Total 69,299 91,907 39 161,245
1999 Marital Status
Status Number PercentMarried 83,087 51.5Single 70,024 43.4Widowed 5,054 3.1Divorced 1,823 1.1Unknown 982 0.6Separated 275 0.2Total 161,245 100.0
Gender Number PercentFemale 91,907 57.0Male 69,299 43.0Unknown 39 0.02Total 161,245 100.0
1999 Age by Gender
1999 Gender
Age by Marital Status of Legal Immigrants to California in 1999
i
Adjustments New arrivals Total Percent
Total, all immigrants 60,835 100,410 161,245
Preference immigrants 18,274 59,609 77,883 48.3 Family-sponsored immigrants 11,619 57,222 68,841 42.7
Unmarried sons/daughters of U.S. citizens 1,430 3,139 4,569 2.8Spouses and children of legal permanent residents 9,167 28,919 38,086 23.6Married sons/daughters of U.S. citizens 266 6,438 6,704 4.2Siblings of U.S. citizens 756 18,726 19,482 12.1
Employment-based immigrants 6,655 2,387 9,042 5.6Priority workers 1,781 761 2,542 1.6Professionals with advanced degrees or aliens of exceptional ability 712 136 848 0.5Skilled workers, professionals, other workers 3,263 1,119 4,382 2.7Special immigrants 844 314 1,158 0.7Employment creation 55 57 112 0.1
Immediate relatives of U.S. citizens 28,127 35,093 63,220 39.2Spouses 20,231 10,393 30,624 19.0Children 4,744 6,713 11,457 7.1Orphans 2 986 988 0.6Parents 3,150 17,001 20,151 12.5
Refugees and asylees 7,190 - 7,190 4.5Refugee adjustments 6,360 0 6,360 3.9Asylee adjustments 830 0 830 0.5
7,190 Other immigrants 7,244 5,708 12,952 8.0
Amerasians 0 23 23 0.0Cancellation of removal 4,404 0 4,404 2.7Children born abroad to alien residents 0 231 231 0.1Diversity 618 5,425 6,043 3.7Lautenburg Parolees 736 0 736 0.5Nicaraguan Adjustment and Central American Relief Act (NACARA) 1,430 0 1,430 0.9Other 56 29 85 0.1
Immigrants Admitted by Type and Class of Admission in 1999
j
Year Number PercentBefore 1960 7 0.0
1960-69 39 0.11970-79 141 0.21980-89 3,989 6.6
1990 852 1.41991 1,009 1.71992 1,121 1.81993 1,069 1.81994 1,303 2.11995 1,495 2.51996 1,897 3.11997 1,902 3.11998 390 0.61999 101 0.2
Unknown 45,520 74.8Adjustments 60,835 100.0New Arrivals 100,410
Total Immigrants 161,245
Nonimmigrant Year of Entry for Immigrants Adjusting Status in 1999
k
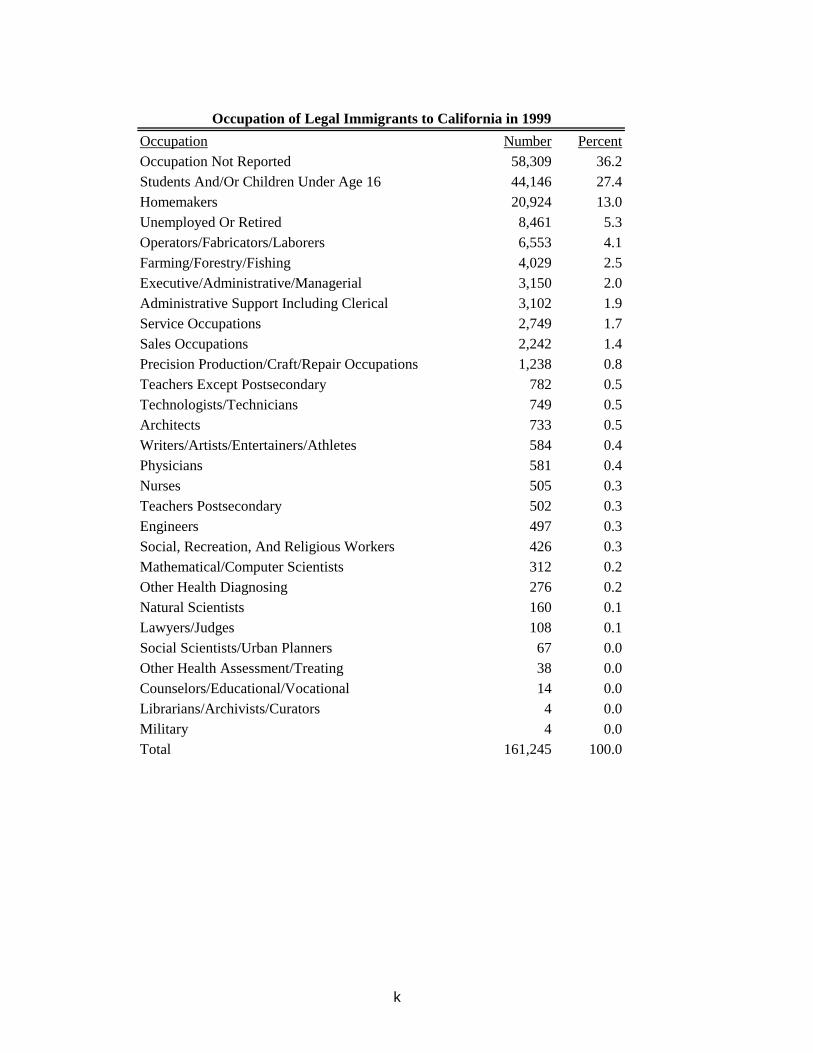
Occupation Number PercentOccupation Not Reported 58,309 36.2Students And/Or Children Under Age 16 44,146 27.4Homemakers 20,924 13.0Unemployed Or Retired 8,461 5.3Operators/Fabricators/Laborers 6,553 4.1Farming/Forestry/Fishing 4,029 2.5Executive/Administrative/Managerial 3,150 2.0Administrative Support Including Clerical 3,102 1.9Service Occupations 2,749 1.7Sales Occupations 2,242 1.4Precision Production/Craft/Repair Occupations 1,238 0.8Teachers Except Postsecondary 782 0.5Technologists/Technicians 749 0.5Architects 733 0.5Writers/Artists/Entertainers/Athletes 584 0.4Physicians 581 0.4Nurses 505 0.3Teachers Postsecondary 502 0.3Engineers 497 0.3Social, Recreation, And Religious Workers 426 0.3Mathematical/Computer Scientists 312 0.2Other Health Diagnosing 276 0.2Natural Scientists 160 0.1Lawyers/Judges 108 0.1Social Scientists/Urban Planners 67 0.0Other Health Assessment/Treating 38 0.0Counselors/Educational/Vocational 14 0.0Librarians/Archivists/Curators 4 0.0Military 4 0.0Total 161,245 100.0
Occupation of Legal Immigrants to California in 1999
l
Top 40 Countries Male Female Total PercentMexico 377 207 584 15.2China 310 124 434 11.3Philippines 141 260 401 10.4India 338 38 376 9.8Korea 182 116 298 7.8Taiwan 106 49 155 4.0El Salvador 52 102 154 4.0United Kingdom 96 45 141 3.7Japan 90 24 114 3.0Guatemala 40 71 111 2.9Canada 75 31 106 2.8Hong Kong 39 24 63 1.6Iran 44 18 62 1.6Germany 32 11 43 1.1Russia 27 11 38 1.0France 31 5 36 0.9Israel 30 6 36 0.9Peru 17 12 29 0.8Lebanon 22 5 27 0.7South Africa 12 14 26 0.7Armenia 21 3 24 0.6Brazil 15 9 24 0.6Syria 17 6 23 0.6Egypt 14 7 21 0.5Honduras 7 12 19 0.5Australia 15 3 18 0.5Pakistan 18 0 18 0.5Sri Lanka 9 8 17 0.4Unknown 9 8 17 0.4Poland 13 3 16 0.4Thailand 12 4 16 0.4Italy 12 3 15 0.4Netherlands 14 1 15 0.4Turkey 14 1 15 0.4Argentina 9 4 13 0.3Colombia 4 8 12 0.3Malaysia 7 5 12 0.3Ukraine 12 0 12 0.3Bangladesh 10 0 10 0.3Burma 8 2 10 0.3
Employment-based immigrants (Principals) by Country of Birth and Sex in 1999
m
Refugees Number Asylees Number Refugees and Asylees NumberVietnam 2,263 Iran 91 Vietnam 2,264 Ukraine 965 Guatemala 73 Ukraine 975 Iran 711 Armenia 67 Iran 802 Soviet Union, former 451 India 57 Russia 467 Russia 447 Peru 44 Soviet Union, former 463 Bosnia-Herzegovina 286 Nicaragua 34 Bosnia-Herzegovina 292 Cuba 276 China 31 Cuba 282 Thailand 146 Bangladesh 30 Thailand 146 Laos 113 El Salvador 27 Laos 116 Belarus 84 Yugoslavia, former 24 Armenia 110 Other Countries 608 Other Countries 352 Other Countries 1,273 Total 6,360 Total 830 Total 7,190
Country of Birth of Refugees and Asylees in 1999
n
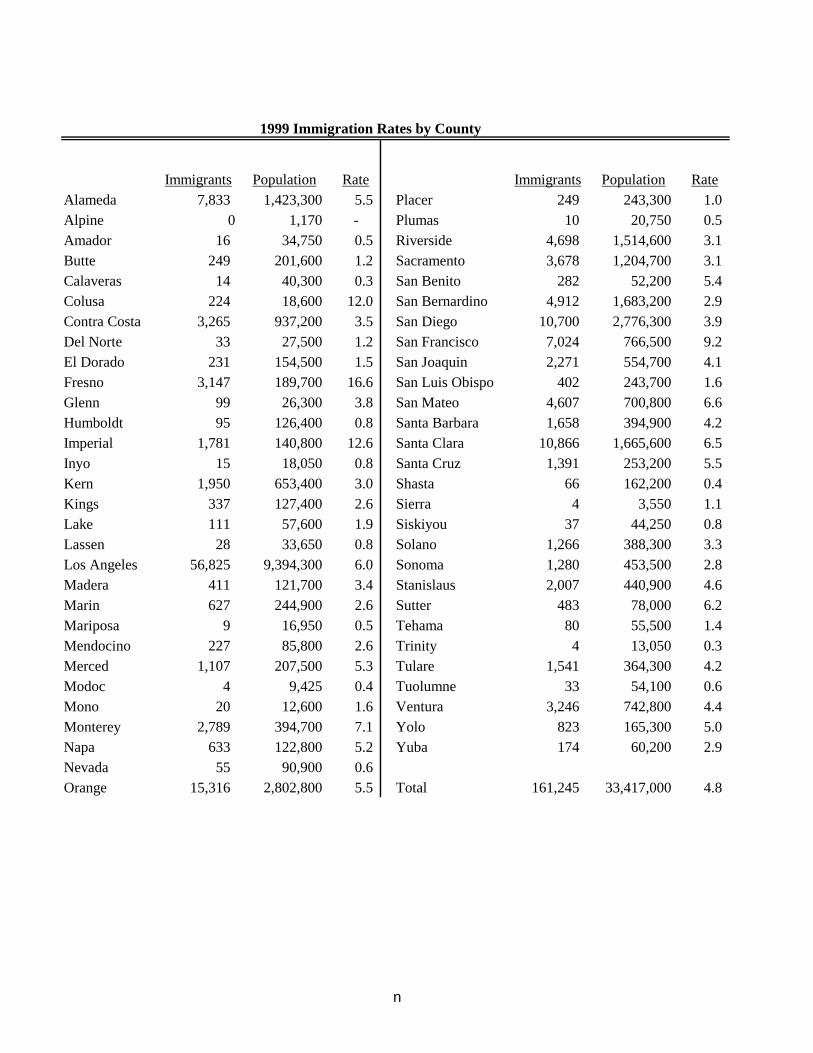
Immigrants Population Rate Immigrants Population RateAlameda 7,833 1,423,300 5.5 Placer 249 243,300 1.0 Alpine 0 1,170 - Plumas 10 20,750 0.5 Amador 16 34,750 0.5 Riverside 4,698 1,514,600 3.1 Butte 249 201,600 1.2 Sacramento 3,678 1,204,700 3.1 Calaveras 14 40,300 0.3 San Benito 282 52,200 5.4 Colusa 224 18,600 12.0 San Bernardino 4,912 1,683,200 2.9 Contra Costa 3,265 937,200 3.5 San Diego 10,700 2,776,300 3.9 Del Norte 33 27,500 1.2 San Francisco 7,024 766,500 9.2 El Dorado 231 154,500 1.5 San Joaquin 2,271 554,700 4.1 Fresno 3,147 189,700 16.6 San Luis Obispo 402 243,700 1.6 Glenn 99 26,300 3.8 San Mateo 4,607 700,800 6.6 Humboldt 95 126,400 0.8 Santa Barbara 1,658 394,900 4.2 Imperial 1,781 140,800 12.6 Santa Clara 10,866 1,665,600 6.5 Inyo 15 18,050 0.8 Santa Cruz 1,391 253,200 5.5 Kern 1,950 653,400 3.0 Shasta 66 162,200 0.4 Kings 337 127,400 2.6 Sierra 4 3,550 1.1 Lake 111 57,600 1.9 Siskiyou 37 44,250 0.8 Lassen 28 33,650 0.8 Solano 1,266 388,300 3.3 Los Angeles 56,825 9,394,300 6.0 Sonoma 1,280 453,500 2.8 Madera 411 121,700 3.4 Stanislaus 2,007 440,900 4.6 Marin 627 244,900 2.6 Sutter 483 78,000 6.2 Mariposa 9 16,950 0.5 Tehama 80 55,500 1.4 Mendocino 227 85,800 2.6 Trinity 4 13,050 0.3 Merced 1,107 207,500 5.3 Tulare 1,541 364,300 4.2 Modoc 4 9,425 0.4 Tuolumne 33 54,100 0.6 Mono 20 12,600 1.6 Ventura 3,246 742,800 4.4 Monterey 2,789 394,700 7.1 Yolo 823 165,300 5.0 Napa 633 122,800 5.2 Yuba 174 60,200 2.9 Nevada 55 90,900 0.6 Orange 15,316 2,802,800 5.5 Total 161,245 33,417,000 4.8
1999 Immigration Rates by County
o
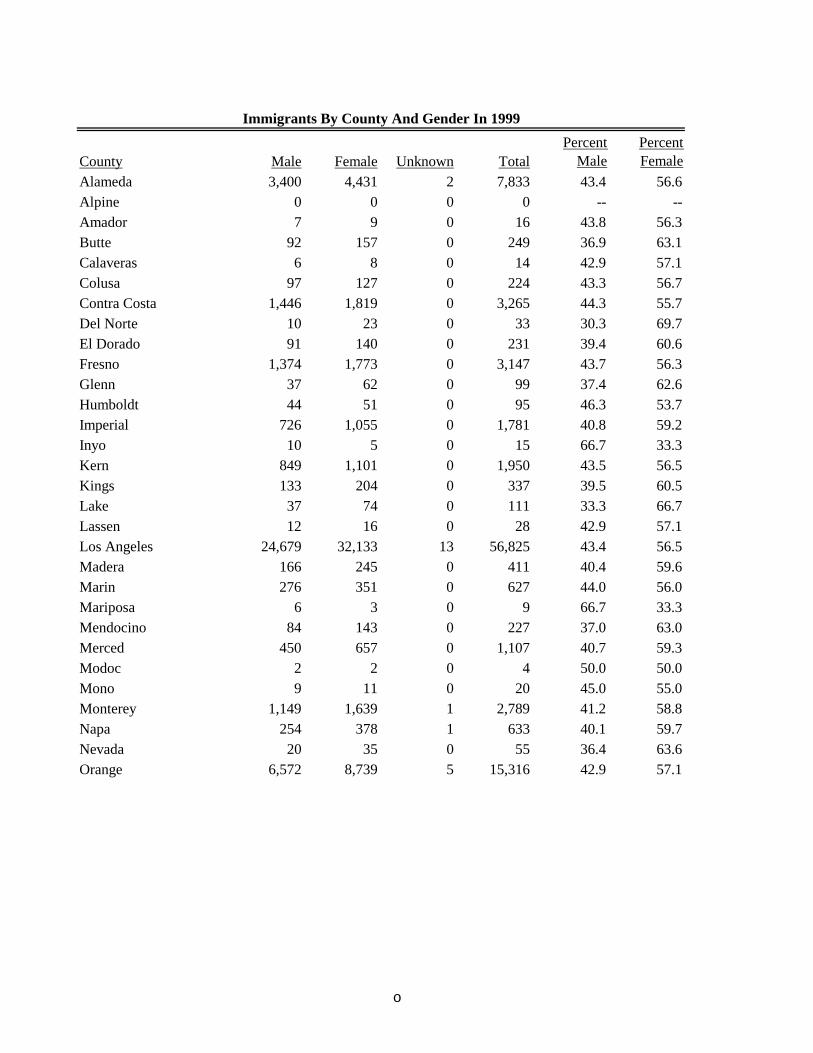
County Male Female Unknown TotalPercent
MalePercent Female
Alameda 3,400 4,431 2 7,833 43.4 56.6Alpine 0 0 0 0 -- --Amador 7 9 0 16 43.8 56.3Butte 92 157 0 249 36.9 63.1Calaveras 6 8 0 14 42.9 57.1Colusa 97 127 0 224 43.3 56.7Contra Costa 1,446 1,819 0 3,265 44.3 55.7Del Norte 10 23 0 33 30.3 69.7El Dorado 91 140 0 231 39.4 60.6Fresno 1,374 1,773 0 3,147 43.7 56.3Glenn 37 62 0 99 37.4 62.6Humboldt 44 51 0 95 46.3 53.7Imperial 726 1,055 0 1,781 40.8 59.2Inyo 10 5 0 15 66.7 33.3Kern 849 1,101 0 1,950 43.5 56.5Kings 133 204 0 337 39.5 60.5Lake 37 74 0 111 33.3 66.7Lassen 12 16 0 28 42.9 57.1Los Angeles 24,679 32,133 13 56,825 43.4 56.5Madera 166 245 0 411 40.4 59.6Marin 276 351 0 627 44.0 56.0Mariposa 6 3 0 9 66.7 33.3Mendocino 84 143 0 227 37.0 63.0Merced 450 657 0 1,107 40.7 59.3Modoc 2 2 0 4 50.0 50.0Mono 9 11 0 20 45.0 55.0Monterey 1,149 1,639 1 2,789 41.2 58.8Napa 254 378 1 633 40.1 59.7Nevada 20 35 0 55 36.4 63.6Orange 6,572 8,739 5 15,316 42.9 57.1
Immigrants By County And Gender In 1999
p
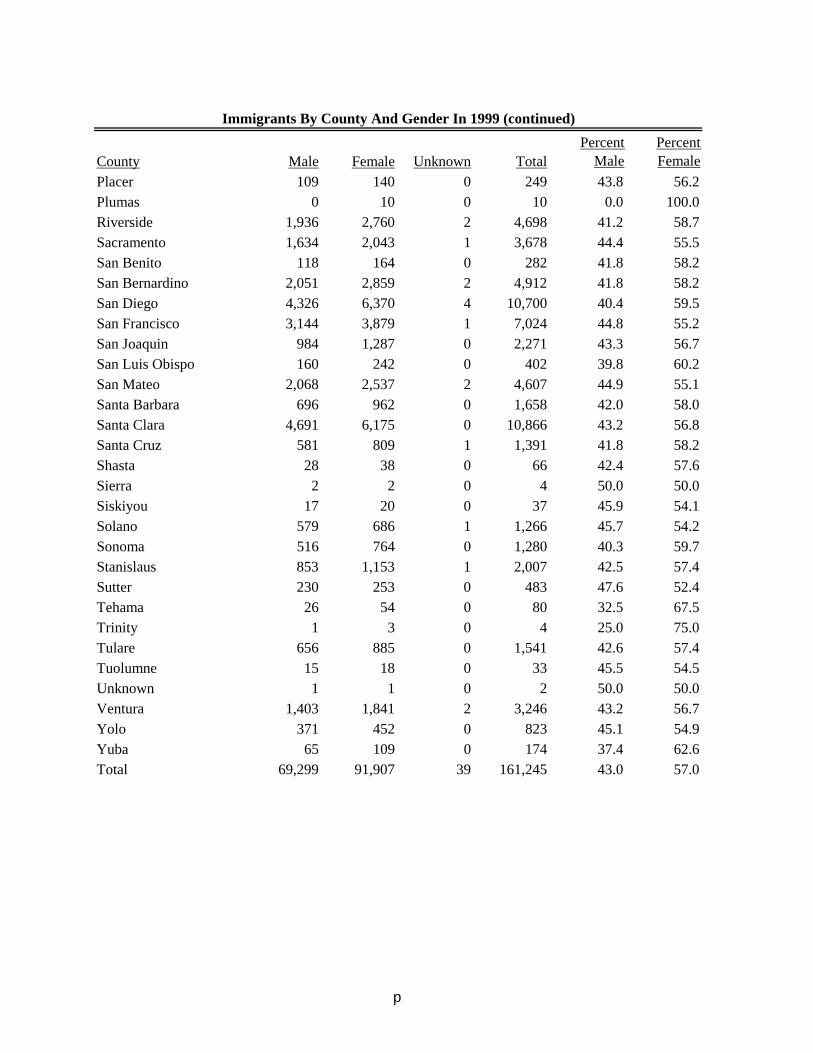
County Male Female Unknown TotalPercent
MalePercent Female
Placer 109 140 0 249 43.8 56.2Plumas 0 10 0 10 0.0 100.0Riverside 1,936 2,760 2 4,698 41.2 58.7Sacramento 1,634 2,043 1 3,678 44.4 55.5San Benito 118 164 0 282 41.8 58.2San Bernardino 2,051 2,859 2 4,912 41.8 58.2San Diego 4,326 6,370 4 10,700 40.4 59.5San Francisco 3,144 3,879 1 7,024 44.8 55.2San Joaquin 984 1,287 0 2,271 43.3 56.7San Luis Obispo 160 242 0 402 39.8 60.2San Mateo 2,068 2,537 2 4,607 44.9 55.1Santa Barbara 696 962 0 1,658 42.0 58.0Santa Clara 4,691 6,175 0 10,866 43.2 56.8Santa Cruz 581 809 1 1,391 41.8 58.2Shasta 28 38 0 66 42.4 57.6Sierra 2 2 0 4 50.0 50.0Siskiyou 17 20 0 37 45.9 54.1Solano 579 686 1 1,266 45.7 54.2Sonoma 516 764 0 1,280 40.3 59.7Stanislaus 853 1,153 1 2,007 42.5 57.4Sutter 230 253 0 483 47.6 52.4Tehama 26 54 0 80 32.5 67.5Trinity 1 3 0 4 25.0 75.0Tulare 656 885 0 1,541 42.6 57.4Tuolumne 15 18 0 33 45.5 54.5Unknown 1 1 0 2 50.0 50.0Ventura 1,403 1,841 2 3,246 43.2 56.7Yolo 371 452 0 823 45.1 54.9Yuba 65 109 0 174 37.4 62.6Total 69,299 91,907 39 161,245 43.0 57.0
Immigrants By County And Gender In 1999 (continued)
q
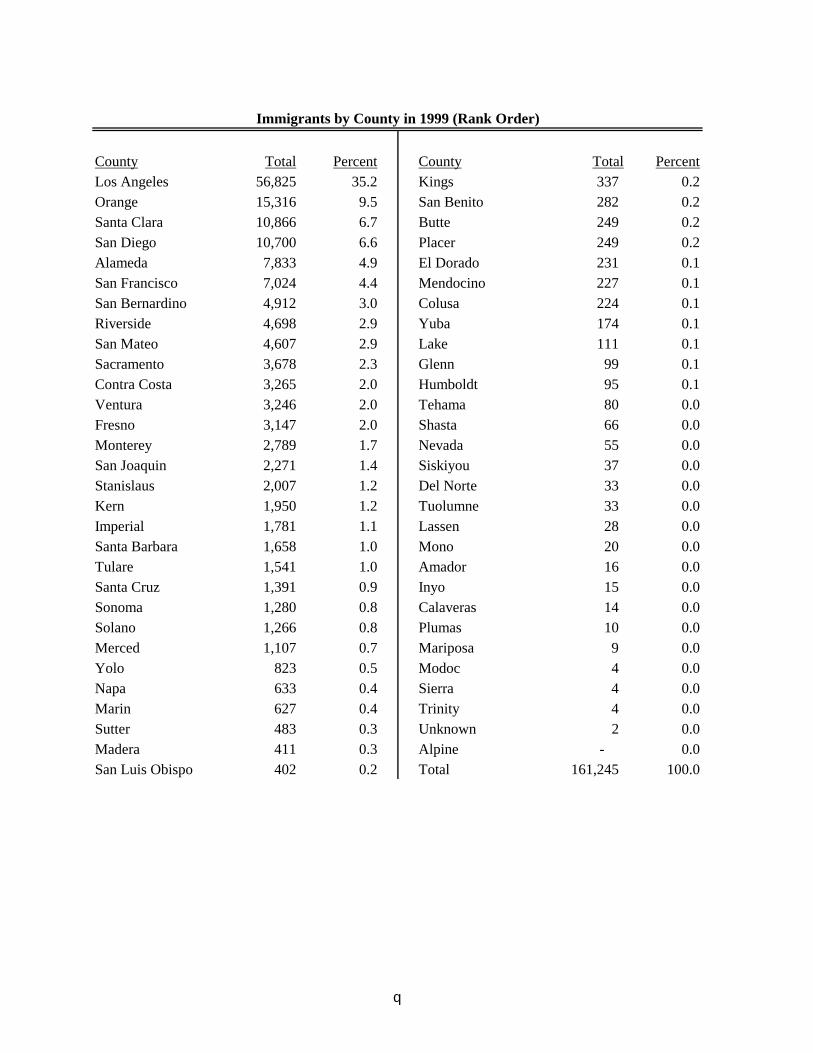
County Total Percent County Total PercentLos Angeles 56,825 35.2 Kings 337 0.2Orange 15,316 9.5 San Benito 282 0.2Santa Clara 10,866 6.7 Butte 249 0.2San Diego 10,700 6.6 Placer 249 0.2Alameda 7,833 4.9 El Dorado 231 0.1San Francisco 7,024 4.4 Mendocino 227 0.1San Bernardino 4,912 3.0 Colusa 224 0.1Riverside 4,698 2.9 Yuba 174 0.1San Mateo 4,607 2.9 Lake 111 0.1Sacramento 3,678 2.3 Glenn 99 0.1Contra Costa 3,265 2.0 Humboldt 95 0.1Ventura 3,246 2.0 Tehama 80 0.0Fresno 3,147 2.0 Shasta 66 0.0Monterey 2,789 1.7 Nevada 55 0.0San Joaquin 2,271 1.4 Siskiyou 37 0.0Stanislaus 2,007 1.2 Del Norte 33 0.0Kern 1,950 1.2 Tuolumne 33 0.0Imperial 1,781 1.1 Lassen 28 0.0Santa Barbara 1,658 1.0 Mono 20 0.0Tulare 1,541 1.0 Amador 16 0.0Santa Cruz 1,391 0.9 Inyo 15 0.0Sonoma 1,280 0.8 Calaveras 14 0.0Solano 1,266 0.8 Plumas 10 0.0Merced 1,107 0.7 Mariposa 9 0.0Yolo 823 0.5 Modoc 4 0.0Napa 633 0.4 Sierra 4 0.0Marin 627 0.4 Trinity 4 0.0Sutter 483 0.3 Unknown 2 0.0Madera 411 0.3 Alpine - 0.0San Luis Obispo 402 0.2 Total 161,245 100.0
Immigrants by County in 1999 (Rank Order)
r
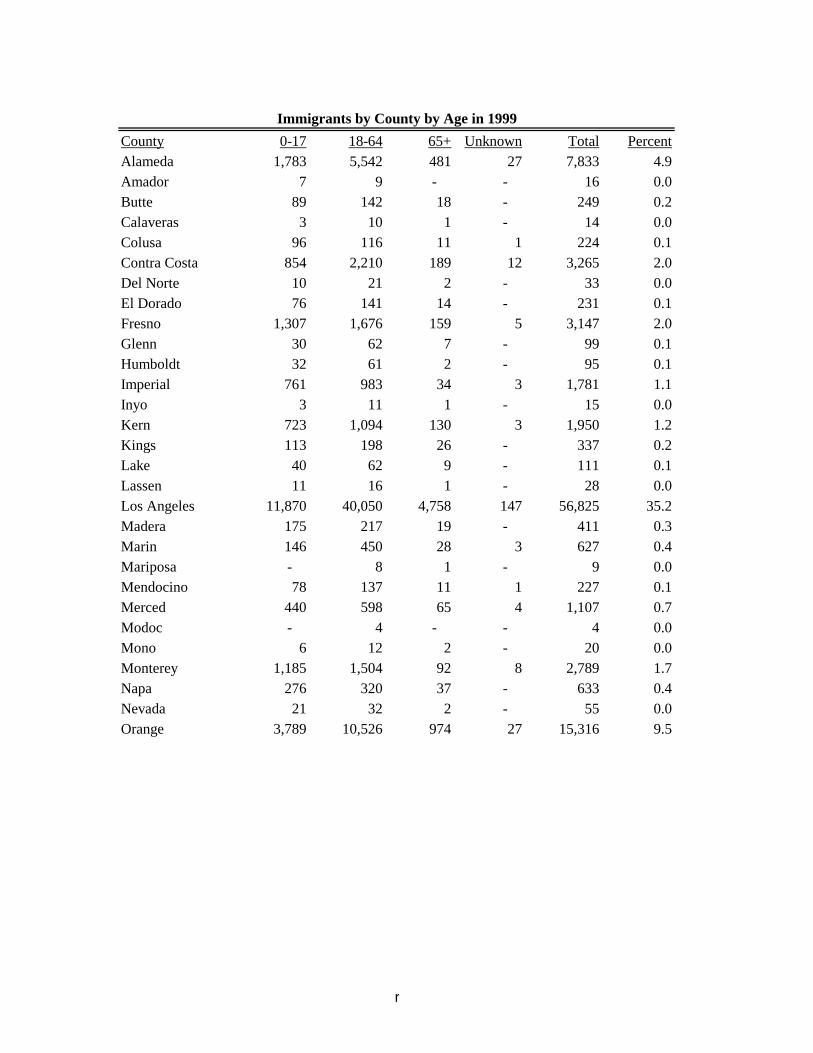
County 0-17 18-64 65+ Unknown Total PercentAlameda 1,783 5,542 481 27 7,833 4.9Amador 7 9 - - 16 0.0Butte 89 142 18 - 249 0.2Calaveras 3 10 1 - 14 0.0Colusa 96 116 11 1 224 0.1Contra Costa 854 2,210 189 12 3,265 2.0Del Norte 10 21 2 - 33 0.0El Dorado 76 141 14 - 231 0.1Fresno 1,307 1,676 159 5 3,147 2.0Glenn 30 62 7 - 99 0.1Humboldt 32 61 2 - 95 0.1Imperial 761 983 34 3 1,781 1.1Inyo 3 11 1 - 15 0.0Kern 723 1,094 130 3 1,950 1.2Kings 113 198 26 - 337 0.2Lake 40 62 9 - 111 0.1Lassen 11 16 1 - 28 0.0Los Angeles 11,870 40,050 4,758 147 56,825 35.2Madera 175 217 19 - 411 0.3Marin 146 450 28 3 627 0.4Mariposa - 8 1 - 9 0.0Mendocino 78 137 11 1 227 0.1Merced 440 598 65 4 1,107 0.7Modoc - 4 - - 4 0.0Mono 6 12 2 - 20 0.0Monterey 1,185 1,504 92 8 2,789 1.7Napa 276 320 37 - 633 0.4Nevada 21 32 2 - 55 0.0Orange 3,789 10,526 974 27 15,316 9.5
Immigrants by County by Age in 1999
s
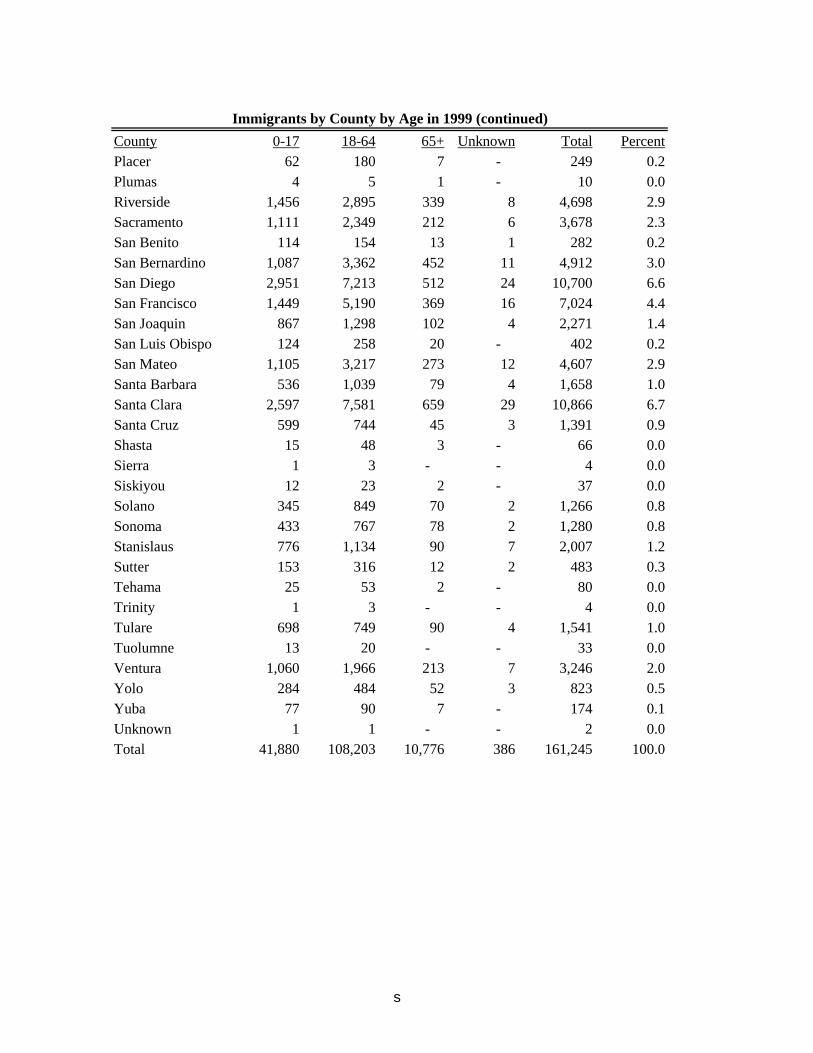
County 0-17 18-64 65+ Unknown Total PercentPlacer 62 180 7 - 249 0.2Plumas 4 5 1 - 10 0.0Riverside 1,456 2,895 339 8 4,698 2.9Sacramento 1,111 2,349 212 6 3,678 2.3San Benito 114 154 13 1 282 0.2San Bernardino 1,087 3,362 452 11 4,912 3.0San Diego 2,951 7,213 512 24 10,700 6.6San Francisco 1,449 5,190 369 16 7,024 4.4San Joaquin 867 1,298 102 4 2,271 1.4San Luis Obispo 124 258 20 - 402 0.2San Mateo 1,105 3,217 273 12 4,607 2.9Santa Barbara 536 1,039 79 4 1,658 1.0Santa Clara 2,597 7,581 659 29 10,866 6.7Santa Cruz 599 744 45 3 1,391 0.9Shasta 15 48 3 - 66 0.0Sierra 1 3 - - 4 0.0Siskiyou 12 23 2 - 37 0.0Solano 345 849 70 2 1,266 0.8Sonoma 433 767 78 2 1,280 0.8Stanislaus 776 1,134 90 7 2,007 1.2Sutter 153 316 12 2 483 0.3Tehama 25 53 2 - 80 0.0Trinity 1 3 - - 4 0.0Tulare 698 749 90 4 1,541 1.0Tuolumne 13 20 - - 33 0.0Ventura 1,060 1,966 213 7 3,246 2.0Yolo 284 484 52 3 823 0.5Yuba 77 90 7 - 174 0.1Unknown 1 1 - - 2 0.0Total 41,880 108,203 10,776 386 161,245 100.0
Immigrants by County by Age in 1999 (continued)
t
County Divorced Married Separated Single Widowed Unknown TotalPercent Single
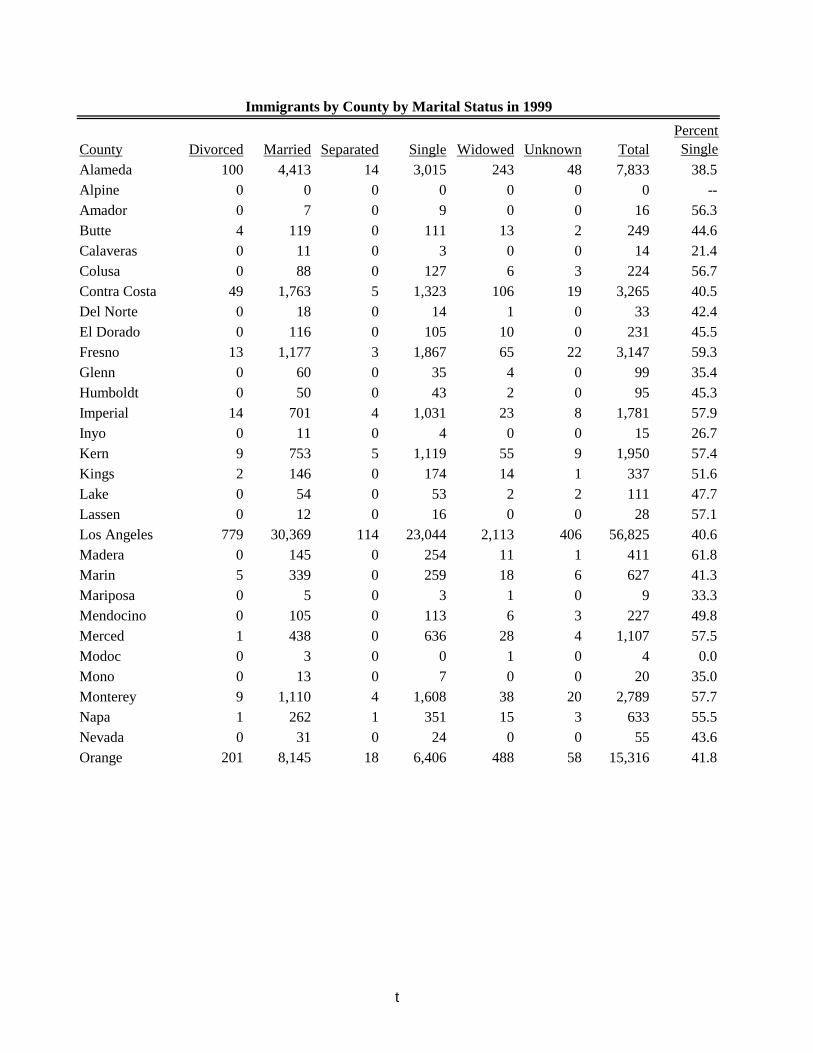
Alameda 100 4,413 14 3,015 243 48 7,833 38.5Alpine 0 0 0 0 0 0 0 --Amador 0 7 0 9 0 0 16 56.3Butte 4 119 0 111 13 2 249 44.6Calaveras 0 11 0 3 0 0 14 21.4Colusa 0 88 0 127 6 3 224 56.7Contra Costa 49 1,763 5 1,323 106 19 3,265 40.5Del Norte 0 18 0 14 1 0 33 42.4El Dorado 0 116 0 105 10 0 231 45.5Fresno 13 1,177 3 1,867 65 22 3,147 59.3Glenn 0 60 0 35 4 0 99 35.4Humboldt 0 50 0 43 2 0 95 45.3Imperial 14 701 4 1,031 23 8 1,781 57.9Inyo 0 11 0 4 0 0 15 26.7Kern 9 753 5 1,119 55 9 1,950 57.4Kings 2 146 0 174 14 1 337 51.6Lake 0 54 0 53 2 2 111 47.7Lassen 0 12 0 16 0 0 28 57.1Los Angeles 779 30,369 114 23,044 2,113 406 56,825 40.6Madera 0 145 0 254 11 1 411 61.8Marin 5 339 0 259 18 6 627 41.3Mariposa 0 5 0 3 1 0 9 33.3Mendocino 0 105 0 113 6 3 227 49.8Merced 1 438 0 636 28 4 1,107 57.5Modoc 0 3 0 0 1 0 4 0.0Mono 0 13 0 7 0 0 20 35.0Monterey 9 1,110 4 1,608 38 20 2,789 57.7Napa 1 262 1 351 15 3 633 55.5Nevada 0 31 0 24 0 0 55 43.6Orange 201 8,145 18 6,406 488 58 15,316 41.8
Immigrants by County by Marital Status in 1999
u
County Divorced Married Separated Single Widowed Unknown TotalPercent Single
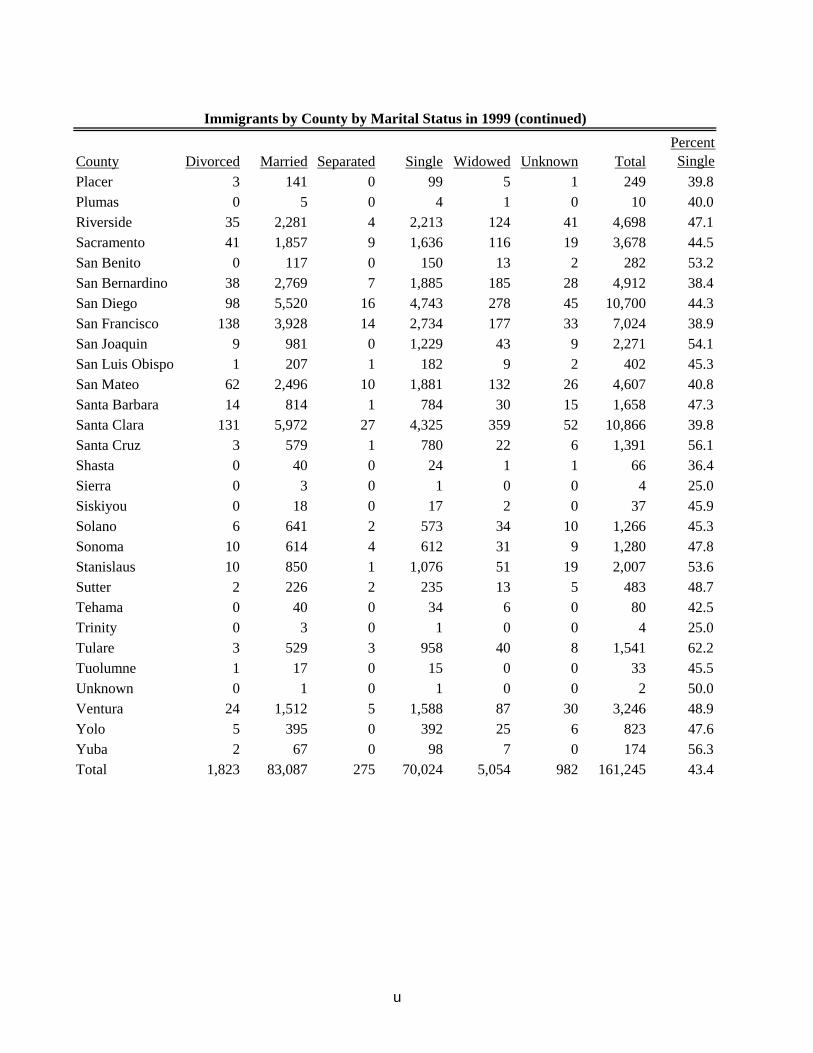
Placer 3 141 0 99 5 1 249 39.8Plumas 0 5 0 4 1 0 10 40.0Riverside 35 2,281 4 2,213 124 41 4,698 47.1Sacramento 41 1,857 9 1,636 116 19 3,678 44.5San Benito 0 117 0 150 13 2 282 53.2San Bernardino 38 2,769 7 1,885 185 28 4,912 38.4San Diego 98 5,520 16 4,743 278 45 10,700 44.3San Francisco 138 3,928 14 2,734 177 33 7,024 38.9San Joaquin 9 981 0 1,229 43 9 2,271 54.1San Luis Obispo 1 207 1 182 9 2 402 45.3San Mateo 62 2,496 10 1,881 132 26 4,607 40.8Santa Barbara 14 814 1 784 30 15 1,658 47.3Santa Clara 131 5,972 27 4,325 359 52 10,866 39.8Santa Cruz 3 579 1 780 22 6 1,391 56.1Shasta 0 40 0 24 1 1 66 36.4Sierra 0 3 0 1 0 0 4 25.0Siskiyou 0 18 0 17 2 0 37 45.9Solano 6 641 2 573 34 10 1,266 45.3Sonoma 10 614 4 612 31 9 1,280 47.8Stanislaus 10 850 1 1,076 51 19 2,007 53.6Sutter 2 226 2 235 13 5 483 48.7Tehama 0 40 0 34 6 0 80 42.5Trinity 0 3 0 1 0 0 4 25.0Tulare 3 529 3 958 40 8 1,541 62.2Tuolumne 1 17 0 15 0 0 33 45.5Unknown 0 1 0 1 0 0 2 50.0Ventura 24 1,512 5 1,588 87 30 3,246 48.9Yolo 5 395 0 392 25 6 823 47.6Yuba 2 67 0 98 7 0 174 56.3Total 1,823 83,087 275 70,024 5,054 982 161,245 43.4
Immigrants by County by Marital Status in 1999 (continued)
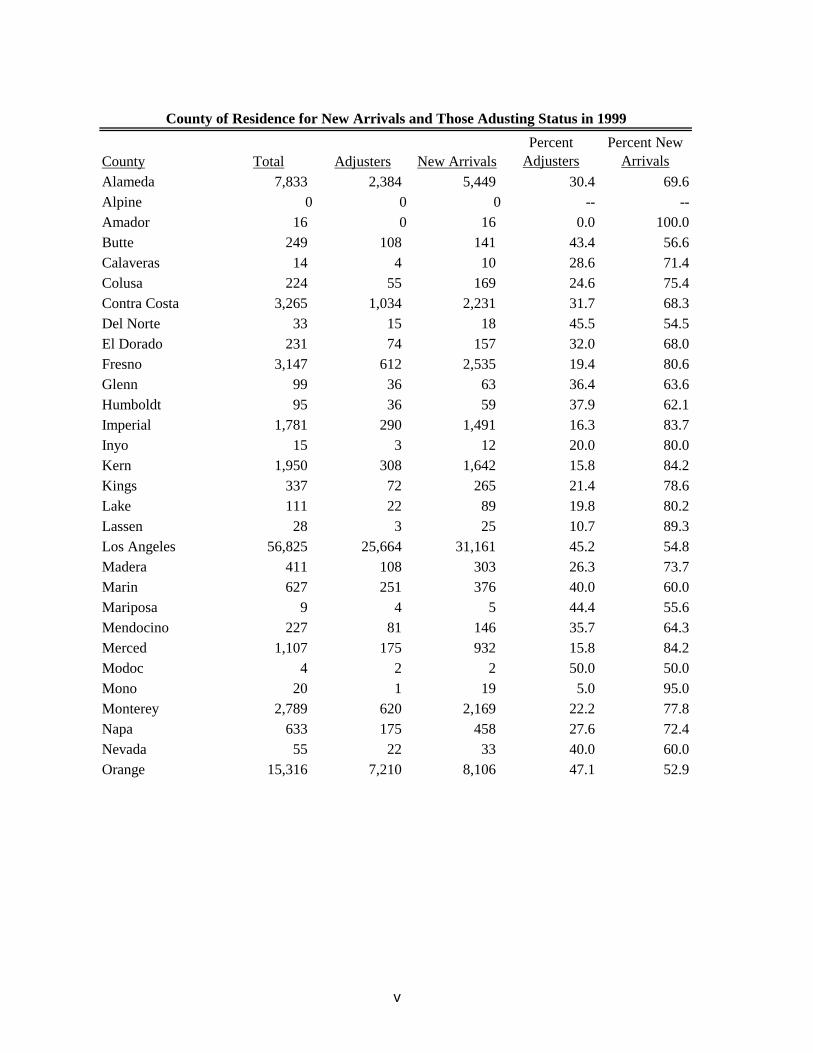
v
County Total Adjusters New ArrivalsPercent
AdjustersPercent New
ArrivalsAlameda 7,833 2,384 5,449 30.4 69.6Alpine 0 0 0 -- --Amador 16 0 16 0.0 100.0Butte 249 108 141 43.4 56.6Calaveras 14 4 10 28.6 71.4Colusa 224 55 169 24.6 75.4Contra Costa 3,265 1,034 2,231 31.7 68.3Del Norte 33 15 18 45.5 54.5El Dorado 231 74 157 32.0 68.0Fresno 3,147 612 2,535 19.4 80.6Glenn 99 36 63 36.4 63.6Humboldt 95 36 59 37.9 62.1Imperial 1,781 290 1,491 16.3 83.7Inyo 15 3 12 20.0 80.0Kern 1,950 308 1,642 15.8 84.2Kings 337 72 265 21.4 78.6Lake 111 22 89 19.8 80.2Lassen 28 3 25 10.7 89.3Los Angeles 56,825 25,664 31,161 45.2 54.8Madera 411 108 303 26.3 73.7Marin 627 251 376 40.0 60.0Mariposa 9 4 5 44.4 55.6Mendocino 227 81 146 35.7 64.3Merced 1,107 175 932 15.8 84.2Modoc 4 2 2 50.0 50.0Mono 20 1 19 5.0 95.0Monterey 2,789 620 2,169 22.2 77.8Napa 633 175 458 27.6 72.4Nevada 55 22 33 40.0 60.0Orange 15,316 7,210 8,106 47.1 52.9
County of Residence for New Arrivals and Those Adusting Status in 1999
w
County Total Adjusters New ArrivalsPercent
AdjustersPercent New
ArrivalsPlacer 249 74 175 29.7 70.3Plumas 10 1 9 10.0 90.0Riverside 4,698 1,950 2,748 41.5 58.5Sacramento 3,678 1,433 2,245 39.0 61.0San Benito 282 61 221 21.6 78.4San Bernardino 4,912 2,330 2,582 47.4 52.6San Diego 10,700 3,435 7,265 32.1 67.9San Francisco 7,024 1,660 5,364 23.6 76.4San Joaquin 2,271 525 1,746 23.1 76.9San Luis Obispo 402 111 291 27.6 72.4San Mateo 4,607 1,609 2,998 34.9 65.1Santa Barbara 1,658 714 944 43.1 56.9Santa Clara 10,866 4,110 6,756 37.8 62.2Santa Cruz 1,391 325 1,066 23.4 76.6Shasta 66 29 37 43.9 56.1Sierra 4 0 4 0.0 100.0Siskiyou 37 16 21 43.2 56.8Solano 1,266 315 951 24.9 75.1Sonoma 1,280 423 857 33.0 67.0Stanislaus 2,007 630 1,377 31.4 68.6Sutter 483 82 401 17.0 83.0Tehama 80 42 38 52.5 47.5Trinity 4 0 4 0.0 100.0Tulare 1,541 281 1,260 18.2 81.8Tuolumne 33 6 27 18.2 81.8Ventura 3,246 976 2,270 30.1 69.9Yolo 823 262 561 31.8 68.2Yuba 174 65 109 37.4 62.6Unknown 2 1 1 50.0 50.0Total 161,245 60,835 100,410 37.7 62.3
County of Residence for New Arrivals and Those Adusting Status in 1999 (continued)
x
Rank Number Percent Rank Number PercentMexico (Rank 1) 41.2 Philippines (Rank 2) 8.4
1 Los Angeles 19,177 28.8 1 Los Angeles 4,313 31.8 2 Orange 6,049 9.1 2 San Diego 1,766 13.0 3 San Diego 5,673 8.5 3 Santa Clara 1,123 8.3 4 Riverside 3,402 5.1 4 Alameda 944 7.0 5 San Bernardino 2,517 3.8 5 San Mateo 856 6.3 6 Fresno 2,373 3.6 6 Orange 766 5.7 7 Santa Clara 2,290 3.4 7 San Francisco 677 5.0 8 Monterey 2,277 3.4 8 Solano 468 3.5 9 Ventura 2,265 3.4 9 Contra Costa 375 2.8
10 Imperial 1,721 2.6 10 San Bernardino 361 2.7 Other Counties 18,733 28.2 Other Counties 1,899 14.0 Total 66,477 100.0 Total 13,548 100.0 China (Rank 3) 5.9 Vietnam (Rank 4) 5.3
1 Los Angeles 3,196 33.3 1 Orange 2,578 30.4 2 San Francisco 2,660 27.7 2 Los Angeles 2,009 23.7 3 Alameda 1,160 12.1 3 Santa Clara 1,964 23.2 4 Santa Clara 662 6.9 4 Alameda 400 4.7 5 San Mateo 370 3.9 5 San Diego 324 3.8 6 Orange 314 3.3 6 San Francisco 299 3.5 7 San Diego 263 2.7 7 Sacramento 237 2.8 8 Sacramento 259 2.7 8 San Bernardino 182 2.1 9 Contra Costa 149 1.6 9 Riverside 67 0.8
10 San Bernardino 79 0.8 10 Contra Costa 61 0.7 Other Counties 474 4.9 Other Counties 348 4.1 Total 9,586 100.0 Total 8,469 100.0 El Salvador (Rank 5) 3.7 India (Rank 6) 3.6
1 Los Angeles 4,101 69.6 1 Los Angeles 1,052 18.3 2 Orange 291 4.9 2 Santa Clara 1,022 17.8 3 San Francisco 258 4.4 3 Alameda 645 11.2 4 San Mateo 229 3.9 4 Orange 603 10.5 5 San Bernardino 145 2.5 5 Sutter 236 4.1 6 Alameda 123 2.1 6 Contra Costa 235 4.1 7 Santa Clara 115 2.0 7 Fresno 227 3.9 8 Riverside 97 1.6 8 Sacramento 213 3.7 9 Contra Costa 87 1.5 9 San Diego 174 3.0
10 Marin 51 0.9 10 San Bernardino 146 2.5 Other Counties 393 6.7 Other Counties 1,198 20.8 Total 5,890 100.0 Total 5,751 100.0 Iran (Rank 7) 2.2 Korea (Rank 8) 2.1
1 Los Angeles 1878 53.4 1 Los Angeles 1947 58.6 2 Orange 464 13.2 2 Orange 509 15.3 3 Santa Clara 348 9.9 3 Santa Clara 181 5.4 4 San Diego 191 5.4 4 San Diego 133 4.0 5 Alameda 125 3.6 5 Alameda 93 2.8 6 Contra Costa 112 3.2 6 San Bernardino 78 2.3 7 Sacramento 60 1.7 7 San Francisco 72 2.2 8 San Mateo 59 1.7 8 Contra Costa 39 1.2 9 Ventura 46 1.3 9 Sacramento 37 1.1
10 Marin 38 1.1 10 Kern 33 1.0 Other Counties 199 5.7 Other Counties 202 6.1 Total 3520 100.0 Total 3324 100.0 Taiwan (Rank 9) 2.0 Guatemala (Rank 10) 1.8
1 Los Angeles 1657 51.2 1 Los Angeles 2062 70.7 2 Santa Clara 444 13.7 2 Orange 198 6.8 3 Orange 346 10.7 3 San Bernardino 106 3.6 4 Alameda 225 7.0 4 Riverside 95 3.3 5 San Mateo 95 2.9 5 San Mateo 69 2.4 6 San Bernardino 92 2.8 6 Alameda 57 2.0 7 San Diego 91 2.8 7 Santa Clara 57 2.0 8 San Francisco 85 2.6 8 San Francisco 56 1.9 9 Contra Costa 58 1.8 9 San Diego 40 1.4
10 Sacramento 36 1.1 10 Contra Costa 23 0.8 Other Counties 107 3.3 Other Counties 152 5.2 Total 3236 100.0 Total 2915 100.0
Top 10 California Counties for the Top 10 Countries of Birth of Legal Immigrants in 1999
y
Rank Number Percent Rank Number PercentLos Angeles (Rank 1) 35.2 Orange (Rank 2) 9.5
1 Mexico 19177 33.7 1 Mexico 6,049 39.5 2 Philippines 4313 7.6 2 Vietnam 2,578 16.8 3 El Salvador 4101 7.2 3 Philippines 766 5.0 4 China 3196 5.6 4 India 603 3.9 5 Guatemala 2062 3.6 5 Korea 509 3.3 6 Vietnam 2009 3.5 6 Iran 464 3.0 7 Korea 1947 3.4 7 Taiwan 346 2.3 8 Iran 1878 3.3 8 China 314 2.1 9 Taiwan 1657 2.9 9 El Salvador 291 1.9
10 Nicaragua 1077 1.9 10 Pakistan 223 1.5 Other Countries 15408 27.1 Other Countries 3,173 20.7
Total 56825 100.0 Total 15,316 100.0 Santa Clara (Rank 3) 6.7 San Diego (Rank 4) 6.6
1 Mexico 2,290 21.1 1 Mexico 5,673 53.0 2 Vietnam 1,964 18.1 2 Philippines 1,766 16.5 3 Philippines 1,123 10.3 3 Vietnam 324 3.0 4 India 1,022 9.4 4 China 263 2.5 5 China 662 6.1 5 Iran 191 1.8 6 Taiwan 444 4.1 6 India 174 1.6 7 Iran 348 3.2 7 Korea 133 1.2 8 Korea 181 1.7 8 Japan 126 1.2 9 Russia 169 1.6 9 Iraq 114 1.1
10 Ethiopia 163 1.5 10 Taiwan 91 0.9 Other Countries 2,500 23.0 Other Countries 1,845 17.2 Total 10,866 100.0 Total 10,700 100.0 Alameda (Rank 5) 4.9 San Francisco (Rank 6) 4.4
1 Mexico 1,586 20.2 1 China 2,660 37.9 2 China 1,160 14.8 2 Philippines 677 9.6 3 Philippines 944 12.1 3 Hong Kong 470 6.7 4 India 645 8.2 4 Mexico 362 5.2 5 Vietnam 400 5.1 5 Vietnam 299 4.3 6 Hong Kong 266 3.4 6 El Salvador 258 3.7 7 Fiji 240 3.1 7 Nicaragua 250 3.6 8 Taiwan 225 2.9 8 Ukraine 177 2.5 9 Pakistan 146 1.9 9 Russia 148 2.1
10 Nicaragua 132 1.7 10 Burma 94 1.3 Other Countries 2,089 26.7 Other Countries 1,629 23.2 Total 7,833 100.0 Total 7,024 100.0 San Bernardino (Rank 7) 3.0 Riverside (Rank 8) 2.9
1 Mexico 2,517 51.2 1 Mexico 3,402 72.4 2 Philippines 361 7.3 2 Philippines 252 5.4 3 Vietnam 182 3.7 3 El Salvador 97 2.1 4 India 146 3.0 4 Guatemala 95 2.0 5 El Salvador 145 3.0 5 India 71 1.5 6 Guatemala 106 2.2 6 Vietnam 67 1.4 7 Nicaragua 100 2.0 7 Pakistan 45 1.0 8 Taiwan 92 1.9 8 Romania 43 0.9 9 China 79 1.6 9 Nicaragua 40 0.9
10 Korea 78 1.6 10 United Kingdom 39 0.8 Other Countries 1,106 22.5 Other Countries 547 11.6 Total 4,912 100.0 Total 4,698 100.0 San Mateo (Rank 9) 2.9 Sacramento (Rank 10) 2.3
1 Mexico 1,048 22.7 1 Mexico 830 22.6 2 Philippines 856 18.6 2 Ukraine 324 8.8 3 China 370 8.0 3 China 259 7.0 4 El Salvador 229 5.0 4 Philippines 246 6.7 5 Fiji 198 4.3 5 Fiji 239 6.5 6 Nicaragua 182 4.0 6 Vietnam 237 6.4 7 India 140 3.0 7 India 213 5.8 8 Hong Kong 135 2.9 8 Pakistan 144 3.9 9 Taiwan 95 2.1 9 Russia 118 3.2
10 Burma 93 2.0 10 Soviet Union, former 76 2.1 Other Countries 1,261 27.4 Other Countries 992 27.0 Total 4,607 100.0 Total 3,678 100.0
Top 10 Countries of Birth in the Top 10 California Counties of Legal Immigration in 1999
z
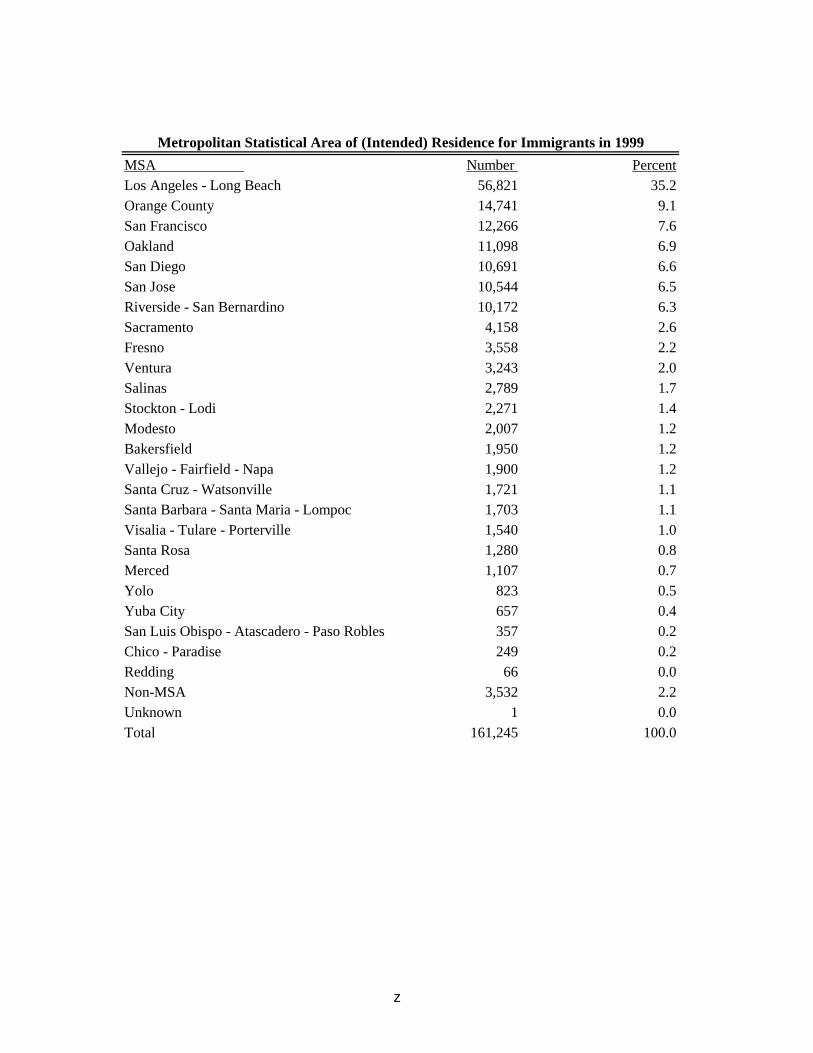
MSA Number PercentLos Angeles - Long Beach 56,821 35.2Orange County 14,741 9.1San Francisco 12,266 7.6Oakland 11,098 6.9San Diego 10,691 6.6San Jose 10,544 6.5Riverside - San Bernardino 10,172 6.3Sacramento 4,158 2.6Fresno 3,558 2.2Ventura 3,243 2.0Salinas 2,789 1.7Stockton - Lodi 2,271 1.4Modesto 2,007 1.2Bakersfield 1,950 1.2Vallejo - Fairfield - Napa 1,900 1.2Santa Cruz - Watsonville 1,721 1.1Santa Barbara - Santa Maria - Lompoc 1,703 1.1Visalia - Tulare - Porterville 1,540 1.0Santa Rosa 1,280 0.8Merced 1,107 0.7Yolo 823 0.5Yuba City 657 0.4San Luis Obispo - Atascadero - Paso Robles 357 0.2Chico - Paradise 249 0.2Redding 66 0.0Non-MSA 3,532 2.2Unknown 1 0.0Total 161,245 100.0
Metropolitan Statistical Area of (Intended) Residence for Immigrants in 1999
aa
CITY Number of Immigrants
Percent of 1999
Immigrants CITY Number of Immigrants
Percent of 1999
Immigrants
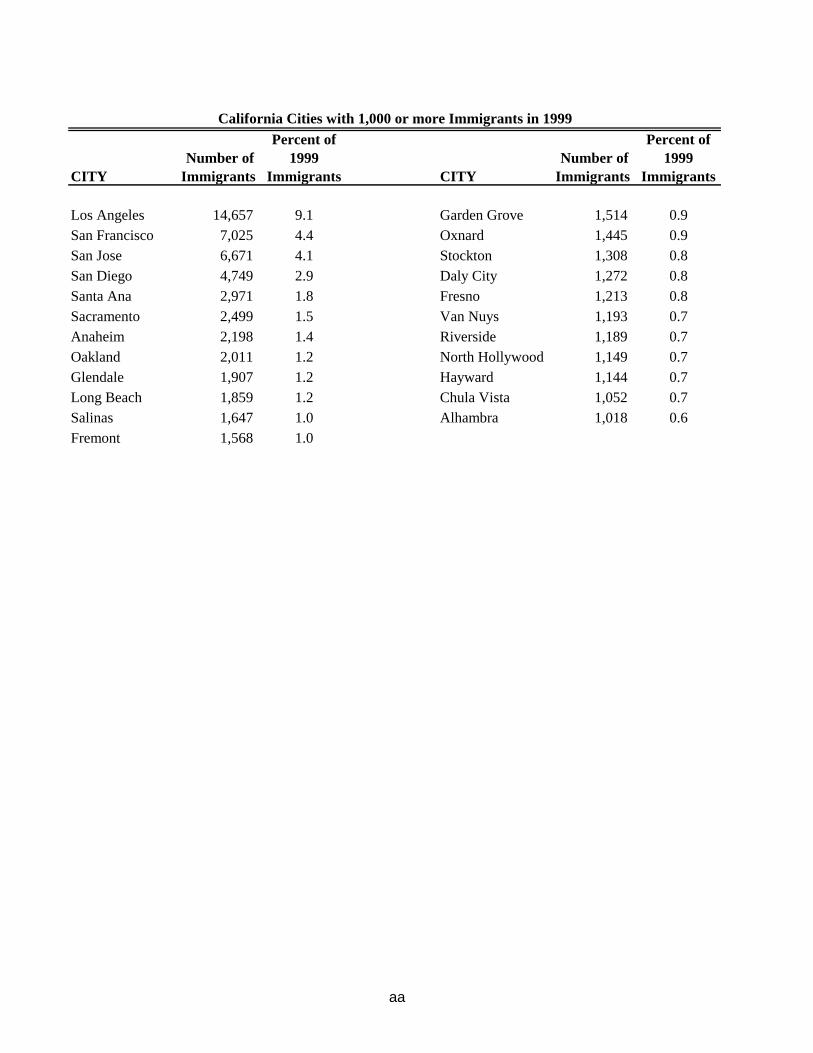
Los Angeles 14,657 9.1 Garden Grove 1,514 0.9San Francisco 7,025 4.4 Oxnard 1,445 0.9San Jose 6,671 4.1 Stockton 1,308 0.8San Diego 4,749 2.9 Daly City 1,272 0.8Santa Ana 2,971 1.8 Fresno 1,213 0.8Sacramento 2,499 1.5 Van Nuys 1,193 0.7Anaheim 2,198 1.4 Riverside 1,189 0.7Oakland 2,011 1.2 North Hollywood 1,149 0.7Glendale 1,907 1.2 Hayward 1,144 0.7Long Beach 1,859 1.2 Chula Vista 1,052 0.7Salinas 1,647 1.0 Alhambra 1,018 0.6Fremont 1,568 1.0
California Cities with 1,000 or more Immigrants in 1999