Embed Size (px)
Citation preview

L’esercizio fisico e le patologie cardiorespiratorie: dalla valutazione funzionale alla prescrizione
M. Guazzi
Università di Milano
Dipartimento Cardiologia Universitaria
IRCCS Policlinico San Donato
Milano
La Riabilitazione Interdisciplinare
Functional Evaluation and Exercise Prescription In Cardiac Patients Background and Key Questions
• O2 Transport and Utilization Chain: What The Wrong Pathways in HF?
• Gas Exchange Analysis and Exercise Prescription
• Exercise is a Mainstay Physiological Stressor and VO2 is a Key Measure of CV Health
Questions:
Background:
0
20
40
60
80
100
120
140
1982
-199
0
1991
1992
1993
1994
1995
1996
1997
19
98
1999
2000
2001
2002
2003
2004
2005
2006
2007
20
08
2009
2010
20
11
2012
2013
2014
2015
2016
2017
Art
icle
s p
er
an
nu
m
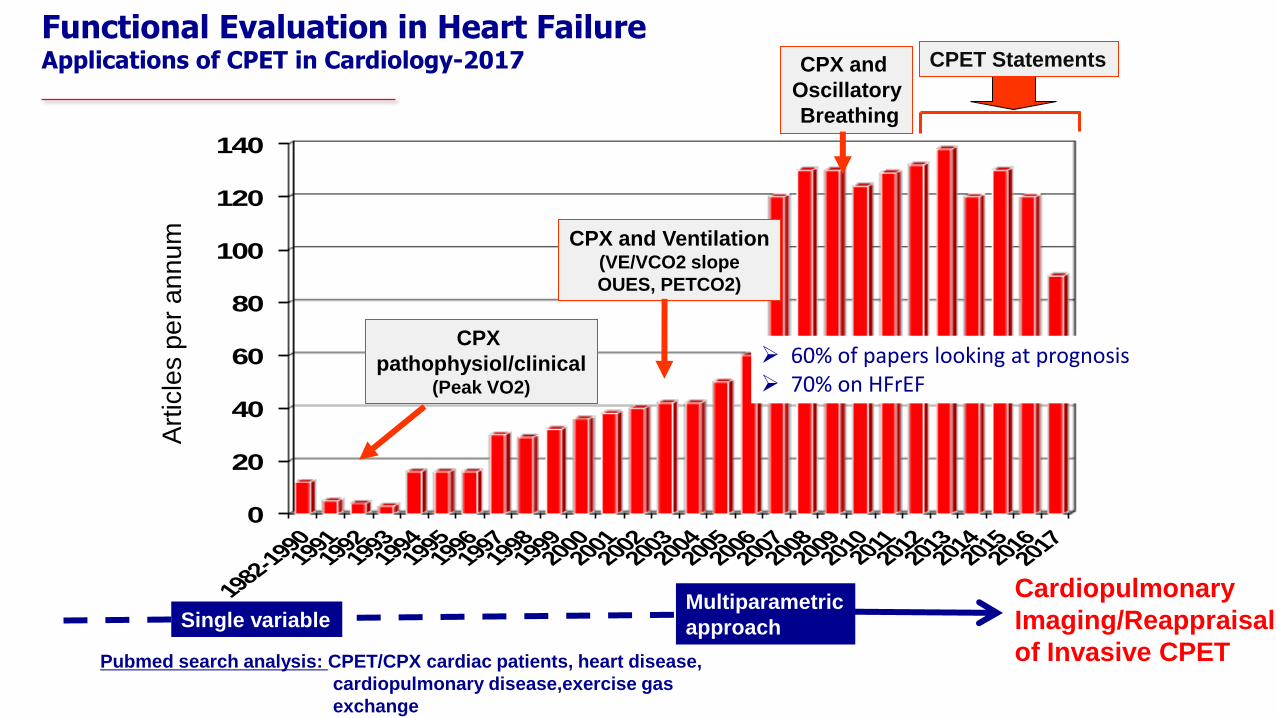
Functional Evaluation in Heart Failure Applications of CPET in Cardiology-2017
CPX
pathophysiol/clinical (Peak VO2)
CPX and Ventilation (VE/VCO2 slope
OUES, PETCO2)
CPX and
Oscillatory
Breathing
CPET Statements
Pubmed search analysis: CPET/CPX cardiac patients, heart disease,
cardiopulmonary disease,exercise gas
exchange
Single variable Multiparametric
approach
60% of papers looking at prognosis 70% on HFrEF
Cardiopulmonary
Imaging/Reappraisal
of Invasive CPET
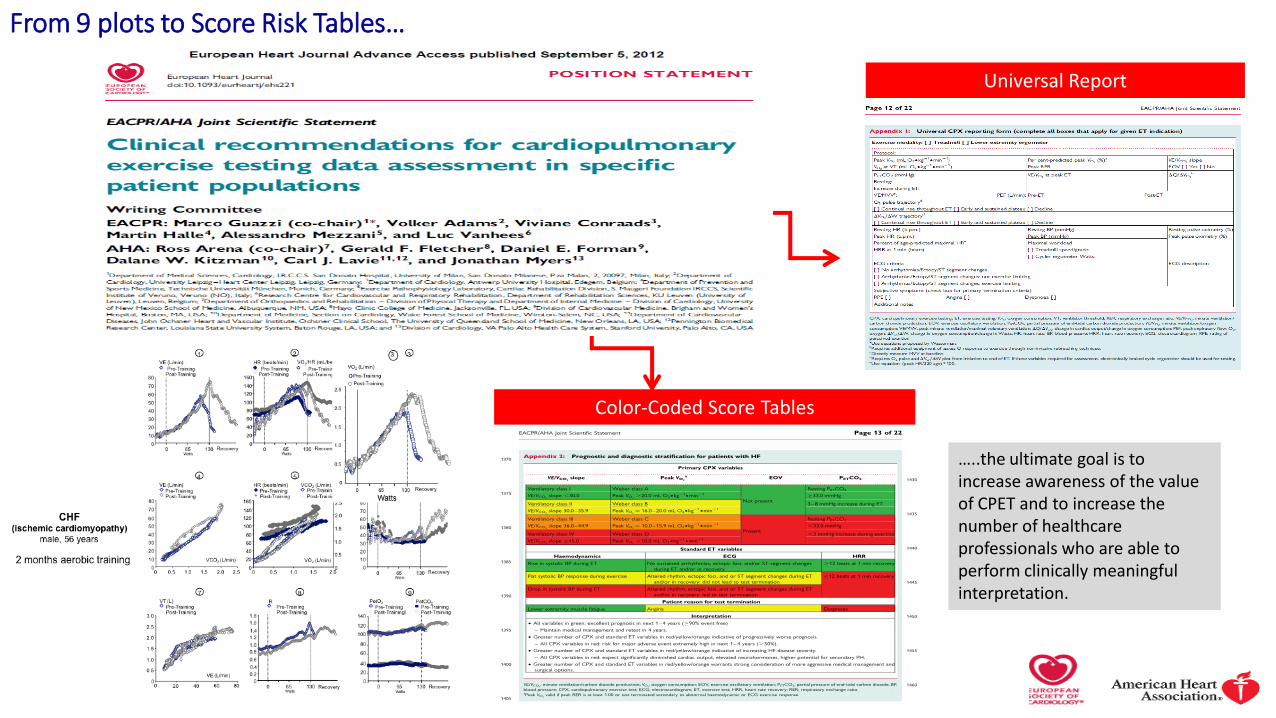
…..the ultimate goal is to increase awareness of the value of CPET and to increase the number of healthcare professionals who are able to perform clinically meaningful interpretation.
Color-Coded Score Tables
Universal Report
From 9 plots to Score Risk Tables…
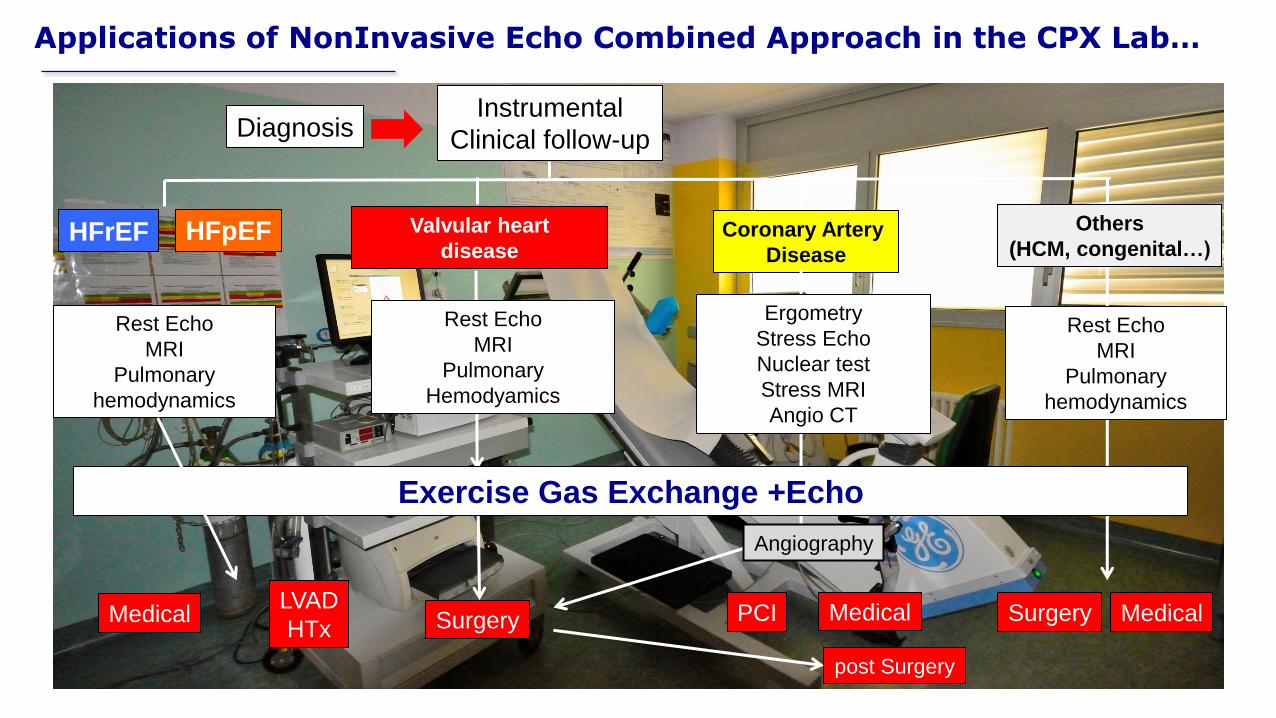
Applications of NonInvasive Echo Combined Approach in the CPX Lab…
Instrumental
Clinical follow-up
Surgery
Coronary Artery
Disease
Angiography
Ergometry
Stress Echo
Nuclear test
Stress MRI
Angio CT
post Surgery
Rest Echo
MRI
Pulmonary
Hemodyamics
Valvular heart
disease
Diagnosis
HFrEF HFpEF Others
(HCM, congenital…)
Rest Echo
MRI
Pulmonary
hemodynamics
Exercise Gas Exchange +Echo
Rest Echo
MRI
Pulmonary
hemodynamics
Medical LVAD
HTx PCI Surgery Medical Medical

Cardiopulmonary Imaging
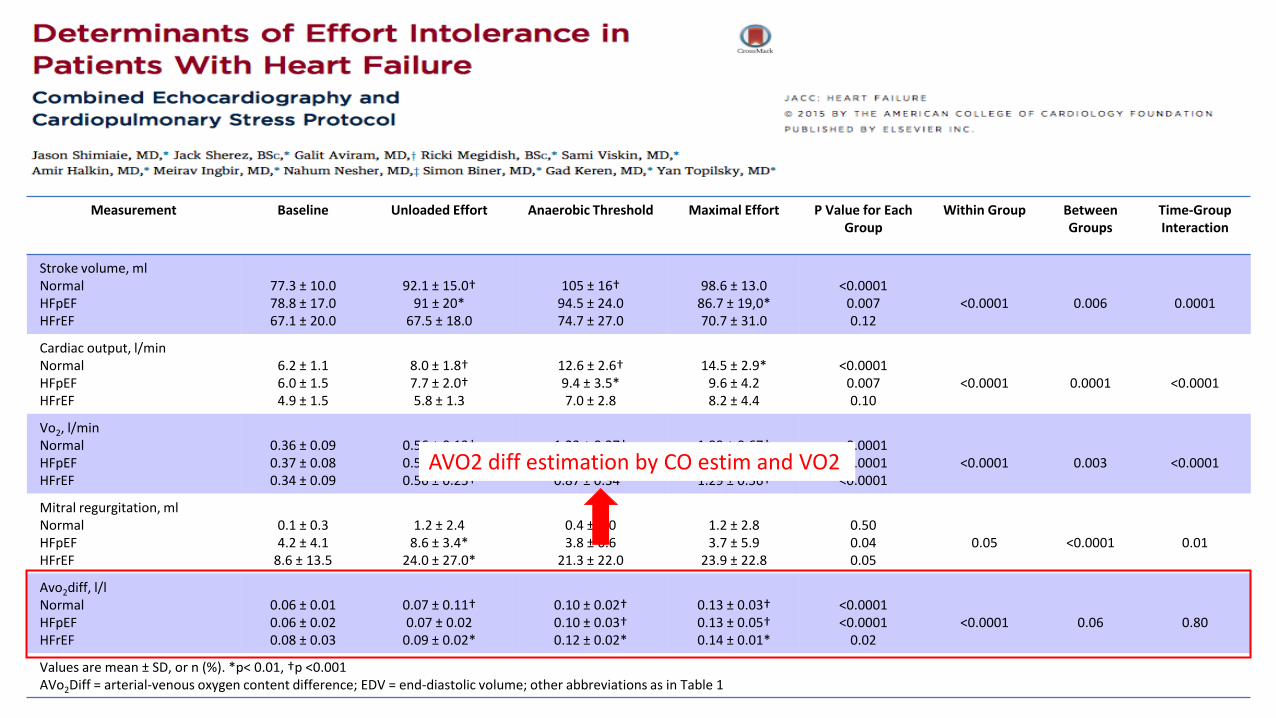
Measurement Baseline Unloaded Effort Anaerobic Threshold Maximal Effort P Value for Each Group
Within Group Between Groups
Time-Group Interaction
Stroke volume, ml Normal HFpEF HFrEF
77.3 ± 10.0 78.8 ± 17.0 67.1 ± 20.0
92.1 ± 15.0†
91 ± 20* 67.5 ± 18.0
105 ± 16†
94.5 ± 24.0 74.7 ± 27.0
98.6 ± 13.0
86.7 ± 19,0* 70.7 ± 31.0
<0.0001
0.007 0.12
<0.0001
0.006
0.0001
Cardiac output, l/min Normal HFpEF HFrEF
6.2 ± 1.1 6.0 ± 1.5 4.9 ± 1.5
8.0 ± 1.8† 7.7 ± 2.0† 5.8 ± 1.3
12.6 ± 2.6† 9.4 ± 3.5* 7.0 ± 2.8
14.5 ± 2.9*
9.6 ± 4.2 8.2 ± 4.4
<0.0001
0.007 0.10
<0.0001
0.0001
<0.0001
Vo2, l/min Normal HFpEF HFrEF
0.36 ± 0.09 0.37 ± 0.08 0.34 ± 0.09
0.56 ± 0.13† 0.57 ± 0.19† 0.56 ± 0.25†
1.23 ± 0.37† 0.87 ± 0.27† 0.87 ± 0.34*
1.99 ± 0.67† 1.23 ± 0.51† 1.29 ± 0.56†
<0.0001 <0.0001 <0.0001
<0.0001
0.003
<0.0001
Mitral regurgitation, ml Normal HFpEF HFrEF
0.1 ± 0.3 4.2 ± 4.1
8.6 ± 13.5
1.2 ± 2.4
8.6 ± 3.4* 24.0 ± 27.0*
0.4 ± 1.0 3.8 ± 6.6
21.3 ± 22.0
1.2 ± 2.8 3.7 ± 5.9
23.9 ± 22.8
0.50 0.04 0.05
0.05
<0.0001
0.01
Avo2diff, l/l Normal HFpEF HFrEF
0.06 ± 0.01 0.06 ± 0.02 0.08 ± 0.03
0.07 ± 0.11† 0.07 ± 0.02
0.09 ± 0.02*
0.10 ± 0.02† 0.10 ± 0.03† 0.12 ± 0.02*
0.13 ± 0.03† 0.13 ± 0.05† 0.14 ± 0.01*
<0.0001 <0.0001
0.02
<0.0001
0.06
0.80
Values are mean ± SD, or n (%). *p< 0.01, †p <0.001 AVo2Diff = arterial-venous oxygen content difference; EDV = end-diastolic volume; other abbreviations as in Table 1
AVO2 diff estimation by CO estim and VO2

Signs and Symptoms
HFpEF HFrEF
Determinants of the O2 Transport and Utilization Chain Framed on the Fick Principle
Exercise Intolerance Dyspnea and Fatigue
Organ limiting steps in O2 uptake
[convection (delivery), release, diffusion and use]
Low Pcap O2 High PvO2
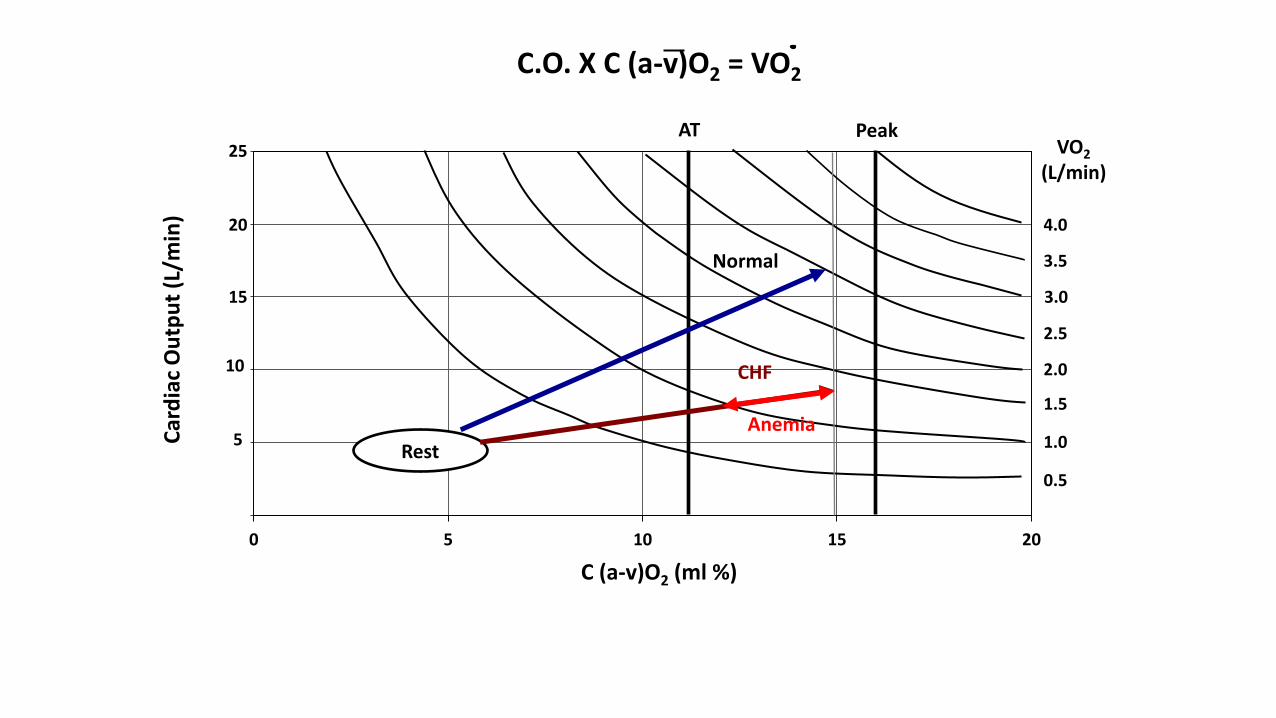
VO2 = C.O. x C (a-v) O2
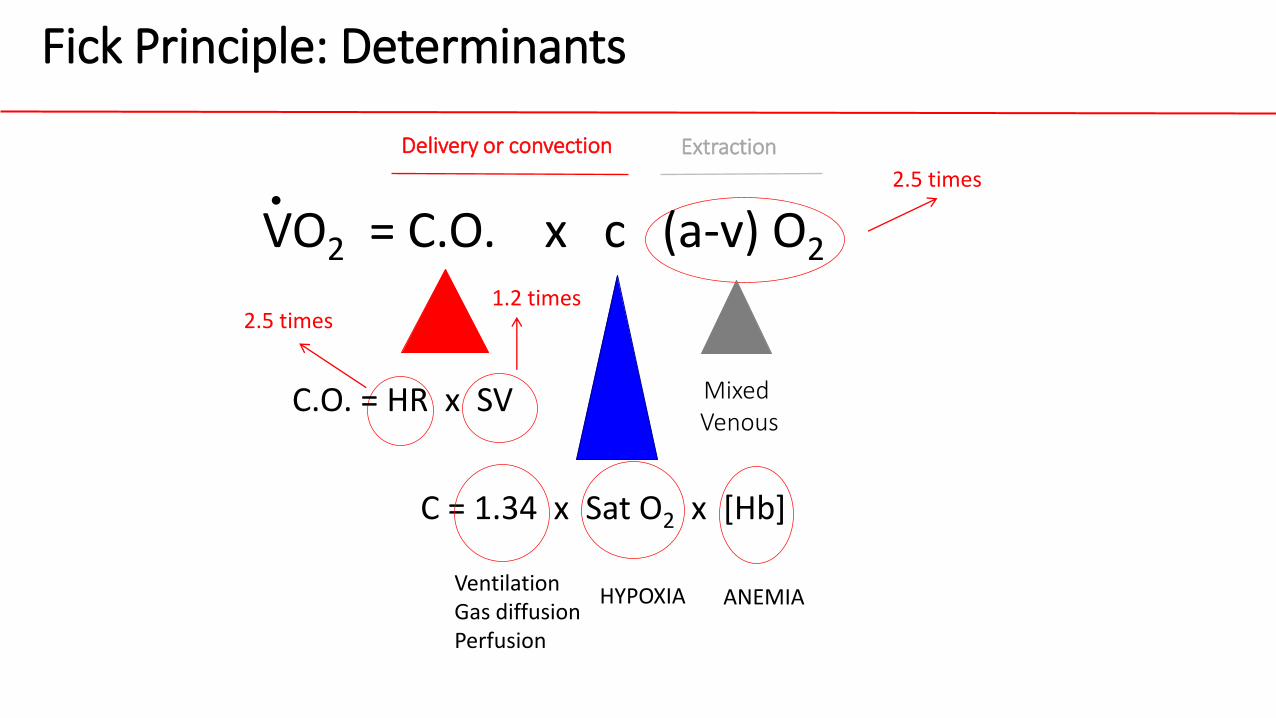
2.5 times 1.2 times
2.5 times
VO2 = C.O. x c (a-v) O2
C.O. = HR x SV
C = 1.34 x Sat O2 x [Hb]
Fick Principle: Determinants
.
Mixed Venous
Ventilation Gas diffusion Perfusion
ANEMIA HYPOXIA
Delivery or convection Extraction
0
0,5
1
1,5
2
2,5
0 5 10 15 20
VO2 (L/min)
4.0
3.5
3.0
2.5
2.0
1.5
1.0
0.5
25
20
15
10
5
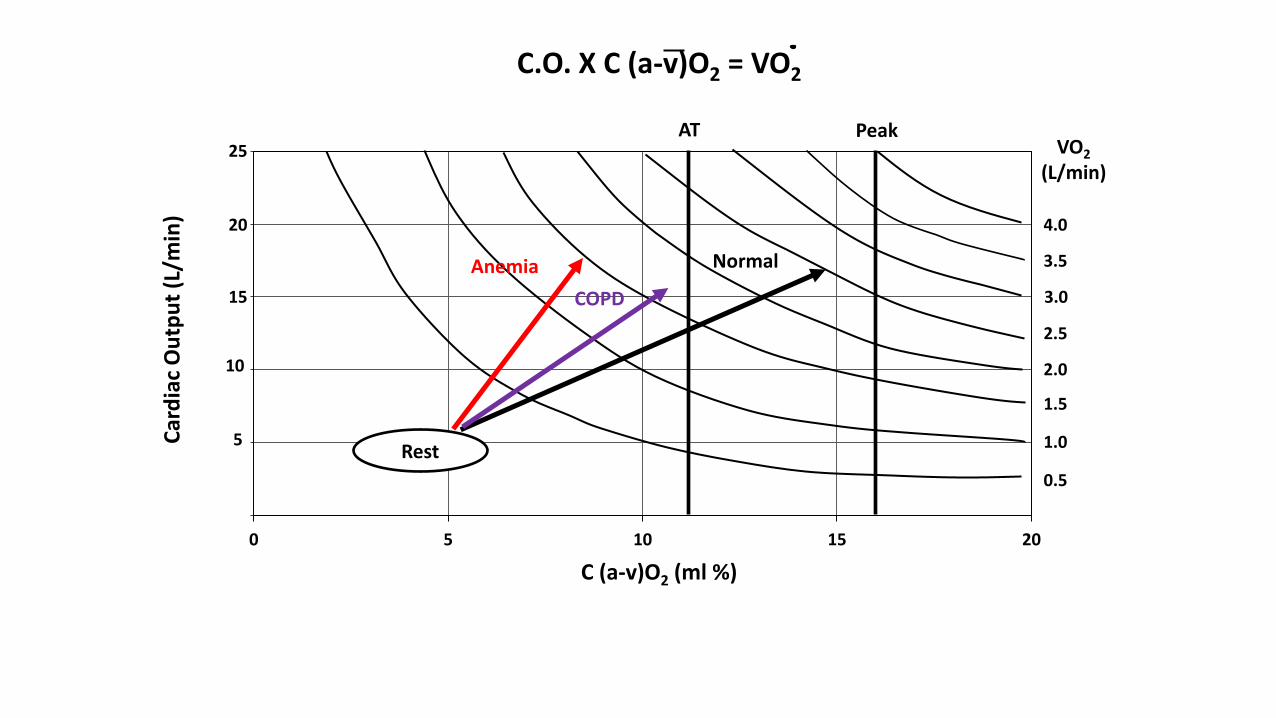
AT Peak
Normal
Rest
C (a-v)O2 (ml %)
Car
dia
c O
utp
ut
(L/m
in)
Anemia
C.O. X C (a-v)O2 = VO2
COPD
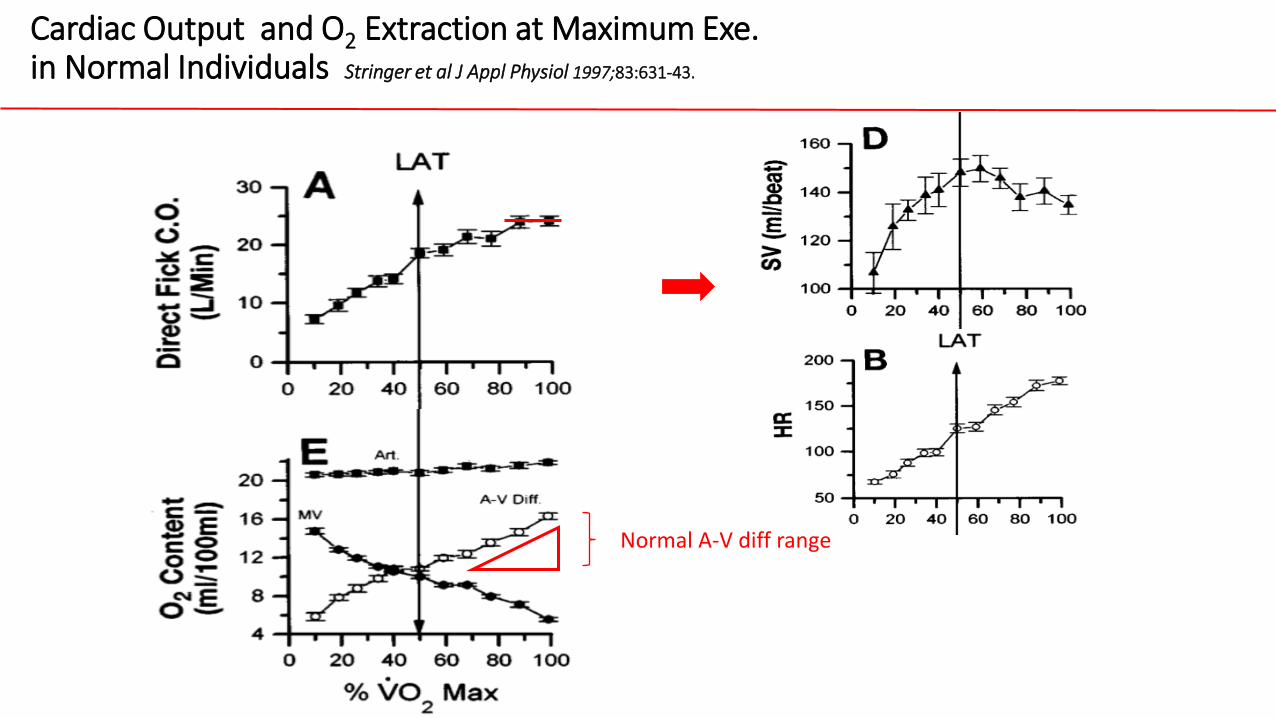
Cardiac Output and O2 Extraction at Maximum Exe. in Normal Individuals Stringer et al J Appl Physiol 1997;83:631-43.
Normal A-V diff range
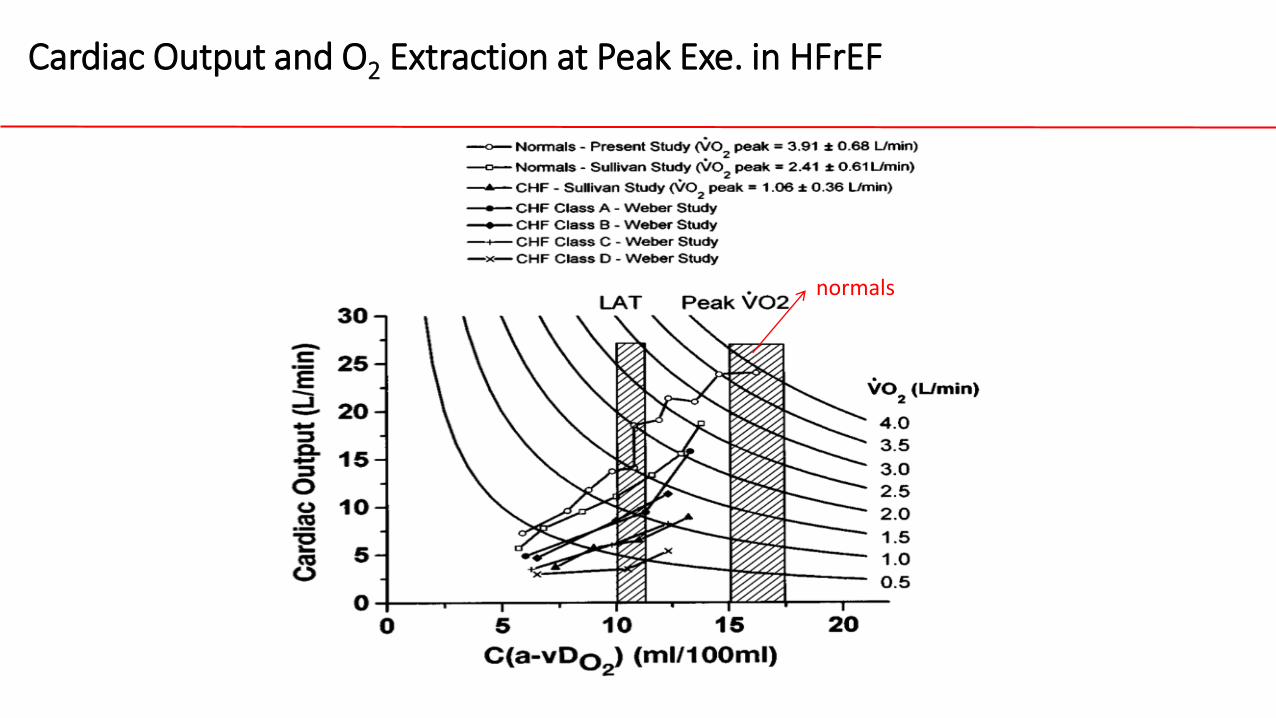
Cardiac Output and O2 Extraction at Peak Exe. in HFrEF
normals
0
0,5
1
1,5
2
2,5
0 5 10 15 20
VO2 (L/min)
4.0
3.5
3.0
2.5
2.0
1.5
1.0
0.5
25
20
15
10
5
AT Peak
Normal
Rest
C (a-v)O2 (ml %)
Car
dia
c O
utp
ut
(L/m
in)
C.O. X C (a-v)O2 = VO2
CHF
Anemia
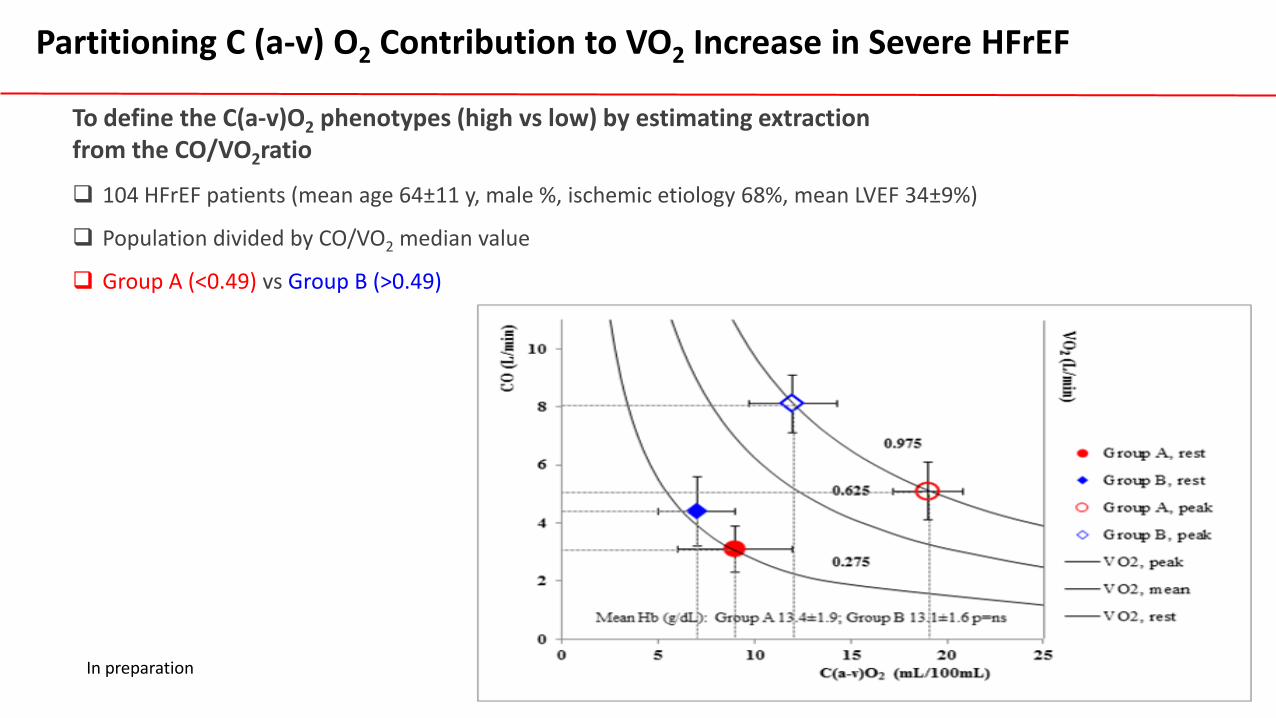
Partitioning C (a-v) O2 Contribution to VO2 Increase in Severe HFrEF
104 HFrEF patients (mean age 64±11 y, male %, ischemic etiology 68%, mean LVEF 34±9%)
Population divided by CO/VO2 median value
Group A (<0.49) vs Group B (>0.49)
In preparation
To define the C(a-v)O2 phenotypes (high vs low) by estimating extraction from the CO/VO2ratio
Variables
Group A
(n=52)
Group B
(n=52)
p value
Rest Peak Rest Peak Rest Peak
CPET
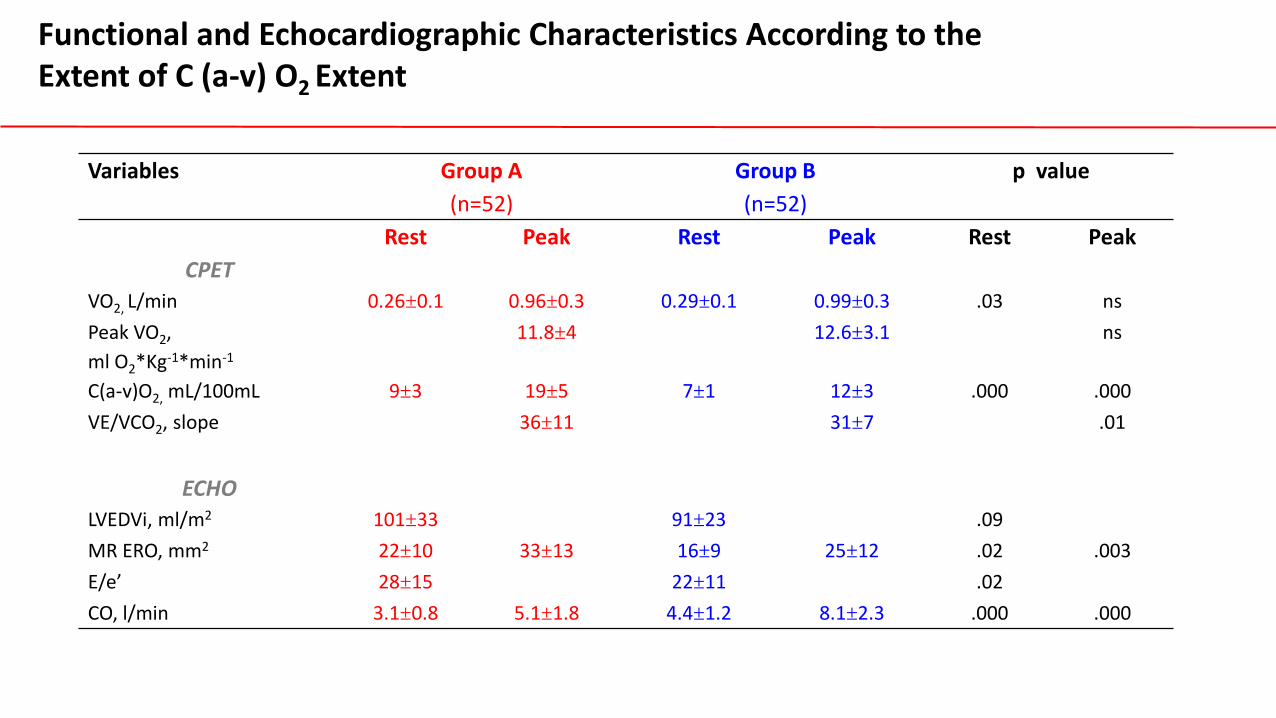
VO2, L/min 0.26±0.1 0.96±0.3 0.29±0.1 0.99±0.3 .03 ns
Peak VO2,
ml O2*Kg-1*min-1
11.8±4 12.6±3.1 ns
C(a-v)O2, mL/100mL 9±3 19±5 7±1 12±3 .000 .000
VE/VCO2, slope 36±11 31±7 .01
ECHO
LVEDVi, ml/m2 101±33 91±23 .09
MR ERO, mm2 22±10 33±13 16±9 25±12 .02 .003
E/e’ 28±15 22±11 .02
CO, l/min 3.1±0.8 5.1±1.8 4.4±1.2 8.1±2.3 .000 .000
Functional and Echocardiographic Characteristics According to the Extent of C (a-v) O2 Extent
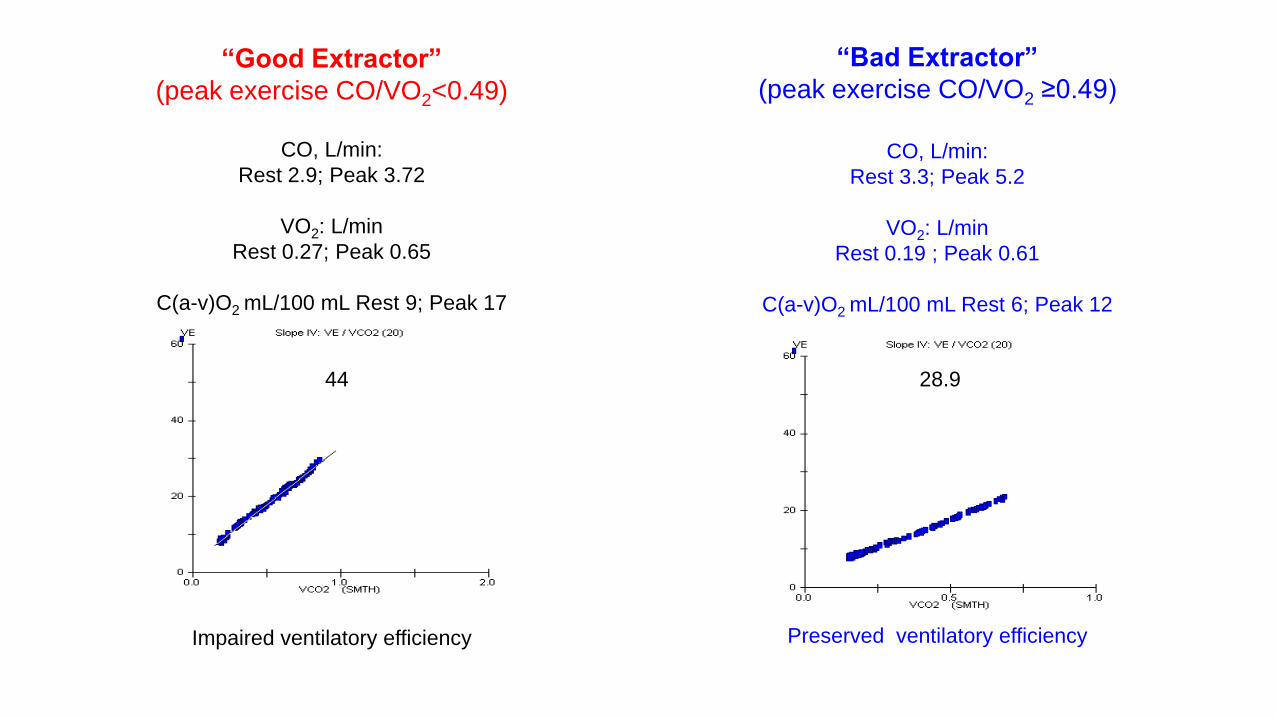
“Good Extractor”
(peak exercise CO/VO2<0.49)
“Bad Extractor”
(peak exercise CO/VO2 ≥0.49)
Impaired ventilatory efficiency
CO, L/min:
Rest 2.9; Peak 3.72
VO2: L/min
Rest 0.27; Peak 0.65
C(a-v)O2 mL/100 mL Rest 9; Peak 17
CO, L/min:
Rest 3.3; Peak 5.2
VO2: L/min
Rest 0.19 ; Peak 0.61
C(a-v)O2 mL/100 mL Rest 6; Peak 12
Preserved ventilatory efficiency
28.9 44

Effects of Exe. Central Blood Flow Distribution on Fick Principle in HFrEF
110 HFrEF patients (mean age 65±11 y, male %, ischemic etiology 64%, mean LVEF
32±8%) divided by severe MR
33 Controls
In preparation
To define the role of mitral regurgitation on C(a-v)O2, CO and related functional phenotype

+20% 1
2
3
4
5
6
7
8
9
10
2 7 12 22
C (a-v)O2 (mL/100mL)
CO (L/min)
peak VO2
1.03 ± 0.32 L/min
peak VO2
1.33 ± 0.6 L/min
rest VO2
0.27 ± 0.08 mL/min
rest VO2
0.27 ± 0.06 mL/min
rest VO2
0.28 ± 0.09 mL/min
- 40%
peak VO2
0.82 ± 0.26 mL/min
-20%
CONTROLS
no MR
MR

Variables
Group A
(n=24)
Group B
(n=80)
p value
Rest Peak Rest Peak Rest Peak
CPET
Peak VO2, ml O2*Kg-1*min-1 11.0±4 13.3±3 .01
C(a-v)O2, mL/100mL 8±3 19±4 7.5±1 14±4 .000 .000
VE/VCO2, slope 37±10 31±6 .01
ECHO
LVEDVi, ml/m2 111±30 89±22 .07
E/e’ 28±15 22±11 .02
CO, l/min 3.5±0.8 5.1±1.8 3.8±1.2 7.0±2.3 .000 .000
Functional and Echocardiographic Characteristics According to MR
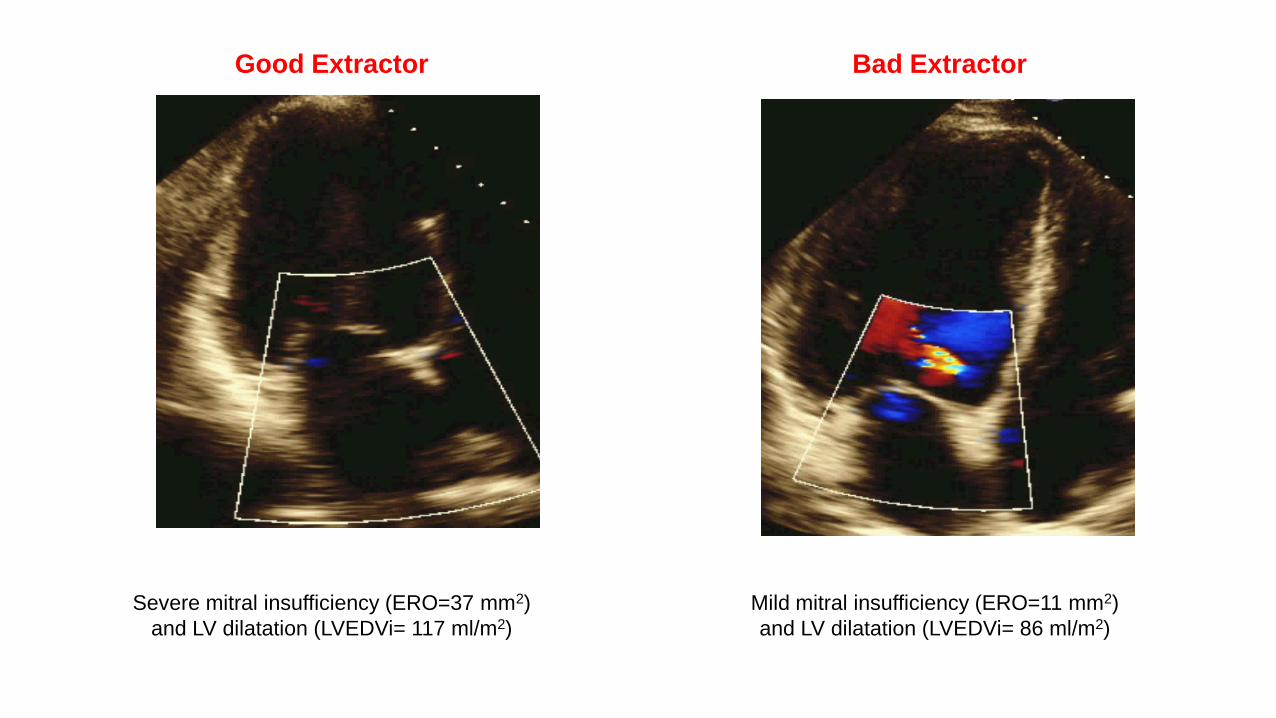
Good Extractor
Severe mitral insufficiency (ERO=37 mm2)
and LV dilatation (LVEDVi= 117 ml/m2)
Bad Extractor
Mild mitral insufficiency (ERO=11 mm2)
and LV dilatation (LVEDVi= 86 ml/m2)
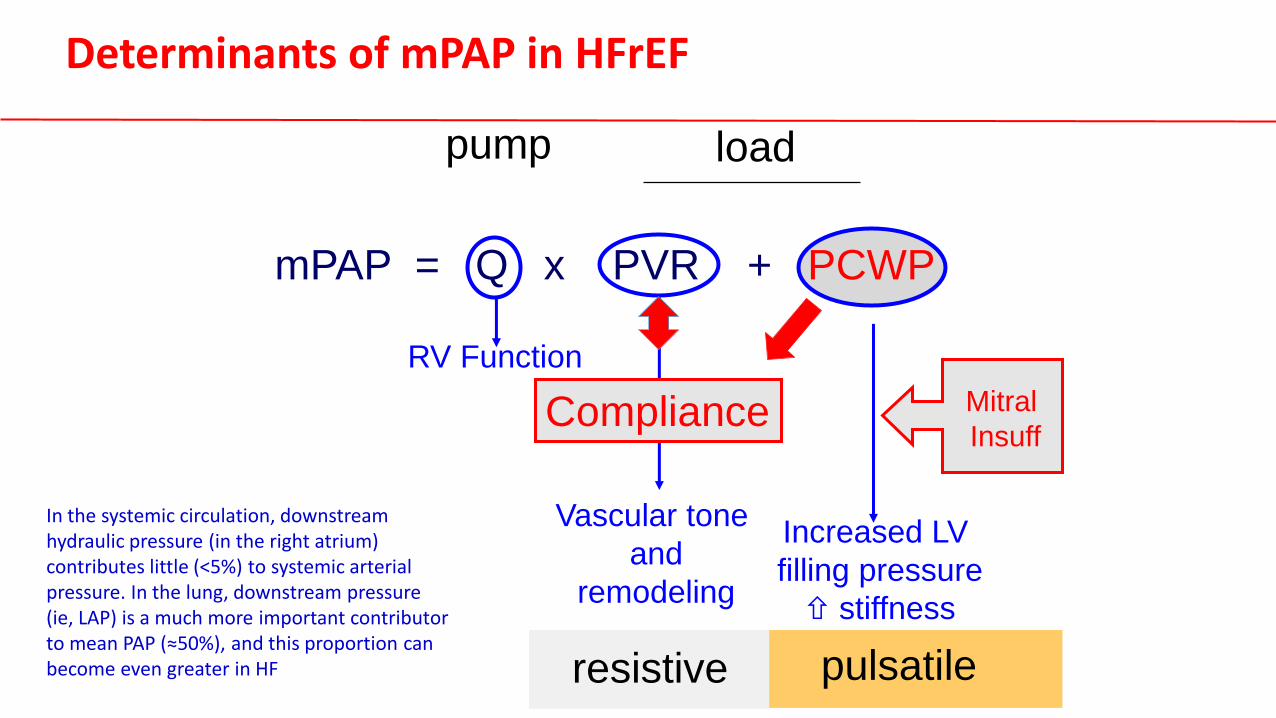
Increased LV
filling pressure
stiffness
pulsatile resistive
mPAP = Q x PVR + PCWP
RV Function
Vascular tone
and
remodeling
pump load
Compliance Mitral
Insuff
Determinants of mPAP in HFrEF
In the systemic circulation, downstream hydraulic pressure (in the right atrium) contributes little (<5%) to systemic arterial pressure. In the lung, downstream pressure (ie, LAP) is a much more important contributor to mean PAP (≈50%), and this proportion can become even greater in HF
ò
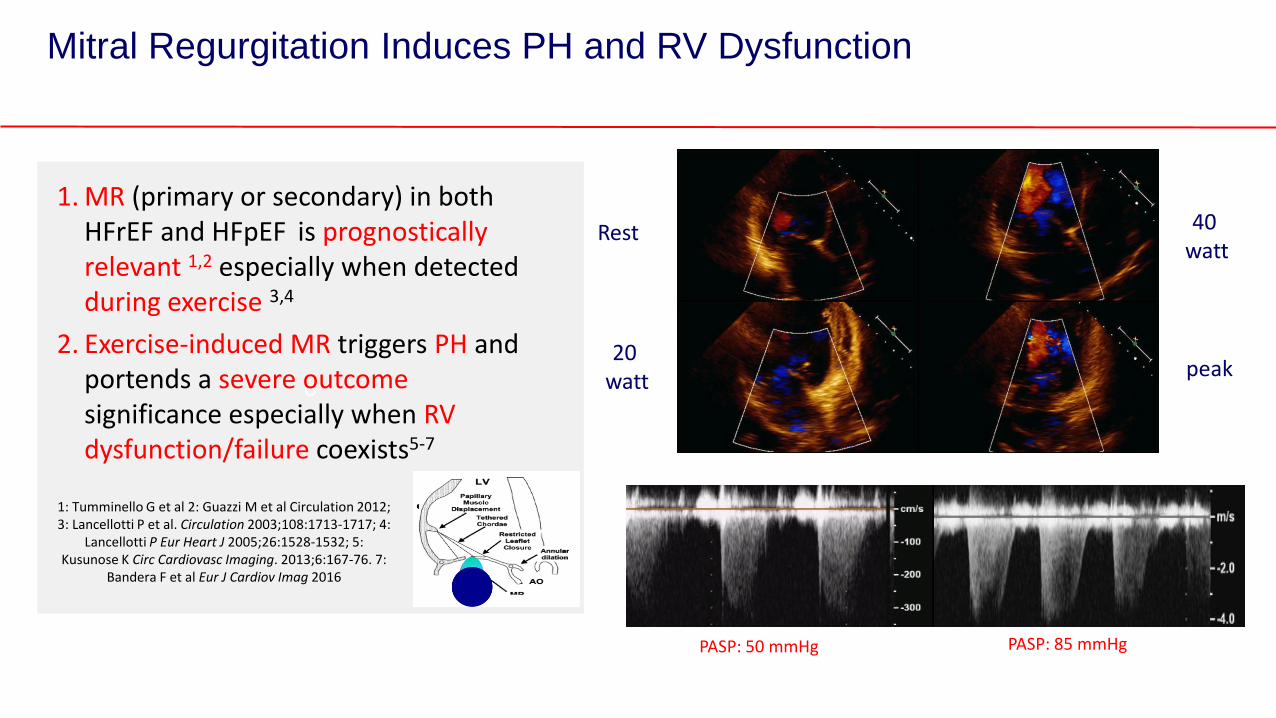
Mitral Regurgitation Induces PH and RV Dysfunction
1. MR (primary or secondary) in both HFrEF and HFpEF is prognostically relevant 1,2 especially when detected during exercise 3,4
2. Exercise-induced MR triggers PH and portends a severe outcome significance especially when RV dysfunction/failure coexists5-7
1: Tumminello G et al 2: Guazzi M et al Circulation 2012; 3: Lancellotti P et al. Circulation 2003;108:1713-1717; 4:
Lancellotti P Eur Heart J 2005;26:1528-1532; 5: Kusunose K Circ Cardiovasc Imaging. 2013;6:167-76. 7:
Bandera F et al Eur J Cardiov Imag 2016
Rest
20 watt
40 watt
peak
PASP: 50 mmHg PASP: 85 mmHg
B
C
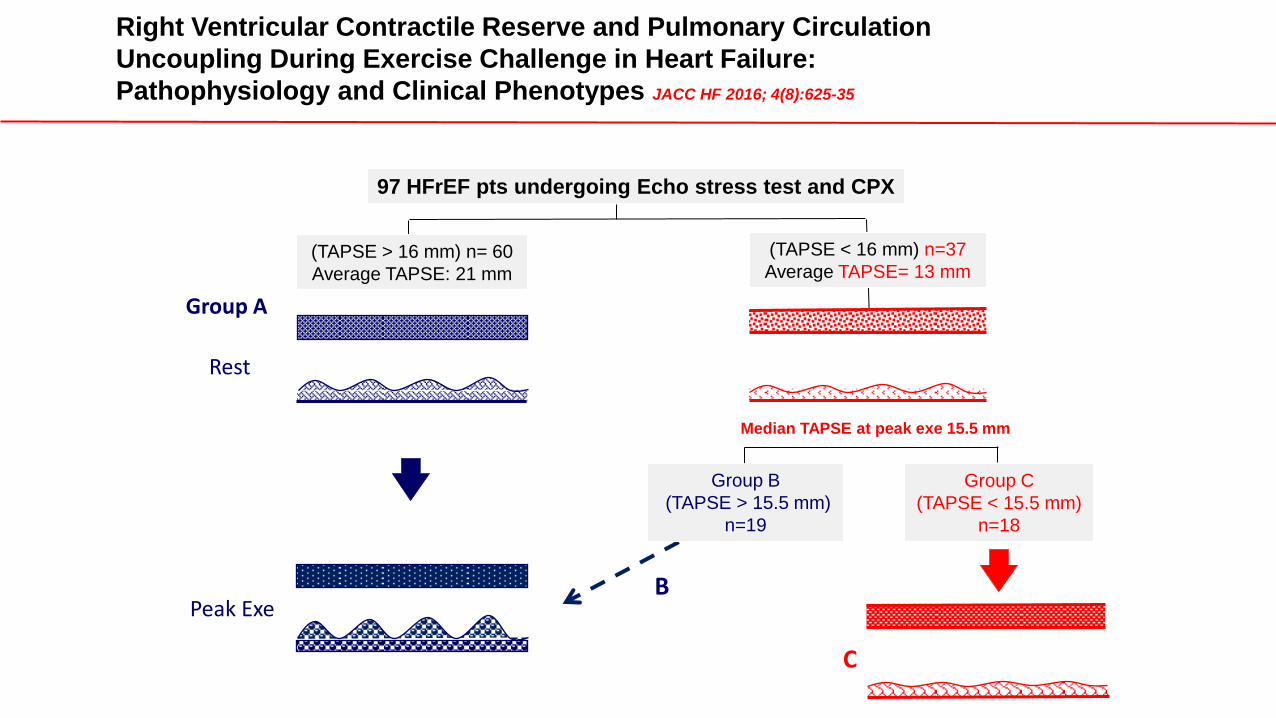
97 HFrEF pts undergoing Echo stress test and CPX
(TAPSE < 16 mm) n=37
Average TAPSE= 13 mm (TAPSE > 16 mm) n= 60
Average TAPSE: 21 mm
Median TAPSE at peak exe 15.5 mm
Group C
(TAPSE < 15.5 mm)
n=18
Group B
(TAPSE > 15.5 mm)
n=19
Right Ventricular Contractile Reserve and Pulmonary Circulation
Uncoupling During Exercise Challenge in Heart Failure:
Pathophysiology and Clinical Phenotypes JACC HF 2016; 4(8):625-35
Group A
Peak Exe
Rest
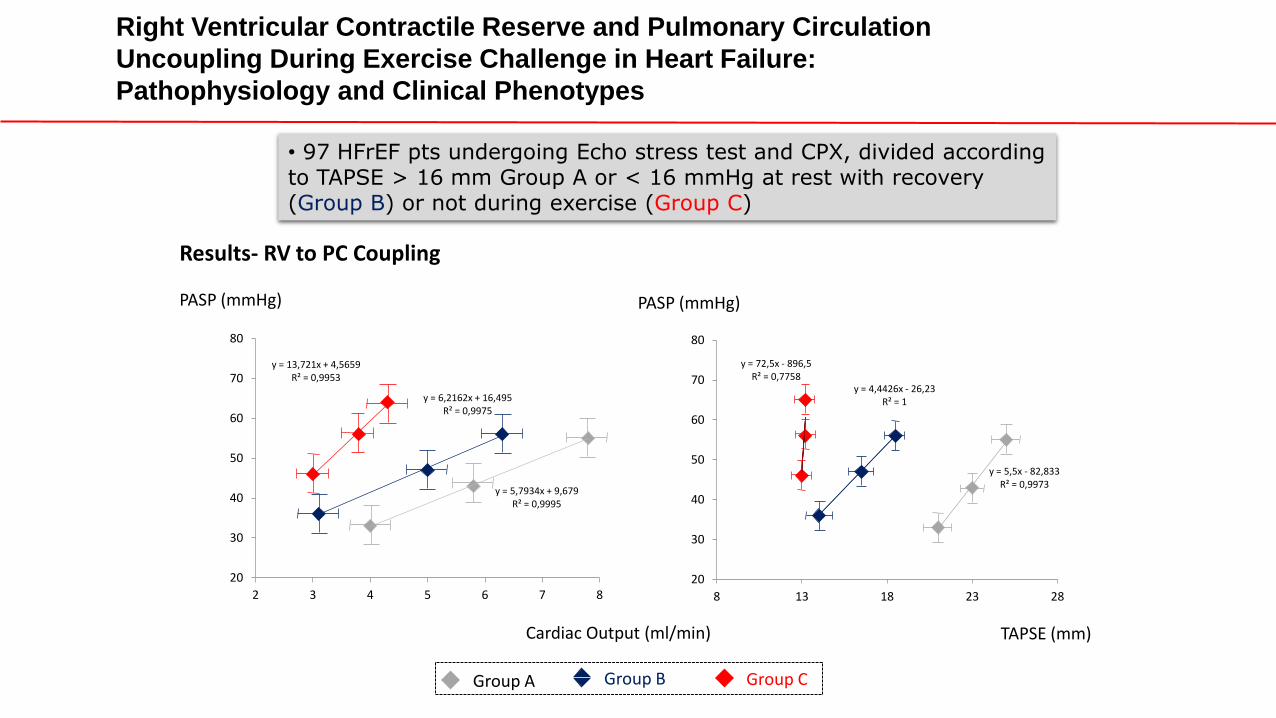
Results- RV to PC Coupling
y = 72,5x - 896,5 R² = 0,7758
y = 4,4426x - 26,23 R² = 1
y = 5,5x - 82,833 R² = 0,9973
20
30
40
50
60
70
80
8 13 18 23 28
PASP (mmHg)
TAPSE (mm)
y = 13,721x + 4,5659 R² = 0,9953
y = 6,2162x + 16,495 R² = 0,9975
y = 5,7934x + 9,679 R² = 0,9995
20
30
40
50
60
70
80
2 3 4 5 6 7 8
PASP (mmHg)
Cardiac Output (ml/min)
Group A Group B Group C
Right Ventricular Contractile Reserve and Pulmonary Circulation
Uncoupling During Exercise Challenge in Heart Failure:
Pathophysiology and Clinical Phenotypes
• 97 HFrEF pts undergoing Echo stress test and CPX, divided according to TAPSE > 16 mm Group A or < 16 mmHg at rest with recovery (Group B) or not during exercise (Group C)
PASP, mmHg FORCE
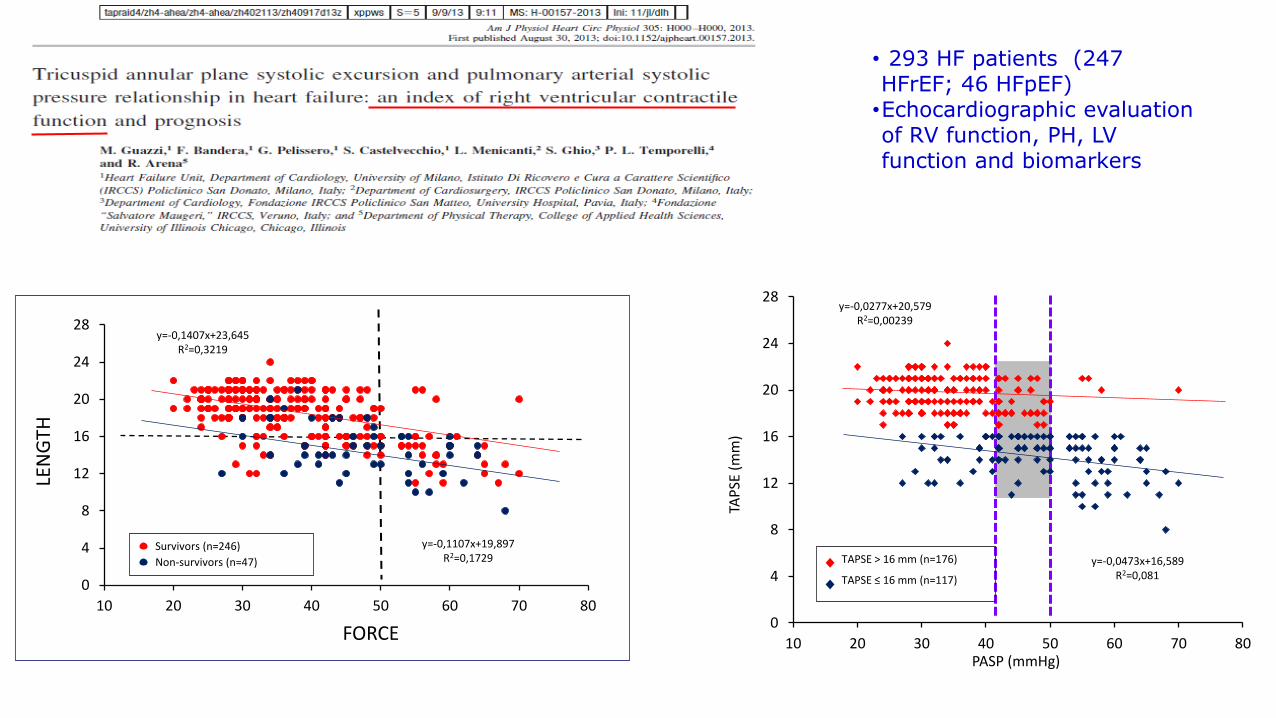
• 293 HF patients (247 HFrEF; 46 HFpEF) •Echocardiographic evaluation of RV function, PH, LV function and biomarkers
0
4
8
12
16
20
24
28
10 20 30 40 50 60 70 80
TAP
SE (
mm
)
Survivors (n=246)
Non-survivors (n=47)
y=-0,1107x+19,897 R2=0,1729
y=-0,1407x+23,645 R2=0,3219
LEN
GTH
0
4
8
12
16
20
24
28
10 20 30 40 50 60 70 80 PASP (mmHg)
TAP
SE (
mm
)
TAPSE > 16 mm (n=176)
TAPSE ≤ 16 mm (n=117)
y=-0,0277x+20,579 R2=0,00239
y=-0,0473x+16,589 R2=0,081

Group A
y = -0,0321x + 21,785
y = -0,0151x + 23,32
0
5
10
15
20
25
30
0 25 50 75 100 125 150
TAPSE (mm)
PASP (mmHg)
Group C
PASP (mmHg)
TAPSE (mm)
y = -0,0136x + 13,204
y = -0,0344x + 14,977
0
5
10
15
20
25
30
0 25 50 75 100 125 150
Group B TAPSE (mm)
PASP (mmHg)
y = -0,0002x + 14,008
y = 0,0081x + 17,682
0
5
10
15
20
25
30
0 25 50 75 100 125 150
Full simbols: Rest Empty symbols: Peak exercise
Results- RV Contractile Reserve (TAPSE vs PASP relationship at rest and peak exe)
Right Ventricular Contractile Reserve and Pulmonary Circulation
Uncoupling During Exercise Challenge in Heart Failure:
Pathophysiology and Clinical Phenotypes
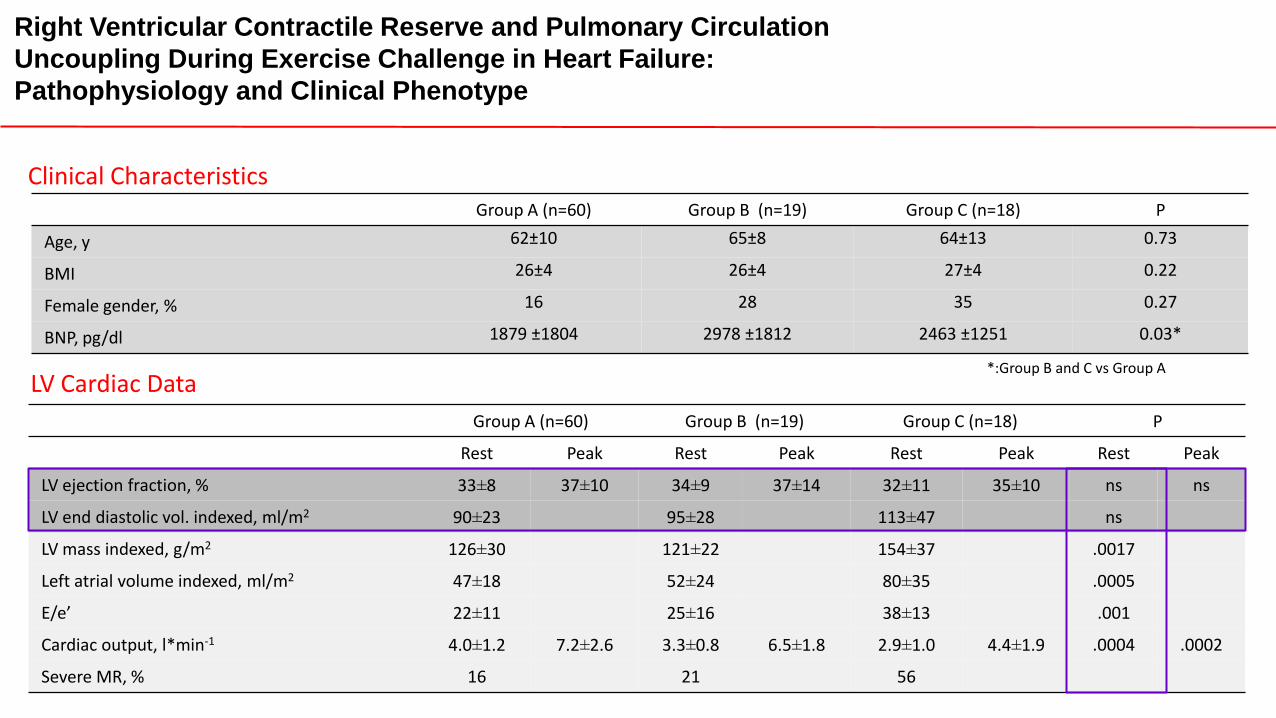
LV Cardiac Data
Group A (n=60) Group B (n=19) Group C (n=18) P
Rest Peak Rest Peak Rest Peak Rest Peak
LV ejection fraction, % 33±8 37±10 34±9 37±14 32±11 35±10 ns ns
LV end diastolic vol. indexed, ml/m2 90±23 95±28 113±47 ns
LV mass indexed, g/m2 126±30 121±22 154±37 .0017
Left atrial volume indexed, ml/m2 47±18 52±24 80±35 .0005
E/e’ 22±11 25±16 38±13 .001
Cardiac output, l*min-1 4.0±1.2 7.2±2.6 3.3±0.8 6.5±1.8 2.9±1.0 4.4±1.9 .0004 .0002
Severe MR, % 16 21 56
Group A (n=60) Group B (n=19) Group C (n=18) P
Age, y 62±10 65±8 64±13 0.73
BMI 26±4 26±4 27±4 0.22
Female gender, % 16 28 35 0.27
BNP, pg/dl 1879 ±1804 2978 ±1812 2463 ±1251 0.03*
Clinical Characteristics
*:Group B and C vs Group A
Right Ventricular Contractile Reserve and Pulmonary Circulation
Uncoupling During Exercise Challenge in Heart Failure:
Pathophysiology and Clinical Phenotype
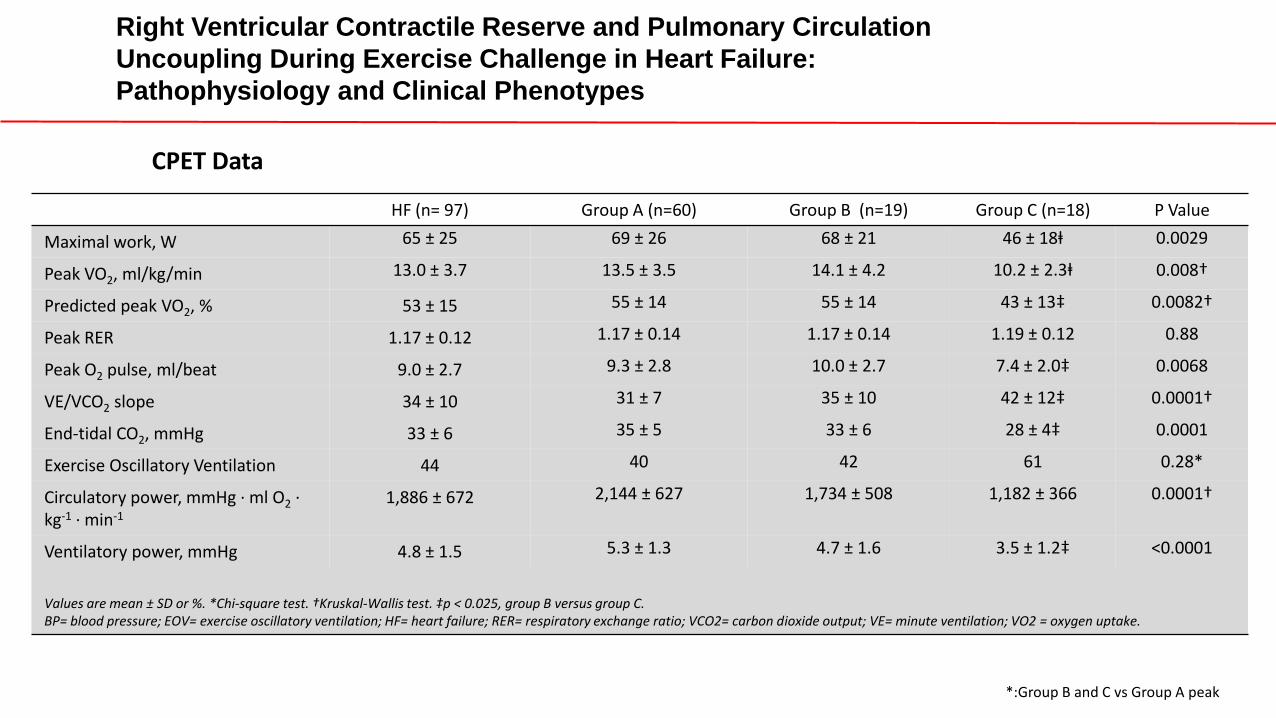
HF (n= 97) Group A (n=60) Group B (n=19) Group C (n=18) P Value
Maximal work, W 65 ± 25 69 ± 26 68 ± 21 46 ± 18ⱡ 0.0029
Peak VO2, ml/kg/min 13.0 ± 3.7 13.5 ± 3.5 14.1 ± 4.2 10.2 ± 2.3ⱡ 0.008†
Predicted peak VO2, % 53 ± 15 55 ± 14 55 ± 14 43 ± 13‡ 0.0082†
Peak RER 1.17 ± 0.12 1.17 ± 0.14 1.17 ± 0.14 1.19 ± 0.12 0.88
Peak O2 pulse, ml/beat 9.0 ± 2.7 9.3 ± 2.8 10.0 ± 2.7 7.4 ± 2.0‡ 0.0068
VE/VCO2 slope 34 ± 10 31 ± 7 35 ± 10 42 ± 12‡ 0.0001†
End-tidal CO2, mmHg 33 ± 6 35 ± 5 33 ± 6 28 ± 4‡ 0.0001
Exercise Oscillatory Ventilation 44 40 42 61 0.28*
Circulatory power, mmHg ∙ ml O2 ∙ kg-1 ∙ min-1
1,886 ± 672 2,144 ± 627 1,734 ± 508 1,182 ± 366 0.0001†
Ventilatory power, mmHg 4.8 ± 1.5 5.3 ± 1.3 4.7 ± 1.6 3.5 ± 1.2‡ <0.0001
Values are mean ± SD or %. *Chi-square test. †Kruskal-Wallis test. ‡p < 0.025, group B versus group C. BP= blood pressure; EOV= exercise oscillatory ventilation; HF= heart failure; RER= respiratory exchange ratio; VCO2= carbon dioxide output; VE= minute ventilation; VO2 = oxygen uptake.
*:Group B and C vs Group A peak
Right Ventricular Contractile Reserve and Pulmonary Circulation
Uncoupling During Exercise Challenge in Heart Failure:
Pathophysiology and Clinical Phenotypes
CPET Data
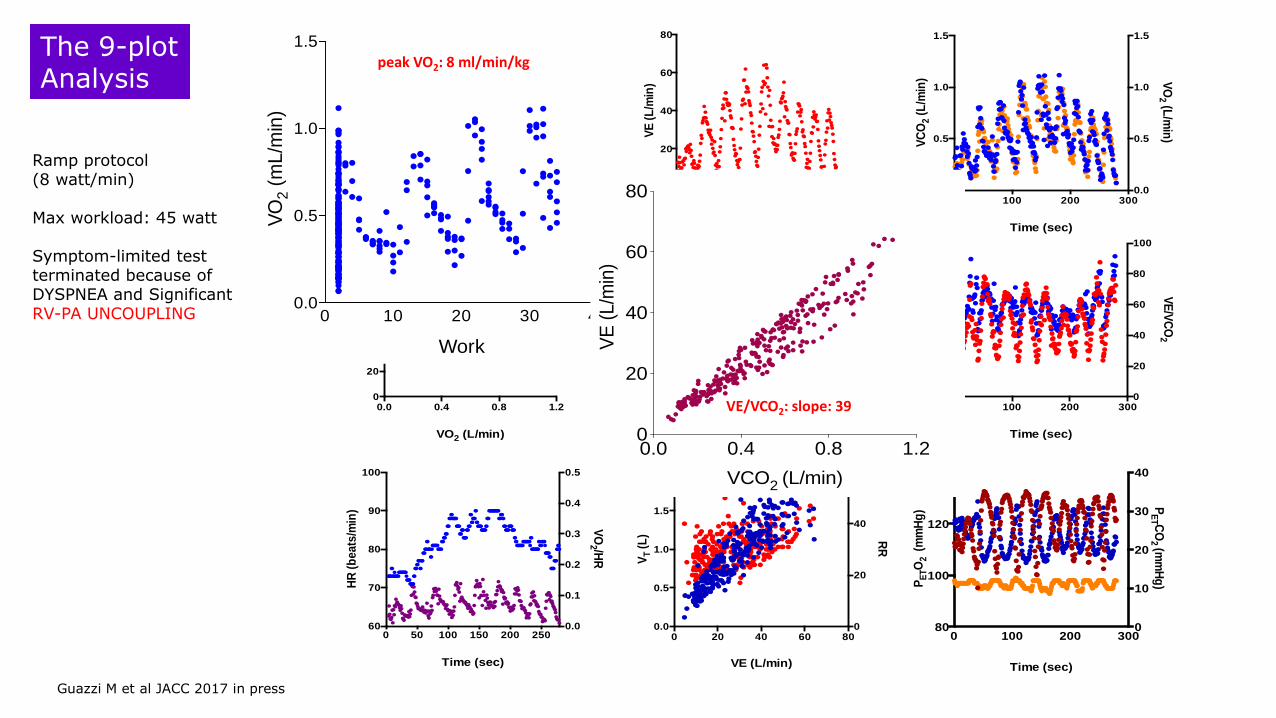
The 9-plot Analysis
Time (sec)
VE
(L
/min
)
0 100 200 3000
20
40
60
80
Time (sec)
VC
O2 (
L/m
in) V
O2 (L
/min
)
0 100 200 3000.0
0.5
1.0
1.5
0.0
0.5
1.0
1.5
VO2 (L/min)
HR
(b
pm
)
0.0 0.4 0.8 1.20
20
40
60
80
100
120
VCO2
VE
(L
/min
)
0.0 0.4 0.8 1.20
20
40
60
80
Time (sec)
VE
/VO
2
VE
/VC
O2
0 100 200 3000
2
4
6
8
10
0
20
40
60
80
100
Time (sec)
HR
(b
eats
/min
)
VO
2 /HR
0 50 100 150 200 25060
70
80
90
100
0.0
0.1
0.2
0.3
0.4
0.5
VE (L/min)
VT (
L) R
R
0 20 40 60 800.0
0.5
1.0
1.5
2.0
0
20
40
60
Time (sec)
PE
TO
2 (
mm
Hg
)
PE
T CO
2 (m
mH
g)
0 100 200 30080
100
120
140
0
10
20
30
40
Work
VO
2 (
mL
/min
)
0 10 20 30 400.0
0.5
1.0
1.5
Ramp protocol (8 watt/min) Max workload: 45 watt Symptom-limited test terminated because of DYSPNEA and Significant RV-PA UNCOUPLING 0 10 20 30 40
0.0
0.5
1.0
1.5
Work
VO
2 (
mL
/min
)
peak VO2: 8 ml/min/kg
0.0 0.4 0.8 1.20
20
40
60
80
VE
(L/m
in)
VCO2 (L/min)
VE/VCO2: slope: 39
Guazzi M et al JACC 2017 in press
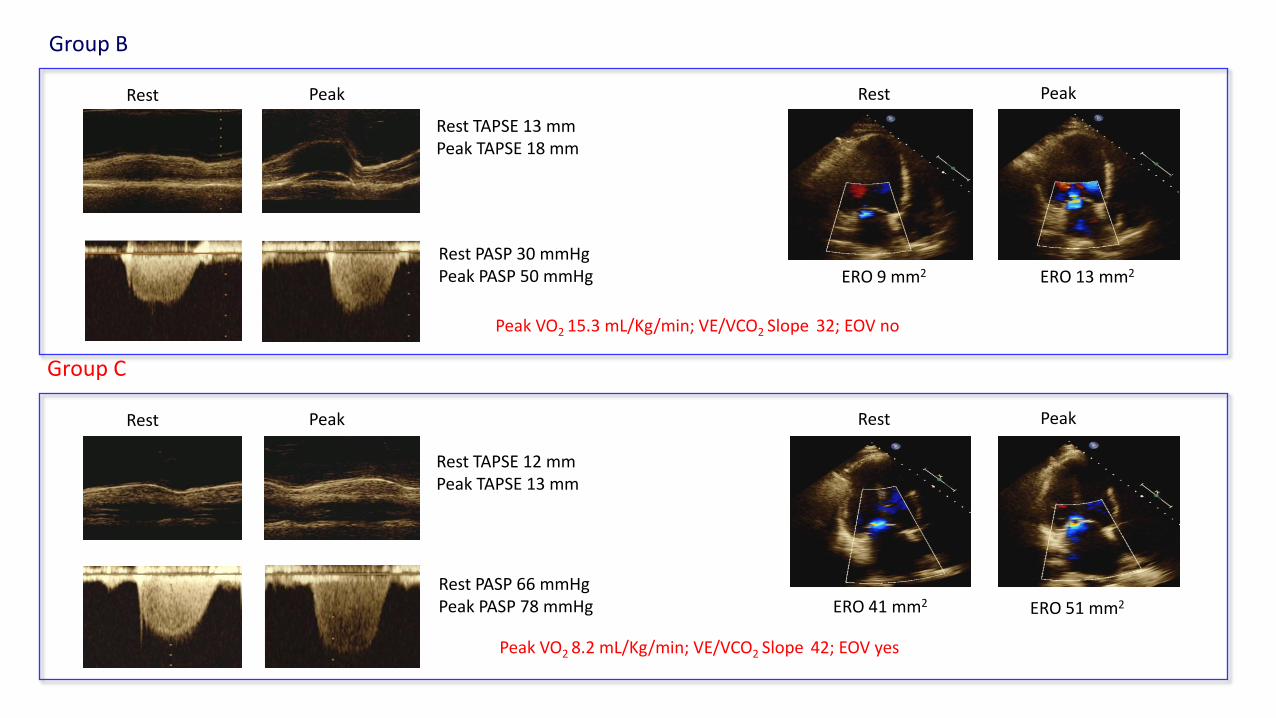
Peak VO2 15.3 mL/Kg/min; VE/VCO2 Slope 32; EOV no
Rest PASP 30 mmHg Peak PASP 50 mmHg
Rest Peak
Rest TAPSE 13 mm Peak TAPSE 18 mm
Rest Peak
ERO 9 mm2 ERO 13 mm2
Group B
Peak VO2 8.2 mL/Kg/min; VE/VCO2 Slope 42; EOV yes
Rest PASP 66 mmHg Peak PASP 78 mmHg
Rest Peak
Rest TAPSE 12 mm Peak TAPSE 13 mm
Rest Peak
ERO 41 mm2 ERO 51 mm2
Group C
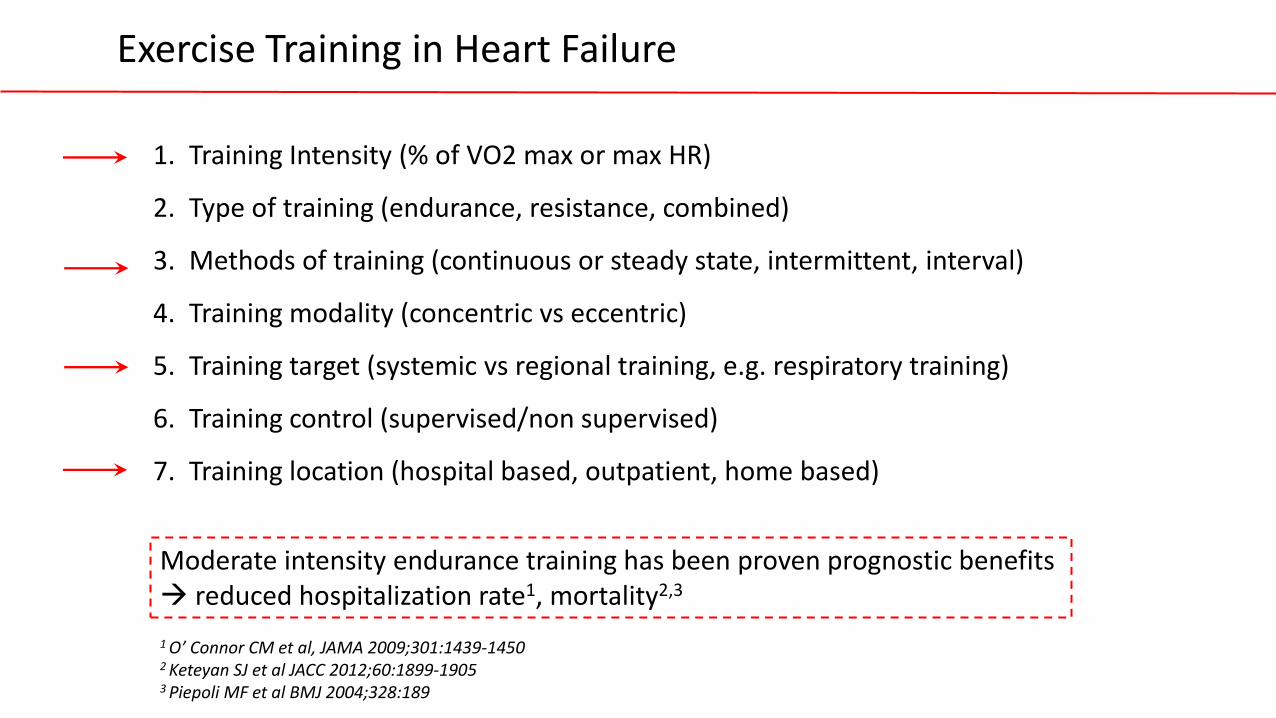
Exercise Training in Heart Failure
1. Training Intensity (% of VO2 max or max HR)
2. Type of training (endurance, resistance, combined)
3. Methods of training (continuous or steady state, intermittent, interval)
4. Training modality (concentric vs eccentric)
5. Training target (systemic vs regional training, e.g. respiratory training)
6. Training control (supervised/non supervised)
7. Training location (hospital based, outpatient, home based)
1 O’ Connor CM et al, JAMA 2009;301:1439-1450 2 Keteyan SJ et al JACC 2012;60:1899-1905 3 Piepoli MF et al BMJ 2004;328:189
Moderate intensity endurance training has been proven prognostic benefits reduced hospitalization rate1, mortality2,3
• “CPET imaging” seems now an evolving step to better phenotyping advanced HFrEF.
Conclusions and Outlook
• RV pump failure comes up as an early and quite underestimated mechanical cause of impaired performance and exhaustion.
• Mitral regurgitation is a sort of “central redistributor” of O2 delivery whose mechanistic implications on exercise are of novel interest for either extraction (exhaustion at maximum), RV to PC uncoupuling (increased load) and exercise ventilation inefficiency
• ET training in HF: the evidence is just for continuous, moderate intensity, supervised modalities