Embed Size (px)
Citation preview
Lesson 24: Percent and Rates per 100 Date: 4/1/14
187
© 2013 Common Core, Inc. Some rights reserved. commoncore.org This work is licensed under a Creative Commons Attribution-NonCommercial-ShareAlike 3.0 Unported License.
NYS COMMON CORE MATHEMATICS CURRICULUM 6•1 Lesson 24
Lesson 24: Percent and Rates per 100
Student Outcomes
Students understand that percents are related to part-to-whole ratios and rates where the whole is 100.
Students model percents and write a percent as a fraction over 100 or a decimal to the hundredths place.
Classwork
Example 1 (5 minutes)
Class begins with a discussion to gather prior knowledge and show relationship to real world applications.
Imagine that you are shopping. You want to purchase an item for but today it is off. What does
this mean?
It means that out of every dollars will be subtracted from the total.
What does this look like?
It could be a tape diagram with divided into ten sections of . 2 of the sections are saved and
are still paid for the item. It could also be shown on a grid, where of the squares are part
of the discount and still need to be paid.
How is this related to ratios and rates that we have been working on throughout this unit?
Answers will vary depending on prior knowledge. Some students may see that off of is
off. Other students may see that we are trying to find part of a whole.
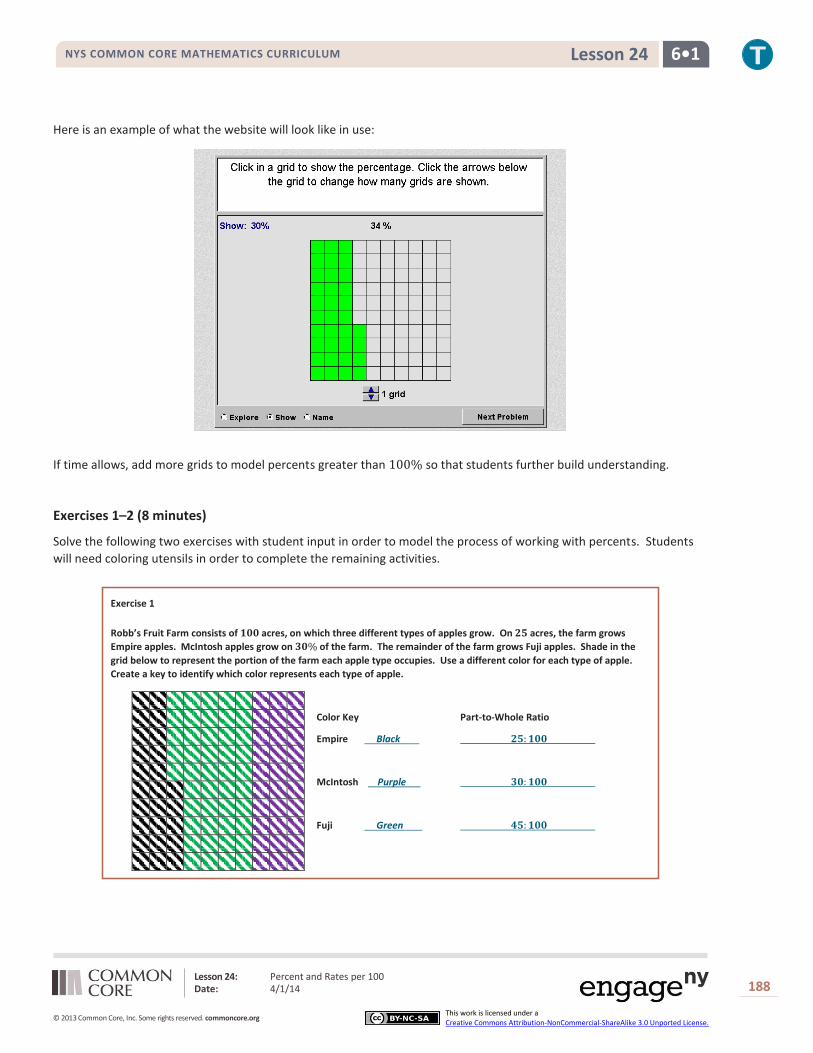
Use the following website on a projector to visually explore percents in a grid model.
http://nlvm.usu.edu/en/nav/frames_asid_333_g_3_t_1.html?from category_g_3_t_1.html
Click the explore button on the website to be able to show This will provide students with the visual for making
the connection that means out of .
What does this grid show?
blocks
How many are shaded in?
blocks
How many are not shaded in?
blocks
How can we use this model to help us think through off of
From the grid, I can see that when I save I am paying of the original value.
Now, they can see that they would be saving the and spending the when a item is off the original price.
Lesson 24: Percent and Rates per 100 Date: 4/1/14
188
© 2013 Common Core, Inc. Some rights reserved. commoncore.org This work is licensed under a Creative Commons Attribution-NonCommercial-ShareAlike 3.0 Unported License.
NYS COMMON CORE MATHEMATICS CURRICULUM 6•1 Lesson 24
Here is an example of what the website will look like in use:
If time allows, add more grids to model percents greater than so that students further build understanding.
Exercises 1–2 (8 minutes)
Solve the following two exercises with student input in order to model the process of working with percents. Students
will need coloring utensils in order to complete the remaining activities.
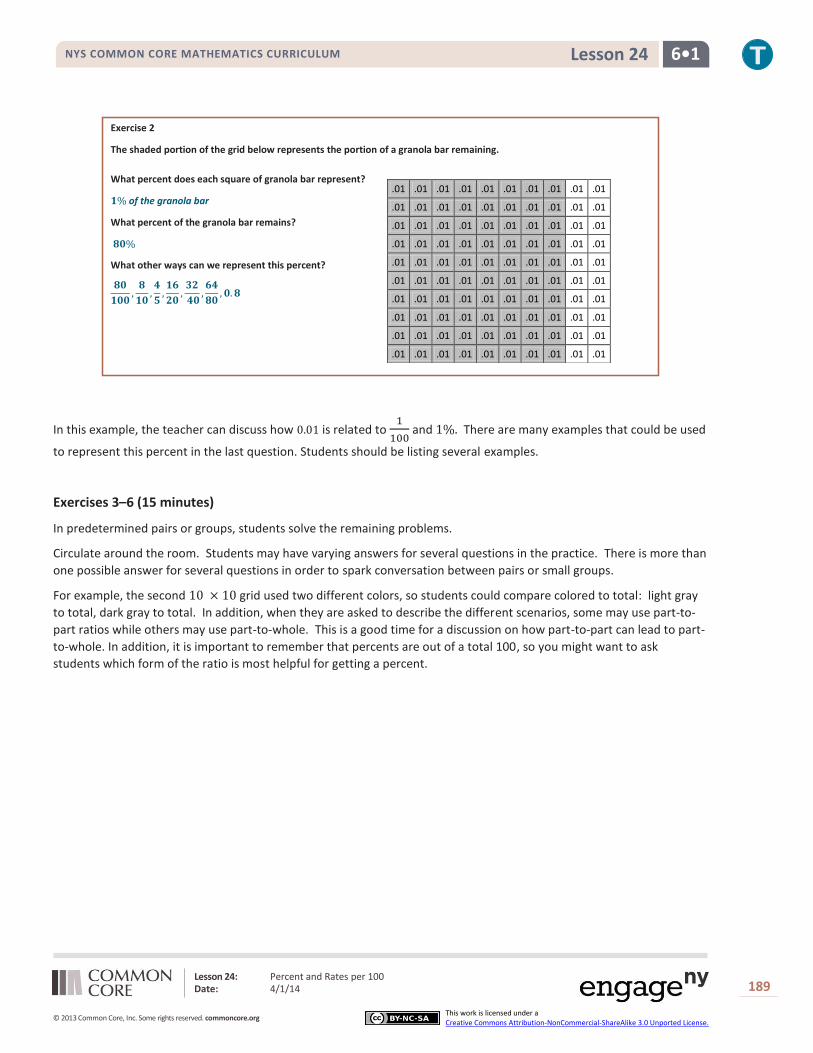
Exercise 1
Robb’s Fruit Farm consists of acres, on which three different types of apples grow. On acres, the farm grows
Empire apples. McIntosh apples grow on of the farm. The remainder of the farm grows Fuji apples. Shade in the
grid below to represent the portion of the farm each apple type occupies. Use a different color for each type of apple.
Create a key to identify which color represents each type of apple.
Color Key Part-to-Whole Ratio
Empire Black
McIntosh Purple
Fuji Green
Lesson 24: Percent and Rates per 100 Date: 4/1/14
189
© 2013 Common Core, Inc. Some rights reserved. commoncore.org This work is licensed under a Creative Commons Attribution-NonCommercial-ShareAlike 3.0 Unported License.
NYS COMMON CORE MATHEMATICS CURRICULUM 6•1 Lesson 24
Exercise 2
The shaded portion of the grid below represents the portion of a granola bar remaining.
What percent does each square of granola bar represent?
of the granola bar
What percent of the granola bar remains?
What other ways can we represent this percent?
In this example, the teacher can discuss how is related to
and There are many examples that could be used
to represent this percent in the last question. Students should be listing several examples.
Exercises 3–6 (15 minutes)
In predetermined pairs or groups, students solve the remaining problems.
Circulate around the room. Students may have varying answers for several questions in the practice. There is more than
one possible answer for several questions in order to spark conversation between pairs or small groups.
For example, the second grid used two different colors, so students could compare colored to total: light gray
to total, dark gray to total. In addition, when they are asked to describe the different scenarios, some may use part-to-
part ratios while others may use part-to-whole. This is a good time for a discussion on how part-to-part can lead to part-
to-whole. In addition, it is important to remember that percents are out of a total 100, so you might want to ask
students which form of the ratio is most helpful for getting a percent.
.01 .01 .01 .01 .01 .01 .01 .01 .01 .01
.01 .01 .01 .01 .01 .01 .01 .01 .01 .01
.01 .01 .01 .01 .01 .01 .01 .01 .01 .01
.01 .01 .01 .01 .01 .01 .01 .01 .01 .01
.01 .01 .01 .01 .01 .01 .01 .01 .01 .01
.01 .01 .01 .01 .01 .01 .01 .01 .01 .01
.01 .01 .01 .01 .01 .01 .01 .01 .01 .01
.01 .01 .01 .01 .01 .01 .01 .01 .01 .01
.01 .01 .01 .01 .01 .01 .01 .01 .01 .01
.01 .01 .01 .01 .01 .01 .01 .01 .01 .01
Lesson 24: Percent and Rates per 100 Date: 4/1/14
190
© 2013 Common Core, Inc. Some rights reserved. commoncore.org This work is licensed under a Creative Commons Attribution-NonCommercial-ShareAlike 3.0 Unported License.
NYS COMMON CORE MATHEMATICS CURRICULUM 6•1 Lesson 24
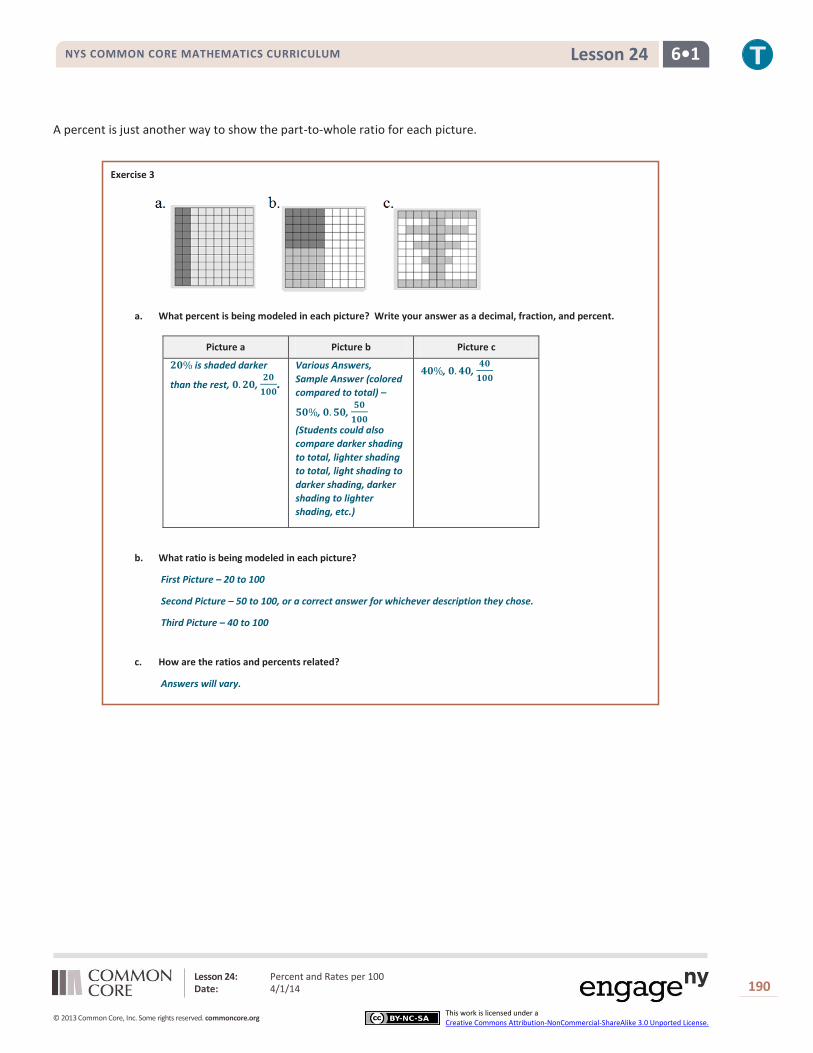
A percent is just another way to show the part-to-whole ratio for each picture.
Exercise 3
a. What percent is being modeled in each picture? Write your answer as a decimal, fraction, and percent.
b. What ratio is being modeled in each picture?
First Picture – 20 to 100
Second Picture – 50 to 100, or a correct answer for whichever description they chose.
Third Picture – 40 to 100
c. How are the ratios and percents related?
Answers will vary.
Picture a Picture b Picture c
is shaded darker
than the rest, ,
.
Various Answers,
Sample Answer (colored
compared to total) –
, ,
(Students could also
compare darker shading
to total, lighter shading
to total, light shading to
darker shading, darker
shading to lighter
shading, etc.)
, ,
Lesson 24: Percent and Rates per 100 Date: 4/1/14
191
© 2013 Common Core, Inc. Some rights reserved. commoncore.org This work is licensed under a Creative Commons Attribution-NonCommercial-ShareAlike 3.0 Unported License.
NYS COMMON CORE MATHEMATICS CURRICULUM 6•1 Lesson 24
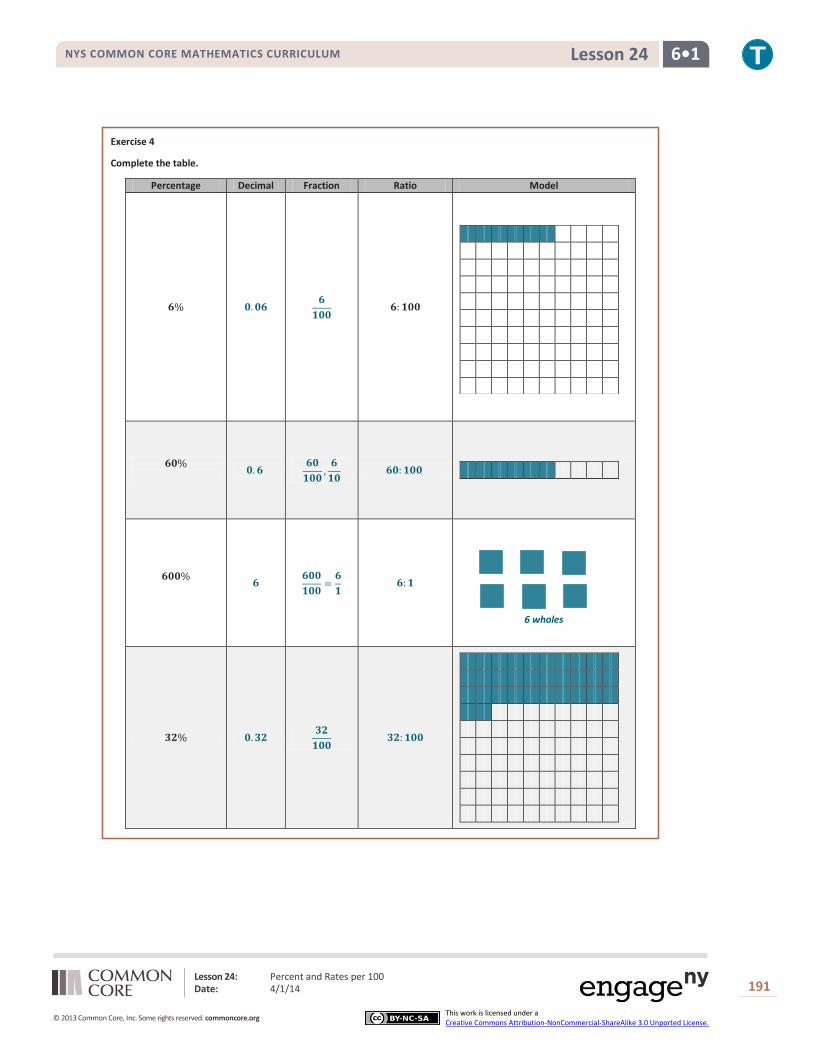
Exercise 4
Complete the table.
Percentage Decimal Fraction Ratio Model
6 wholes

Lesson 24: Percent and Rates per 100 Date: 4/1/14
192
© 2013 Common Core, Inc. Some rights reserved. commoncore.org This work is licensed under a Creative Commons Attribution-NonCommercial-ShareAlike 3.0 Unported License.
NYS COMMON CORE MATHEMATICS CURRICULUM 6•1 Lesson 24
Exercise 5
Mr. Brown shares with the class that of the students got an A on the English vocabulary quiz. If Mr. Brown has
students, create a model to show how many of the students passed.
What fraction of the students passed the class?
How could we represent this amount using a decimal?
or
How are the decimal, the fraction, and the percent all related?
The decimal, fraction and percent all show 70 out of 100.
Lesson 24: Percent and Rates per 100 Date: 4/1/14
193
© 2013 Common Core, Inc. Some rights reserved. commoncore.org This work is licensed under a Creative Commons Attribution-NonCommercial-ShareAlike 3.0 Unported License.
NYS COMMON CORE MATHEMATICS CURRICULUM 6•1 Lesson 24
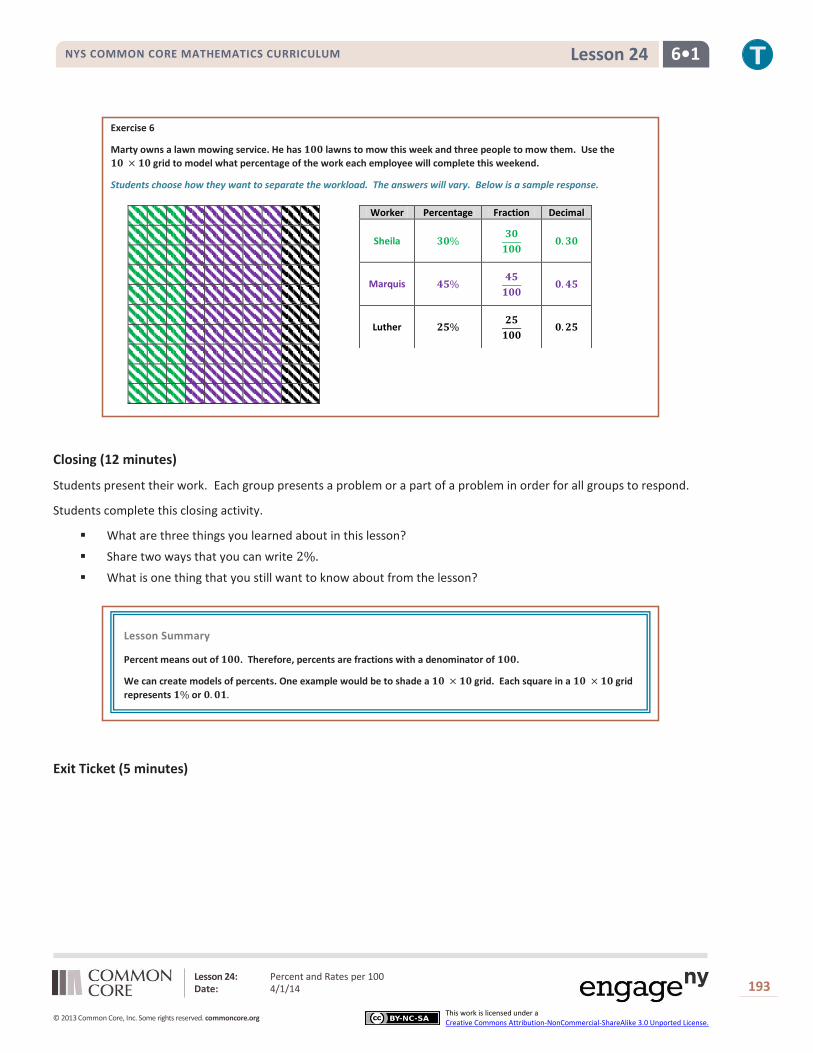
Exercise 6
Marty owns a lawn mowing service. He has lawns to mow this week and three people to mow them. Use the
grid to model what percentage of the work each employee will complete this weekend.
Students choose how they want to separate the workload. The answers will vary. Below is a sample response.
Closing (12 minutes)
Students present their work. Each group presents a problem or a part of a problem in order for all groups to respond.
Students complete this closing activity.
What are three things you learned about in this lesson?
Share two ways that you can write
What is one thing that you still want to know about from the lesson?
Exit Ticket (5 minutes)
Worker Percentage Fraction Decimal
Sheila
Marquis
Luther
Lesson Summary
Percent means out of . Therefore, percents are fractions with a denominator of .
We can create models of percents. One example would be to shade a grid. Each square in a grid
represents or
Lesson 24: Percent and Rates per 100 Date: 4/1/14
194
© 2013 Common Core, Inc. Some rights reserved. commoncore.org This work is licensed under a Creative Commons Attribution-NonCommercial-ShareAlike 3.0 Unported License.
NYS COMMON CORE MATHEMATICS CURRICULUM 6•1 Lesson 24
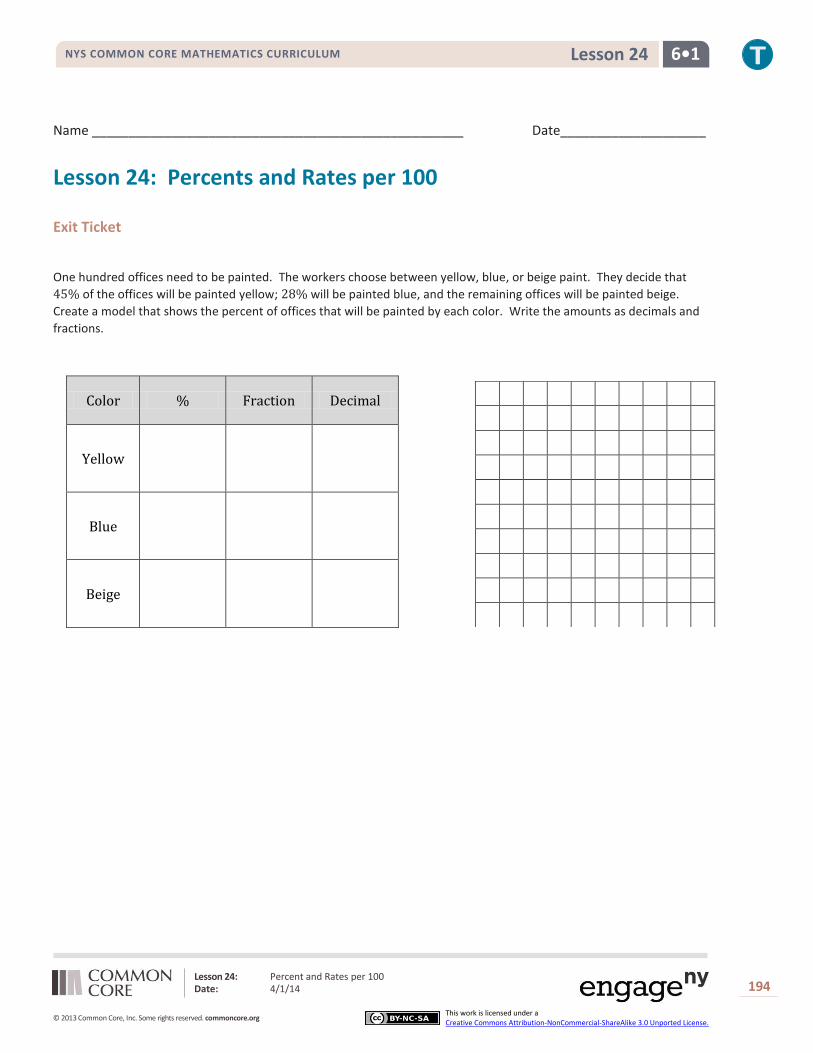
Name ___________________________________________________ Date____________________
Lesson 24: Percents and Rates per 100
Exit Ticket
One hundred offices need to be painted. The workers choose between yellow, blue, or beige paint. They decide that
of the offices will be painted yellow; will be painted blue, and the remaining offices will be painted beige.
Create a model that shows the percent of offices that will be painted by each color. Write the amounts as decimals and
fractions.
Color % Fraction Decimal
Yellow
Blue
Beige
Lesson 24: Percent and Rates per 100 Date: 4/1/14
195
© 2013 Common Core, Inc. Some rights reserved. commoncore.org This work is licensed under a Creative Commons Attribution-NonCommercial-ShareAlike 3.0 Unported License.
NYS COMMON CORE MATHEMATICS CURRICULUM 6•1 Lesson 24
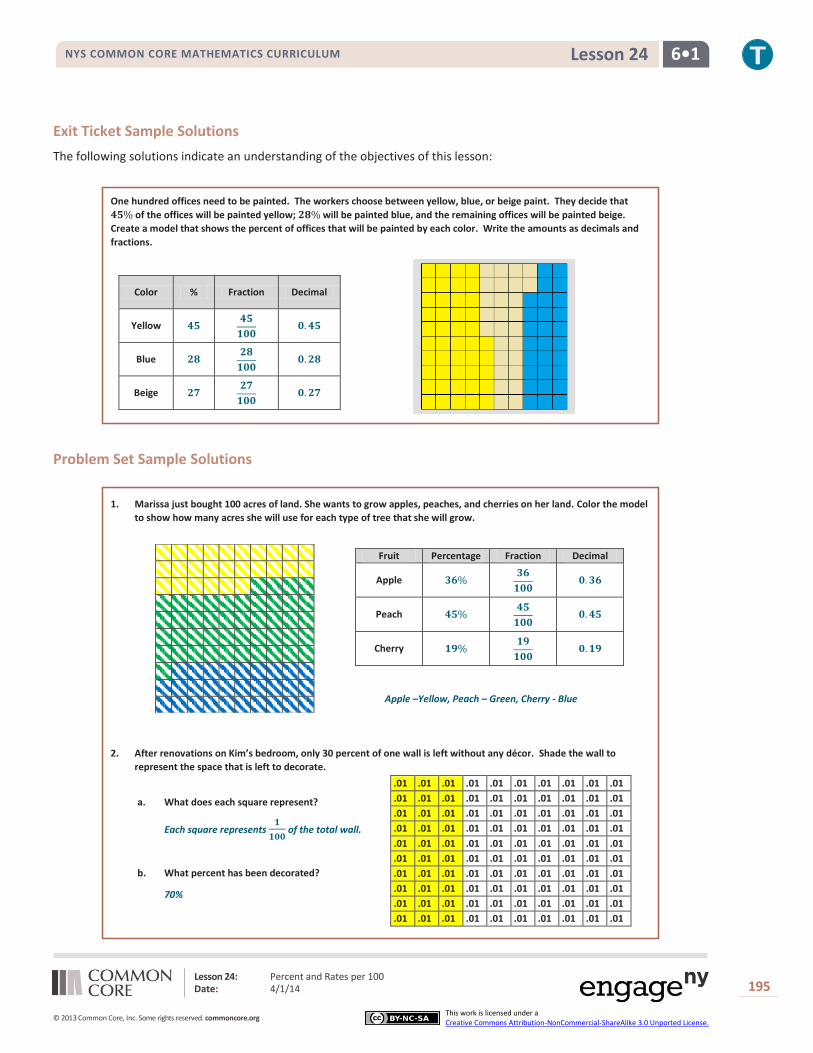
Exit Ticket Sample Solutions
The following solutions indicate an understanding of the objectives of this lesson:
One hundred offices need to be painted. The workers choose between yellow, blue, or beige paint. They decide that
of the offices will be painted yellow; will be painted blue, and the remaining offices will be painted beige.
Create a model that shows the percent of offices that will be painted by each color. Write the amounts as decimals and
fractions.
Problem Set Sample Solutions
1. Marissa just bought 100 acres of land. She wants to grow apples, peaches, and cherries on her land. Color the model
to show how many acres she will use for each type of tree that she will grow.
2. After renovations on Kim’s bedroom, only 30 percent of one wall is left without any décor. Shade the wall to
represent the space that is left to decorate.
a. What does each square represent?
Each square represents
of the total wall.
b. What percent has been decorated?
70%
Color % Fraction Decimal
Yellow
Blue
Beige
Fruit Percentage Fraction Decimal
Apple
Peach
Cherry
Apple –Yellow, Peach – Green, Cherry - Blue
.01 .01 .01 .01 .01 .01 .01 .01 .01 .01
.01 .01 .01 .01 .01 .01 .01 .01 .01 .01
.01 .01 .01 .01 .01 .01 .01 .01 .01 .01
.01 .01 .01 .01 .01 .01 .01 .01 .01 .01
.01 .01 .01 .01 .01 .01 .01 .01 .01 .01
.01 .01 .01 .01 .01 .01 .01 .01 .01 .01
.01 .01 .01 .01 .01 .01 .01 .01 .01 .01
.01 .01 .01 .01 .01 .01 .01 .01 .01 .01
.01 .01 .01 .01 .01 .01 .01 .01 .01 .01
.01 .01 .01 .01 .01 .01 .01 .01 .01 .01