Embed Size (px)
Citation preview
Lessons from HLT benchmarking
(For the new Farm)
Rainer Schwemmer, LHCb Computing Workshop 2014

The Setup• Goals
– Determine most cost efficient compute platform for next year’s farm upgrade
– Help to estimate what can be expected from the new farm• CPU time measurement:
– Run Moore similar to how it runs at P8 during data taking (actually deferred processing)
– Buffer Manager– File Reader (instead of MEPRx)– Variable instances of HLT1/HLT1+2– Measure how many triggers where processed over a certain amount
of time (typically 1 hour)• Memory measurement:
– Intel Performance Counter Monitor– Profiles entire system for
• Cache behaviour• IPC• Other interesting stats
2
Results
3
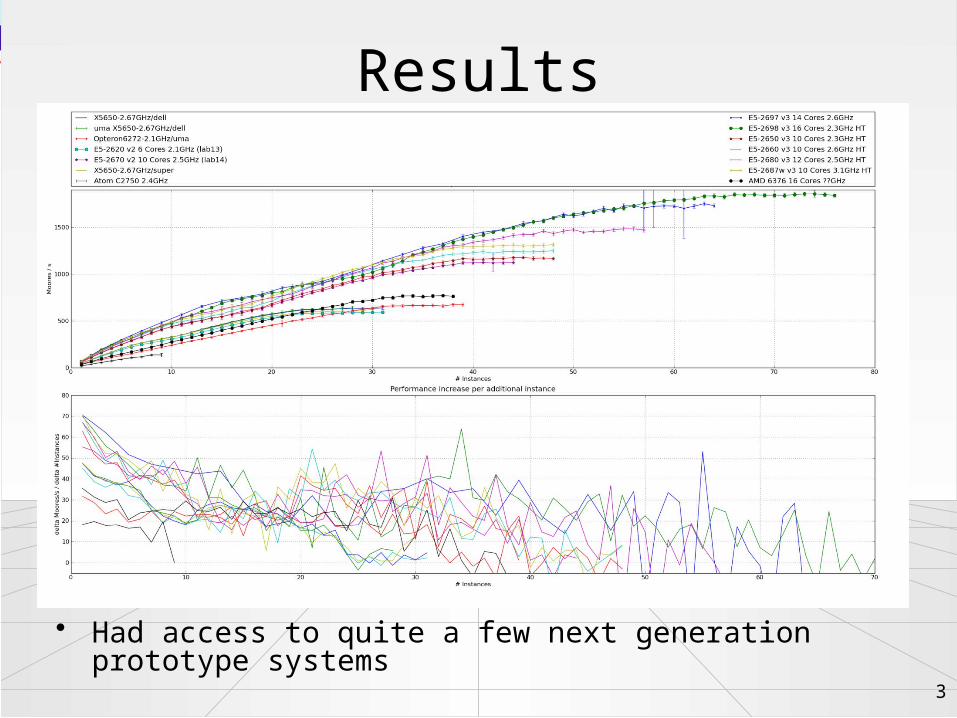
• Had access to quite a few next generation prototype systems
Results
4
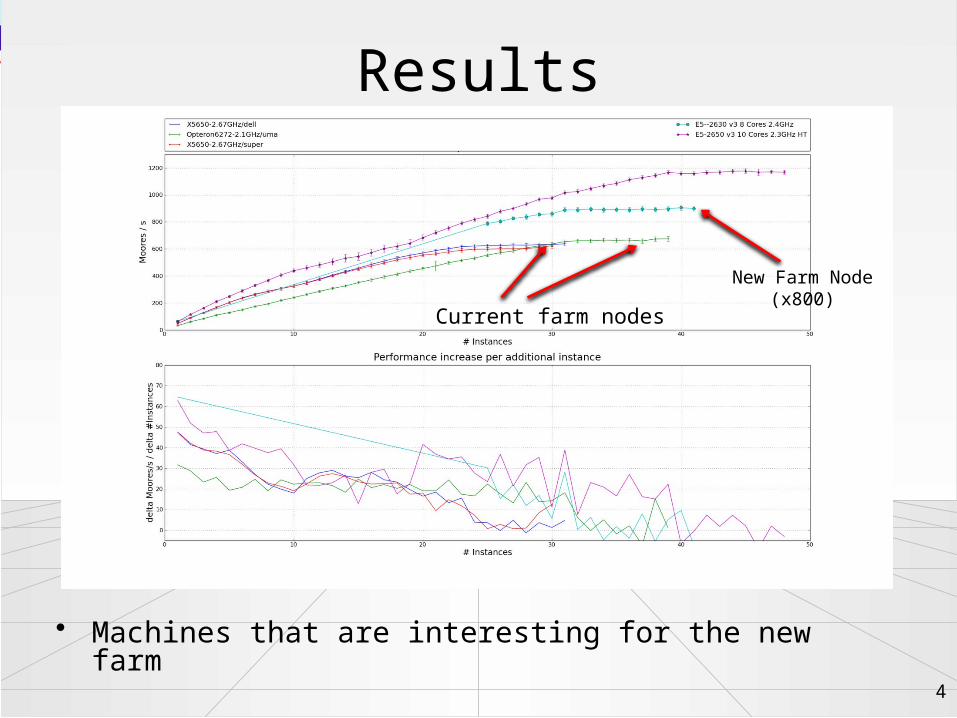
• Machines that are interesting for the new farm
Current farm nodes
New Farm Node(x800)
Interesting little detail
5
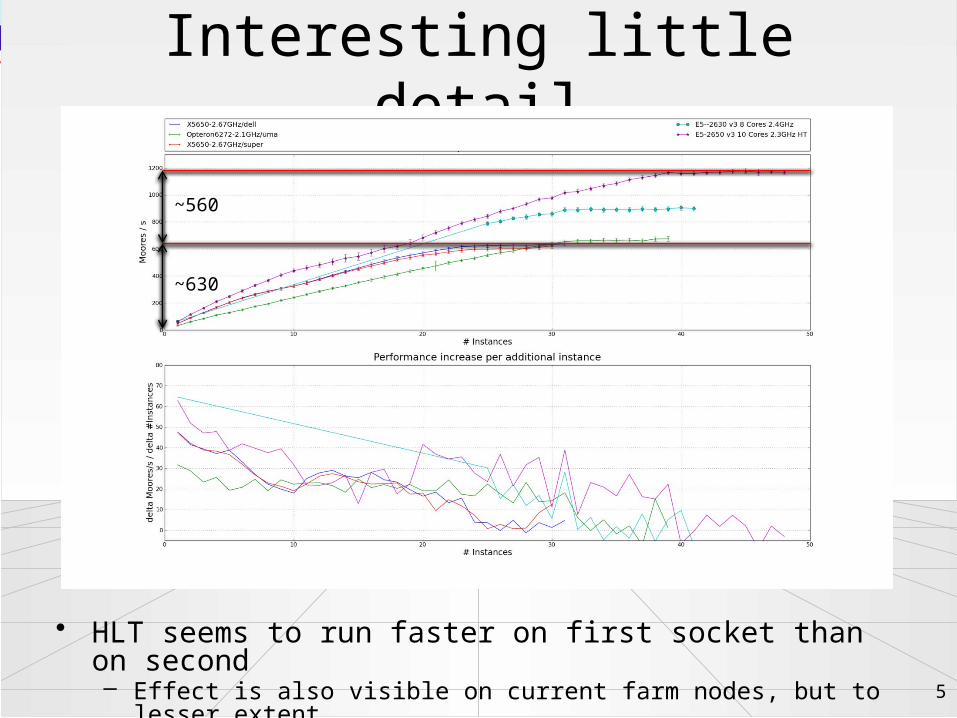
• HLT seems to run faster on first socket than on second– Effect is also visible on current farm nodes, but to lesser extent
~630
~560
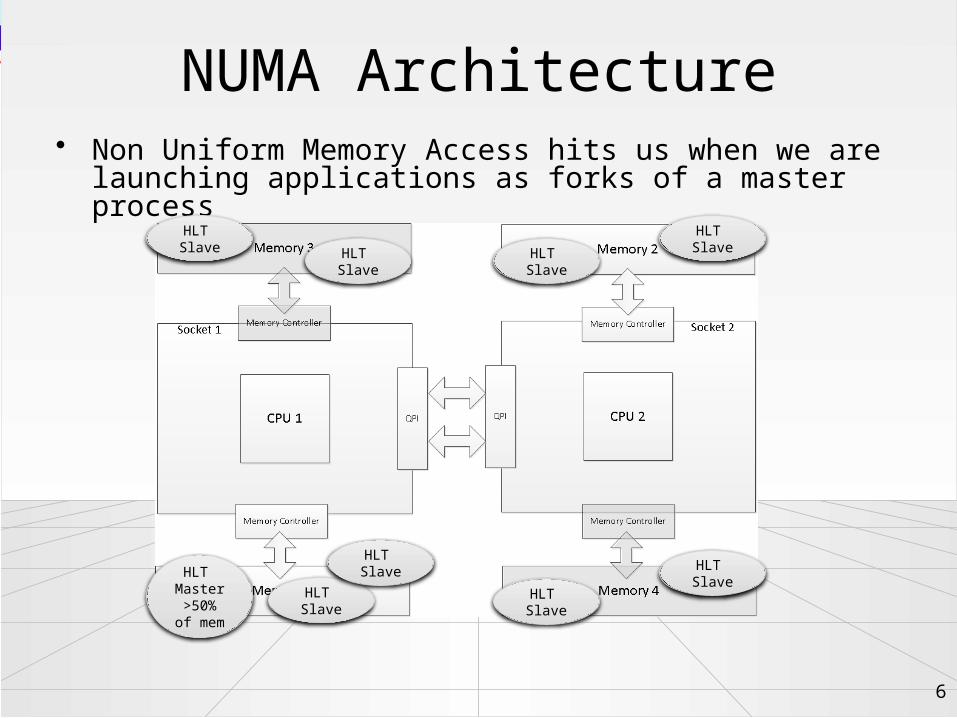
NUMA Architecture
6
• Non Uniform Memory Access hits us when we are launching applications as forks of a master process
HLT Master>50% of
mem
HLT Slave
HLT Slave
HLT Slave HLT
Slave
HLT Slave
HLT Slave
HLT Slave
HLT Slave
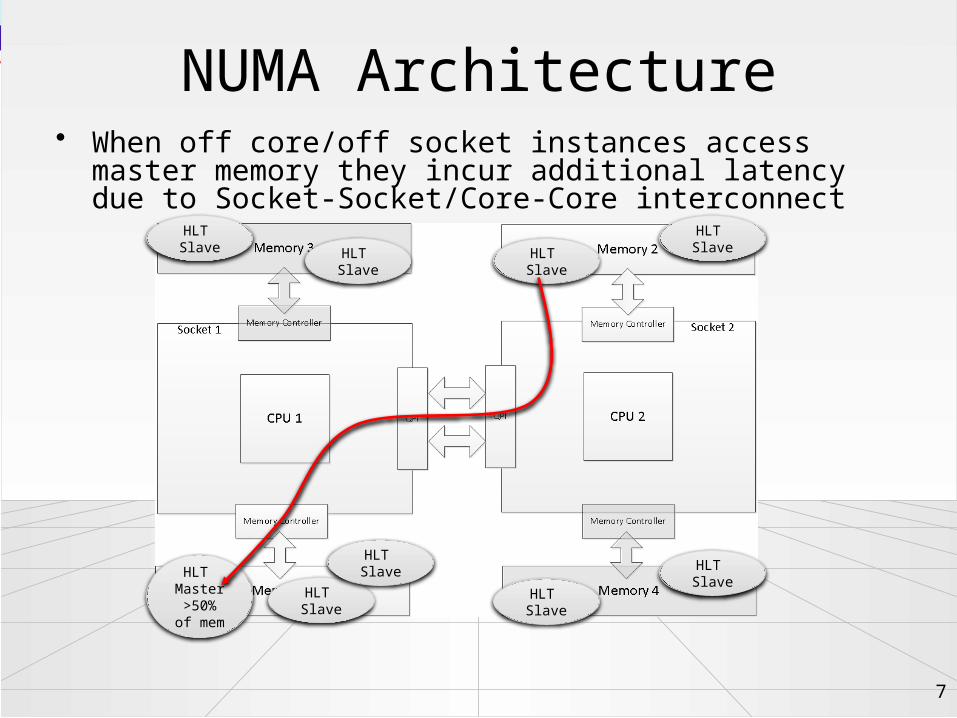
NUMA Architecture
7
• When off core/off socket instances access master memory they incur additional latency due to Socket-Socket/Core-Core interconnect
HLT Master>50% of
mem
HLT Slave
HLT Slave
HLT Slave HLT
Slave
HLT Slave
HLT Slave
HLT Slave
HLT Slave
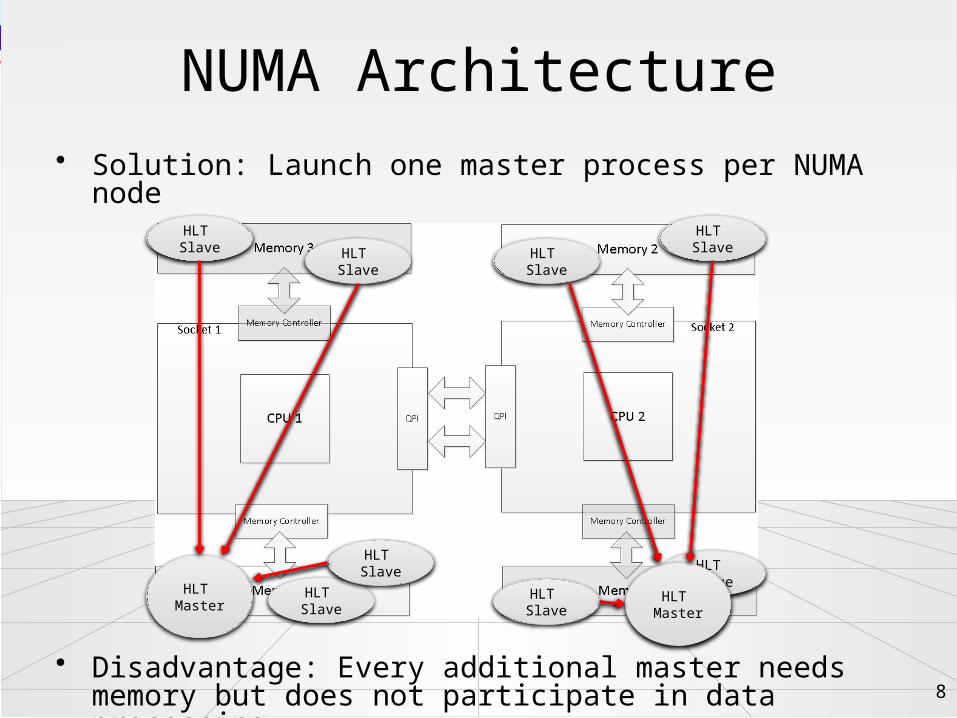
NUMA Architecture
8
• Solution: Launch one master process per NUMA node
• Disadvantage: Every additional master needs memory but does not participate in data processing
HLT Master
HLT Slave
HLT Slave
HLT Slave HLT
Slave
HLT Slave
HLT Slave
HLT Slave
HLT Slave
HLT Master
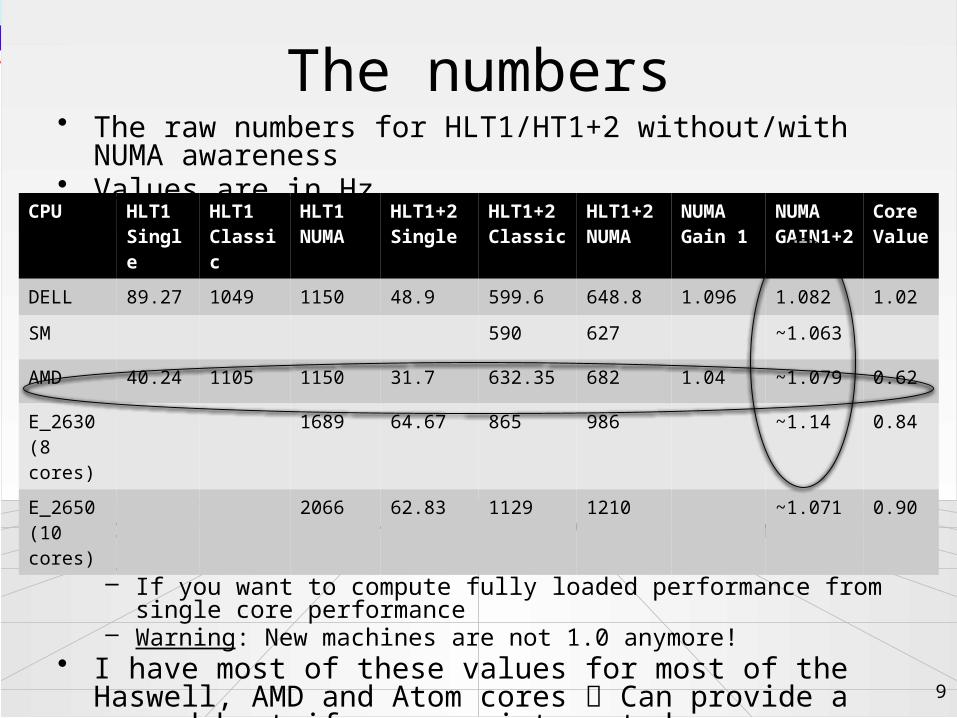
The numbers• The raw numbers for HLT1/HT1+2 without/with NUMA awareness• Values are in Hz
• Core Value: Hlt1+2_Classic / HLT1+2_Single / N_Cores– If you want to compute fully loaded performance from single core
performance– Warning: New machines are not 1.0 anymore!
• I have most of these values for most of the Haswell, AMD and Atom cores Can provide a spreadsheet if you are interested
9
CPU HLT1 Single
HLT1Classic
HLT1NUMA
HLT1+2 Single
HLT1+2Classic
HLT1+2NUMA
NUMA Gain 1
NUMA GAIN1+2
Core Value
DELL 89.27 1049 1150 48.9 599.6 648.8 1.096 1.082 1.02
SM 590 627 ~1.063
AMD 40.24 1105 1150 31.7 632.35 682 1.04 ~1.079 0.62
E_2630(8 cores)
1689 64.67 865 986 ~1.14 0.84
E_2650(10 cores)
2066 62.83 1129 1210 ~1.071 0.90
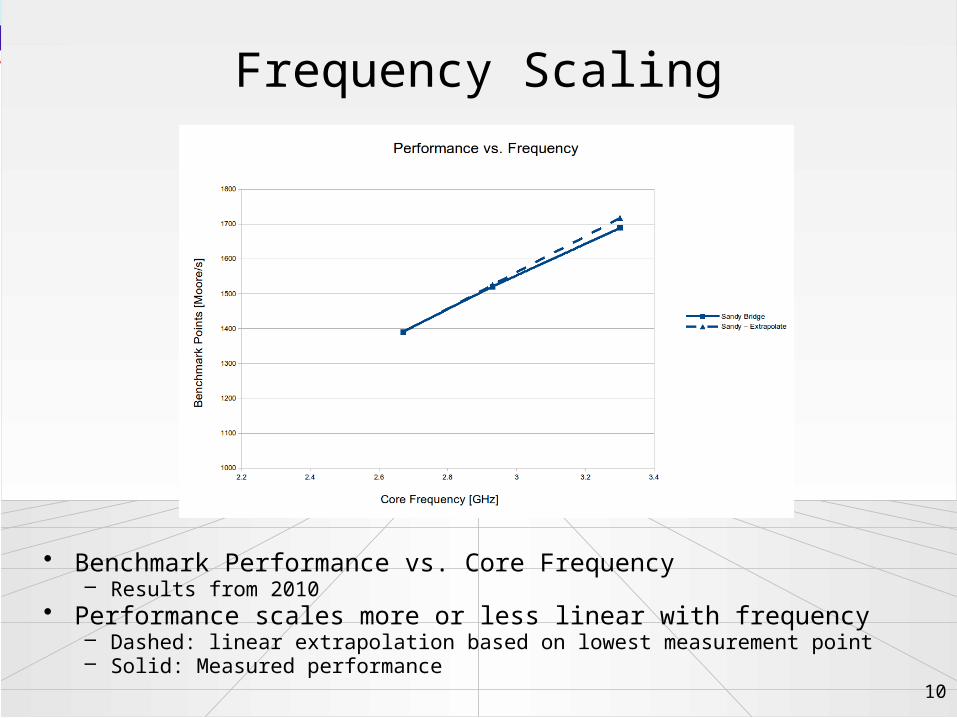
Frequency Scaling
• Benchmark Performance vs. Core Frequency– Results from 2010
• Performance scales more or less linear with frequency– Dashed: linear extrapolation based on lowest measurement point– Solid: Measured performance
10
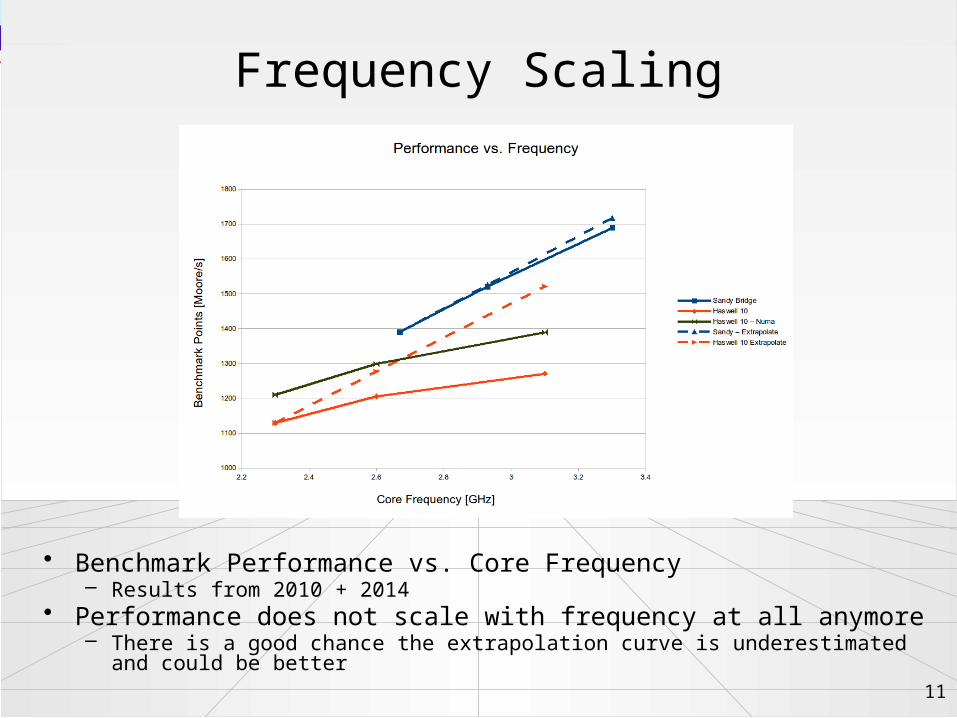
Frequency Scaling
• Benchmark Performance vs. Core Frequency– Results from 2010 + 2014
• Performance does not scale with frequency at all anymore– There is a good chance the extrapolation curve is underestimated and could be better
11
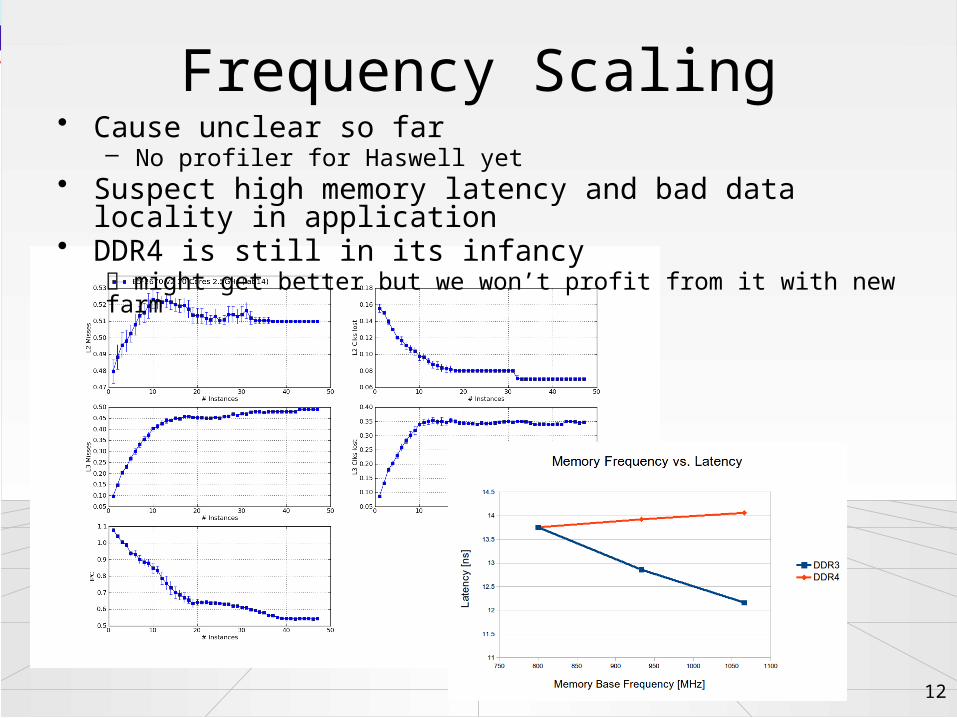
Frequency Scaling• Cause unclear so far
– No profiler for Haswell yet• Suspect high memory latency and bad data locality in application• DDR4 is still in its infancy
might get better but we won’t profit from it with new farm
12
Conclusion• Forking is good for start up, but we lost quite a bit of performance
– This did not go unnoticed Johannes ca. 2011– We did not keep track of performance values so it was blamed on changes in the
application• Running the HLT NUMA aware can give us 14% more performance on
new machines– 6%-8% on old farm nodes– Memory consumption will go up
• Performance does not scale with CPU anymore– Probably issue with memory latency and bad data access pattern– No plan to upgrade farm again until next shutdown– Will not profit from better memory until after LS2– Some more % can probably be gained by optimizing data structures and access
patterns
13

Questions?