Embed Size (px)
Citation preview
PC62CH30-Gratton ARI 25 February 2011 16:41
Lessons in FluctuationCorrelation SpectroscopyMichelle A. Digman and Enrico GrattonLaboratory for Fluorescence Dynamics, Department of Biomedical Engineering,University of California, Irvine, California 92697; email: [email protected]
Annu. Rev. Phys. Chem. 2011. 62:645–68
First published online as a Review in Advance onJanuary 10, 2011
The Annual Review of Physical Chemistry is online atphyschem.annualreviews.org
This article’s doi:10.1146/annurev-physchem-032210-103424
Copyright c© 2011 by Annual Reviews.All rights reserved
0066-426X/11/0505-0645$20.00
Keywords
pair correlation, molecular flow, anisotropic diffusion
Abstract
Molecular diffusion and transport processes are fundamental in physical,chemical, and biological systems. Current approaches to measuring molecu-lar transport in cells and tissues based on perturbation methods, e.g., fluores-cence recovery after photobleaching, are invasive; single-point fluctuationcorrelation methods are local; and single-particle tracking requires the ob-servation of isolated particles for relatively long periods of time. We discusshere the detection of molecular transport by exploiting spatiotemporal cor-relations measured among points at large distances (>1 μm). We illustratethe evolution of the conceptual framework that started with single-point flu-orescence fluctuation analysis based on the transit of fluorescent moleculesthrough a small volume of illumination. This idea has evolved to includethe measurement of fluctuations at many locations in the sample using mi-croscopy imaging methods. Image fluctuation analysis has become a rich andpowerful technique that can be used to extract information about the spatialdistribution of molecular concentration and transport in cells and tissues.
645
Ann
u. R
ev. P
hys.
Che
m. 2
011.
62:6
45-6
68. D
ownl
oade
d fr
om w
ww
.ann
ualr
evie
ws.
org
by C
alif
orni
a In
stitu
te o
f T
echn
olog
y on
03/
04/1
2. F
or p
erso
nal u
se o
nly.
PC62CH30-Gratton ARI 25 February 2011 16:41
FCS: fluorescencecorrelationspectroscopy
SPT: single-particletracking
pCF: pair correlationfunction
DLS: dynamic lightscattering
INTRODUCTION
This review illustrates chronologically and conceptually the evolution of the field of fluorescencecorrelation spectroscopy (FCS) from the initial experiments to the current stage. For the purposeof this review it is useful to discuss ideas from a mathematical framework using figures and tablescontaining information on specific aspects of the technology and to show a few application ex-amples. This review is a lesson from the fluctuation spectroscopy field about the conception andapplication of ideas and its influence as a technology in the biological and biophysical fields. Alarge number of researchers have contributed to this evolution, and it is impossible to cover alltheir important work.
FCS has emerged as a powerful method to study the motions of fluorescent molecules insolution, in cells and tissues. It provides information at the single-molecule level by averaging thebehavior of many molecules, thus achieving very good statistics. Single-particle tracking (SPT) isalso a highly sensitive technique to measure particle movement. The single-point FCS methodonly provides information about the measured point in the sample, making it difficult to map theflow of molecules in a complex volume such as that of a cell, whereas the SPT technique onlyallows tracking in cells of isolated large particles. We describe here a conceptual history of theFCS approach by explaining not only its powerful principle, but also its limitations. At the endof this review we describe a proposed paradigm change in which one overcomes some of theselimitations by using spatial pair cross-correlation functions (pCFs). The pCF approach measuresthe time a particle takes to go from one location to another by correlating the intensity fluctuationsat specific points on a grid, independent of the number of particles in the imaging field. Therefore,one can trace the average path of particles. For example, this method could be used to detect thetime at which a protein passes the nuclear barrier and the location of the passage. This informationcannot be obtained with the fluorescence recovery after photobleaching technique or any otherimage correlation spectroscopy method. Instead, this method builds on some recent work usingdual-foci FCS (1) and bridges the two technologies (FCS and SPT), providing single-moleculesensitivity and information about the path of molecules, but in the presence of many molecules.This method has much broader applicability than solely for the study of membrane organizationand dynamics described in Reference 2 as it works in three dimensions and could be applied tothe interior of a cell.
SINGLE-POINT FLUORESCENCE CORRELATION SPECTROSCOPY:THE ORIGINAL APPROACH
The FCS field was developed after the dynamic light scattering (DLS) technology, also knownas photon correlation spectroscopy (3–7). Although the technology for the measurement andanalysis of fluctuations in FCS was originally derived from the DLS field, the physical principleproducing fluctuations in FCS is quite different. DLS depends on the scattered light interfer-ence from an ensemble of particles (5). The fluctuations in scattering intensity from moleculesin a volume defined by the wavelength of light are caused by reflection and interference amongparticles (5). An advantage of DLS is that it does not require a fluorescent molecule. Instead,the FCS signal originates from fluorescent molecules passing through a very small illuminationvolume generally defined by a confocal volume or due to a change in their fluorescent properties.Single molecules in the volume of excitation are sufficient to produce a signal. More importantly,the selectivity of fluorescence allows only the molecule of interest to be detected. The FCS fieldwas originally started by Magde et al. (8) in 1972 for the determination of binding of ethidiumbromide to double-stranded DNA. In this original work the fluorescence fluctuations resulted
646 Digman · Gratton
Ann
u. R
ev. P
hys.
Che
m. 2
011.
62:6
45-6
68. D
ownl
oade
d fr
om w
ww
.ann
ualr
evie
ws.
org
by C
alif
orni
a In
stitu
te o
f T
echn
olog
y on
03/
04/1
2. F
or p
erso
nal u
se o
nly.
PC62CH30-Gratton ARI 25 February 2011 16:41
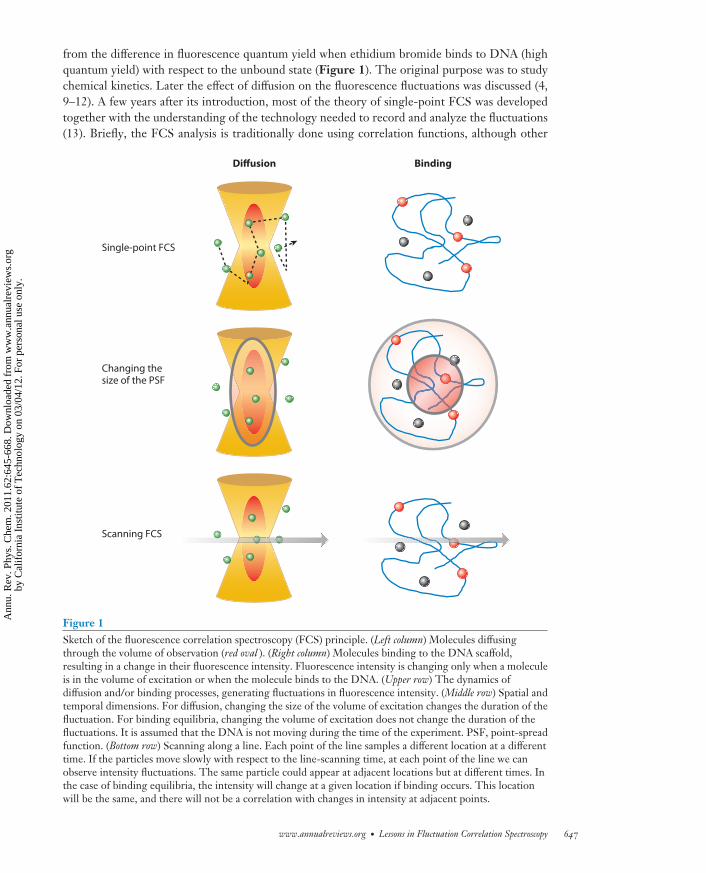
from the difference in fluorescence quantum yield when ethidium bromide binds to DNA (highquantum yield) with respect to the unbound state (Figure 1). The original purpose was to studychemical kinetics. Later the effect of diffusion on the fluorescence fluctuations was discussed (4,9–12). A few years after its introduction, most of the theory of single-point FCS was developedtogether with the understanding of the technology needed to record and analyze the fluctuations(13). Briefly, the FCS analysis is traditionally done using correlation functions, although other
Single-point FCS
Changing thesize of the PSF
Scanning FCS
Diffusion Binding
Figure 1Sketch of the fluorescence correlation spectroscopy (FCS) principle. (Left column) Molecules diffusingthrough the volume of observation (red oval ). (Right column) Molecules binding to the DNA scaffold,resulting in a change in their fluorescence intensity. Fluorescence intensity is changing only when a moleculeis in the volume of excitation or when the molecule binds to the DNA. (Upper row) The dynamics ofdiffusion and/or binding processes, generating fluctuations in fluorescence intensity. (Middle row) Spatial andtemporal dimensions. For diffusion, changing the size of the volume of excitation changes the duration of thefluctuation. For binding equilibria, changing the volume of excitation does not change the duration of thefluctuations. It is assumed that the DNA is not moving during the time of the experiment. PSF, point-spreadfunction. (Bottom row) Scanning along a line. Each point of the line samples a different location at a differenttime. If the particles move slowly with respect to the line-scanning time, at each point of the line we canobserve intensity fluctuations. The same particle could appear at adjacent locations but at different times. Inthe case of binding equilibria, the intensity will change at a given location if binding occurs. This locationwill be the same, and there will not be a correlation with changes in intensity at adjacent points.
www.annualreviews.org • Lessons in Fluctuation Correlation Spectroscopy 647
Ann
u. R
ev. P
hys.
Che
m. 2
011.
62:6
45-6
68. D
ownl
oade
d fr
om w
ww
.ann
ualr
evie
ws.
org
by C
alif
orni
a In
stitu
te o
f T
echn
olog
y on
03/
04/1
2. F
or p
erso
nal u
se o
nly.
PC62CH30-Gratton ARI 25 February 2011 16:41
Time (μs)4,000,0003,500,000
Co
un
ts (
kH
z)
300
200
100
0
Time (μs)3,850,0003,800,000
Co
un
ts (
kH
z)
300
200
100
0
Duration
a b
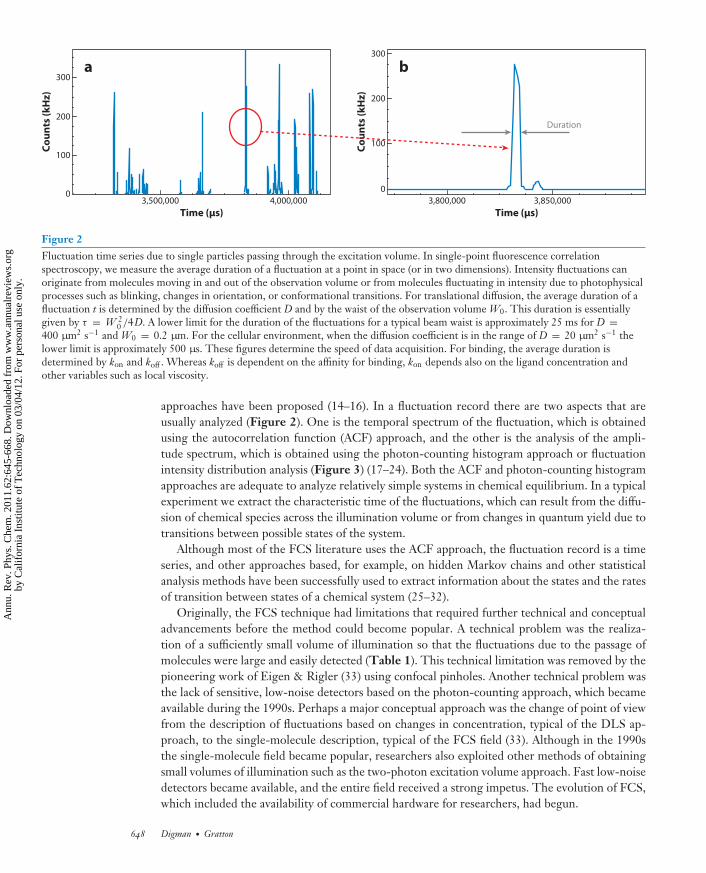
Figure 2Fluctuation time series due to single particles passing through the excitation volume. In single-point fluorescence correlationspectroscopy, we measure the average duration of a fluctuation at a point in space (or in two dimensions). Intensity fluctuations canoriginate from molecules moving in and out of the observation volume or from molecules fluctuating in intensity due to photophysicalprocesses such as blinking, changes in orientation, or conformational transitions. For translational diffusion, the average duration of afluctuation t is determined by the diffusion coefficient D and by the waist of the observation volume W0. This duration is essentiallygiven by τ = W 2
0 /4D. A lower limit for the duration of the fluctuations for a typical beam waist is approximately 25 ms for D =400 μm2 s−1 and W0 = 0.2 μm. For the cellular environment, when the diffusion coefficient is in the range of D = 20 μm2 s−1 thelower limit is approximately 500 μs. These figures determine the speed of data acquisition. For binding, the average duration isdetermined by kon and koff . Whereas koff is dependent on the affinity for binding, kon depends also on the ligand concentration andother variables such as local viscosity.
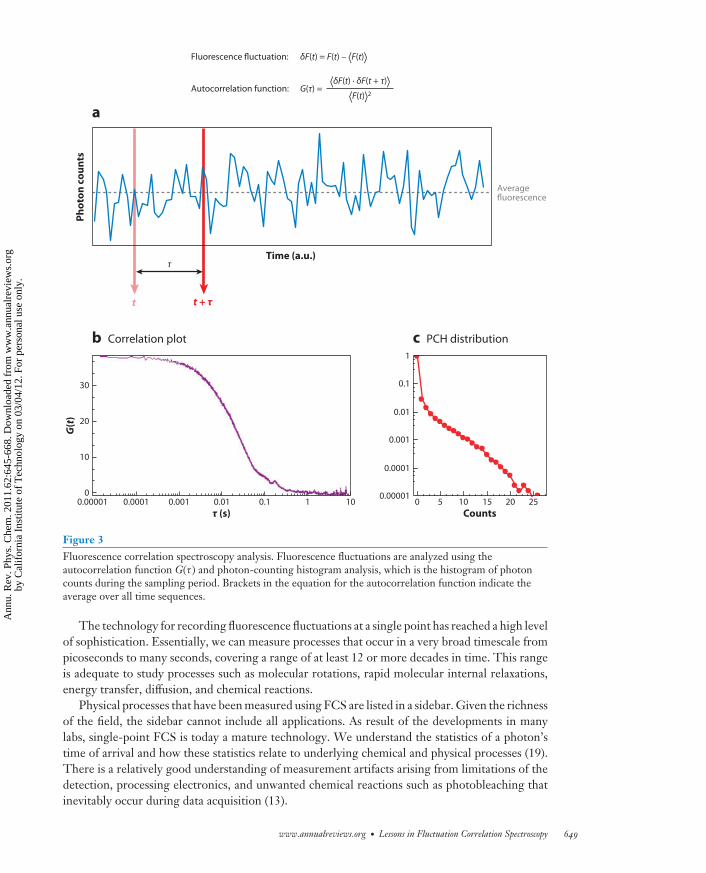
approaches have been proposed (14–16). In a fluctuation record there are two aspects that areusually analyzed (Figure 2). One is the temporal spectrum of the fluctuation, which is obtainedusing the autocorrelation function (ACF) approach, and the other is the analysis of the ampli-tude spectrum, which is obtained using the photon-counting histogram approach or fluctuationintensity distribution analysis (Figure 3) (17–24). Both the ACF and photon-counting histogramapproaches are adequate to analyze relatively simple systems in chemical equilibrium. In a typicalexperiment we extract the characteristic time of the fluctuations, which can result from the diffu-sion of chemical species across the illumination volume or from changes in quantum yield due totransitions between possible states of the system.
Although most of the FCS literature uses the ACF approach, the fluctuation record is a timeseries, and other approaches based, for example, on hidden Markov chains and other statisticalanalysis methods have been successfully used to extract information about the states and the ratesof transition between states of a chemical system (25–32).
Originally, the FCS technique had limitations that required further technical and conceptualadvancements before the method could become popular. A technical problem was the realiza-tion of a sufficiently small volume of illumination so that the fluctuations due to the passage ofmolecules were large and easily detected (Table 1). This technical limitation was removed by thepioneering work of Eigen & Rigler (33) using confocal pinholes. Another technical problem wasthe lack of sensitive, low-noise detectors based on the photon-counting approach, which becameavailable during the 1990s. Perhaps a major conceptual approach was the change of point of viewfrom the description of fluctuations based on changes in concentration, typical of the DLS ap-proach, to the single-molecule description, typical of the FCS field (33). Although in the 1990sthe single-molecule field became popular, researchers also exploited other methods of obtainingsmall volumes of illumination such as the two-photon excitation volume approach. Fast low-noisedetectors became available, and the entire field received a strong impetus. The evolution of FCS,which included the availability of commercial hardware for researchers, had begun.
648 Digman · Gratton
Ann
u. R
ev. P
hys.
Che
m. 2
011.
62:6
45-6
68. D
ownl
oade
d fr
om w
ww
.ann
ualr
evie
ws.
org
by C
alif
orni
a In
stitu
te o
f T
echn
olog
y on
03/
04/1
2. F
or p
erso
nal u
se o
nly.
PC62CH30-Gratton ARI 25 February 2011 16:41
Counts2520151050
0.00001
0.0001
0.001
0.01
0.1
1
Fluorescence fluctuation: δF(t) = F(t) – ⟨F(t)⟩
⟨δF(t) · δF(t + τ)⟩⟨F(t)⟩2
Autocorrelation function: G(τ) =P
ho
ton
co
un
ts
Time (a.u.)
a
b Correlation plot c PCH distribution
t t + τ
Averagefluorescence
τ
0.000010
10
20
30
0.0001 0.001 0.01τ (s)
G(t
)
0.1 1 10
Figure 3Fluorescence correlation spectroscopy analysis. Fluorescence fluctuations are analyzed using theautocorrelation function G(τ ) and photon-counting histogram analysis, which is the histogram of photoncounts during the sampling period. Brackets in the equation for the autocorrelation function indicate theaverage over all time sequences.
The technology for recording fluorescence fluctuations at a single point has reached a high levelof sophistication. Essentially, we can measure processes that occur in a very broad timescale frompicoseconds to many seconds, covering a range of at least 12 or more decades in time. This rangeis adequate to study processes such as molecular rotations, rapid molecular internal relaxations,energy transfer, diffusion, and chemical reactions.
Physical processes that have been measured using FCS are listed in a sidebar. Given the richnessof the field, the sidebar cannot include all applications. As result of the developments in manylabs, single-point FCS is today a mature technology. We understand the statistics of a photon’stime of arrival and how these statistics relate to underlying chemical and physical processes (19).There is a relatively good understanding of measurement artifacts arising from limitations of thedetection, processing electronics, and unwanted chemical reactions such as photobleaching thatinevitably occur during data acquisition (13).
www.annualreviews.org • Lessons in Fluctuation Correlation Spectroscopy 649
Ann
u. R
ev. P
hys.
Che
m. 2
011.
62:6
45-6
68. D
ownl
oade
d fr
om w
ww
.ann
ualr
evie
ws.
org
by C
alif
orni
a In
stitu
te o
f T
echn
olog
y on
03/
04/1
2. F
or p
erso
nal u
se o
nly.
PC62CH30-Gratton ARI 25 February 2011 16:41
PHYSICAL PROCESSES STUDIED BY FLUORESCENCECORRELATION SPECTROSCOPY
Physical processes studied by FCS include diffusion (multidimensional, anomalous, restricted), chemical reactions,conformational changes, molecular rotations, fluorescence lifetime, FRET, and blinking. Fluctuations such aschanges in molecular orientation (in the picosecond range), blinking-triplet state (in microseconds), and binding-unbinding (in the millisecond or longer range) occur on a wide time range. The development of hardware andsoftware to analyze different types of fluctuations must consider these timescales. Single-point detectors can acquiredata up to subnanosecond sampling (or dwell time) in the direct mode, and modern fast high-sensitivity camerasare limited to approximately 1 ms.
Table 1 Orders of magnitude (for 1-μM solution, small molecule, water)
Volume Device Size (μm) Molecules Time (s) FluctuationMilliliter Cuvette 10,000 6 × 10¹⁴ 104 10−15
Microliter Plate well 1,000 6 × 10¹¹ 102 10−12
Nanoliter Microfabrication 100 6 × 10⁸ 1 10−8
Picoliter Typical cell 10 6 × 10⁵ 10−2 10−6
Femtoliter Confocal volume 1 6 × 10² 10−4 10−3
Attoliter Nanofabrication 0.1 6 × 10⁻¹ 10−6 1
Typical volumes obtained by common devices. For the calculation of the time, the diffusion coefficient was assumed to beapproximately 300 μm2 s−1. The fluctuation is the normalized value of the autocorrelation function at τ = 0. Formolecular concentration typical of proteins in cells, volumes on the order of femtoliters and fast sampling are needed toobserve molecular fluctuations due to cytoplasmic diffusion.
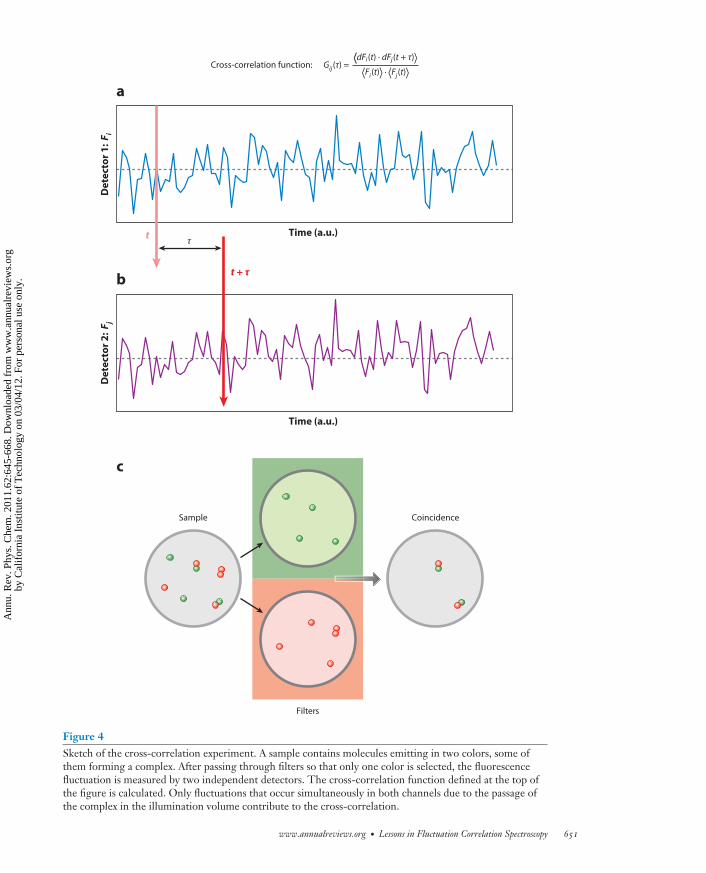
An important modality associated with single-point FCS is dual- (or multiple-) channel dataacquisition. This is normally referred to as cross-correlation FCS. This concept is similar tothat of coincidence detection commonly used in many physics experiments. In the context ofFCS it is used to measure the simultaneous occurrence of fluctuations in two (or more) channels(Figure 4). The cross-correlation method is also common in DLS, but the use of coincidenceanalysis to detect the formation of molecular complexes is unique to FCS (34–43).
SCANNING TECHNIQUES: THE EVOLUTION OF THESPATIO-TEMPORAL CONCEPT IN FLUCTUATION SPECTROSCOPY
The Spatial Correlation Traditional Approach: The Carpet Idea
A substantial limitation of the single-point FCS technique is the lack of information about fluc-tuations occurring in the proximity of the measured point. Many processes in chemistry, physics,and biology have a spatial scale. Since the earlier days of FCS it has been well-known that diffusionprocesses have spatial structures that depend on the size of the volume of illumination. The largerthe volume is, the longer it will take for a molecule to cross the illumination volume. The timescaleof other processes such as binding to immobile locations or blinking and rotational motions isindependent of the size of the illumination volume (Figure 1). This difference in the spatial extentof the fluctuation was used to distinguish among processes. However, this approach, i.e., the de-pendency of the timescale on the size of the illumination volume, still uses an illumination volume
650 Digman · Gratton
Ann
u. R
ev. P
hys.
Che
m. 2
011.
62:6
45-6
68. D
ownl
oade
d fr
om w
ww
.ann
ualr
evie
ws.
org
by C
alif
orni
a In
stitu
te o
f T
echn
olog
y on
03/
04/1
2. F
or p
erso
nal u
se o
nly.
PC62CH30-Gratton ARI 25 February 2011 16:41
Cross-correlation function:⟨⟨dFi(t) · dFj(t + τ)⟩
⟨Fi(t)⟩ · ⟨Fj(t)⟩Gij(τ) =
a
b
c
De
tect
or
1: F i
Time (a.u.)
De
tect
or
2: F j
Time (a.u.)
t
t + τ
τ
Sample
Filters
Coincidence
Figure 4Sketch of the cross-correlation experiment. A sample contains molecules emitting in two colors, some ofthem forming a complex. After passing through filters so that only one color is selected, the fluorescencefluctuation is measured by two independent detectors. The cross-correlation function defined at the top ofthe figure is calculated. Only fluctuations that occur simultaneously in both channels due to the passage ofthe complex in the illumination volume contribute to the cross-correlation.
www.annualreviews.org • Lessons in Fluctuation Correlation Spectroscopy 651
Ann
u. R
ev. P
hys.
Che
m. 2
011.
62:6
45-6
68. D
ownl
oade
d fr
om w
ww
.ann
ualr
evie
ws.
org
by C
alif
orni
a In
stitu
te o
f T
echn
olog
y on
03/
04/1
2. F
or p
erso
nal u
se o
nly.
PC62CH30-Gratton ARI 25 February 2011 16:41
PSF: point-spreadfunction
that has cylindrical symmetry. With this approach it is difficult to produce illumination volumesthat are large and of an arbitrary shape.
Early in the field’s development, it was understood that by moving the illumination volume ina periodic pattern in the sample at a rate such that the molecules will not move much during aperiod, the record of the intensity fluctuations along the path will contain spatial information aboutthe location where the fluctuation occurred (44, 45). The analysis of the fluctuations at successiveperiods will contain information about the time course of the fluctuations of the points along thepath (46). This approach is called scanning FCS, and it is practiced today in several labs (47–51).Conceptually, scanning FCS is different from the use of an arbitrary shape or size for the volumeof illumination such as the dual-foci method (1, 52), as different volumes are excited at differenttimes in scanning FCS. Scanning introduces a time and spatial structure to the observation thatwe could exploit to best match the spatial and temporal structure of the physical process we areinvestigating (Figure 1).
One advantage of scanning FCS is that current confocal microscopes have the capability tosend the laser beam along a path (either line or circular orbit) at a very high rate. As this methodis the basic element for the introduction of spatiotemporal correlations, let us examine from aconceptual point of view the various ways that the information is encoded when a laser beamperforms a periodic path in the sample. Every point along the path is visited once per period. Thesize of the point is defined by the point-spread function (PSF). If molecules remain in a given pointfor a time comparable with the period, then the intensity fluctuation at that point decays betweensuccessive periods. Because data are available at many points along the path, this experiment isequivalent to performing many single-point FCS measurements simultaneously. In this case, thetime resolution of the experiment is the period, which can be a fraction of a millisecond, shortenough to correlate the motion of small proteins in the cellular environment. However, if weconsider two adjacent points in the path, the time difference of sampling these two points is equalto the period divided by the number of sampling points along the path. The time from pointto point is then in the microsecond range, which is typical of the single-point FCS method. Forreasons that are explained below, the correlation in time of one point of the path is called the carpetapproach, whereas the correlation in time among neighboring points along the path is called theraster image correlation spectroscopy approach.
Taken together, the spatial and temporal correlation approaches strongly increase the infor-mation content of the fluctuation measurement. Although this principle was known since the earlydays, the technical realization of a practical system based on rapidly scanning a path in the samplemade the technology easy to implement (46).
Technically, the path can have a complicated spatial and temporal sequence, such as the raster-scan path obtained in confocal microscopy. One crucial consideration is the rate of sampling alongthe path and the location of points along the path. This concept is different than the original ideaof using images to obtain spatial correlations, which is the basis of image correlation spectroscopy.
Image Correlation Spectroscopy
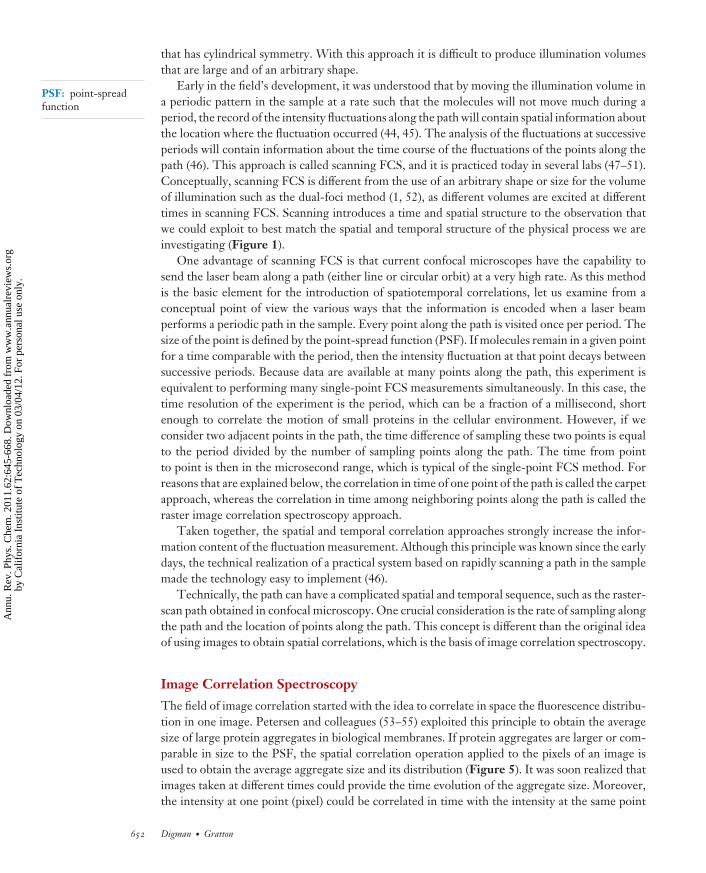
The field of image correlation started with the idea to correlate in space the fluorescence distribu-tion in one image. Petersen and colleagues (53–55) exploited this principle to obtain the averagesize of large protein aggregates in biological membranes. If protein aggregates are larger or com-parable in size to the PSF, the spatial correlation operation applied to the pixels of an image isused to obtain the average aggregate size and its distribution (Figure 5). It was soon realized thatimages taken at different times could provide the time evolution of the aggregate size. Moreover,the intensity at one point (pixel) could be correlated in time with the intensity at the same point
652 Digman · Gratton
Ann
u. R
ev. P
hys.
Che
m. 2
011.
62:6
45-6
68. D
ownl
oade
d fr
om w
ww
.ann
ualr
evie
ws.
org
by C
alif
orni
a In
stitu
te o
f T
echn
olog
y on
03/
04/1
2. F
or p
erso
nal u
se o
nly.
PC62CH30-Gratton ARI 25 February 2011 16:41
a
b
Dx shift Dy shift Correlation image Symmetric image
⟨I(x,y) · I(x + ξ, y + ψ)⟩⟨I(x,y)⟩2
G(ξ,ψ) =
16
32
48
64
0
5
10
16
32
48
64
0
5
10
Figure 5Spatial correlation operation. (a) Given an image, one displaces the frame by Dx, multiplies the intensity at each pixel of the originalframe with the intensity of the pixels in the frame displaced by Dx, and then sums all these products and divides by the average intensitysquared. This value is assigned to the position (1,0) of a new image called the correlation image. This process is repeated for all possibledelays in the x and y directions to produce the spatial correlation, which is half the size of the original image. In the case ofautocorrelation, four quadrants are stitched together for the correlation image. For the operation of a cross-correlation, all fourquadrants are calculated. (b) Smaller image features produce a small region of correlation. Large features produce a correlation of largersize. In the equation for the spatial correlation function, the variables ξ and ψ represent spatial increments in the x and y directions,respectively. A two-dimensional spatial correlation can be computed efficiently using fast Fourier transform methods.
in the next frame so that the intensity at one pixel as a function of time could be representedas a time series (Table 2). This is the same concept as the carpet approach in scanning FCS,and it is called time image correlation spectroscopy. However, in the case of the acquisition ofentire frames, the sampling rate at the same pixel is equal to the frame rate (seconds). This timeis generally much slower than the diffusion (pixel to pixel) of molecules in membranes or in the
www.annualreviews.org • Lessons in Fluctuation Correlation Spectroscopy 653
Ann
u. R
ev. P
hys.
Che
m. 2
011.
62:6
45-6
68. D
ownl
oade
d fr
om w
ww
.ann
ualr
evie
ws.
org
by C
alif
orni
a In
stitu
te o
f T
echn
olog
y on
03/
04/1
2. F
or p
erso
nal u
se o
nly.
PC62CH30-Gratton ARI 25 February 2011 16:41
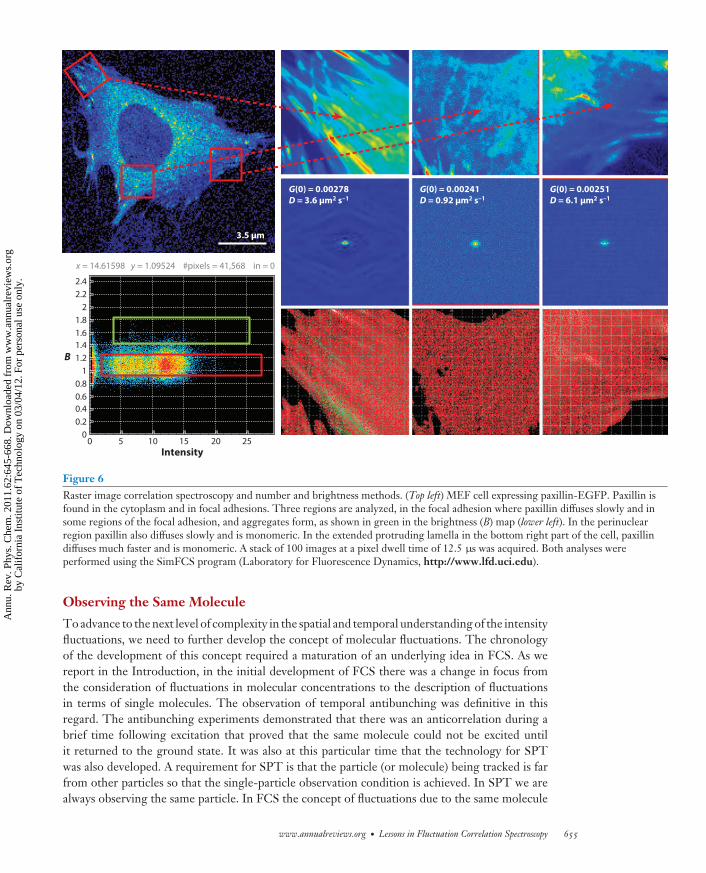
Table 2 Image correlation spectroscopy methods
Method DescriptionImage correlationspectrosocpy (ICS)
Images are spatially correlated only. Method is used to measure the size and number of aggregates. Thespatial coordinate is averaged over the entire image or a part of the image.
Number andbrightness (N&B)
The average and variance of the fluctuations at each pixel of the image are measured. Method is used todetermine the number and brightness of the molecules at each pixel of the image.
Time image correlationspectrosocpy (tICS)
Images are temporally correlated only. Method is used to measure the changes in intensity at each pixel.
Spatio-temporal imagecorrelationspectroscopy (STICS)
Images taken at different times are spatially cross-correlated. The time between the images is varied. Thespatial correlation is averaged over the entire image. Method is used to measure flow.
Inverse space imagecorrelationspectroscopy (kICS)
Images are spatially Fourier transformed. The spatial transform is used for the correlation. Aftercorrelation, the resulting function is inverse Fourier transformed. Method is used to distinguish betweendynamic processes that depend on the spatial scale (diffusion) and processes that are independent on thespatial scale (binding). The correlation is averaged over the entire image.
Raster imagecorrelationspectroscopy (RICS)
Images are acquired in a raster-scan mode. Because the image contains spatial and temporal information,the spatial correlation of the image also contains spatial and temporal information. Method is used tomeasure diffusion and binding in images. The spatial coordinate is averaged over a region of interest.
Particle imagecorrelationspectroscopy (PICS)
This is not a true image correlation method. First, information about the location and the intensity/size ofthe particle is determined, and then the particles so detected are correlated in space and time.
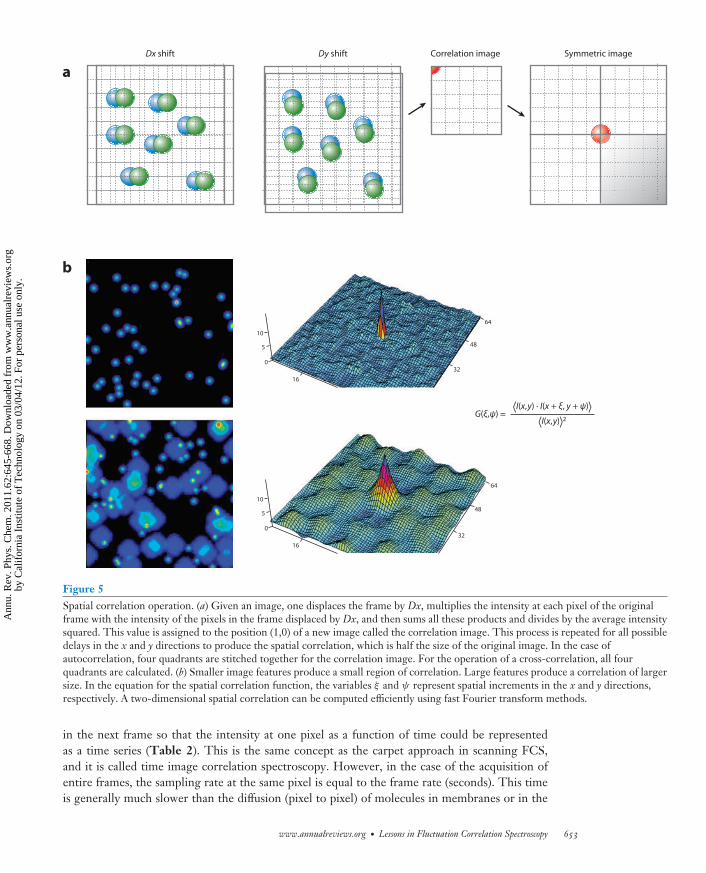
cytoplasm. Therefore, this idea had applications only for very slowly moving particles. By thistime, the idea of exploiting spatio-temporal correlation to determine diffusion and aggregationwas in full development, mainly because of the efforts of the group of Petersen and Wiseman(56–68). Several variants of image correlation spectroscopy were developed with the purpose ofextracting correlations that result from different processes such as diffusion, flow, and binding. Forexample, time image correlation spectroscopy, spatio-temporal image correlation spectroscopy,and inverse-space image correlation spectroscopy were developed at that time (Table 2). Duringthe same period, in our lab we exploited the concept of rapidly scanning a path in the sample sothat the time and the space variables can be simultaneously sampled (69, 70).
There is a substantial difference in acquiring an image as a snapshot and then correlating theintensity at each point with the successive images by comparing with a raster scan of an image witha specific path. The time resolution of the image correlation method is limited by the frame rate(which is on the order of seconds to milliseconds), whereas in the raster-scan method successivepoints along a line are measured with microsecond resolution and points in successive lines aremeasured with millisecond delays (Figure 6) (69–78).
It is important to realize that, in all these image correlation spectroscopy methods, the spatialcorrelation function averages all spatial coordinates so that the spatial information at the pixellevel is lost. One way to partially overcome the reduction in the spatial resolution is to averageover smaller areas, so that some sort of spatial information can be maintained (Figure 6).
Above we discuss methods that have pixel resolution and very-high time resolution (single-point FCS), methods that have good time resolution and pixel resolutions but on many pixels (thecarpet approach), and methods that exploit spatial and temporal correlations but average relativelylarge areas (the image correlation spectroscopy methods). It is noteworthy to mention that we havedeveloped the number and brightness approach, which is based on pixel resolution for methodsused to extract information on the amplitude of the fluctuations (69–71, 76–79).
654 Digman · Gratton
Ann
u. R
ev. P
hys.
Che
m. 2
011.
62:6
45-6
68. D
ownl
oade
d fr
om w
ww
.ann
ualr
evie
ws.
org
by C
alif
orni
a In
stitu
te o
f T
echn
olog
y on
03/
04/1
2. F
or p
erso
nal u
se o
nly.
PC62CH30-Gratton ARI 25 February 2011 16:41
3.5 μm
G(0) = 0.00278
D = 3.6 μm2 s–1
G(0) = 0.00241
D = 0.92 μm2 s–1
G(0) = 0.00251
D = 6.1 μm2 s–1
x = 14.61598 y = 1.09524 #pixels = 41,568 in = 0
Intensity2520151050
B
2.42.2
21.81.61.41.2
10.80.60.40.2
0
Figure 6Raster image correlation spectroscopy and number and brightness methods. (Top left) MEF cell expressing paxillin-EGFP. Paxillin isfound in the cytoplasm and in focal adhesions. Three regions are analyzed, in the focal adhesion where paxillin diffuses slowly and insome regions of the focal adhesion, and aggregates form, as shown in green in the brightness (B) map (lower left). In the perinuclearregion paxillin also diffuses slowly and is monomeric. In the extended protruding lamella in the bottom right part of the cell, paxillindiffuses much faster and is monomeric. A stack of 100 images at a pixel dwell time of 12.5 μs was acquired. Both analyses wereperformed using the SimFCS program (Laboratory for Fluorescence Dynamics, http://www.lfd.uci.edu).
Observing the Same Molecule
To advance to the next level of complexity in the spatial and temporal understanding of the intensityfluctuations, we need to further develop the concept of molecular fluctuations. The chronologyof the development of this concept required a maturation of an underlying idea in FCS. As wereport in the Introduction, in the initial development of FCS there was a change in focus fromthe consideration of fluctuations in molecular concentrations to the description of fluctuationsin terms of single molecules. The observation of temporal antibunching was definitive in thisregard. The antibunching experiments demonstrated that there was an anticorrelation during abrief time following excitation that proved that the same molecule could not be excited untilit returned to the ground state. It was also at this particular time that the technology for SPTwas also developed. A requirement for SPT is that the particle (or molecule) being tracked is farfrom other particles so that the single-particle observation condition is achieved. In SPT we arealways observing the same particle. In FCS the concept of fluctuations due to the same molecule
www.annualreviews.org • Lessons in Fluctuation Correlation Spectroscopy 655
Ann
u. R
ev. P
hys.
Che
m. 2
011.
62:6
45-6
68. D
ownl
oade
d fr
om w
ww
.ann
ualr
evie
ws.
org
by C
alif
orni
a In
stitu
te o
f T
echn
olog
y on
03/
04/1
2. F
or p
erso
nal u
se o
nly.
PC62CH30-Gratton ARI 25 February 2011 16:41
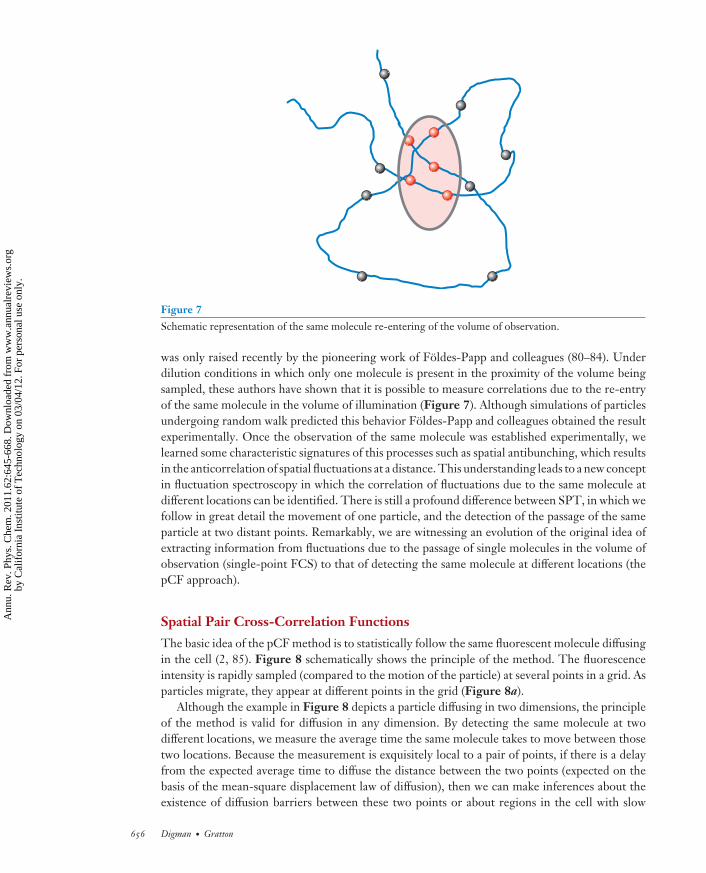
Figure 7Schematic representation of the same molecule re-entering of the volume of observation.
was only raised recently by the pioneering work of Foldes-Papp and colleagues (80–84). Underdilution conditions in which only one molecule is present in the proximity of the volume beingsampled, these authors have shown that it is possible to measure correlations due to the re-entryof the same molecule in the volume of illumination (Figure 7). Although simulations of particlesundergoing random walk predicted this behavior Foldes-Papp and colleagues obtained the resultexperimentally. Once the observation of the same molecule was established experimentally, welearned some characteristic signatures of this processes such as spatial antibunching, which resultsin the anticorrelation of spatial fluctuations at a distance. This understanding leads to a new conceptin fluctuation spectroscopy in which the correlation of fluctuations due to the same molecule atdifferent locations can be identified. There is still a profound difference between SPT, in which wefollow in great detail the movement of one particle, and the detection of the passage of the sameparticle at two distant points. Remarkably, we are witnessing an evolution of the original idea ofextracting information from fluctuations due to the passage of single molecules in the volume ofobservation (single-point FCS) to that of detecting the same molecule at different locations (thepCF approach).
Spatial Pair Cross-Correlation Functions
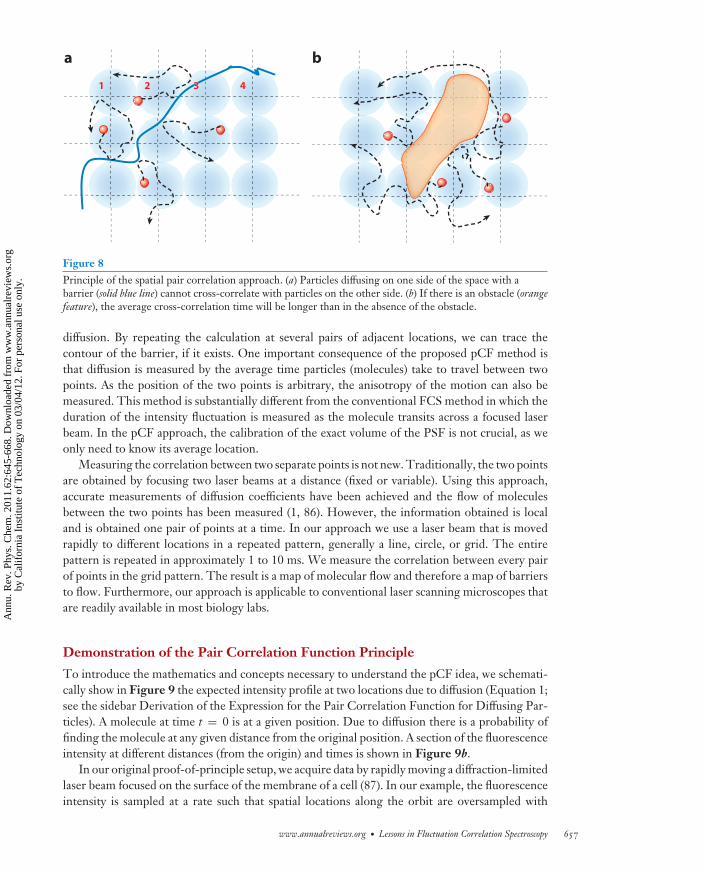
The basic idea of the pCF method is to statistically follow the same fluorescent molecule diffusingin the cell (2, 85). Figure 8 schematically shows the principle of the method. The fluorescenceintensity is rapidly sampled (compared to the motion of the particle) at several points in a grid. Asparticles migrate, they appear at different points in the grid (Figure 8a).
Although the example in Figure 8 depicts a particle diffusing in two dimensions, the principleof the method is valid for diffusion in any dimension. By detecting the same molecule at twodifferent locations, we measure the average time the same molecule takes to move between thosetwo locations. Because the measurement is exquisitely local to a pair of points, if there is a delayfrom the expected average time to diffuse the distance between the two points (expected on thebasis of the mean-square displacement law of diffusion), then we can make inferences about theexistence of diffusion barriers between these two points or about regions in the cell with slow
656 Digman · Gratton
Ann
u. R
ev. P
hys.
Che
m. 2
011.
62:6
45-6
68. D
ownl
oade
d fr
om w
ww
.ann
ualr
evie
ws.
org
by C
alif
orni
a In
stitu
te o
f T
echn
olog
y on
03/
04/1
2. F
or p
erso
nal u
se o
nly.
PC62CH30-Gratton ARI 25 February 2011 16:41
1 2 3 41 2 3 4
a b
Figure 8Principle of the spatial pair correlation approach. (a) Particles diffusing on one side of the space with abarrier (solid blue line) cannot cross-correlate with particles on the other side. (b) If there is an obstacle (orangefeature), the average cross-correlation time will be longer than in the absence of the obstacle.
diffusion. By repeating the calculation at several pairs of adjacent locations, we can trace thecontour of the barrier, if it exists. One important consequence of the proposed pCF method isthat diffusion is measured by the average time particles (molecules) take to travel between twopoints. As the position of the two points is arbitrary, the anisotropy of the motion can also bemeasured. This method is substantially different from the conventional FCS method in which theduration of the intensity fluctuation is measured as the molecule transits across a focused laserbeam. In the pCF approach, the calibration of the exact volume of the PSF is not crucial, as weonly need to know its average location.
Measuring the correlation between two separate points is not new. Traditionally, the two pointsare obtained by focusing two laser beams at a distance (fixed or variable). Using this approach,accurate measurements of diffusion coefficients have been achieved and the flow of moleculesbetween the two points has been measured (1, 86). However, the information obtained is localand is obtained one pair of points at a time. In our approach we use a laser beam that is movedrapidly to different locations in a repeated pattern, generally a line, circle, or grid. The entirepattern is repeated in approximately 1 to 10 ms. We measure the correlation between every pairof points in the grid pattern. The result is a map of molecular flow and therefore a map of barriersto flow. Furthermore, our approach is applicable to conventional laser scanning microscopes thatare readily available in most biology labs.
Demonstration of the Pair Correlation Function Principle
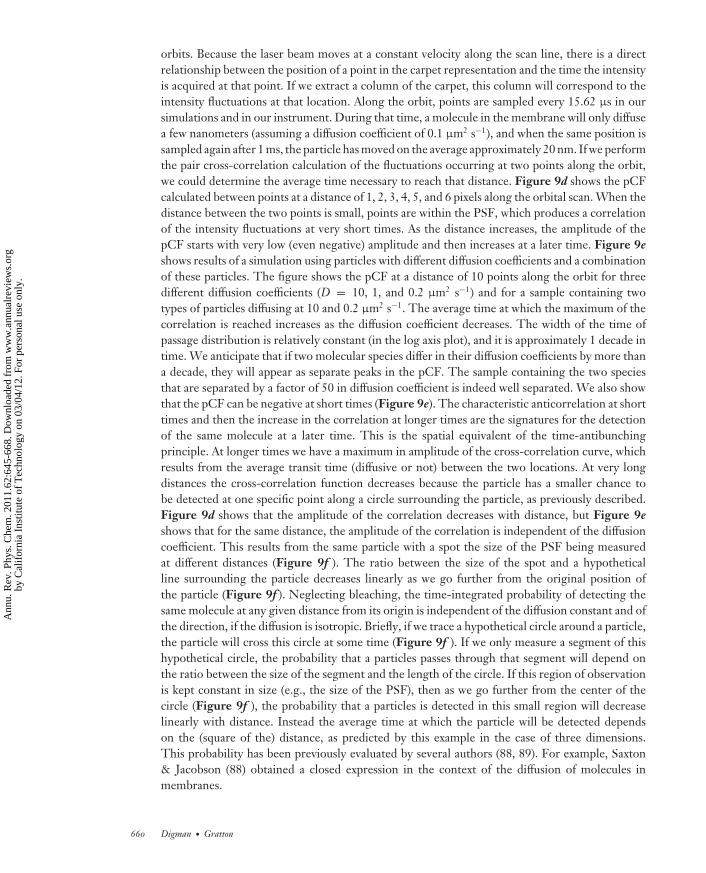
To introduce the mathematics and concepts necessary to understand the pCF idea, we schemati-cally show in Figure 9 the expected intensity profile at two locations due to diffusion (Equation 1;see the sidebar Derivation of the Expression for the Pair Correlation Function for Diffusing Par-ticles). A molecule at time t = 0 is at a given position. Due to diffusion there is a probability offinding the molecule at any given distance from the original position. A section of the fluorescenceintensity at different distances (from the origin) and times is shown in Figure 9b.
In our original proof-of-principle setup, we acquire data by rapidly moving a diffraction-limitedlaser beam focused on the surface of the membrane of a cell (87). In our example, the fluorescenceintensity is sampled at a rate such that spatial locations along the orbit are oversampled with
www.annualreviews.org • Lessons in Fluctuation Correlation Spectroscopy 657
Ann
u. R
ev. P
hys.
Che
m. 2
011.
62:6
45-6
68. D
ownl
oade
d fr
om w
ww
.ann
ualr
evie
ws.
org
by C
alif
orni
a In
stitu
te o
f T
echn
olog
y on
03/
04/1
2. F
or p
erso
nal u
se o
nly.
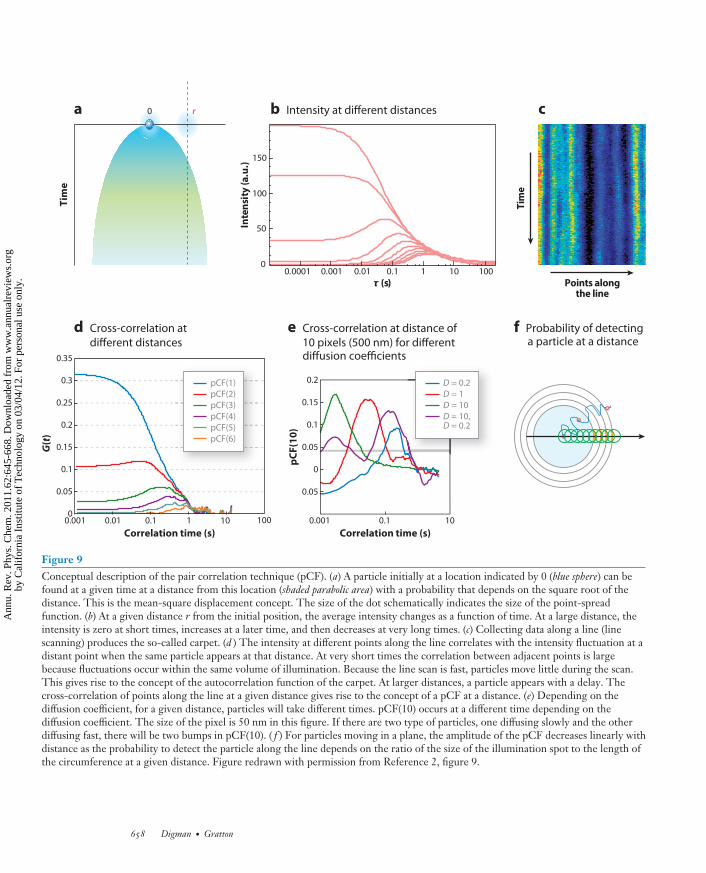
PC62CH30-Gratton ARI 25 February 2011 16:41
10
Tim
e
0
0.05
0.1
0.15
0.2
0.25
0.3
0.35
0.001 0.01 0.1 1 100
G(t
)
pCF(1)pCF(2)pCF(3)pCF(4)pCF(5)pCF(6)
a
τ (s)0.0001 0.001 0.01 0.1 1 10 100
Inte
nsi
ty (
a.u
.)
150
100
50
0
b Intensity at different distances
Tim
e
Points alongthe line
c
d Cross-correlation atd different distances
e Cross-correlation at distance ofe 10 pixels (500 nm) for differente diffusion coefficients
0.05
0
0.05
0.1
0.15
0.2
0.001 0.1 10
pC
F(1
0)
Correlation time (s)Correlation time (s)
0 r
f Probability of detectingc a particle at a distance
D = 0.2D = 1D = 10D = 10,D = 0.2
Figure 9Conceptual description of the pair correlation technique (pCF). (a) A particle initially at a location indicated by 0 (blue sphere) can befound at a given time at a distance from this location (shaded parabolic area) with a probability that depends on the square root of thedistance. This is the mean-square displacement concept. The size of the dot schematically indicates the size of the point-spreadfunction. (b) At a given distance r from the initial position, the average intensity changes as a function of time. At a large distance, theintensity is zero at short times, increases at a later time, and then decreases at very long times. (c) Collecting data along a line (linescanning) produces the so-called carpet. (d ) The intensity at different points along the line correlates with the intensity fluctuation at adistant point when the same particle appears at that distance. At very short times the correlation between adjacent points is largebecause fluctuations occur within the same volume of illumination. Because the line scan is fast, particles move little during the scan.This gives rise to the concept of the autocorrelation function of the carpet. At larger distances, a particle appears with a delay. Thecross-correlation of points along the line at a given distance gives rise to the concept of a pCF at a distance. (e) Depending on thediffusion coefficient, for a given distance, particles will take different times. pCF(10) occurs at a different time depending on thediffusion coefficient. The size of the pixel is 50 nm in this figure. If there are two type of particles, one diffusing slowly and the otherdiffusing fast, there will be two bumps in pCF(10). ( f ) For particles moving in a plane, the amplitude of the pCF decreases linearly withdistance as the probability to detect the particle along the line depends on the ratio of the size of the illumination spot to the length ofthe circumference at a given distance. Figure redrawn with permission from Reference 2, figure 9.
658 Digman · Gratton
Ann
u. R
ev. P
hys.
Che
m. 2
011.
62:6
45-6
68. D
ownl
oade
d fr
om w
ww
.ann
ualr
evie
ws.
org
by C
alif
orni
a In
stitu
te o
f T
echn
olog
y on
03/
04/1
2. F
or p
erso
nal u
se o
nly.
PC62CH30-Gratton ARI 25 February 2011 16:41
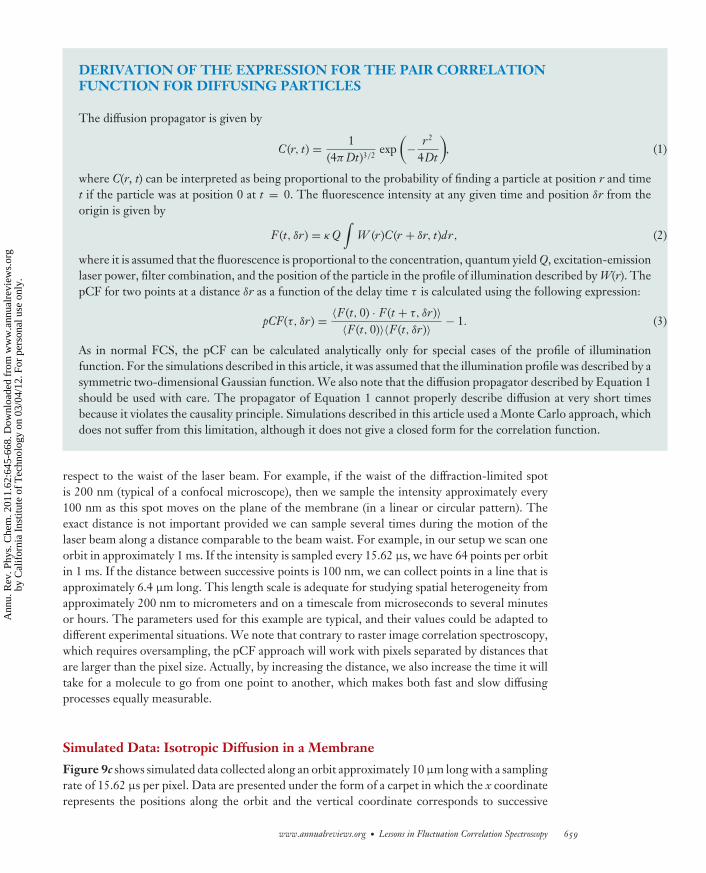
DERIVATION OF THE EXPRESSION FOR THE PAIR CORRELATIONFUNCTION FOR DIFFUSING PARTICLES
The diffusion propagator is given by
C(r, t) = 1(4π Dt)3/2
exp(
− r2
4Dt
), (1)
where C(r, t) can be interpreted as being proportional to the probability of finding a particle at position r and timet if the particle was at position 0 at t = 0. The fluorescence intensity at any given time and position δr from theorigin is given by
F (t, δr) = κ Q∫
W (r)C(r + δr, t)dr, (2)
where it is assumed that the fluorescence is proportional to the concentration, quantum yield Q, excitation-emissionlaser power, filter combination, and the position of the particle in the profile of illumination described by W(r). ThepCF for two points at a distance δr as a function of the delay time τ is calculated using the following expression:
pCF(τ, δr) = 〈F (t, 0) · F (t + τ, δr)〉〈F (t, 0)〉〈F (t, δr)〉 − 1. (3)
As in normal FCS, the pCF can be calculated analytically only for special cases of the profile of illuminationfunction. For the simulations described in this article, it was assumed that the illumination profile was described by asymmetric two-dimensional Gaussian function. We also note that the diffusion propagator described by Equation 1should be used with care. The propagator of Equation 1 cannot properly describe diffusion at very short timesbecause it violates the causality principle. Simulations described in this article used a Monte Carlo approach, whichdoes not suffer from this limitation, although it does not give a closed form for the correlation function.
respect to the waist of the laser beam. For example, if the waist of the diffraction-limited spotis 200 nm (typical of a confocal microscope), then we sample the intensity approximately every100 nm as this spot moves on the plane of the membrane (in a linear or circular pattern). Theexact distance is not important provided we can sample several times during the motion of thelaser beam along a distance comparable to the beam waist. For example, in our setup we scan oneorbit in approximately 1 ms. If the intensity is sampled every 15.62 μs, we have 64 points per orbitin 1 ms. If the distance between successive points is 100 nm, we can collect points in a line that isapproximately 6.4 μm long. This length scale is adequate for studying spatial heterogeneity fromapproximately 200 nm to micrometers and on a timescale from microseconds to several minutesor hours. The parameters used for this example are typical, and their values could be adapted todifferent experimental situations. We note that contrary to raster image correlation spectroscopy,which requires oversampling, the pCF approach will work with pixels separated by distances thatare larger than the pixel size. Actually, by increasing the distance, we also increase the time it willtake for a molecule to go from one point to another, which makes both fast and slow diffusingprocesses equally measurable.
Simulated Data: Isotropic Diffusion in a Membrane
Figure 9c shows simulated data collected along an orbit approximately 10 μm long with a samplingrate of 15.62 μs per pixel. Data are presented under the form of a carpet in which the x coordinaterepresents the positions along the orbit and the vertical coordinate corresponds to successive
www.annualreviews.org • Lessons in Fluctuation Correlation Spectroscopy 659
Ann
u. R
ev. P
hys.
Che
m. 2
011.
62:6
45-6
68. D
ownl
oade
d fr
om w
ww
.ann
ualr
evie
ws.
org
by C
alif
orni
a In
stitu
te o
f T
echn
olog
y on
03/
04/1
2. F
or p
erso
nal u
se o
nly.
PC62CH30-Gratton ARI 25 February 2011 16:41
orbits. Because the laser beam moves at a constant velocity along the scan line, there is a directrelationship between the position of a point in the carpet representation and the time the intensityis acquired at that point. If we extract a column of the carpet, this column will correspond to theintensity fluctuations at that location. Along the orbit, points are sampled every 15.62 μs in oursimulations and in our instrument. During that time, a molecule in the membrane will only diffusea few nanometers (assuming a diffusion coefficient of 0.1 μm2 s−1), and when the same position issampled again after 1 ms, the particle has moved on the average approximately 20 nm. If we performthe pair cross-correlation calculation of the fluctuations occurring at two points along the orbit,we could determine the average time necessary to reach that distance. Figure 9d shows the pCFcalculated between points at a distance of 1, 2, 3, 4, 5, and 6 pixels along the orbital scan. When thedistance between the two points is small, points are within the PSF, which produces a correlationof the intensity fluctuations at very short times. As the distance increases, the amplitude of thepCF starts with very low (even negative) amplitude and then increases at a later time. Figure 9e
shows results of a simulation using particles with different diffusion coefficients and a combinationof these particles. The figure shows the pCF at a distance of 10 points along the orbit for threedifferent diffusion coefficients (D = 10, 1, and 0.2 μm2 s−1) and for a sample containing twotypes of particles diffusing at 10 and 0.2 μm2 s−1. The average time at which the maximum of thecorrelation is reached increases as the diffusion coefficient decreases. The width of the time ofpassage distribution is relatively constant (in the log axis plot), and it is approximately 1 decade intime. We anticipate that if two molecular species differ in their diffusion coefficients by more thana decade, they will appear as separate peaks in the pCF. The sample containing the two speciesthat are separated by a factor of 50 in diffusion coefficient is indeed well separated. We also showthat the pCF can be negative at short times (Figure 9e). The characteristic anticorrelation at shorttimes and then the increase in the correlation at longer times are the signatures for the detectionof the same molecule at a later time. This is the spatial equivalent of the time-antibunchingprinciple. At longer times we have a maximum in amplitude of the cross-correlation curve, whichresults from the average transit time (diffusive or not) between the two locations. At very longdistances the cross-correlation function decreases because the particle has a smaller chance tobe detected at one specific point along a circle surrounding the particle, as previously described.Figure 9d shows that the amplitude of the correlation decreases with distance, but Figure 9e
shows that for the same distance, the amplitude of the correlation is independent of the diffusioncoefficient. This results from the same particle with a spot the size of the PSF being measuredat different distances (Figure 9f ). The ratio between the size of the spot and a hypotheticalline surrounding the particle decreases linearly as we go further from the original position ofthe particle (Figure 9f ). Neglecting bleaching, the time-integrated probability of detecting thesame molecule at any given distance from its origin is independent of the diffusion constant and ofthe direction, if the diffusion is isotropic. Briefly, if we trace a hypothetical circle around a particle,the particle will cross this circle at some time (Figure 9f ). If we only measure a segment of thishypothetical circle, the probability that a particles passes through that segment will depend onthe ratio between the size of the segment and the length of the circle. If this region of observationis kept constant in size (e.g., the size of the PSF), then as we go further from the center of thecircle (Figure 9f ), the probability that a particles is detected in this small region will decreaselinearly with distance. Instead the average time at which the particle will be detected dependson the (square of the) distance, as predicted by this example in the case of three dimensions.This probability has been previously evaluated by several authors (88, 89). For example, Saxton& Jacobson (88) obtained a closed expression in the context of the diffusion of molecules inmembranes.
660 Digman · Gratton
Ann
u. R
ev. P
hys.
Che
m. 2
011.
62:6
45-6
68. D
ownl
oade
d fr
om w
ww
.ann
ualr
evie
ws.
org
by C
alif
orni
a In
stitu
te o
f T
echn
olog
y on
03/
04/1
2. F
or p
erso
nal u
se o
nly.
PC62CH30-Gratton ARI 25 February 2011 16:41
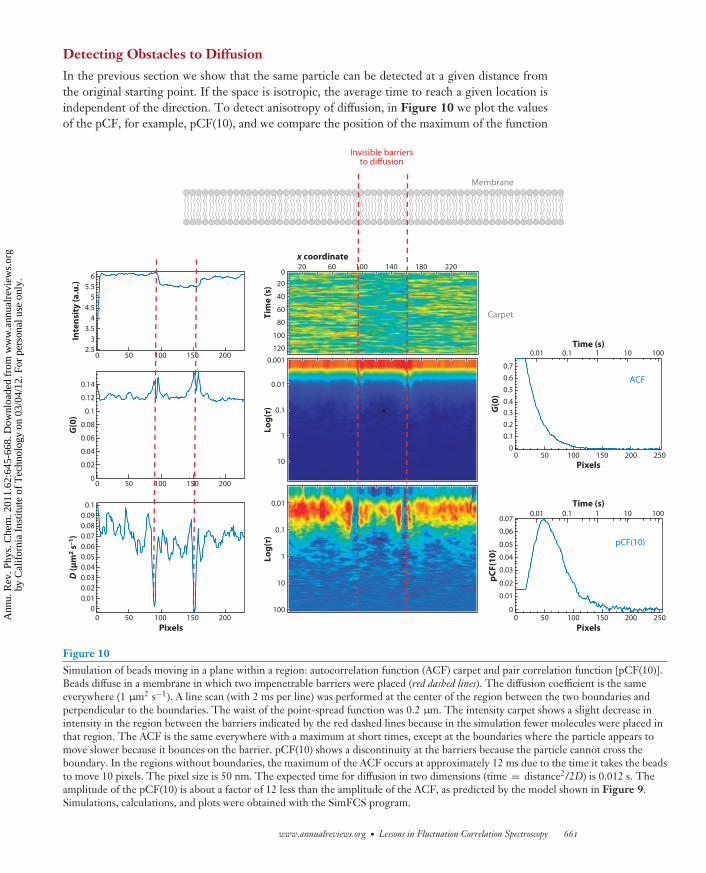
Detecting Obstacles to Diffusion
In the previous section we show that the same particle can be detected at a given distance fromthe original starting point. If the space is isotropic, the average time to reach a given location isindependent of the direction. To detect anisotropy of diffusion, in Figure 10 we plot the valuesof the pCF, for example, pCF(10), and we compare the position of the maximum of the function
Invisible barriersto diffusion
Membrane
0.07
0.06
0.05
0.04
0.03
0.02
0.01
0
0.10.090.080.070.060.050.040.030.020.01
0
Carpet
0.14
0.12
0.1
0.08
0.06
0.04
0.02
0
200150100500
200150100500
200150100Pixels
G(0
)In
ten
sity
(a
.u.)
D (
μm
2 s
–1)
G(0
)p
CF
(10
)
500
65.5
54.5
43.5
32.5
20 60 100 140 180 220
200
40
60
Tim
e (
s)x coordinate
80
100
120
0.001
0.01
0.1
Lo
g(τ
)
1
10
0.01
0.1
Lo
g(τ
)
1
10
100
pCF(10)
Pixels250200150100500
Time (s)
Time (s)
0.01 0.1 1 10 100
0.01 0.1 1 10 100
0.70.60.50.40.30.20.1
0
Pixels250200150100500
ACF
Figure 10Simulation of beads moving in a plane within a region: autocorrelation function (ACF) carpet and pair correlation function [pCF(10)].Beads diffuse in a membrane in which two impenetrable barriers were placed (red dashed lines). The diffusion coefficient is the sameeverywhere (1 μm2 s−1). A line scan (with 2 ms per line) was performed at the center of the region between the two boundaries andperpendicular to the boundaries. The waist of the point-spread function was 0.2 μm. The intensity carpet shows a slight decrease inintensity in the region between the barriers indicated by the red dashed lines because in the simulation fewer molecules were placed inthat region. The ACF is the same everywhere with a maximum at short times, except at the boundaries where the particle appears tomove slower because it bounces on the barrier. pCF(10) shows a discontinuity at the barriers because the particle cannot cross theboundary. In the regions without boundaries, the maximum of the ACF occurs at approximately 12 ms due to the time it takes the beadsto move 10 pixels. The pixel size is 50 nm. The expected time for diffusion in two dimensions (time = distance2/2D) is 0.012 s. Theamplitude of the pCF(10) is about a factor of 12 less than the amplitude of the ACF, as predicted by the model shown in Figure 9.Simulations, calculations, and plots were obtained with the SimFCS program.
www.annualreviews.org • Lessons in Fluctuation Correlation Spectroscopy 661
Ann
u. R
ev. P
hys.
Che
m. 2
011.
62:6
45-6
68. D
ownl
oade
d fr
om w
ww
.ann
ualr
evie
ws.
org
by C
alif
orni
a In
stitu
te o
f T
echn
olog
y on
03/
04/1
2. F
or p
erso
nal u
se o
nly.
PC62CH30-Gratton ARI 25 February 2011 16:41
in different directions or as a function of location. If there is a barrier to diffusion at any givenlocation, the only way to reach the other side of the barrier is if the particle goes around theobstacle or passes over the barrier. The maximum of the correlation will be found at a longer timethan in the absence of a barrier. By mapping the time of the maximum of the pCF for every pairof points in the image, we can establish the location and the size of the obstacles.
In this proof of principle of Figure 10 we performed correlation measurements along a linescan rather than for every point in a plane. The obstacles are on the plane, but the measurementis performed only along one line. Although we cannot detect all obstacles to diffusion, only thosealong the line or close to the line, we can illustrate the principle of the method and interpretexperiments performed on membranes. If we plot the pCF between two points at a given distance(10 pixels) for every point along the line, we see a delay of the time of the maximum of the pCF,if there is a barrier nearby, as shown in Figure 10. Figure 10 shows simulated data in whichparticles are confined to particular regions and an impenetrable barrier exists among these. As theline of measurement crosses these barriers, the same particle cannot be found on the other side ofthe barrier. The barrier produces a delay of the time for the maximum correlation (in this case toinfinity) as the barrier cannot be crossed. The pattern of the pCF shown in Figure 10, projectedon the image, gives directly the location of the barriers along the line.
0.001
–8 × 10⁴
–4 × 10⁴
–2 × 10⁴
0.001
0.01
0.1
1
10
0
2 × 10⁴
0.01 0.1
Col(3–12)
c pCF(12)
Correlation time (s) pCF(12)
Pa
ir c
orr
ela
tio
n
Lo
g t
ime
(s)
1 10 3 13
d pCF(9)
a
b
0.001–1 × 10⁻³
0
1 × 10³
2 × 10³
0.01 0.1
Col(9)
Col(6)Col(4)
Col(1)
Correlation time (s)
Pa
ir c
orr
ela
tio
n
1 10
0.001
0.01
0.1
1
10
pCF(9)
Lo
g t
ime
(s)
1 13
0.001
0.01
0.1
1
10
Intensitycarpet
Lo
g t
ime
(s)
1 14
NENENE
N CN C
32
0.001
0.01
0.1
1
10
NuclearACF
Lo
g t
ime
(s)
1 13
N
C
NENEN
C
NE
1
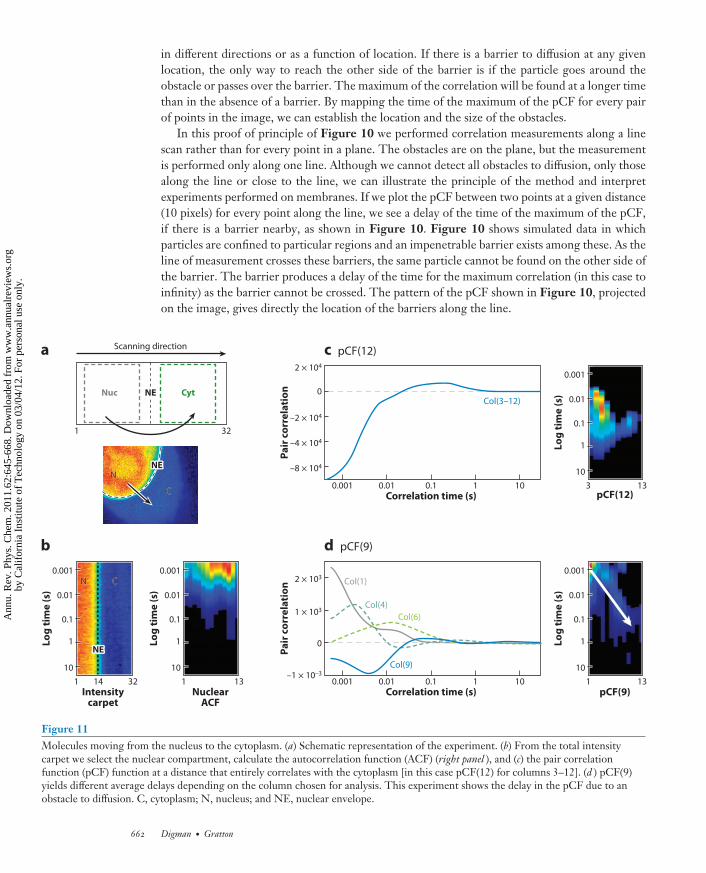
Nuc Cyt
32
Scanning direction
NENENE
Figure 11Molecules moving from the nucleus to the cytoplasm. (a) Schematic representation of the experiment. (b) From the total intensitycarpet we select the nuclear compartment, calculate the autocorrelation function (ACF) (right panel ), and (c) the pair correlationfunction (pCF) function at a distance that entirely correlates with the cytoplasm [in this case pCF(12) for columns 3–12]. (d ) pCF(9)yields different average delays depending on the column chosen for analysis. This experiment shows the delay in the pCF due to anobstacle to diffusion. C, cytoplasm; N, nucleus; and NE, nuclear envelope.
662 Digman · Gratton
Ann
u. R
ev. P
hys.
Che
m. 2
011.
62:6
45-6
68. D
ownl
oade
d fr
om w
ww
.ann
ualr
evie
ws.
org
by C
alif
orni
a In
stitu
te o
f T
echn
olog
y on
03/
04/1
2. F
or p
erso
nal u
se o
nly.
PC62CH30-Gratton ARI 25 February 2011 16:41
EXAMPLE OF APPLICATIONS OF THE CONCEPT OF PAIRCORRELATION FUNCTION TO DETECT OBSTACLES TO DIFFUSION
Figure 11 shows an example of a measurement of diffusion of EGFP, which has a nuclear local-ization signal for the nucleus. The complete analysis of this case has recently been published (85).The line-scan measurement is performed along a line going from the nucleus to the cytoplasm.In this direction, there is only diffuse motion, as opposed to the reverse direction in which themotion is directed and much faster. Figure 11a shows the conceptual setup. Figure 11b showsthe carpet obtained along the line going from the nucleus to the cytoplasm. Depending on theregion of analysis, determined by the point along the line scan, we can detect fast diffusion in thenucleus (pixels 1–12), relatively slow diffusion in the cytoplasm (pixels 16–32) (Figure 11c), and adelayed correlation due to the passage through the nuclear envelope for analysis through pixel 14(Figure 11d). In the reverse direction, from cytoplasm to nucleus, the active transport results in amuch faster (than diffusion) transport across the nuclear pore envelope. These data are shown inReference 85. Figure 11 demonstrates the richness of information obtained by the pCF approach.This information is similar in content to that obtained with SPT but here is obtained on singleproteins in the presence of many proteins in the volume of observation.
CONCLUSIONS AND FUTURE PROSPECTS
The evolution of the FCS has occurred in parallel with advances in the single-molecule field ofwhich it shares many conceptual aspects and methods for statistical analysis. The understandingthat FCS signals originate from single molecules came much earlier than the development of thesingle-molecule field. However, there is a major distinction between the single-molecule field,in which only one molecule is observed at a time, and FCS, in which the statistical behavior ofindividual molecules is obtained from the observation of a relatively small ensemble. An importantobservation that provided a new perspective for FCS was the realization that fluctuations due tosingle molecules can be observed in cells. Image correlation spectroscopy was specifically conceivedfor the biological environment. However, the original approach was based on averaging overa relatively large volume. Recent conceptual and technical developments are in the directionof reducing the spatial averaging to the minimum. There are still important limitations of thisapproach due to signal-to-noise considerations when a single molecule is observed in a cell in a seaof many molecules. Future advances will involve the development of better detection methods andthe development of techniques for three-dimensional correlations for the cellular environment.
SUMMARY POINTS
1. In the single-point FCS section, we describe the classic approach to the principle offluorescence fluctuation analysis.
2. The spatio-temporal concept has evolved in fluctuation spectroscopy through scanningtechniques.
3. The traditional spatial correlation approach involves the carpet idea for the organizationof measurements in space and time
4. In the ICS section we describe the mathematical approach to spatial correlation.
5. The “same” molecule correlates with itself in different spatial locations.
6. Spatial pCFs can detect anisotropic molecular flow.
www.annualreviews.org • Lessons in Fluctuation Correlation Spectroscopy 663
Ann
u. R
ev. P
hys.
Che
m. 2
011.
62:6
45-6
68. D
ownl
oade
d fr
om w
ww
.ann
ualr
evie
ws.
org
by C
alif
orni
a In
stitu
te o
f T
echn
olog
y on
03/
04/1
2. F
or p
erso
nal u
se o
nly.
PC62CH30-Gratton ARI 25 February 2011 16:41
7. The pCF principle has been demonstrated in simple systems.
8. Obstacles to diffusion have been detected using pCF analysis.
DISCLOSURE STATEMENT
The authors are not aware of any affiliations, memberships, funding, or financial holdings thatmight be perceived as affecting the objectivity of this review.
ACKNOWLEDGMENTS
This work was supported in part by the National Institutes of Health grants CMC U54-GM064346, LFD P41-RRO3155, and CCBS P50-GM076516.
LITERATURE CITED
1. Dertinger T, Loman A, Ewers B, Muller CB, Kramer B, Enderlein J. 2008. The optics and performanceof dual-focus fluorescence correlation spectroscopy. Opt. Express 16:14353–68
2. Digman MA, Gratton E. 2009. Imaging barriers to diffusion by pair correlation functions. Biophys. J.97:665–73
3. Berne BJ, Pecora R. 1976. Dynamic Light Scattering. New York: Wiley4. Elson EL, Webb WW. 1975. Concentration correlation spectroscopy: a new biophysical probe based on
occupation number fluctuations. Annu. Rev. Biophys. Bioeng. 4:311–345. Koppel DE. 1974. Study of Escherichia coli ribosomes by intensity fluctuation spectroscopy of scattered
laser light. Biochemistry 13:2712–196. Camerini-Otero RD, Pusey PN, Koppel DE, Schaefer DW, Franklin RM. 1974. Intensity fluctuation
spectroscopy of laser light scattered by solutions of spherical viruses: R17, Q beta, BSV, PM2, and T7. II.Diffusion coefficients, molecular weights, solvation, and particle dimensions. Biochemistry 13:960–70
7. Pusey PN, Koppel DE, Schaefer DW, Camerini-Otero RD, Koenig SH. 1974. Intensity fluctuationspectroscopy of laser light scattered by solutions of spherical viruses: R17, Q beta, BSV, PM2, and T7. I.Light-scattering technique. Biochemistry 13:952–60
8. Magde D, Elson E, Webb WW. 1972. Thermodynamic fluctuations in a reacting system: measurementby fluorescence correlation spectroscopy. Phys. Rev. Lett. 29:705–8
9. Koppel DE, AD, Schlessinger J, Elson EL, Webb WW. 1976. Dynamics of fluorescence marker concen-tration as a probe of mobility. Biophys. J. 16:1315–29
10. Magde D, Elson EL, Webb WW. 1974. Fluorescence correlation spectroscopy. II. An experimentalrealization. Biopolymers 13:29–61
11. Elson EL, Magde D. 1974. Fluorescence correlation spectroscopy. I. Conceptual basis and theory. Biopoly-mers 13(1):1–27
12. Elson EL. 2004. Quick tour of fluorescence correlation spectroscopy from its inception. J. Biomed. Opt.9:857–64
13. Koppel DE. 1974. Statistical accuracy in fluorescence correlation spectroscopy. Phys. Rev. A 10:1938–4514. Palmer AG, Thompson NL. 1987. Molecular aggregation characterized by high order autocorrelation in
fluorescence correlation spectroscopy. Biophys. J. 52:257–7015. Palmer AG 3rd, Thompson NL. 1987. Molecular aggregation characterized by high order autocorrelation
in fluorescence correlation spectroscopy. Biophys. J. 52:257–7016. Palmer AG 3rd, Thompson NL. 1987. Theory of sample translation in fluorescence correlation spec-
troscopy. Biophys. J. 511:339–4317. Chen Y, Muller JD, Ruan Q, Gratton E. 2002. Molecular brightness characterization of EGFP in vivo
by fluorescence fluctuation spectroscopy. Biophys. J. 82:133–44
664 Digman · Gratton
Ann
u. R
ev. P
hys.
Che
m. 2
011.
62:6
45-6
68. D
ownl
oade
d fr
om w
ww
.ann
ualr
evie
ws.
org
by C
alif
orni
a In
stitu
te o
f T
echn
olog
y on
03/
04/1
2. F
or p
erso
nal u
se o
nly.
PC62CH30-Gratton ARI 25 February 2011 16:41
18. Van Rompaey E, Chen Y, Muller JD, Gratton E, Van Craenenbroeck E, et al. 2001. Fluorescence fluc-tuation analysis for the study of interactions between oligonucleotides and polycationic polymers. Biol.Chem. 382:379–86
19. Chen Y, Muller JD, So PT, Gratton E. 1999. The photon counting histogram in fluorescence fluctuationspectroscopy. Biophys. J. 77:553–67
20. Hillesheim LN, Chen Y, Muller JD. 2006. Dual-color photon counting histogram analysis of mRFP1and EGFP in living cells. Biophys. J. 91:4273–84
21. Chen Y, Wei LN, Muller JD. 2003. Probing protein oligomerization in living cells with fluorescencefluctuation spectroscopy. Proc. Natl. Acad. Sci. USA 100:15492–97
22. Palo K, Brand L, Eggeling C, Jager S, Kask P, Gall K. 2002. Fluorescence intensity and lifetime distributionanalysis: toward higher accuracy in fluorescence fluctuation spectroscopy. Biophys. J. 83:605–18
23. Palo K, Mets U, Jager S, Kask P, Gall K. 2000. Fluorescence intensity multiple distributions analysis:concurrent determination of diffusion times and molecular brightness. Biophys. J. 79:2858–66
24. Kask P, et al. 2000. Two-dimensional fluorescence intensity distribution analysis: theory and applications.Biophys. J. 78:1703–13
25. McKinney SA, Joo C, Ha T. 2006. Analysis of single molecule FRET trajectories using hidden Markovmodeling. Biophys. J. 91:1941–51
26. Sisamakis E, Valeri A, Kalinin S, Rothwell PJ, Seidel CA. 2010. Accurate single-molecule FRET studiesusing multiparameter fluorescence detection. Methods Enzymol. 475:455–514
27. Kalinin S, Valeri A, Antonik M, Felekyan S, Seidel CA. 2010. Detection of structural dynamics by FRET:a photon distribution and fluorescence lifetime analysis of systems with multiple states. J. Phys. Chem. B114:7983–95
28. Weidtkamp-Peters S, Felekyan S, Bleckmann A, Simon R, Becker W, et al. 2009. Multiparameter fluo-rescence image spectroscopy to study molecular interactions. Photochem. Photobiol. Sci. 8:470–80
29. Kalinin S, Felekyan S, Valeri A, Seidel CA. 2008. Characterizing multiple molecular states in single-molecule multiparameter fluorescence detection by probability distribution analysis. J. Phys. Chem. B112:8361–74
30. Kalinin S, Felekyan S, Antonik M, Seidel CA. 2007. Probability distribution analysis of single-moleculefluorescence anisotropy and resonance energy transfer. J. Phys. Chem. B 111:10253–62
31. Gaiduk A, Kuhnemuth R, Felekyan S, Antonik M, Becker W, et al. 2007. Fluorescence detection with hightime resolution: from optical microscopy to simultaneous force and fluorescence spectroscopy. Microsc.Res. Tech. 70:433–41
32. Widengren J, Kudryavtsev V, Antonik M, Berger S, Gerken M, Seidel CA. 2006. Single-molecule detec-tion and identification of multiple species by multiparameter fluorescence detection. Anal. Chem. 78:2039–50
33. Eigen M, Rigler R. 1994. Sorting single molecules: application to diagnostics and evolutionary biotech-nology. Proc. Natl. Acad. Sci. USA 91:5740–47
34. Lord SJ, Lee HL, Moerner WE. 2010. Single-molecule spectroscopy and imaging of biomolecules inliving cells. Anal. Chem. 82:2192–203
35. Bacia K, Schwille P. 2007. Fluorescence correlation spectroscopy. Methods Mol. Biol. 398:73–8436. Kim SA, Heinze KG, Schwille P. 2007. Fluorescence correlation spectroscopy in living cells. Nat. Methods
4:963–7337. Haustein E, Schwille P. 2007. Fluorescence correlation spectroscopy: novel variations of an established
technique. Annu. Rev. Biophys. Biomol. Struct. 36:151–6938. Bacia K, Kim SA, Schwille P. 2006. Fluorescence cross-correlation spectroscopy in living cells. Nat.
Methods 3:83–8939. Burkhardt M, Heinze KG, Schwille P. 2005. Four-color fluorescence correlation spectroscopy realized
in a grating-based detection platform. Opt. Lett. 30:2266–6840. Kim SA, Heinze KG, Bacia K, Waxham MN, Schwille P. 2005. Two-photon cross-correlation analysis
of intracellular reactions with variable stoichiometry. Biophys. J. 88:4319–3641. Heinze KG, Jahnz M, Schwille P. 2004. Triple-color coincidence analysis: one step further in following
higher order molecular complex formation. Biophys. J. 86:506–16
www.annualreviews.org • Lessons in Fluctuation Correlation Spectroscopy 665
Ann
u. R
ev. P
hys.
Che
m. 2
011.
62:6
45-6
68. D
ownl
oade
d fr
om w
ww
.ann
ualr
evie
ws.
org
by C
alif
orni
a In
stitu
te o
f T
echn
olog
y on
03/
04/1
2. F
or p
erso
nal u
se o
nly.
PC62CH30-Gratton ARI 25 February 2011 16:41
42. Bacia K, Schwille P. 2003. A dynamic view of cellular processes by in vivo fluorescence auto- and cross-correlation spectroscopy. Methods 29:74–85
43. Schwille P, Meyer-Almes FJ, Rigler R. 1997. Dual-color fluorescence cross-correlation spectroscopy formulticomponent diffusional analysis in solution. Biophys. J. 72:1878–86
44. Weissman M, Schindler H, Feher G. 1976. Determination of molecular weights by fluctuation spec-troscopy: application to DNA. Proc. Natl. Acad. Sci. USA 73:2776–80
45. Koppel DE, Morgan F, Cowan A, Carson JH. 1994. Scanning concentration correlation spectroscopyusing the confocal laser microscope. Biophys. J. 66:502–7
46. Berland KM, So PT, Chen Y, Mantulin WW, Gratton E. 1996. Scanning two-photon fluctuation cor-relation spectroscopy: particle counting measurements for detection of molecular aggregation. Biophys. J.71:410–20
47. Petrasek Z, Hoege C, Mashaghi A, Ohrt T, Hyman AA, Schwille P. 2008. Characterization of pro-tein dynamics in asymmetric cell division by scanning fluorescence correlation spectroscopy. Biophys. J.95:5476–86
48. Petrasek Z, Schwille P. 2008. Photobleaching in two-photon scanning fluorescence correlation spec-troscopy. Chemphyschem 9:147–58
49. Ries J, Chiantia S, Schwille P. 2009. Accurate determination of membrane dynamics with line-scan FCS.Biophys. J. 96:1999–2008
50. Ries J, Yu SR, Burkhardt M, Brand M, Schwille P. 2009. Modular scanning FCS quantifies receptor-ligandinteractions in living multicellular organisms. Nat. Methods 6:643–45
51. Krishnan K, Holub O, Gratton E, Clayton AHA, Cody S, Moens PDJ. 2009. Profilin interaction withphosphatidylinositol (4,5)-bisphosphate destabilizes the membrane of giant unilamellar vesicles. Biophys.J. 96:5112–21
52. Dertinger T, Pacheco V, von der Hocht I, Hartmann R, Gregor I, Enderlein J. 2007. Two-focusfluorescence correlation spectroscopy: a new tool for accurate and absolute diffusion measurements.Chemphyschem 8:433–43
53. Petersen NO, Brown C, Kaminski A, Rocheleau J, Srivastave M, Wiseman PW. 1998. Analysis of mem-brane protein cluster densities and sizes in situ by image correlation spectroscopy. Faraday Discuss. 111:289–305
54. Petersen NO. 1986. Scanning fluorescence correlation spectroscopy. I. Theory and simulation of aggre-gation measurements. Biophys. J. 49:809–15
55. Petersen NO, Hoddelius PL, Wiseman PW, Seger O, Magnusson KE. 1993. Quantitation of membranereceptor distributions by image correlation spectroscopy: concept and application. Biophys. J. 165:1135–46
56. Kolin DL, Wiseman PW. 2007. Advances in image correlation spectroscopy: measuring number densities,aggregation states, and dynamics of fluorescently labeled macromolecules in cells. Cell Biochem. Biophys.49:141–64
57. Durisic N, Bachir AI, Kolin DL, Hebert B, Lagerholm BC, et al. 2007. Detection and correction of blink-ing bias in image correlation transport measurements of quantum dot tagged macromolecules. Biophys. J.93:1338–46
58. Brown CM, Hebert B, Kolin DL, Zareno J, Whitmore L, et al. 2006. Probing the integrin-actin linkageusing high-resolution protein velocity mapping. J. Cell Sci. 119:5204–14
59. Kolin DL, Ronis D, Wiseman PW. 2006. k-Space image correlation spectroscopy: a method for accuratetransport measurements independent of fluorophore photophysics. Biophys. J. 91:3061–75
60. Bates IR, Hebert B, Luo Y, Liao J, Bachir AI, et al. 2006. Membrane lateral diffusion and capture of CFTRwithin transient confinement zones. Biophys. J. 91:1046–58
61. Kolin DL, Costantino S, Wiseman PW. 2006. Sampling effects, noise, and photobleaching in temporalimage correlation spectroscopy. Biophys. J. 90:628–39
62. Costantino S, Comeau JW, Kolin DL, Wiseman PW. 2005. Accuracy and dynamic range of spatial imagecorrelation and cross-correlation spectroscopy. Biophys. J. 89:1251–60
63. Hebert B, Costantino S, Wiseman PW. 2005. Spatiotemporal image correlation spectroscopy (STICS)theory, verification, and application to protein velocity mapping in living CHO cells. Biophys. J. 88:3601–14
666 Digman · Gratton
Ann
u. R
ev. P
hys.
Che
m. 2
011.
62:6
45-6
68. D
ownl
oade
d fr
om w
ww
.ann
ualr
evie
ws.
org
by C
alif
orni
a In
stitu
te o
f T
echn
olog
y on
03/
04/1
2. F
or p
erso
nal u
se o
nly.
PC62CH30-Gratton ARI 25 February 2011 16:41
64. Wiseman PW, Brown CM, Webb DJ, Hebert B, Johnson NL, et al. 2004. Spatial mapping of integrininteractions and dynamics during cell migration by image correlation microscopy. J. Cell Sci. 117:5521–34
65. Wiseman PW, Capani F, Squier JA, Martone ME. 2002. Counting dendritic spines in brain tissue slicesby image correlation spectroscopy analysis. J. Microsc. 205:177–86
66. Wiseman PW, Squier JA, Ellisman MH, Wilson KR. 2000. Two-photon image correlation spectroscopyand image cross-correlation spectroscopy. J. Microsc. 200:14–25
67. Wiseman PW, Petersen NO. 1999. Image correlation spectroscopy. II. Optimization for ultrasensitivedetection of preexisting platelet-derived growth factor-beta receptor oligomers on intact cells. Biophys. J.76:963–77
68. Wiseman PW, Hoddelius P, Petersen NO, Magnusson KE. 1997. Aggregation of PDGF-beta receptorsin human skin fibroblasts: characterization by image correlation spectroscopy (ICS). FEBS Lett. 401:43–48
69. Digman MA, Brown CM, Sengupta P, Wiseman PW, Horwitz AR, Gratton E. 2005. Measuring fastdynamics in solutions and cells with a laser scanning microscope. Biophys. J. 89:1317–27
70. Digman MA, Sengupta P, Wiseman PW, Brown CM, Horwitz AR, Gratton E. 2005. Fluctuation cor-relation spectroscopy with a laser-scanning microscope: exploiting the hidden time structure. Biophys. J.88:L33–36
71. Digman MA, Wiseman PW, Choi C, Horwitz AR, Gratton E. 2009. Stoichiometry of molecular complexesat adhesions in living cells. Proc. Natl. Acad. Sci. USA 106:2170–75
72. Digman MA, Wiseman PW, Horwitz AR, Gratton E. 2009. Detecting protein complexes in living cellsfrom laser scanning confocal image sequences by the cross correlation raster image spectroscopy method.Biophys. J. 96:707–16
73. Digman MA, Gratton E. 2009. Analysis of diffusion and binding in cells using the RICS approach. Microsc.Res. Tech. 72:323–32
74. Sanabria H, Digman MA, Gratton E, Waxham MN. 2008. Spatial diffusivity and availability of intracellularcalmodulin. Biophys. J. 95:6002–15
75. Brown CM, Dalal RB, Hebert B, Digman MA, Horwitz AR, Gratton E. 2008. Raster image correlationspectroscopy (RICS) for measuring fast protein dynamics and concentrations with a commercial laserscanning confocal microscope. J. Microsc. 229:78–91
76. Digman MA, Dalal R, Horwitz AF, Gratton E. 2008. Mapping the number of molecules and brightnessin the laser scanning microscope. Biophys. J. 94:2320–32
77. Digman MA, Brown CM, Horwitz AR, Mantulin WW, Gratton E. 2008. Paxillin dynamics measuredduring adhesion assembly and disassembly by correlation spectroscopy. Biophys. J. 94:2819–31
78. Dalal RB, Digman MA, Horwitz AF, Vetri V, Gratton E. 2008. Determination of particle number andbrightness using a laser scanning confocal microscope operating in the analog mode. Microsc. Res. Tech.71:69–81
79. Ossato G, Digman MA, Aiken C, Lukacsovich T, Marsh JL, Gratton E. 2010. A two-step path to inclusionformation of Huntingtin peptides revealed by number and brightness analysis. Biophys. J. 98:3078–85
80. Foldes-Papp Z. 2007. Fluorescence fluctuation spectroscopic approaches to the study of a single moleculediffusing in solution and a live cell without systemic drift or convection: a theoretical study. Curr. Pharm.Biotechnol. 8:261–73
81. Foldes-Papp Z. 2007. ‘True’ single-molecule molecule observations by fluorescence correlation spec-troscopy and two-color fluorescence cross-correlation spectroscopy. Exp. Mol. Pathol. 82:147–55
82. Foldes-Papp Z. 2006. What it means to measure a single molecule in a solution by fluorescence fluctuationspectroscopy. Exp. Mol. Pathol. 80:209–18
83. Foldes-Papp Z, Demel U, Tilz GP. 2004. A new concept for ultrasensitive fluorescence measurements ofmolecules in solution and membrane: 2. The individual immune molecule. J. Immunol. Methods 286:13–20
84. Foldes-Papp Z, Baumann G, Demel U, Tilz GP. 2004. Counting and behavior of an individual fluorescentmolecule without hydrodynamic flow, immobilization, or photon count statistics. Curr. Pharm. Biotechnol.5:163–72
85. Cardarelli F, Gratton E. 2010. In vivo imaging of single-molecule translocation through nuclear porecomplexes by pair correlation functions. PLoS One 5:e10475
86. Korlann Y, Dertinger T, Michalet X, Weiss S, Enderlein J. 2008. Measuring diffusion with polarization-modulation dual-focus fluorescence correlation spectroscopy. Opt. Express 16:14609–16
www.annualreviews.org • Lessons in Fluctuation Correlation Spectroscopy 667
Ann
u. R
ev. P
hys.
Che
m. 2
011.
62:6
45-6
68. D
ownl
oade
d fr
om w
ww
.ann
ualr
evie
ws.
org
by C
alif
orni
a In
stitu
te o
f T
echn
olog
y on
03/
04/1
2. F
or p
erso
nal u
se o
nly.
PC62CH30-Gratton ARI 25 February 2011 16:41
87. Ruan Q, Chen Y, Gratton E, Glaser M, Mantulin WW. 2002. Cellular characterization of adenylate kinaseand its isoform: two-photon excitation fluorescence imaging and fluorescence correlation spectroscopy.Biophys. J. 83:3177–87
88. Saxton MJ, Jacobson K. 1997. Single-particle tracking: applications to membrane dynamics. Annu. Rev.Biophys. Biomol. Struct. 26:373–99
89. Schmidt T, Schutz GJ, Baumgartner W, Gruber HJ, Schindler H. 1996. Imaging of single moleculediffusion. Proc. Natl. Acad. Sci. USA 93:2926–29
668 Digman · Gratton
Ann
u. R
ev. P
hys.
Che
m. 2
011.
62:6
45-6
68. D
ownl
oade
d fr
om w
ww
.ann
ualr
evie
ws.
org
by C
alif
orni
a In
stitu
te o
f T
echn
olog
y on
03/
04/1
2. F
or p
erso
nal u
se o
nly.
PC62FrontMatter ARI 18 February 2011 17:56
Annual Review ofPhysical Chemistry
Volume 62, 2011 Contents
Laboring in the Vineyard of Physical ChemistryBenjamin Widom � � � � � � � � � � � � � � � � � � � � � � � � � � � � � � � � � � � � � � � � � � � � � � � � � � � � � � � � � � � � � � � � � � � � � � � � � � � � � � 1
The Ultrafast Pathway of Photon-Induced ElectrocyclicRing-Opening Reactions: The Case of 1,3-CyclohexadieneSanghamitra Deb and Peter M. Weber � � � � � � � � � � � � � � � � � � � � � � � � � � � � � � � � � � � � � � � � � � � � � � � � � � � � �19
Coarse-Grained (Multiscale) Simulations in Studies of Biophysicaland Chemical SystemsShina C.L. Kamerlin, Spyridon Vicatos, Anatoly Dryga, and Arieh Warshel � � � � � � � � � � � �41
Dynamics of Nanoconfined Supercooled LiquidsR. Richert � � � � � � � � � � � � � � � � � � � � � � � � � � � � � � � � � � � � � � � � � � � � � � � � � � � � � � � � � � � � � � � � � � � � � � � � � � � � � � � � � � � � � �65
Ionic Liquids: Structure and Photochemical ReactionsEdward W. Castner Jr., Claudio J. Margulis, Mark Maroncelli,
and James F. Wishart � � � � � � � � � � � � � � � � � � � � � � � � � � � � � � � � � � � � � � � � � � � � � � � � � � � � � � � � � � � � � � � � � � � � � �85
Theoretical Study of Negative Molecular IonsJack Simons � � � � � � � � � � � � � � � � � � � � � � � � � � � � � � � � � � � � � � � � � � � � � � � � � � � � � � � � � � � � � � � � � � � � � � � � � � � � � � � � � 107
Theoretical and Computational Protein DesignIlan Samish, Christopher M. MacDermaid, Jose Manuel Perez-Aguilar,
and Jeffery G. Saven � � � � � � � � � � � � � � � � � � � � � � � � � � � � � � � � � � � � � � � � � � � � � � � � � � � � � � � � � � � � � � � � � � � � � 129
Melting and Freezing of Metal ClustersAndres Aguado and Martin F. Jarrold � � � � � � � � � � � � � � � � � � � � � � � � � � � � � � � � � � � � � � � � � � � � � � � � � � � � 151
Astronomical ChemistryWilliam Klemperer � � � � � � � � � � � � � � � � � � � � � � � � � � � � � � � � � � � � � � � � � � � � � � � � � � � � � � � � � � � � � � � � � � � � � � � � � 173
Simulating Chemistry Using Quantum ComputersIvan Kassal, James D. Whitfield, Alejandro Perdomo-Ortiz, Man-Hong Yung,
and Alan Aspuru-Guzik � � � � � � � � � � � � � � � � � � � � � � � � � � � � � � � � � � � � � � � � � � � � � � � � � � � � � � � � � � � � � � � � � 185
Multiresonant Coherent Multidimensional SpectroscopyJohn C. Wright � � � � � � � � � � � � � � � � � � � � � � � � � � � � � � � � � � � � � � � � � � � � � � � � � � � � � � � � � � � � � � � � � � � � � � � � � � � � � 209
Probing Free-Energy Surfaces with Differential Scanning CalorimetryJose M. Sanchez-Ruiz � � � � � � � � � � � � � � � � � � � � � � � � � � � � � � � � � � � � � � � � � � � � � � � � � � � � � � � � � � � � � � � � � � � � � � 231
viii
Ann
u. R
ev. P
hys.
Che
m. 2
011.
62:6
45-6
68. D
ownl
oade
d fr
om w
ww
.ann
ualr
evie
ws.
org
by C
alif
orni
a In
stitu
te o
f T
echn
olog
y on
03/
04/1
2. F
or p
erso
nal u
se o
nly.
PC62FrontMatter ARI 18 February 2011 17:56
Role of Solvation Effects in Protein Denaturation: FromThermodynamics to Single Molecules and BackJeremy L. England and Gilad Haran � � � � � � � � � � � � � � � � � � � � � � � � � � � � � � � � � � � � � � � � � � � � � � � � � � � � � 257
Solid-State NMR Studies of Amyloid Fibril StructureRobert Tycko � � � � � � � � � � � � � � � � � � � � � � � � � � � � � � � � � � � � � � � � � � � � � � � � � � � � � � � � � � � � � � � � � � � � � � � � � � � � � � � � 279
Cooperativity, Local-Nonlocal Coupling, and Nonnative Interactions:Principles of Protein Folding from Coarse-Grained ModelsHue Sun Chan, Zhuqing Zhang, Stefan Wallin, and Zhirong Liu � � � � � � � � � � � � � � � � � � � � � 301
Hydrated Acid ClustersKenneth R. Leopold � � � � � � � � � � � � � � � � � � � � � � � � � � � � � � � � � � � � � � � � � � � � � � � � � � � � � � � � � � � � � � � � � � � � � � � � � 327
Developments in Laboratory Studies of Gas-Phase Reactions forAtmospheric Chemistry with Applications to Isoprene Oxidationand Carbonyl ChemistryPaul W. Seakins and Mark A. Blitz � � � � � � � � � � � � � � � � � � � � � � � � � � � � � � � � � � � � � � � � � � � � � � � � � � � � � � 351
Bonding in Beryllium ClustersMichael C. Heaven, Jeremy M. Merritt, and Vladimir E. Bondybey � � � � � � � � � � � � � � � � � � � 375
Reorientation and Allied Dynamics in Water and Aqueous SolutionsDamien Laage, Guillaume Stirnemann, Fabio Sterpone, Rossend Rey,
and James T. Hynes � � � � � � � � � � � � � � � � � � � � � � � � � � � � � � � � � � � � � � � � � � � � � � � � � � � � � � � � � � � � � � � � � � � � � � 395
Detecting Nanodomains in Living Cell Membrane by FluorescenceCorrelation SpectroscopyHai-Tao He and Didier Marguet � � � � � � � � � � � � � � � � � � � � � � � � � � � � � � � � � � � � � � � � � � � � � � � � � � � � � � � � � 417
Toward a Molecular Theory of Early and Late Events in Monomerto Amyloid Fibril FormationJohn E. Straub and D. Thirumalai � � � � � � � � � � � � � � � � � � � � � � � � � � � � � � � � � � � � � � � � � � � � � � � � � � � � � � � 437
The Density Matrix Renormalization Group in Quantum ChemistryGarnet Kin-Lic Chan and Sandeep Sharma � � � � � � � � � � � � � � � � � � � � � � � � � � � � � � � � � � � � � � � � � � � � � � 465
Thermodynamics and Mechanics of Membrane Curvature Generationand Sensing by Proteins and LipidsTobias Baumgart, Benjamin R. Capraro, Chen Zhu, and Sovan L. Das � � � � � � � � � � � � � � � 483
Coherent Nonlinear Optical Imaging: Beyond FluorescenceMicroscopyWei Min, Christian W. Freudiger, Sijia Lu, and X. Sunney Xie � � � � � � � � � � � � � � � � � � � � � � � 507
Roaming RadicalsJoel M. Bowman and Benjamin C. Shepler � � � � � � � � � � � � � � � � � � � � � � � � � � � � � � � � � � � � � � � � � � � � � � � 531
Coarse-Grained Simulations of Macromolecules:From DNA to NanocompositesJuan J. de Pablo � � � � � � � � � � � � � � � � � � � � � � � � � � � � � � � � � � � � � � � � � � � � � � � � � � � � � � � � � � � � � � � � � � � � � � � � � � � � 555
Contents ix
Ann
u. R
ev. P
hys.
Che
m. 2
011.
62:6
45-6
68. D
ownl
oade
d fr
om w
ww
.ann
ualr
evie
ws.
org
by C
alif
orni
a In
stitu
te o
f T
echn
olog
y on
03/
04/1
2. F
or p
erso
nal u
se o
nly.
PC62FrontMatter ARI 18 February 2011 17:56
New Developments in the Physical Chemistry of Shock CompressionDana D. Dlott � � � � � � � � � � � � � � � � � � � � � � � � � � � � � � � � � � � � � � � � � � � � � � � � � � � � � � � � � � � � � � � � � � � � � � � � � � � � � � 575
Solvation Dynamics and Proton Transfer in Nanoconfined LiquidsWard H. Thompson � � � � � � � � � � � � � � � � � � � � � � � � � � � � � � � � � � � � � � � � � � � � � � � � � � � � � � � � � � � � � � � � � � � � � � � � 599
Nonadiabatic Events and Conical IntersectionsSpiridoula Matsika and Pascal Krause � � � � � � � � � � � � � � � � � � � � � � � � � � � � � � � � � � � � � � � � � � � � � � � � � � � � 621
Lessons in Fluctuation Correlation SpectroscopyMichelle A. Digman and Enrico Gratton � � � � � � � � � � � � � � � � � � � � � � � � � � � � � � � � � � � � � � � � � � � � � � � � � 645
Indexes
Cumulative Index of Contributing Authors, Volumes 58–62 � � � � � � � � � � � � � � � � � � � � � � � � � � � 669
Cumulative Index of Chapter Titles, Volumes 58–62 � � � � � � � � � � � � � � � � � � � � � � � � � � � � � � � � � � � 672
Errata
An online log of corrections to Annual Review of Physical Chemistry articles may befound at http://physchem.annualreviews.org/errata.shtml
x Contents
Ann
u. R
ev. P
hys.
Che
m. 2
011.
62:6
45-6
68. D
ownl
oade
d fr
om w
ww
.ann
ualr
evie
ws.
org
by C
alif
orni
a In
stitu
te o
f T
echn
olog
y on
03/
04/1
2. F
or p
erso
nal u
se o
nly.