Embed Size (px)
Citation preview

Lessons LearnedLessons LearnedDiscover 101 -DDiscover 101 -DLessons LearnedLessons LearnedDiscover 101 -DDiscover 101 -D
Theresia WansiTheresia Wansi
1/08/091/08/09

Outline•Discuss Projects•Lessons learned

Two Projects1. Tracking the Stock Market Performance
2. Research Methodology- investigate relationships between
variables.

Who Is Dow Jones???

How is the Performance of the Stock Market?
• Monitor 3 main Indexes:– Dow Jones– S&P500 – Nasdaq

• Main Web site for data used is:• www.yahoofinance.com• The attached excel file is the six
weeks summary from Michael Quick, a student in the class.

Lessons Learned• Good project if done for a short time.• Boring if done all through the semester .

Solution• Limit project to Two Months• Have groups track different
indexes and discuss results.

Econometric methodologyEconometric methodology
Exploring Relationship Exploring Relationship between Variablesbetween Variables
Econometric methodologyEconometric methodology
Exploring Relationship Exploring Relationship between Variablesbetween Variables
Bobbie C., Mike S., Casey T.Bobbie C., Mike S., Casey T.

Econometric Methodology
– Define Research Question– Observe /gather Facts– Formula : y = b1 + b2 (x) + e– Estimate Parameters using Regression
Analysis– Test Hypothesis– Use information to predict future outcomes

Step 1 : Define Question
• How is GPA affected by the amount of study hours?
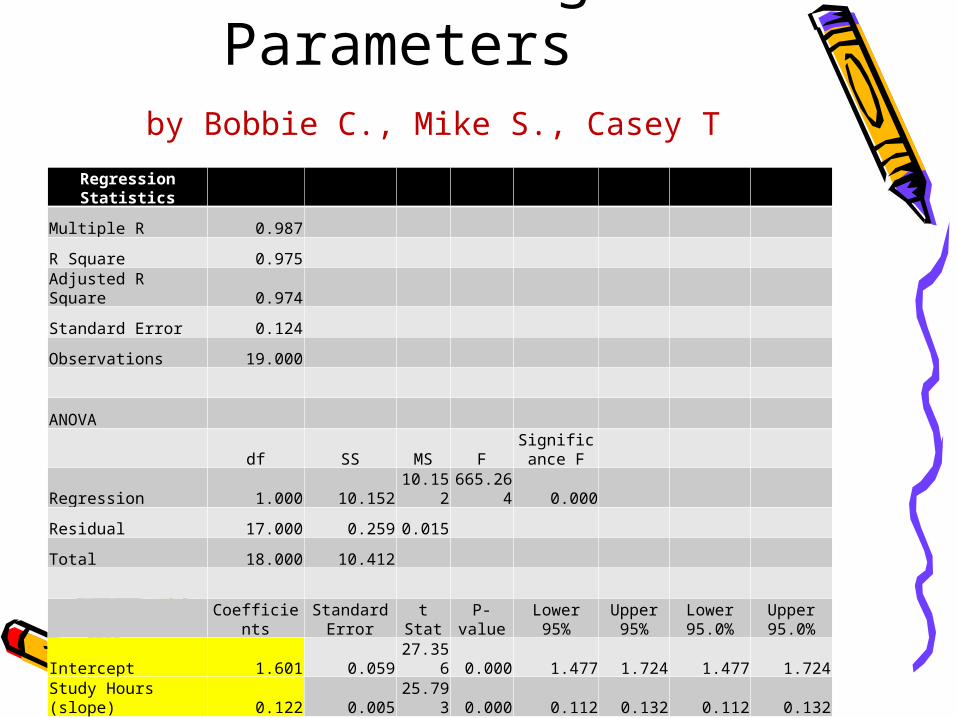
Estimating Parameters by Bobbie C., Mike S., Casey T
Regression Statistics
Multiple R 0.987
R Square 0.975
Adjusted R Square 0.974
Standard Error 0.124
Observations 19.000
ANOVA
df SS MS FSignifican
ce F
Regression 1.000 10.15210.15
2665.26
4 0.000
Residual 17.000 0.259 0.015
Total 18.000 10.412
CoefficientsStandard
Error t Stat P-valueLower 95%
Upper 95%
Lower 95.0%
Upper 95.0%
Intercept 1.601 0.05927.35
6 0.000 1.477 1.724 1.477 1.724
Study Hours (slope) 0.122 0.00525.79
3 0.000 0.112 0.132 0.112 0.132

The Meaning of the Output
by Bobbie C., Mike S., Casey T
• B1: The Intercept
– This number is the LOWEST possible GPA• If Study Hours were zero
• B2: The Slope
– This number represents by how much your GPA will increase for each hour you study.
• So the lowest possible GPA is 1.601 and for each hour you study, your GPA will increase by .122
Intercept: 1.601Study Hours (slope): 0.122
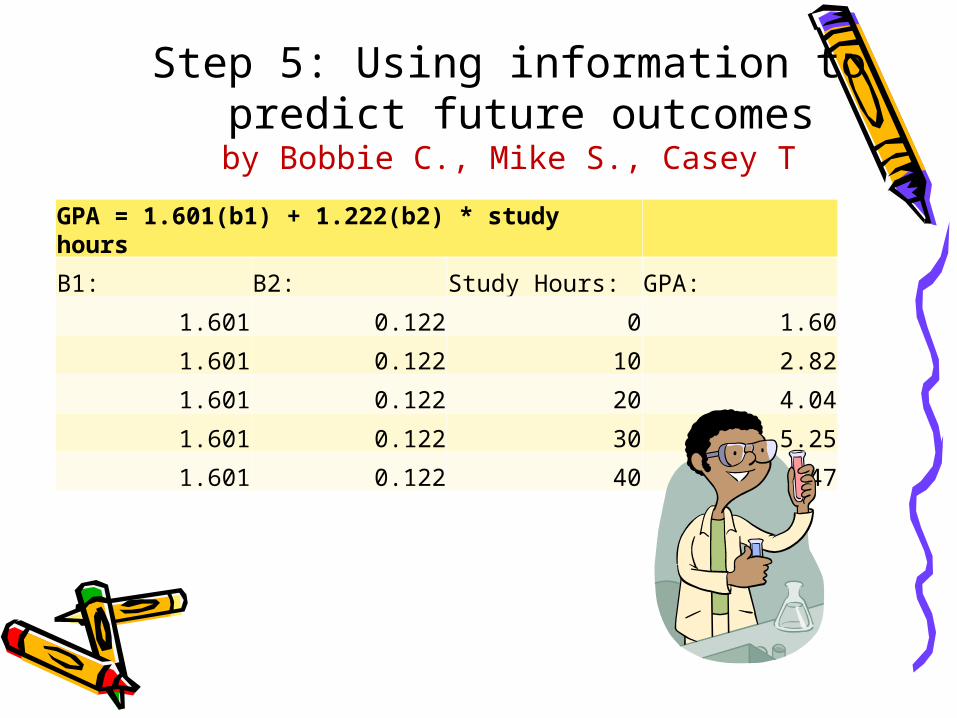
Step 5: Using information to predict future outcomes
by Bobbie C., Mike S., Casey T
GPA = 1.601(b1) + 1.222(b2) * study hours
B1: B2: Study Hours: GPA:
1.601 0.122 0 1.60
1.601 0.122 10 2.82
1.601 0.122 20 4.04
1.601 0.122 30 5.25
1.601 0.122 40 6.47

Lessons Learned• KIS = Keep It Simple.
– Explore simple relationships• E.g Price & Quantity Demanded• Income versus Expenditure
– Omit Hypothesis Testing• Too much for freshmen
• Include primary data from MM students .• Having a Mentor in your field is helpful.

Questions???