Embed Size (px)
Citation preview
Lessons Learned from Accidental Ammonia Releases
IRC Research & Technology Forum
May 10-11, 2017
M. Kent Anderson President Emeritus, IIAR
Past Chair, ASTI
Why is ammonia regulated? Are ammonia refrigeration accidents common/significant? Can lessons be learned from accidental releases that will prevent future incidents?
Introduction and Overview
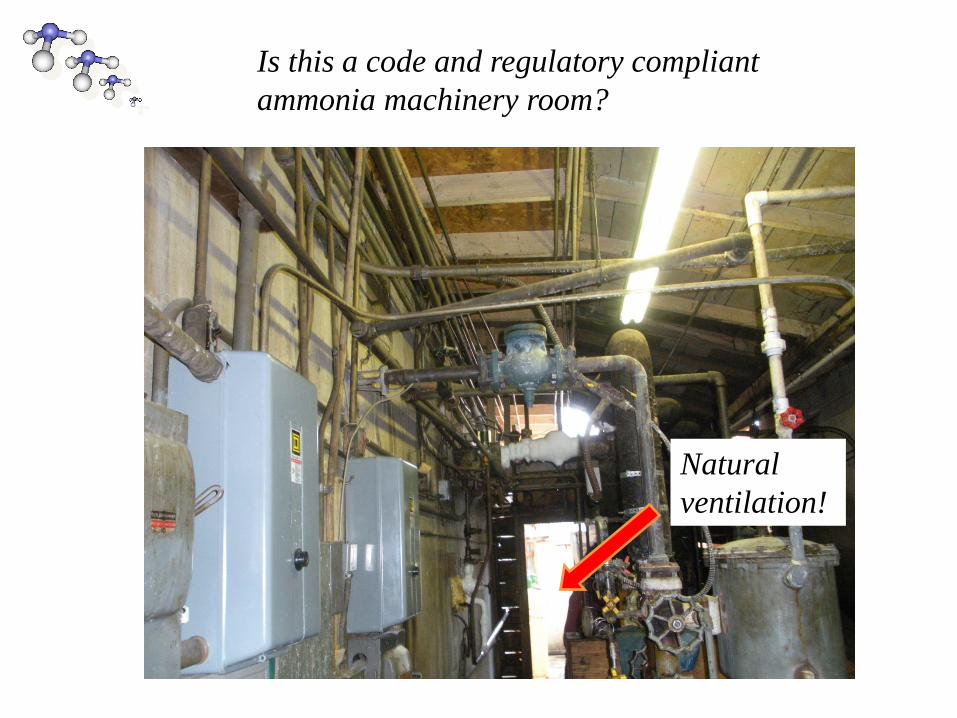
Is this a code and regulatory compliant
ammonia machinery room?
Natural
ventilation!
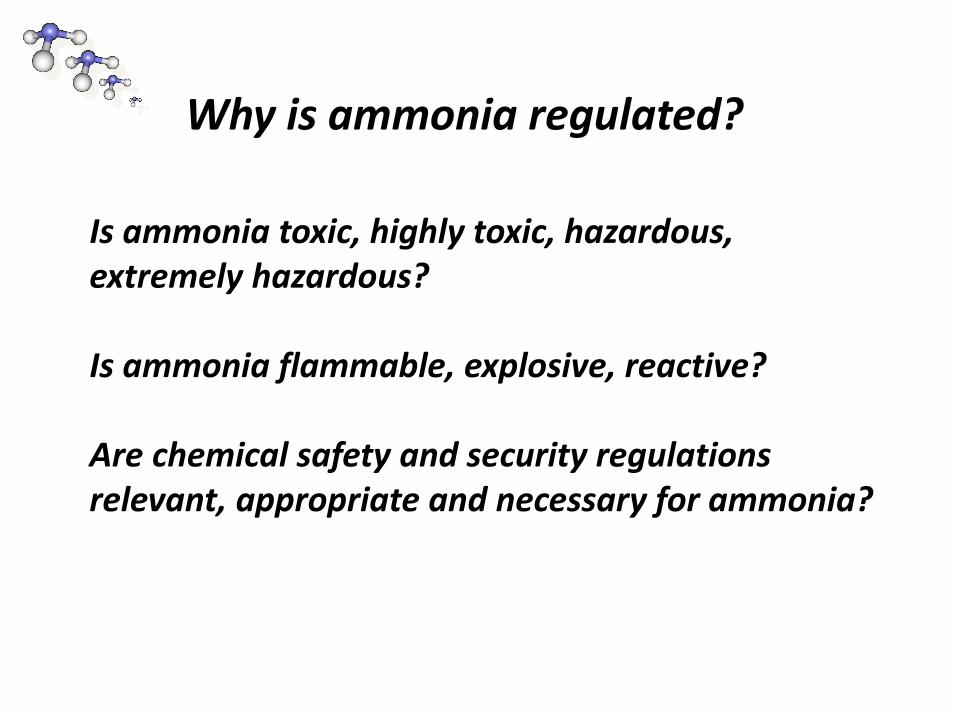
Is ammonia toxic, highly toxic, hazardous, extremely hazardous? Is ammonia flammable, explosive, reactive? Are chemical safety and security regulations relevant, appropriate and necessary for ammonia?
Why is ammonia regulated?
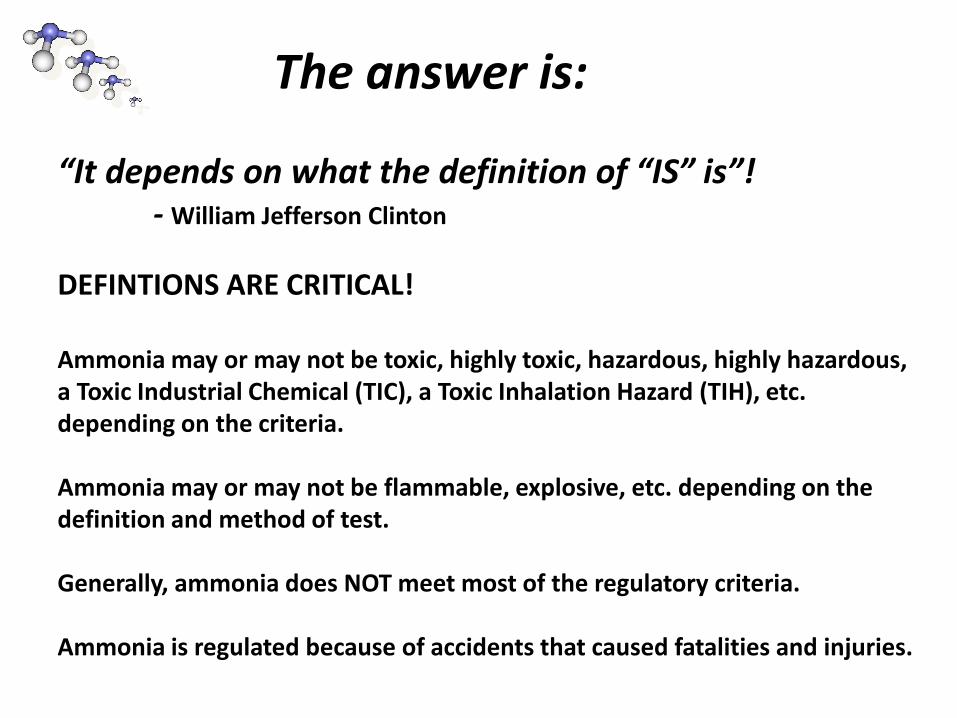
“It depends on what the definition of “IS” is”! - William Jefferson Clinton
DEFINTIONS ARE CRITICAL! Ammonia may or may not be toxic, highly toxic, hazardous, highly hazardous, a Toxic Industrial Chemical (TIC), a Toxic Inhalation Hazard (TIH), etc. depending on the criteria. Ammonia may or may not be flammable, explosive, etc. depending on the definition and method of test. Generally, ammonia does NOT meet most of the regulatory criteria. Ammonia is regulated because of accidents that caused fatalities and injuries.
The answer is:
REGULATORY HISTORY
Why is ammonia regulated?
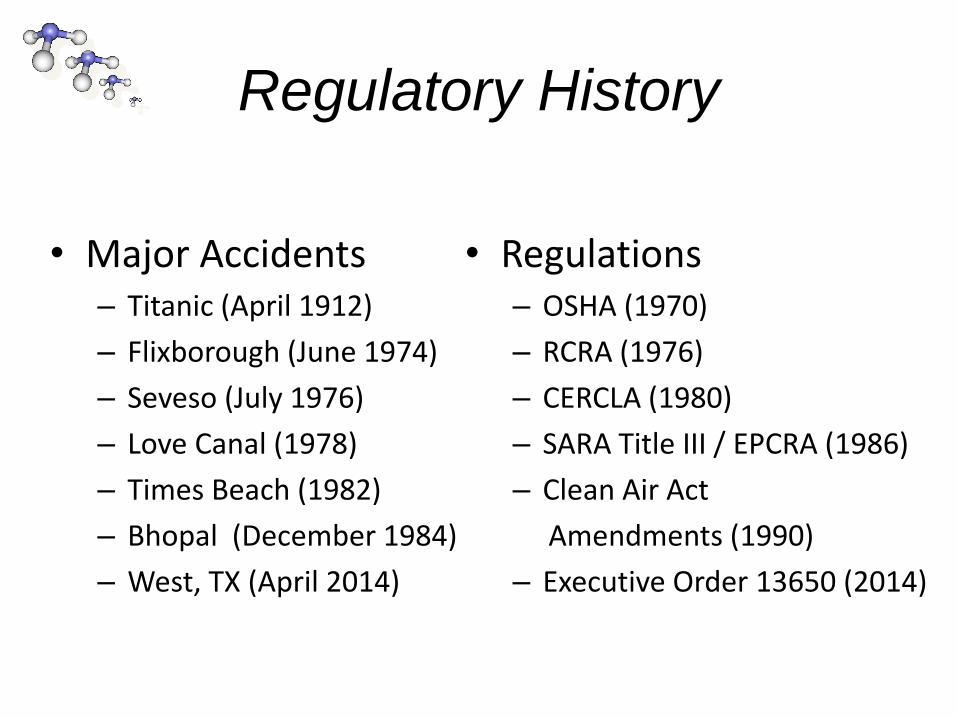
Regulatory History
• Major Accidents – Titanic (April 1912)
– Flixborough (June 1974)
– Seveso (July 1976)
– Love Canal (1978)
– Times Beach (1982)
– Bhopal (December 1984)
– West, TX (April 2014)
• Regulations – OSHA (1970)
– RCRA (1976)
– CERCLA (1980)
– SARA Title III / EPCRA (1986)
– Clean Air Act
Amendments (1990)
– Executive Order 13650 (2014)
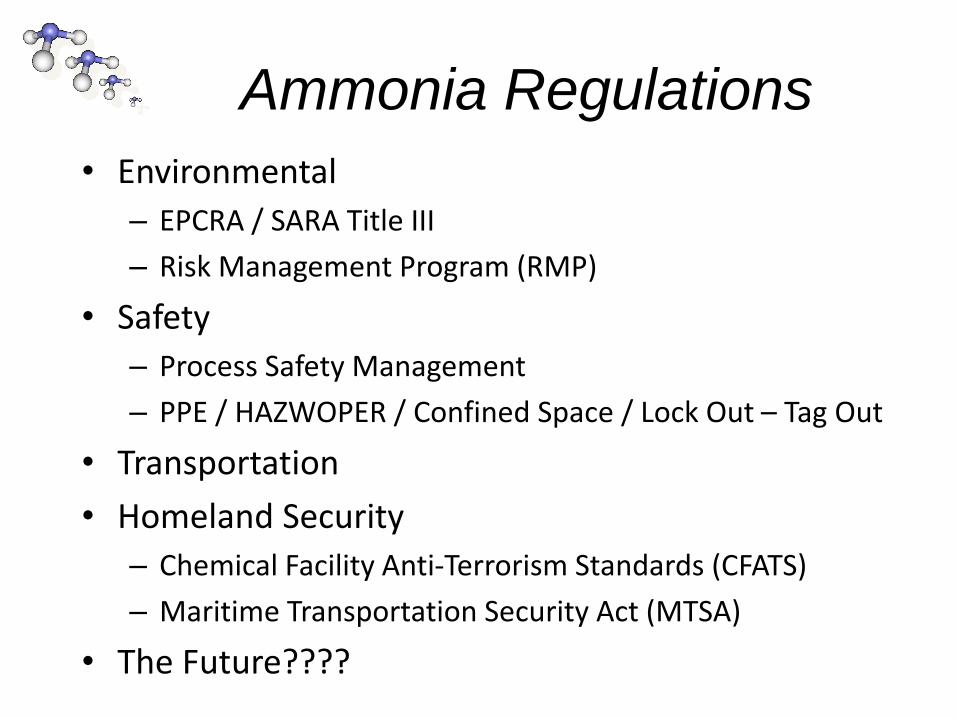
Ammonia Regulations
• Environmental
– EPCRA / SARA Title III
– Risk Management Program (RMP)
• Safety
– Process Safety Management
– PPE / HAZWOPER / Confined Space / Lock Out – Tag Out
• Transportation
• Homeland Security
– Chemical Facility Anti-Terrorism Standards (CFATS)
– Maritime Transportation Security Act (MTSA)
• The Future????
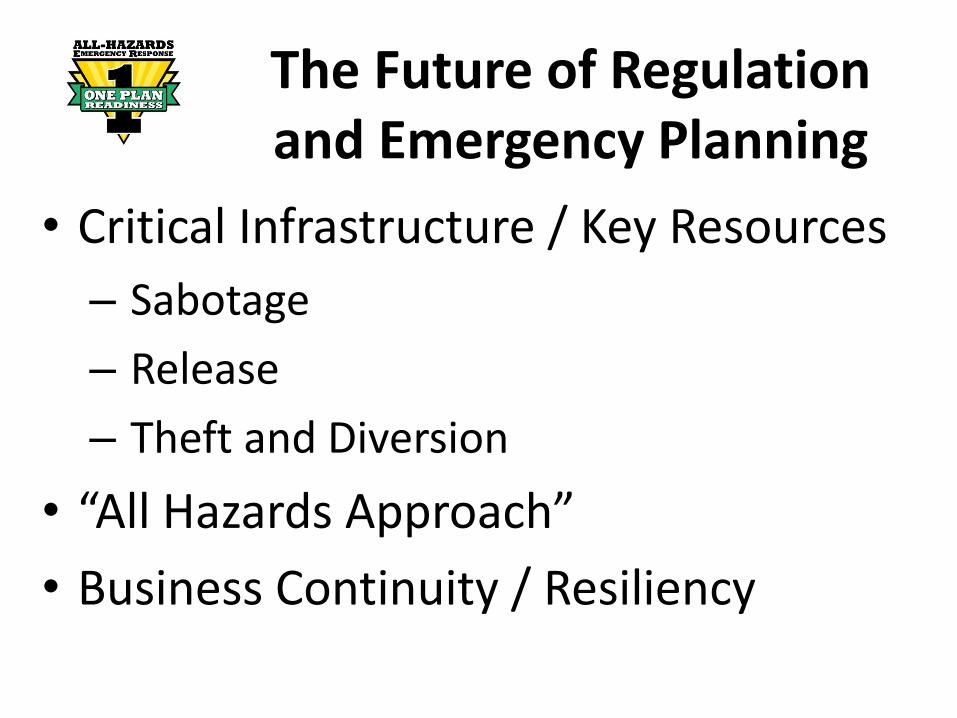
The Future of Regulation and Emergency Planning
• Critical Infrastructure / Key Resources – Sabotage
– Release
– Theft and Diversion
• “All Hazards Approach”
• Business Continuity / Resiliency
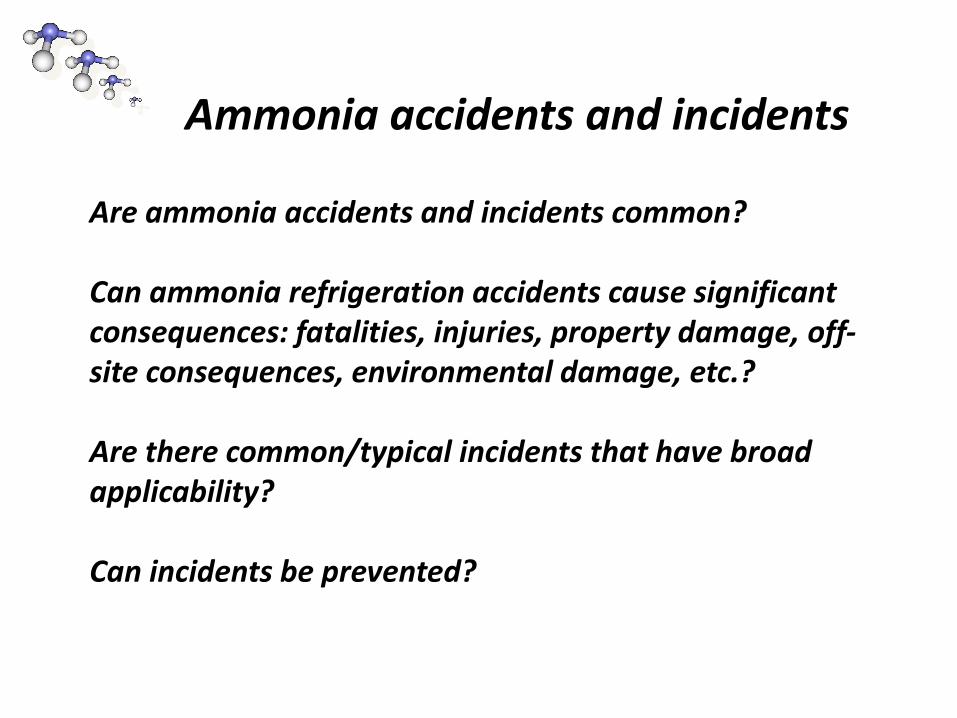
Are ammonia accidents and incidents common? Can ammonia refrigeration accidents cause significant consequences: fatalities, injuries, property damage, off-site consequences, environmental damage, etc.? Are there common/typical incidents that have broad applicability? Can incidents be prevented?
Ammonia accidents and incidents

YES!!!
The answer is:
Significant Ammonia Accidents
• Crete, NE (1969)
- Rail car, 90 Tons, 9 dead, 53 injured
• Potchefstroom, South Africa (1973)
- Storage vessel, 38 Tons, 18 dead, 65 injured
• Hutchinson, KS (1976)
- Pipeline, 350 Tons, 4 dead
• Houston, TX (1976)
- Tanker truck, 19 Tons, 6 dead, 200 injured
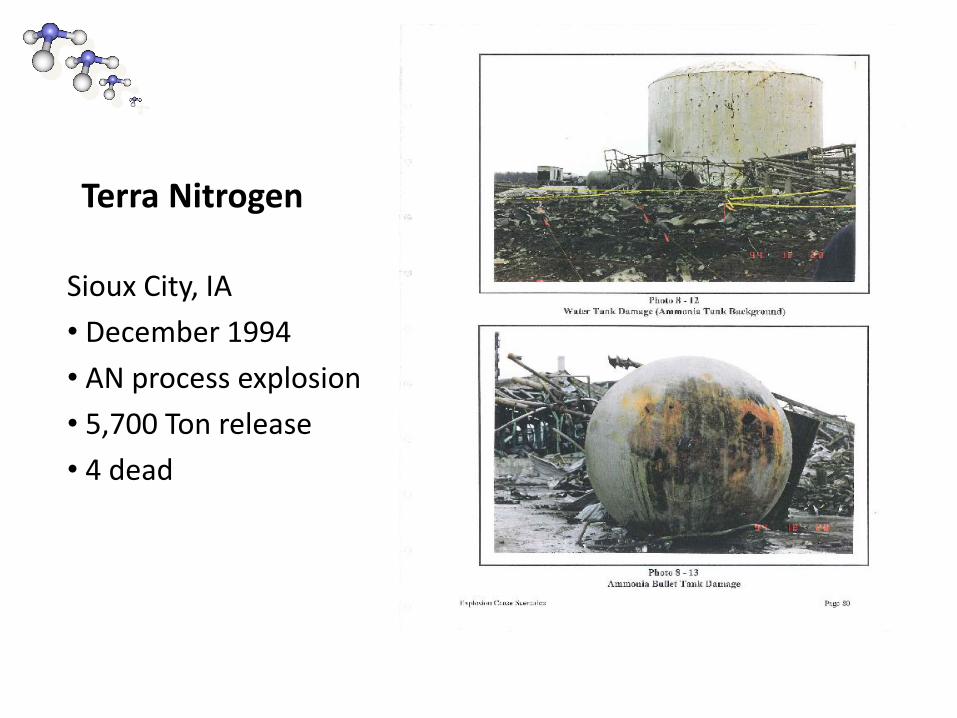
Terra Nitrogen
Sioux City, IA
• December 1994
• AN process explosion
• 5,700 Ton release
• 4 dead
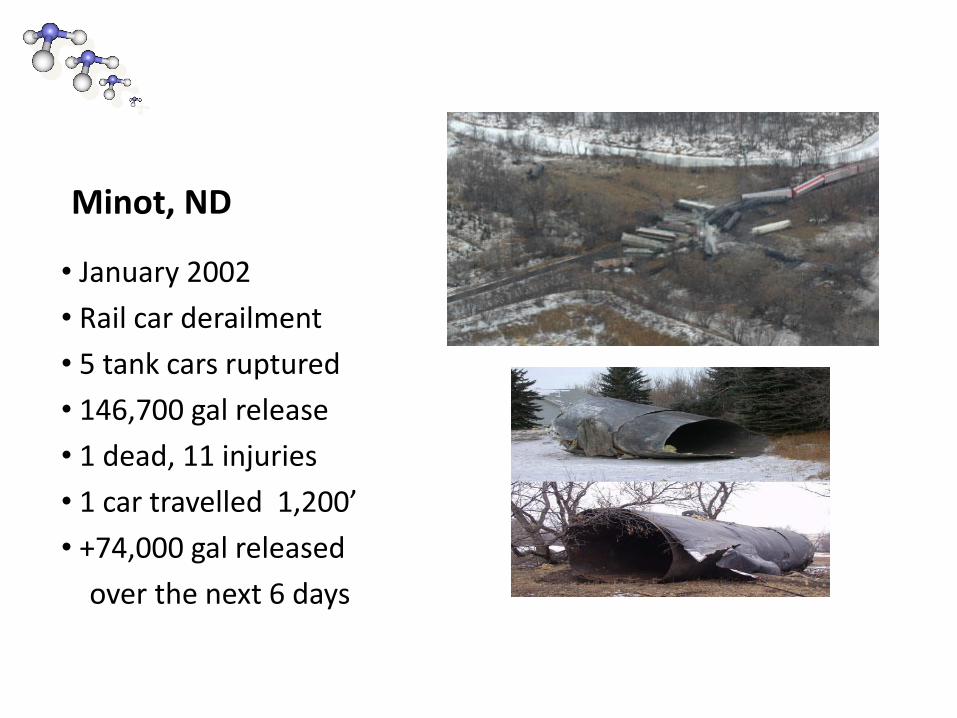
Minot, ND
• January 2002
• Rail car derailment
• 5 tank cars ruptured
• 146,700 gal release
• 1 dead, 11 injuries
• 1 car travelled 1,200’
• +74,000 gal released
over the next 6 days
2009 was a bad year for ammonia accidents!
• 5-13-2009, American Cold Storage, Louisville, KT (ammonia refrigeration) – 2 worker fatalities
• 6-20-2009, Mountaire Farms’, Lumber Bridge, NC (ammonia refrigeration) – 1 worker fatality
• 7-15-2009, Tanner Industries, Swansea, SC (transportation) – 1 public fatality
• 11-16-2009, CF Industries, Rosemont, MN (transportation) – 2 driver fatalities
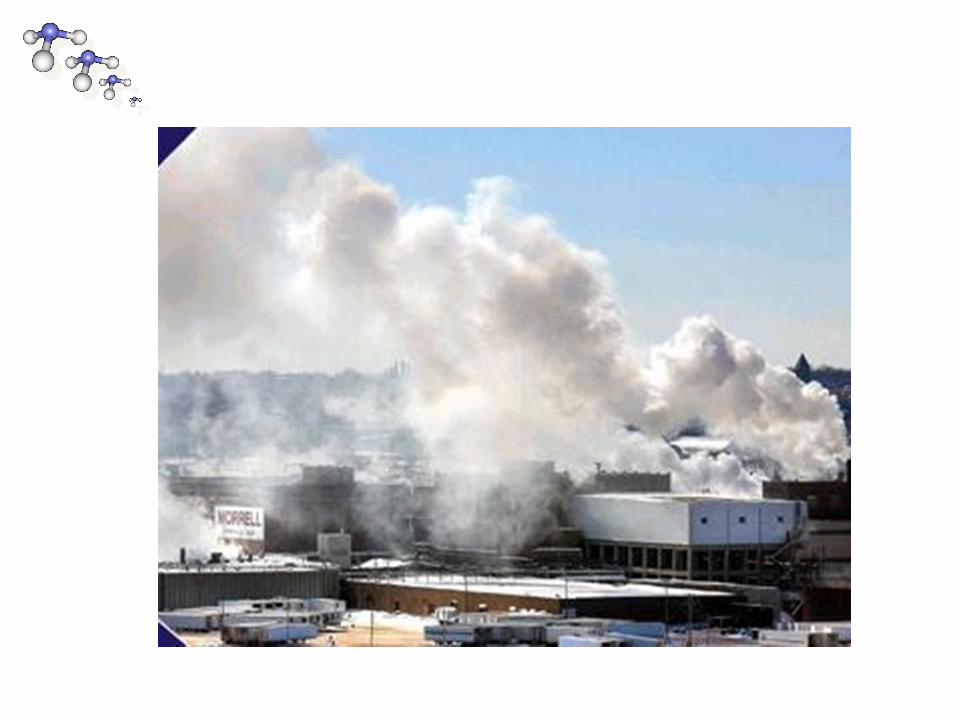
Ammonia Refrigeration Accidents
Recent examples
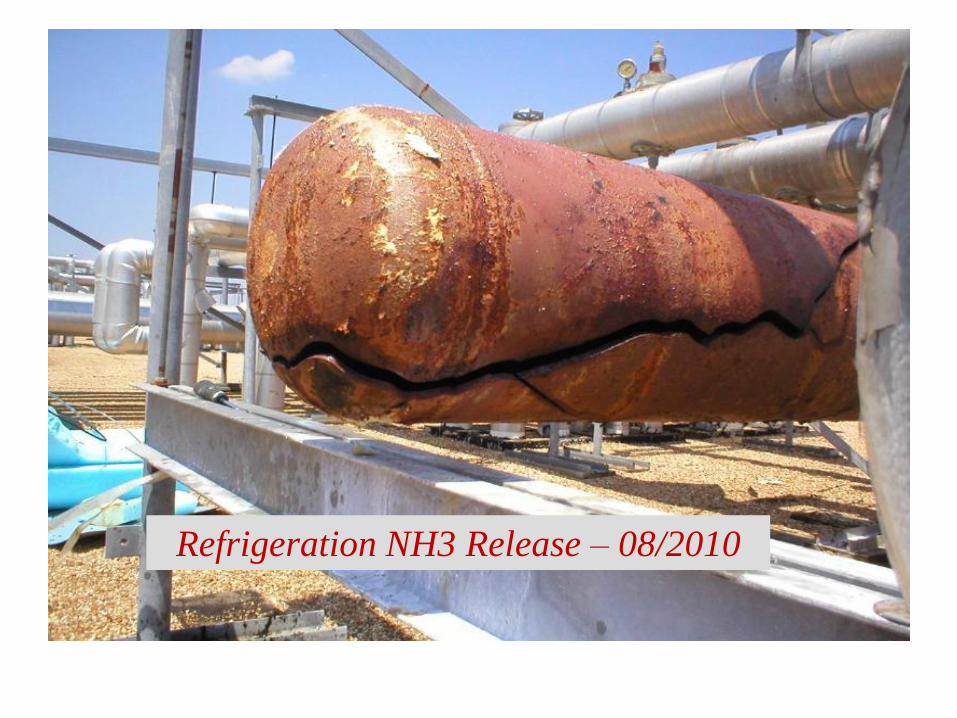
Refrigeration NH3 Release – 08/2010
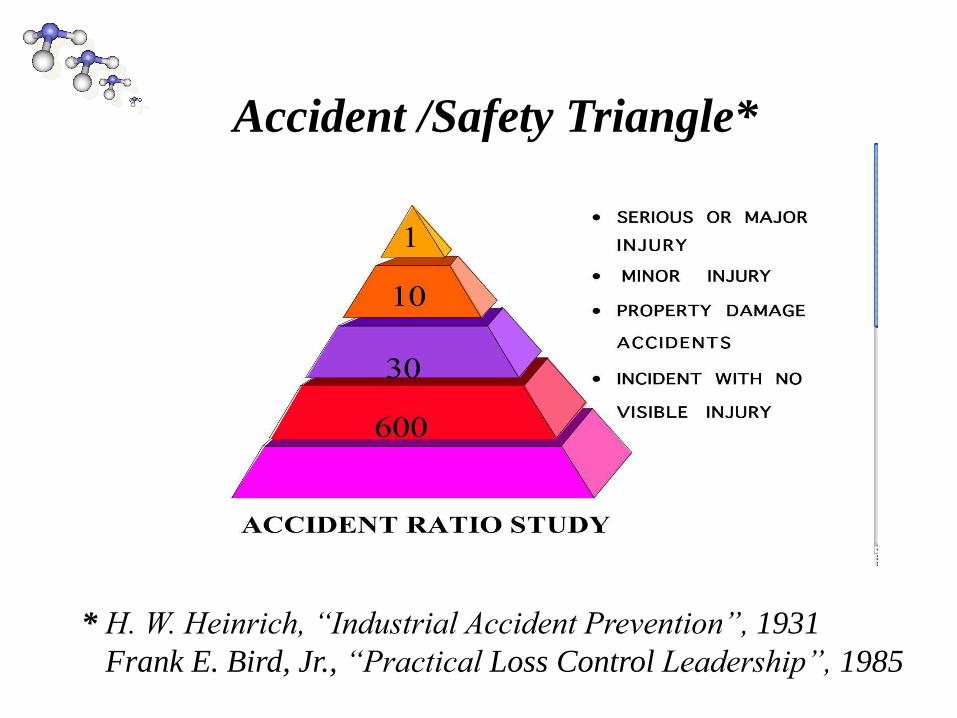
Accident /Safety Triangle*
* H. W. Heinrich, “Industrial Accident Prevention”, 1931
Frank E. Bird, Jr., “Practical Loss Control Leadership”, 1985
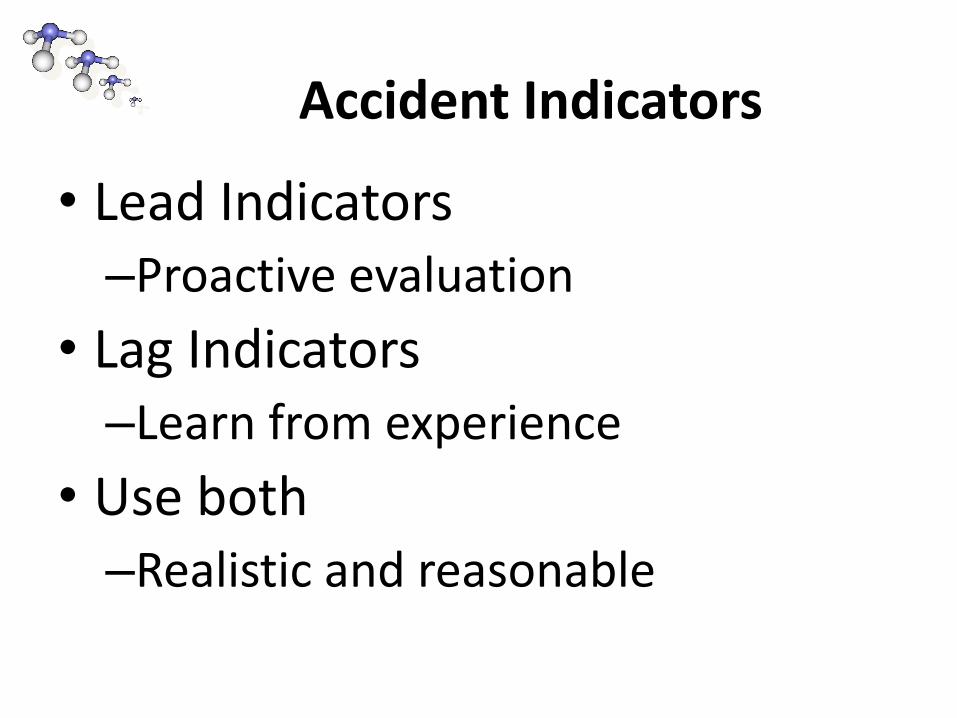
Accident Indicators
• Lead Indicators –Proactive evaluation
• Lag Indicators –Learn from experience
• Use both –Realistic and reasonable
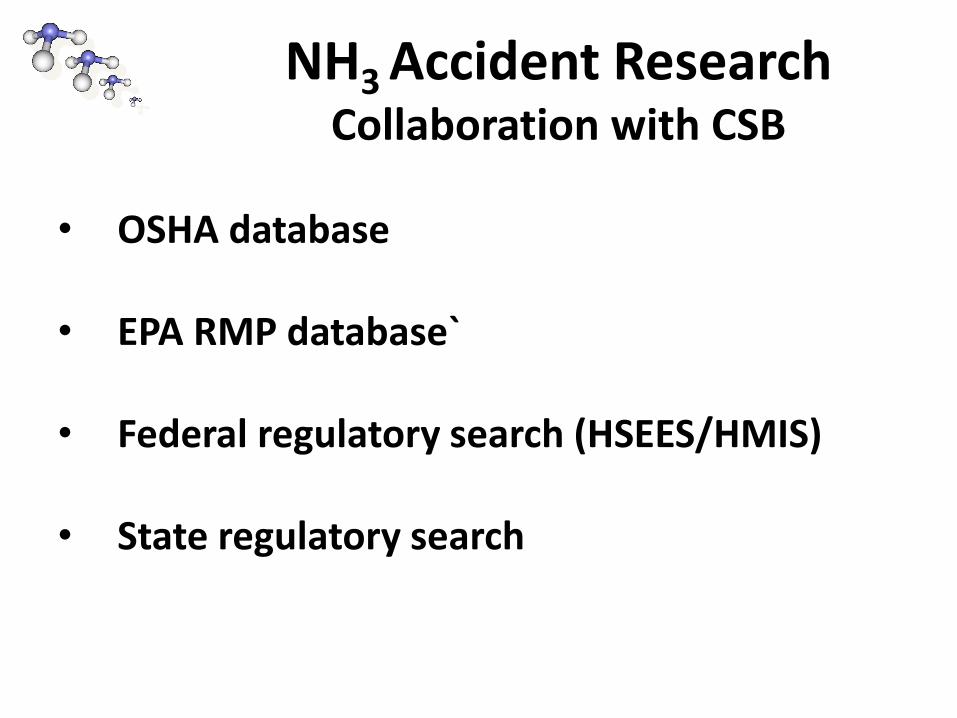
NH3 Accident Research
Collaboration with CSB
• OSHA database • EPA RMP database` • Federal regulatory search (HSEES/HMIS)
• State regulatory search
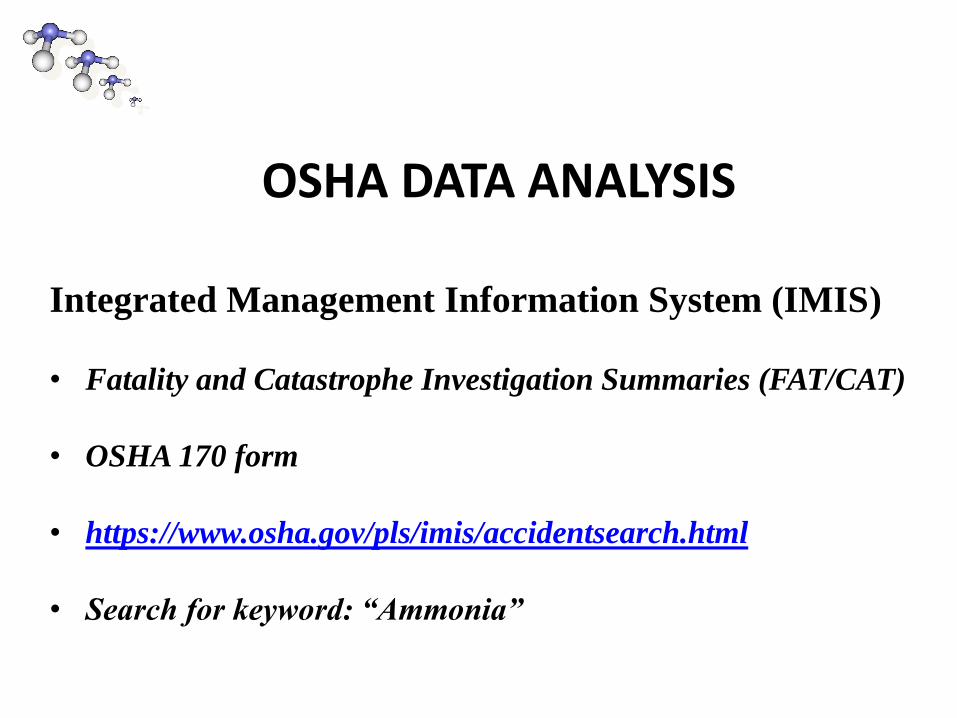
OSHA DATA ANALYSIS
Integrated Management Information System (IMIS)
• Fatality and Catastrophe Investigation Summaries (FAT/CAT)
• OSHA 170 form
• https://www.osha.gov/pls/imis/accidentsearch.html
• Search for keyword: “Ammonia”
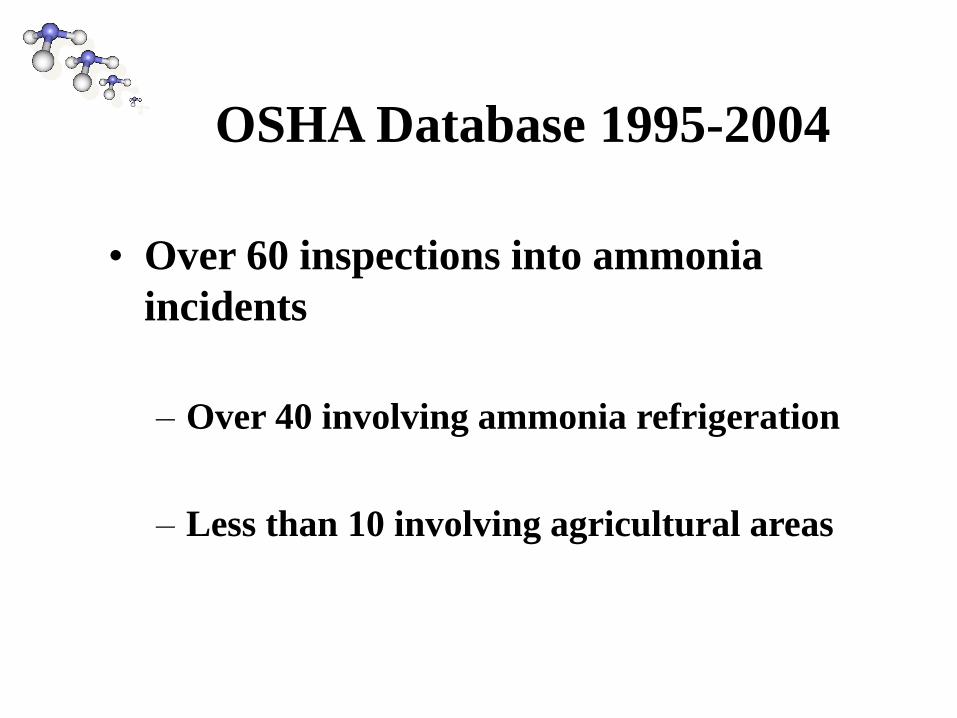
OSHA Database 1995-2004
• Over 60 inspections into ammonia
incidents
– Over 40 involving ammonia refrigeration
– Less than 10 involving agricultural areas
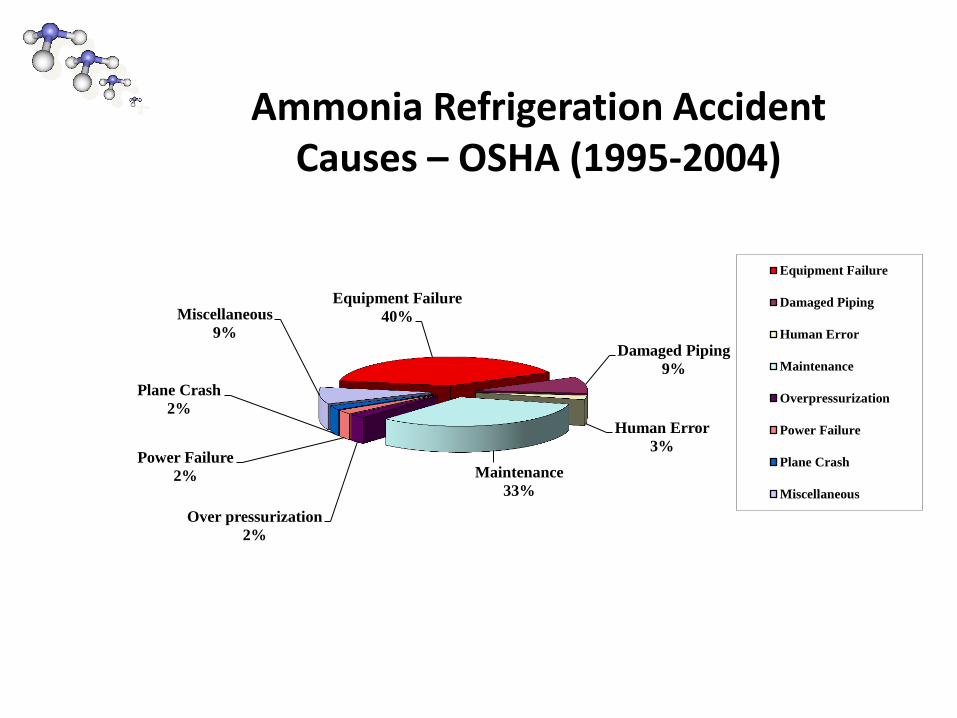
Ammonia Refrigeration Accident Causes – OSHA (1995-2004)
Equipment Failure
40%
Damaged Piping
9%
Human Error
3%
Maintenance
33%
Over pressurization
2%
Power Failure
2%
Plane Crash
2%
Miscellaneous
9%
Equipment Failure
Damaged Piping
Human Error
Maintenance
Overpressurization
Power Failure
Plane Crash
Miscellaneous
“Top 10” PSM Citations
• Operating Procedures, F(1) - Written procedures
• PHA, E(1) - Appropriate PHA/prioritization
• Mechanical Integrity, J(2) - Written procedures
• Training, G(1) - Initial training
• Contractors, H(2) - Contractor evaluations
• Employee Participation, C(1) - Participation plan
• Process Safety Information, D(3) - Equipment info
• Management of Change, L(1) - Written procedures
• Mechanical Integrity, J(4) - Inspection/testing
• Process Safety Information, D(2) - Technical info
RMP DATA ANALYSIS
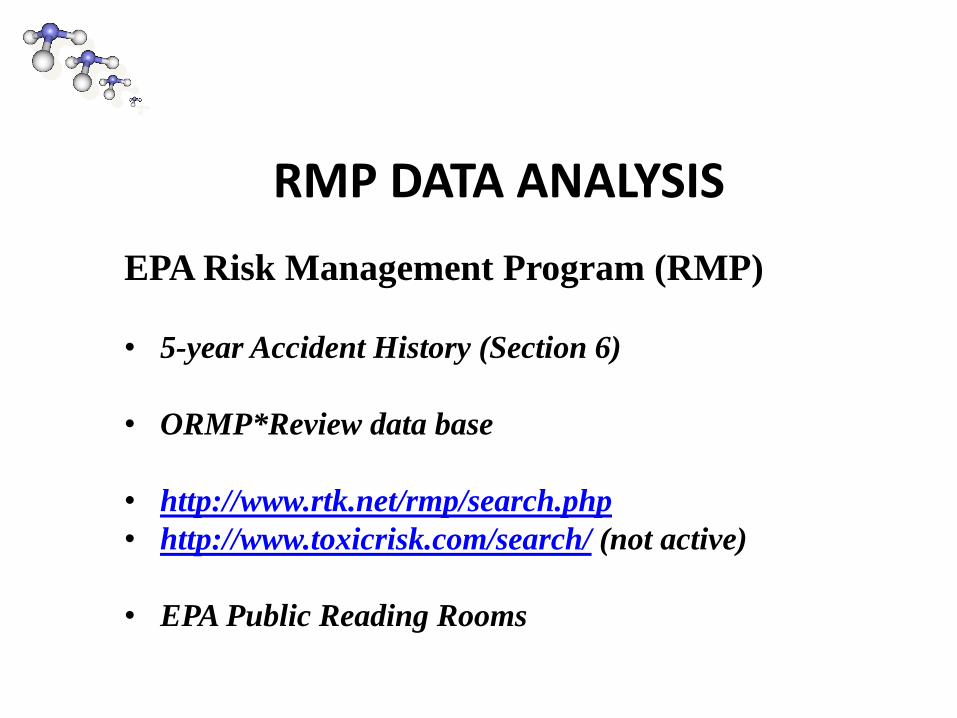
RMP DATA ANALYSIS
EPA Risk Management Program (RMP)
• 5-year Accident History (Section 6)
• ORMP*Review data base
• http://www.rtk.net/rmp/search.php
• http://www.toxicrisk.com/search/ (not active)
• EPA Public Reading Rooms
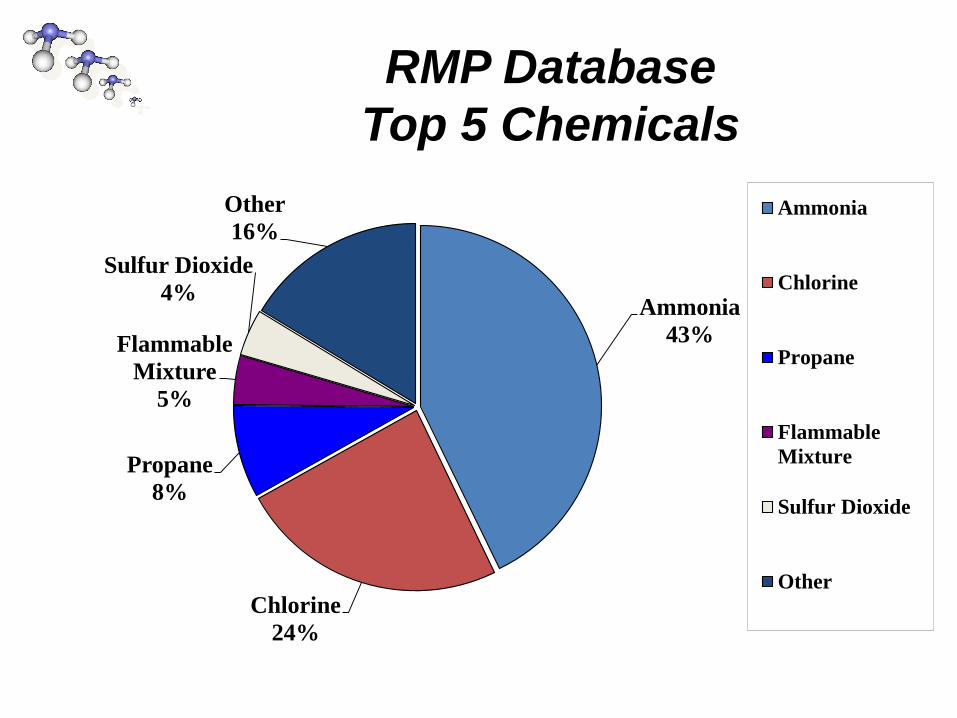
Ammonia
43%
Chlorine
24%
Propane
8%
Flammable
Mixture
5%
Sulfur Dioxide
4%
Other
16% Ammonia
Chlorine
Propane
Flammable
Mixture
Sulfur Dioxide
Other
RMP Database
Top 5 Chemicals
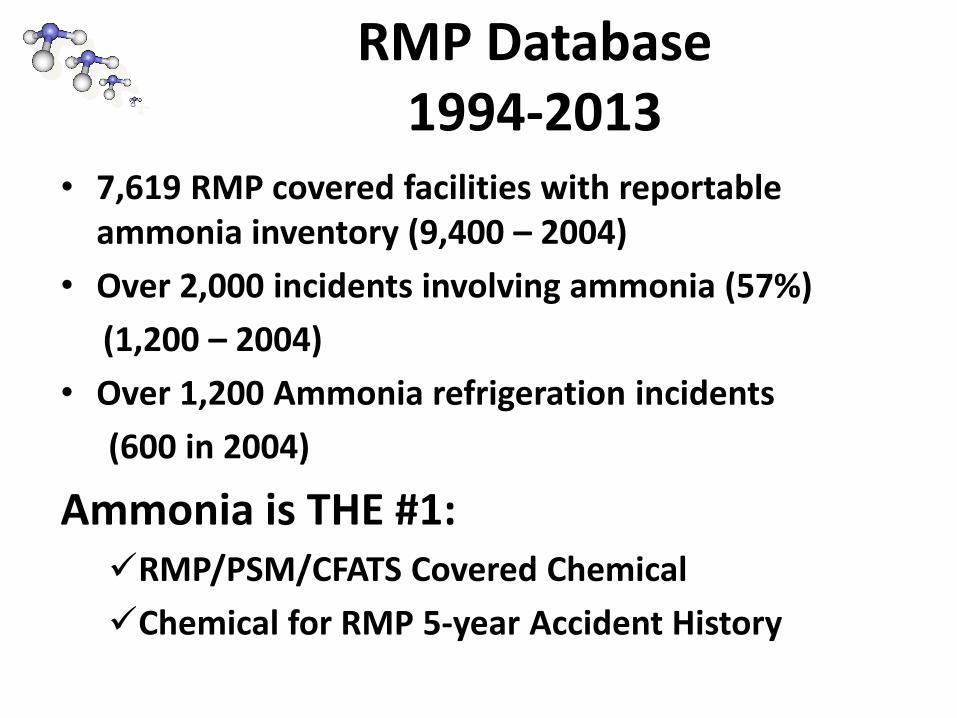
RMP Database 1994-2013
• 7,619 RMP covered facilities with reportable ammonia inventory (9,400 – 2004)
• Over 2,000 incidents involving ammonia (57%)
(1,200 – 2004)
• Over 1,200 Ammonia refrigeration incidents
(600 in 2004)
Ammonia is THE #1: RMP/PSM/CFATS Covered Chemical
Chemical for RMP 5-year Accident History
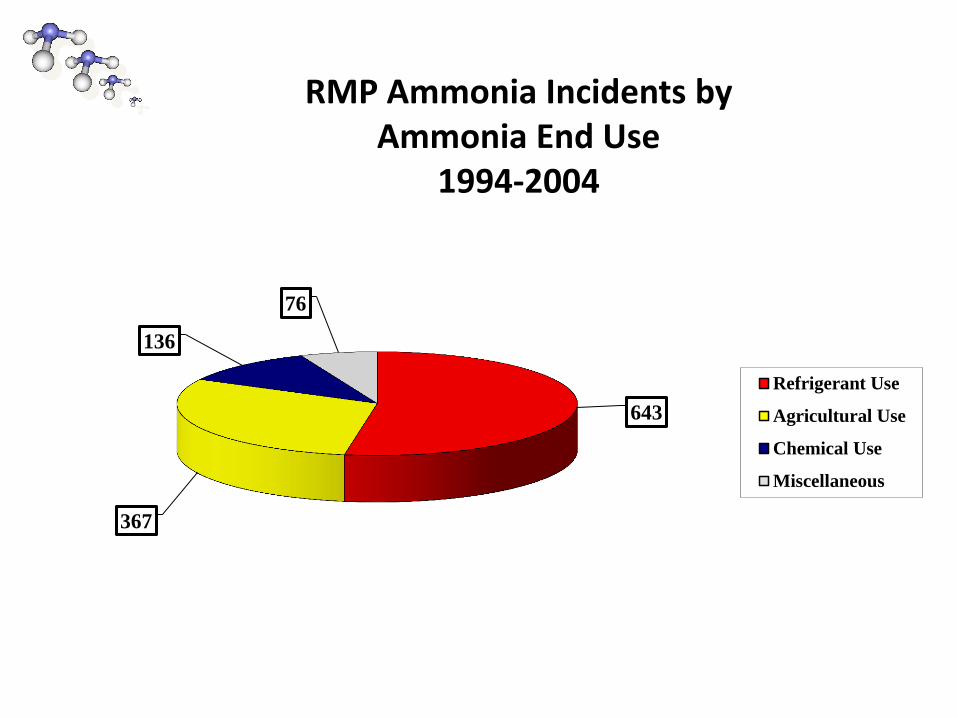
RMP Ammonia Incidents by Ammonia End Use
1994-2004
643
367
136
76
Refrigerant Use
Agricultural Use
Chemical Use
Miscellaneous
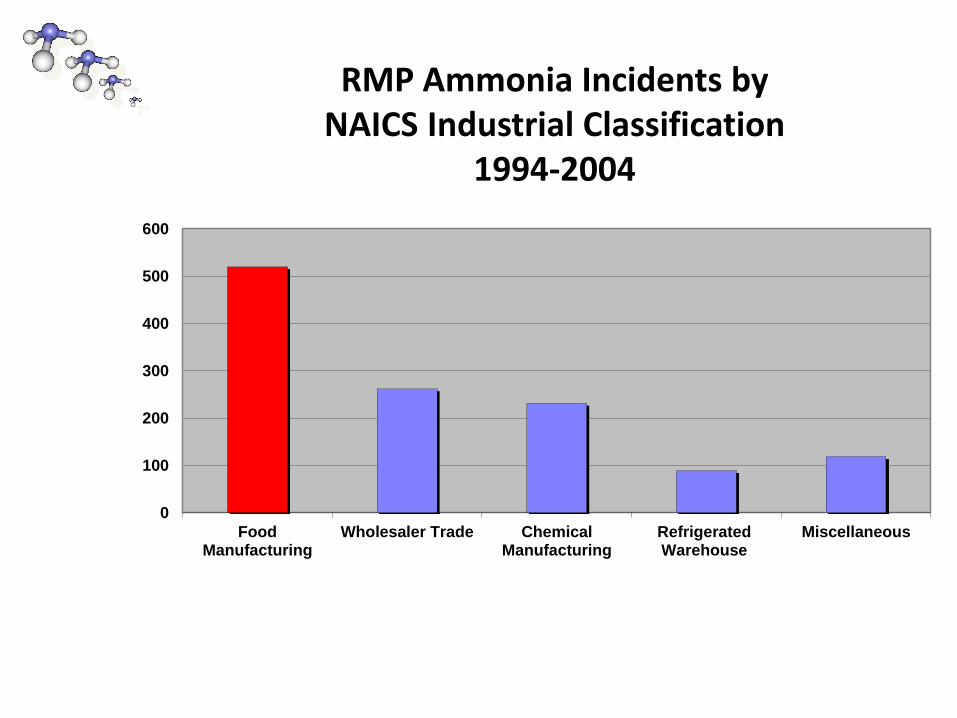
RMP Ammonia Incidents by NAICS Industrial Classification
1994-2004
0
100
200
300
400
500
600
FoodManufacturing
Wholesaler Trade ChemicalManufacturing
RefrigeratedWarehouse
Miscellaneous
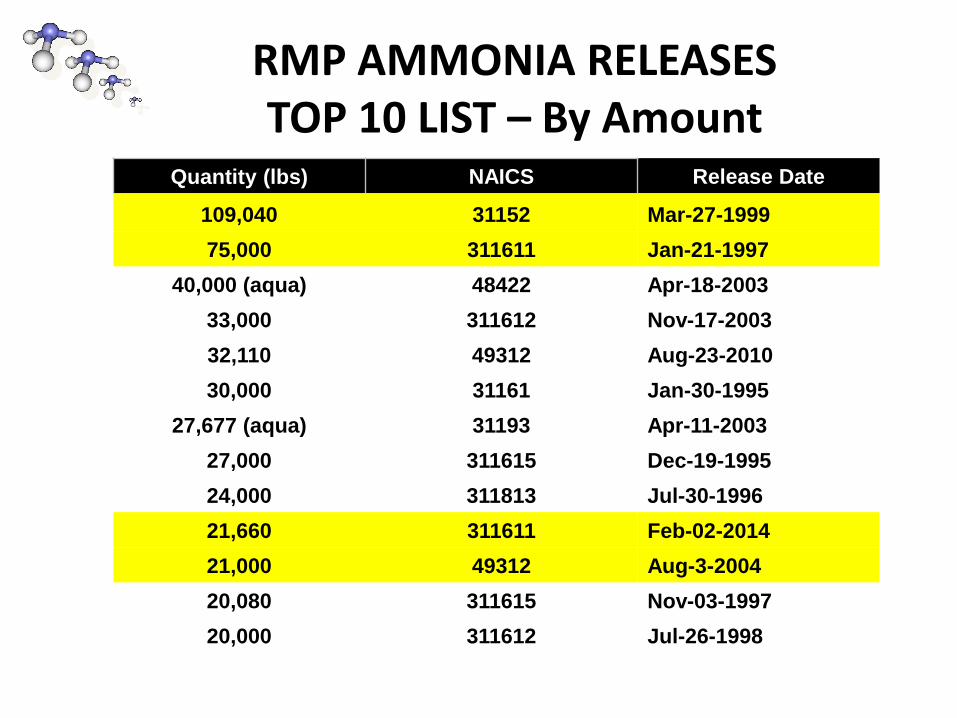
RMP AMMONIA RELEASES TOP 10 LIST – By Amount
Quantity (lbs) NAICS Release Date
109,040 31152 Mar-27-1999
75,000 311611 Jan-21-1997
40,000 (aqua) 48422 Apr-18-2003
33,000 311612 Nov-17-2003
32,110 49312 Aug-23-2010
30,000 31161 Jan-30-1995
27,677 (aqua) 31193 Apr-11-2003
27,000 311615 Dec-19-1995
24,000 311813 Jul-30-1996
21,660 311611 Feb-02-2014
21,000 49312 Aug-3-2004
20,080 311615 Nov-03-1997
20,000 311612 Jul-26-1998
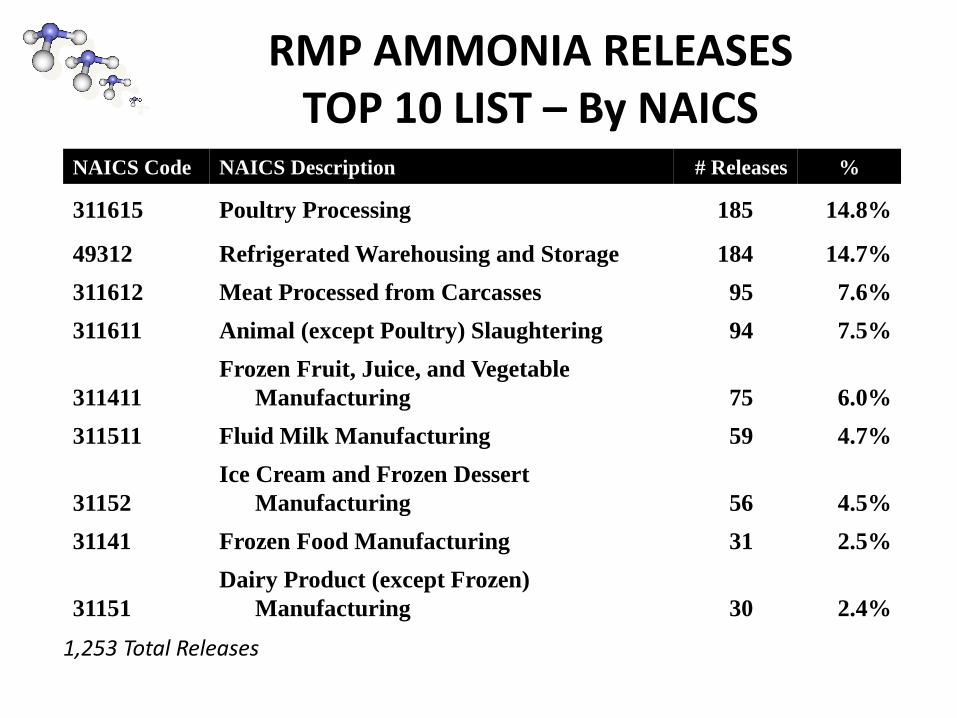
RMP AMMONIA RELEASES TOP 10 LIST – By NAICS
NAICS Code NAICS Description # Releases %
311615 Poultry Processing 185 14.8%
49312 Refrigerated Warehousing and Storage 184 14.7%
311612 Meat Processed from Carcasses 95 7.6%
311611 Animal (except Poultry) Slaughtering 94 7.5%
311411
Frozen Fruit, Juice, and Vegetable
Manufacturing 75 6.0%
311511 Fluid Milk Manufacturing 59 4.7%
31152
Ice Cream and Frozen Dessert
Manufacturing 56 4.5%
31141 Frozen Food Manufacturing 31 2.5%
31151
Dairy Product (except Frozen)
Manufacturing 30 2.4%
1,253 Total Releases
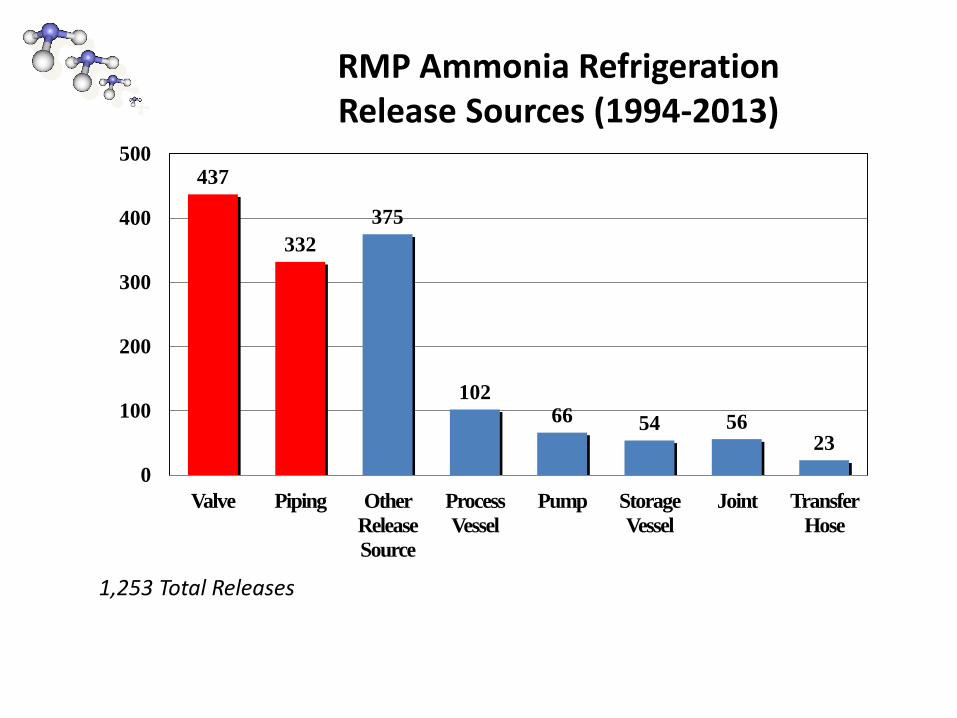
RMP Ammonia Refrigeration Release Sources (1994-2013)
1,253 Total Releases
437
332
375
102 66 54 56
23
0
100
200
300
400
500
Valve Piping Other
Release
Source
Process
Vessel
Pump Storage
Vessel
Joint Transfer
Hose
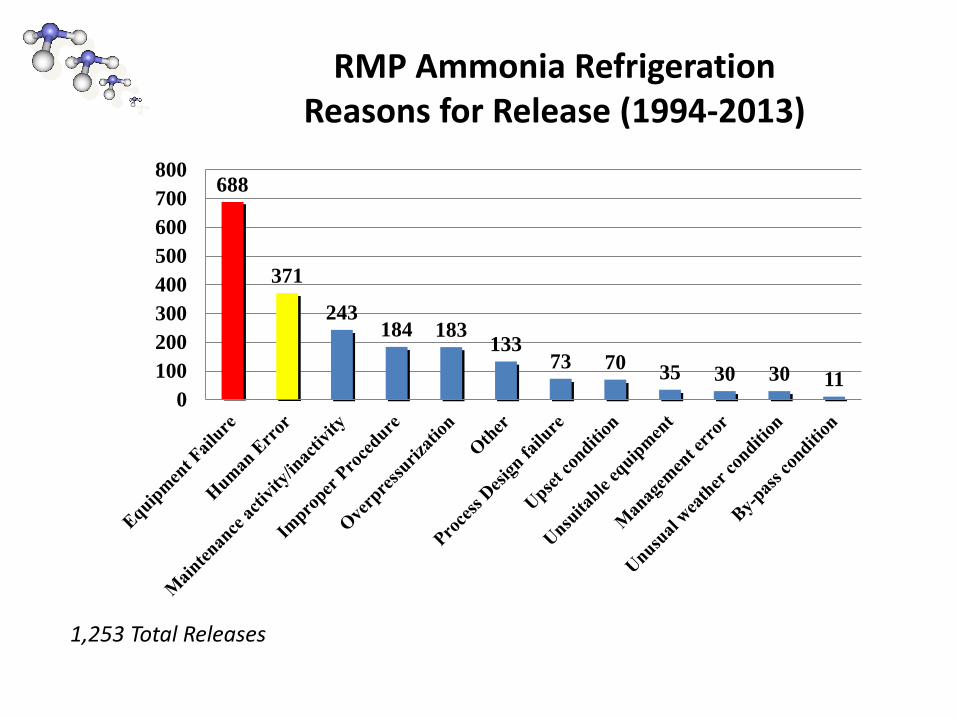
RMP Ammonia Refrigeration Reasons for Release (1994-2013)
688
371
243 184 183
133 73 70
35 30 30 11 0
100
200
300
400
500
600
700
800
1,253 Total Releases
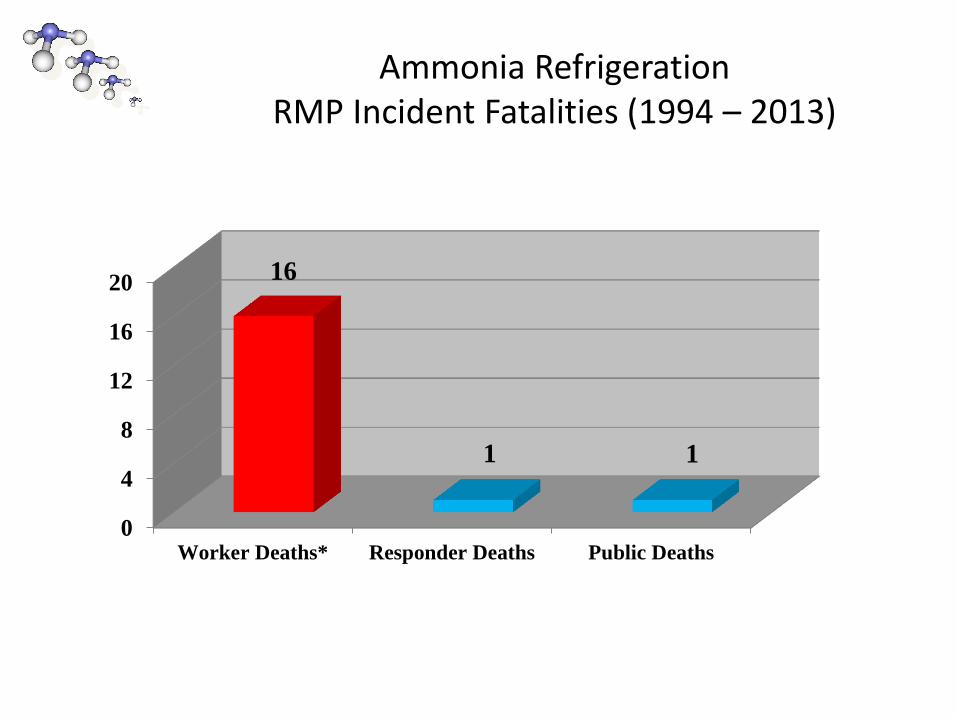
Ammonia Refrigeration RMP Incident Fatalities (1994 – 2013)
0
4
8
12
16
20
Worker Deaths* Responder Deaths Public Deaths
16
1 1
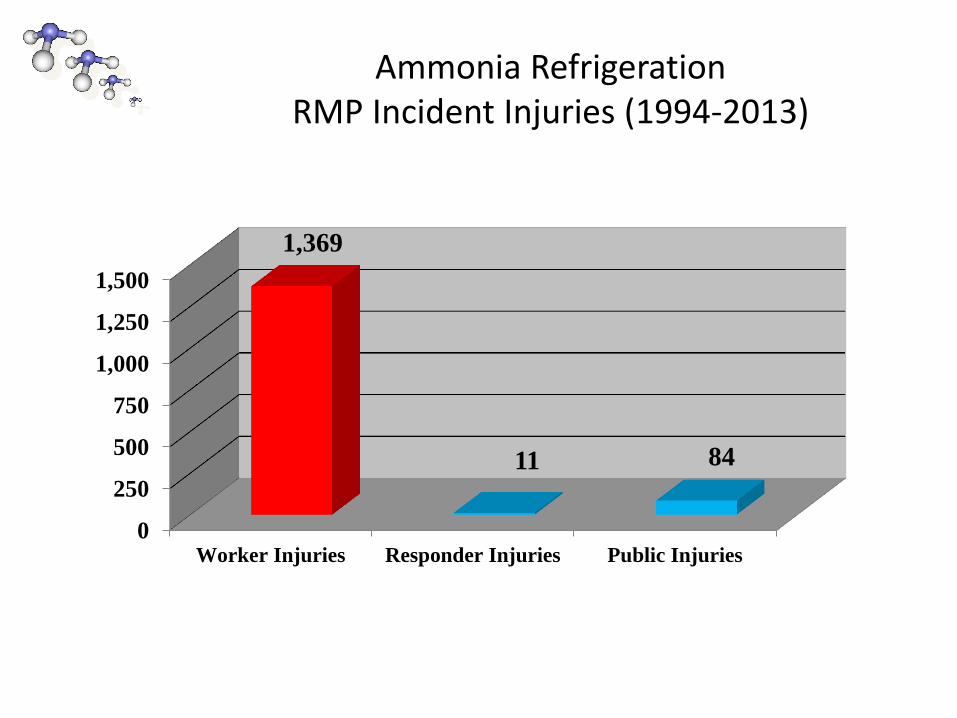
Ammonia Refrigeration RMP Incident Injuries (1994-2013)
0
250
500
750
1,000
1,250
1,500
Worker Injuries Responder Injuries Public Injuries
1,369
11 84
0
1000
2000
3000
4000
5000
6000
7000
8000
9000
10000
0 1000 2000 3000 4000 5000 6000 7000
Co
nc
en
tra
tio
n (
pp
m)
Distance from source (yards)
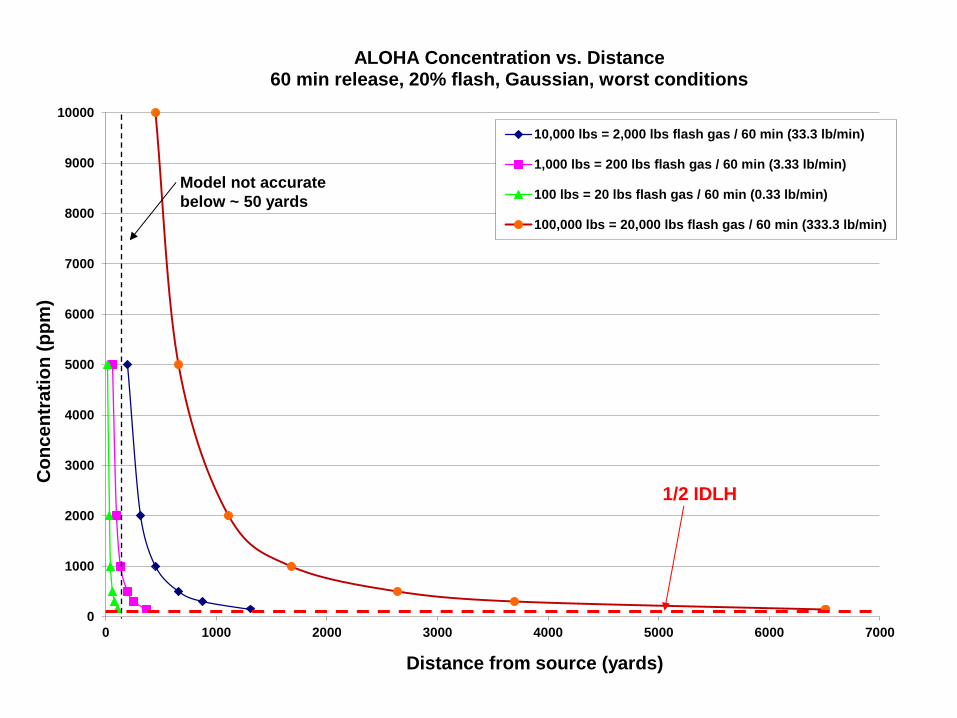
ALOHA Concentration vs. Distance 60 min release, 20% flash, Gaussian, worst conditions
10,000 lbs = 2,000 lbs flash gas / 60 min (33.3 lb/min)
1,000 lbs = 200 lbs flash gas / 60 min (3.33 lb/min)
100 lbs = 20 lbs flash gas / 60 min (0.33 lb/min)
100,000 lbs = 20,000 lbs flash gas / 60 min (333.3 lb/min)
1/2 IDLH
Model not accurate
below ~ 50 yards
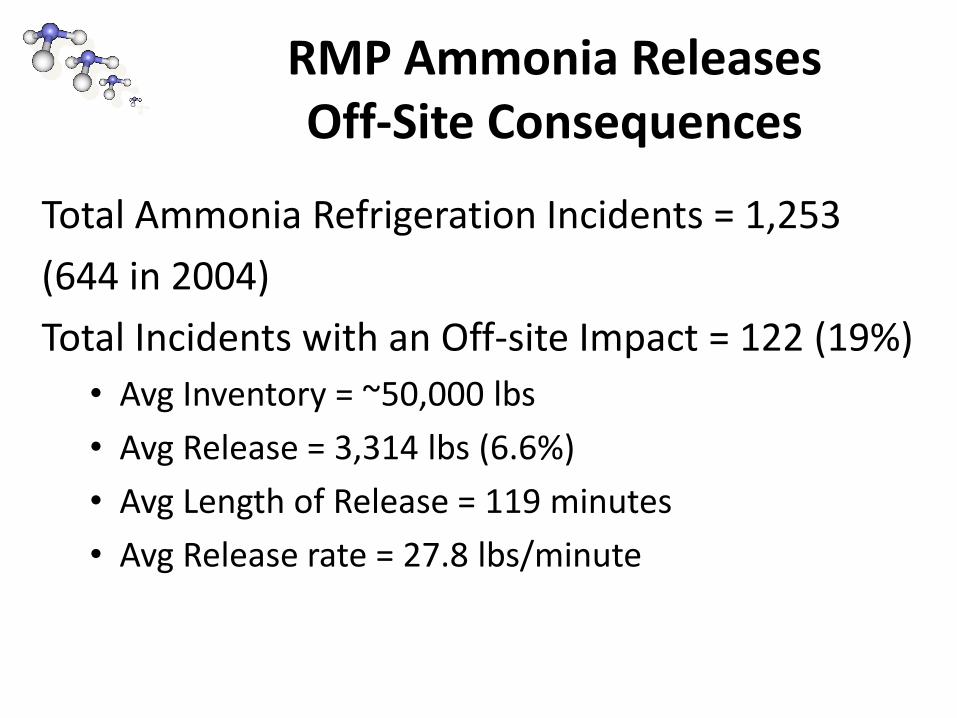
RMP Ammonia Releases Off-Site Consequences
Total Ammonia Refrigeration Incidents = 1,253
(644 in 2004)
Total Incidents with an Off-site Impact = 122 (19%)
• Avg Inventory = ~50,000 lbs
• Avg Release = 3,314 lbs (6.6%)
• Avg Length of Release = 119 minutes
• Avg Release rate = 27.8 lbs/minute
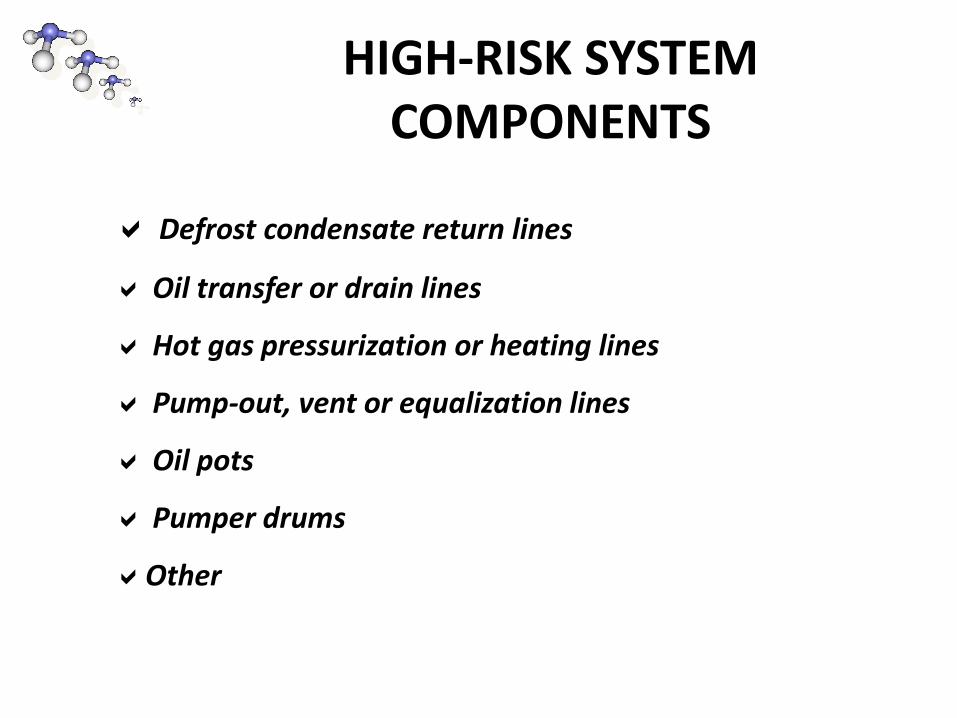
HIGH-RISK SYSTEM COMPONENTS
Defrost condensate return lines
Oil transfer or drain lines
Hot gas pressurization or heating lines
Pump-out, vent or equalization lines
Oil pots
Pumper drums
Other

SOME COMPARISONS
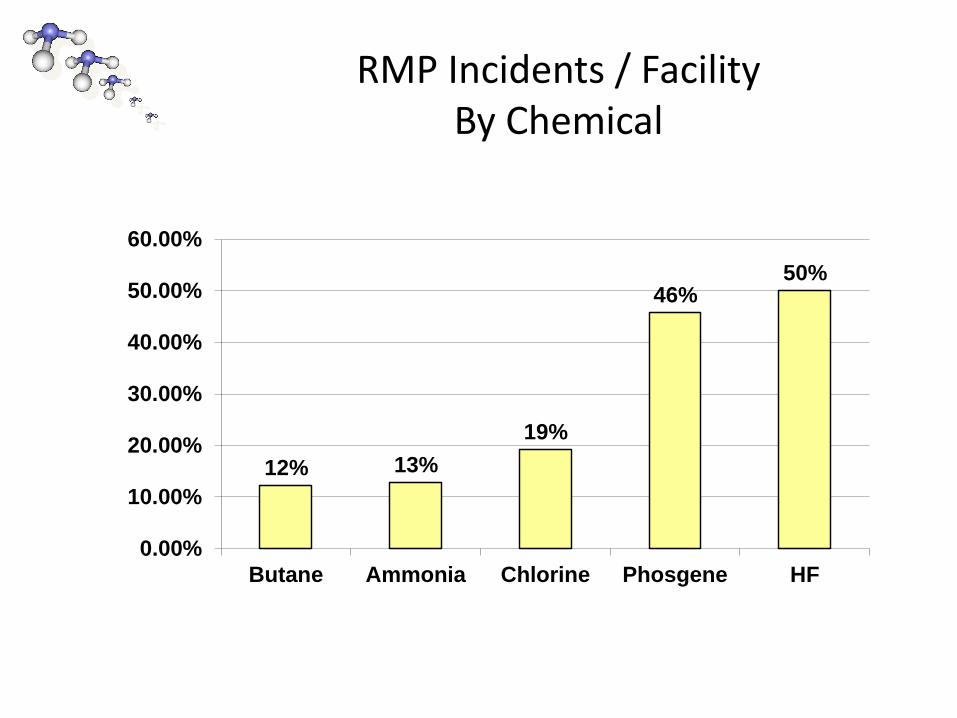
RMP Incidents / Facility By Chemical
12% 13%
19%
46% 50%
0.00%
10.00%
20.00%
30.00%
40.00%
50.00%
60.00%
Butane Ammonia Chlorine Phosgene HF
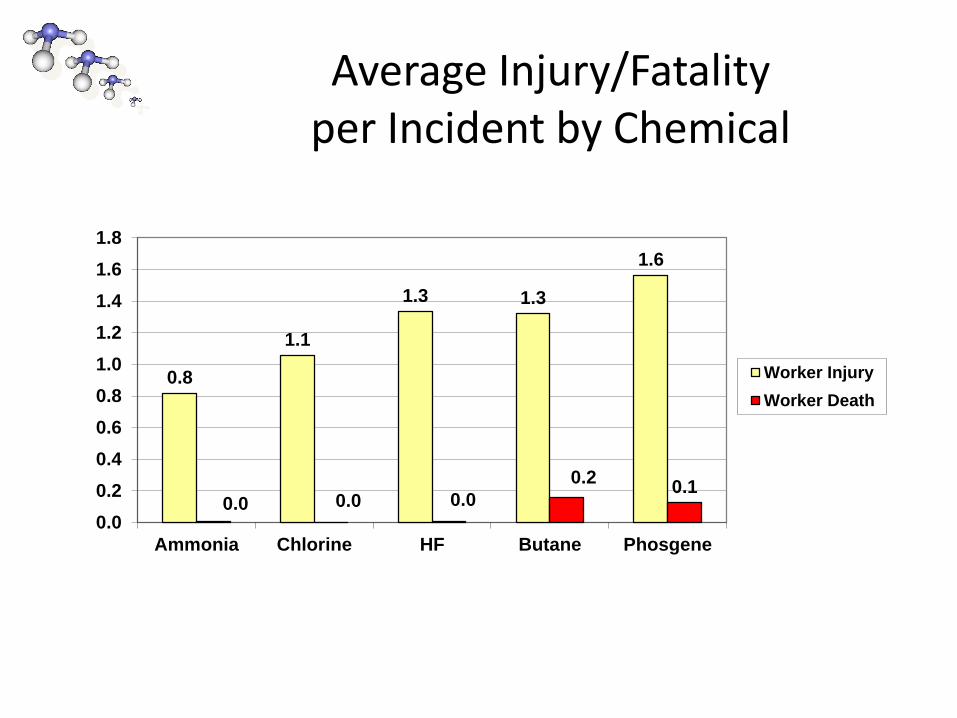
Average Injury/Fatality per Incident by Chemical
0.8
1.1
1.3 1.3
1.6
0.0 0.0 0.0
0.2 0.1
0.0
0.2
0.4
0.6
0.8
1.0
1.2
1.4
1.6
1.8
Ammonia Chlorine HF Butane Phosgene
Worker Injury
Worker Death
RMP Data Ammonia Refrigeration Incidents
1994-2013
32
69
87
95
107
70
58 52
68
57 53
61
49
84
62
71
64
47 42
22
0
20
40
60
80
100
120
1994 1996 1998 2000 2002 2004 2006 2008 2010 2012
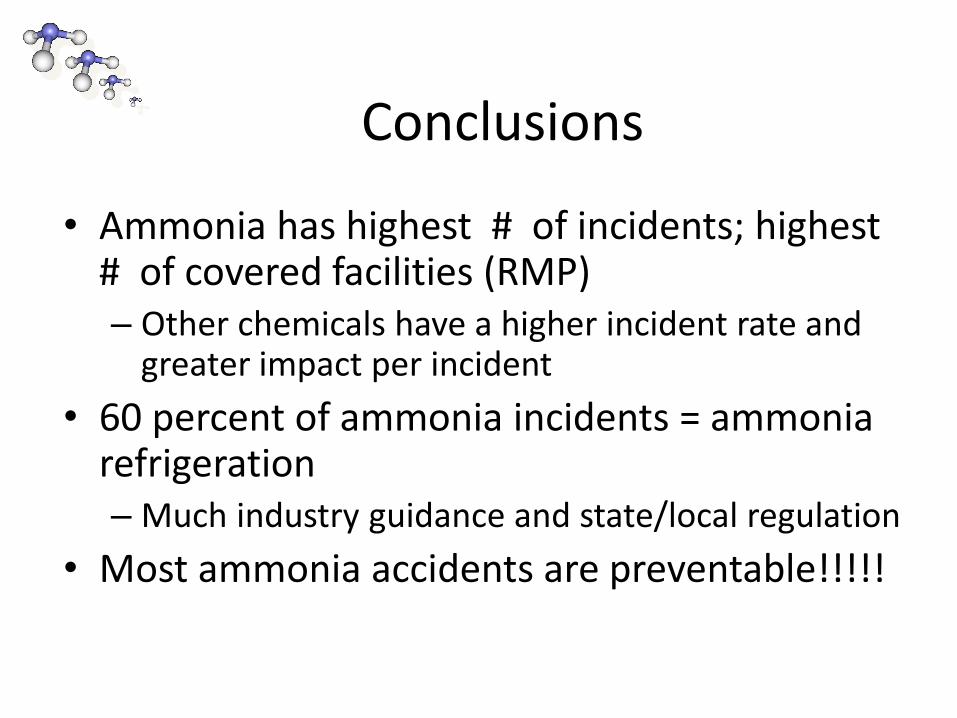
Conclusions
• Ammonia has highest # of incidents; highest # of covered facilities (RMP) – Other chemicals have a higher incident rate and
greater impact per incident
• 60 percent of ammonia incidents = ammonia refrigeration – Much industry guidance and state/local regulation
• Most ammonia accidents are preventable!!!!!


![Dnv [2001]- Frequency Analysis of Accidental Oil Releases From Fpso Operations in the Gulf of Mexico](https://img.pdfslide.net/doc/110x75/55cf994b550346d0339ca237/dnv-2001-frequency-analysis-of-accidental-oil-releases-from-fpso-operations.jpg)