Embed Size (px)
Citation preview
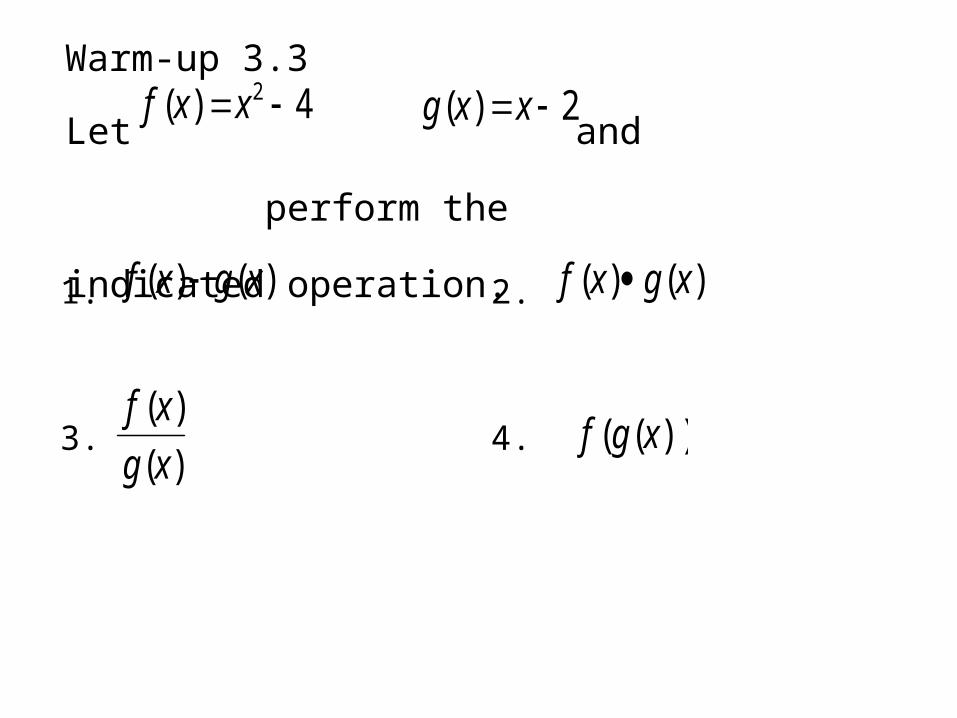
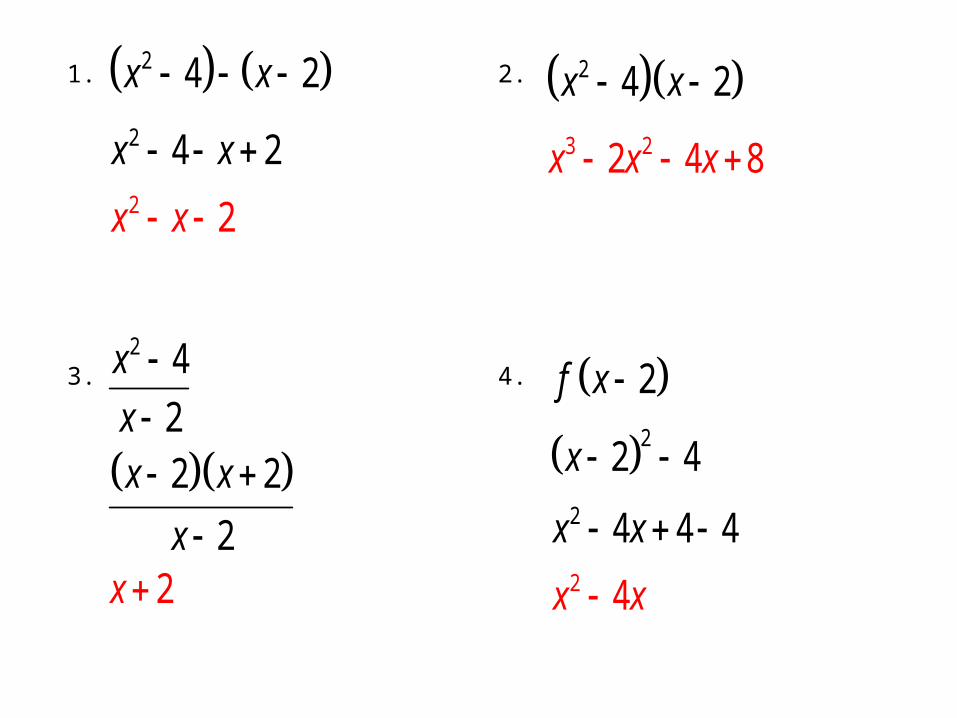
Let and perform the
indicated operation.
4)( 2 xxf 2)( xxg
1. 2.
3. 4.
)()( xgxf )()( xgxf
)(
)(
xg
xf))(( xgf
Warm-up 3.3
1. 2.
3. 4.
2
2
2
4 2
4
2
2
x x
x x
x x
3
2
2
4 2
2 4 8x x
x x
x
2 4
22 2
22
x
xx x
xx
2
2
2
2
2
4
4
4 4 4
f x
x
x x
x x
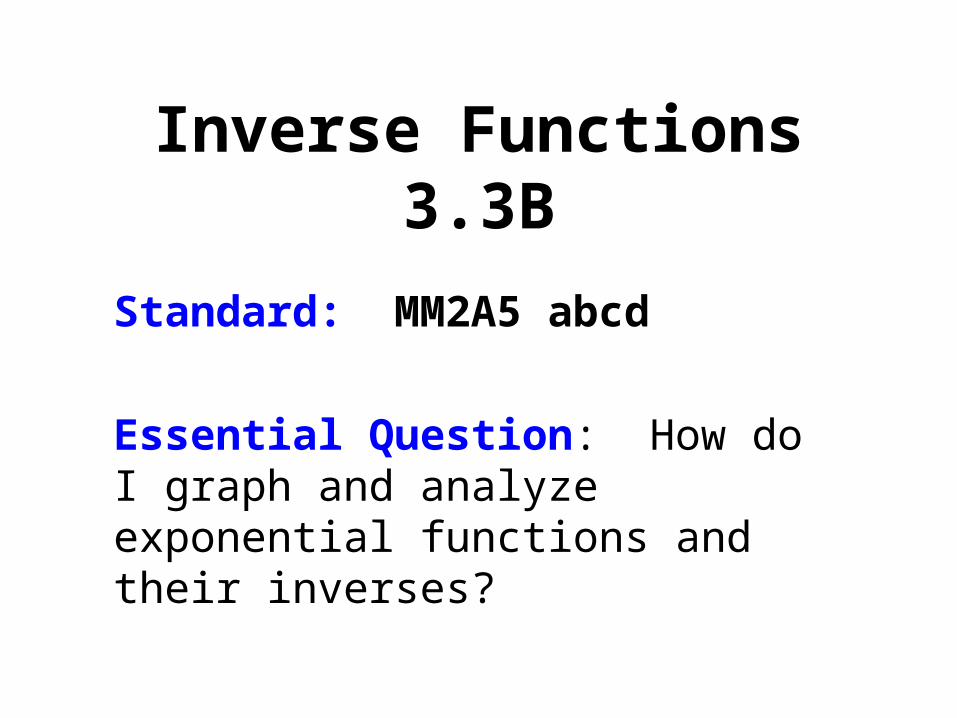
Inverse Functions3.3B
Standard: MM2A5 abcd
Essential Question: How do I graph and analyze exponential functions and their inverses?
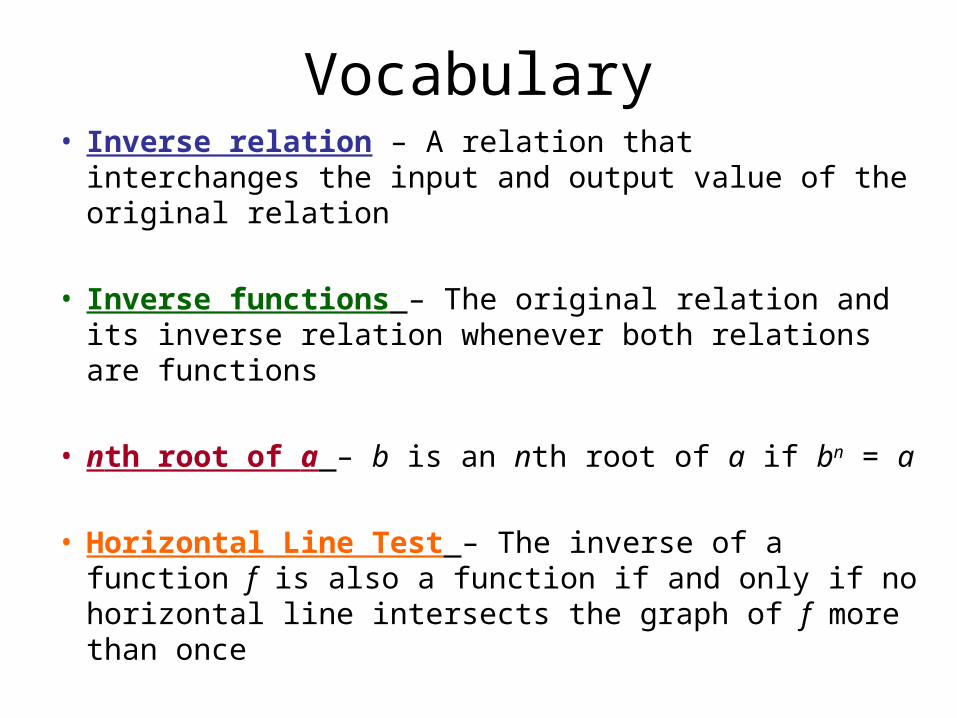
Vocabulary• Inverse relation – A relation that interchanges the
input and output value of the original relation
• Inverse functions – The original relation and its inverse relation whenever both relations are functions
• nth root of a – b is an nth root of a if bn = a
• Horizontal Line Test – The inverse of a function f is also a function if and only if no horizontal line intersects the graph of f more than once
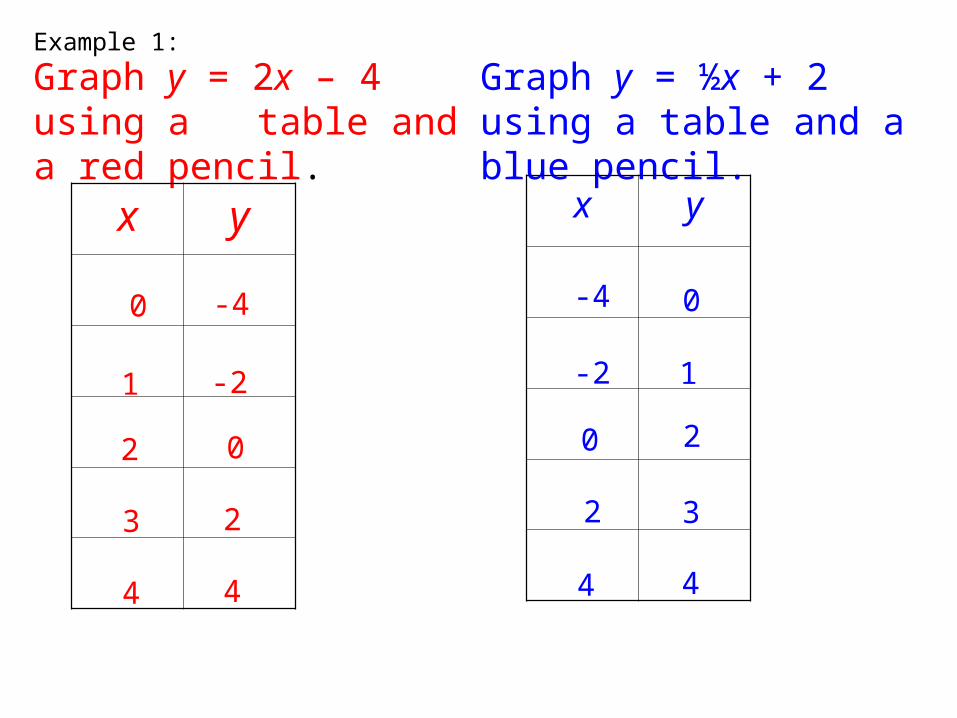
Graph y = 2x – 4 using a table and a red pencil.
Graph y = ½x + 2 using a table and a blue pencil.
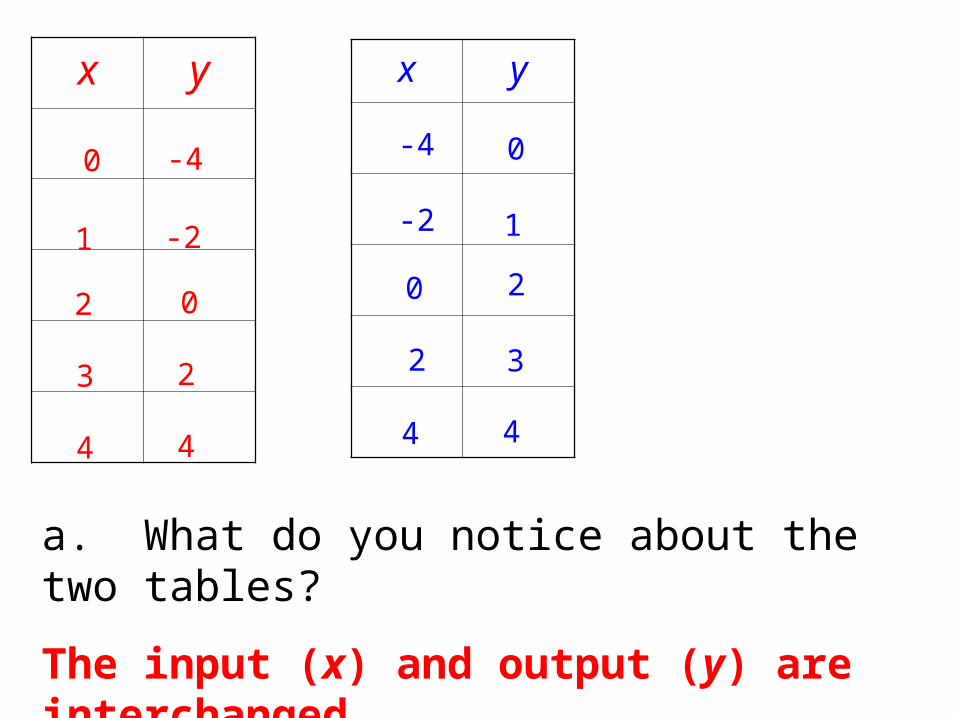
x y x y
Example 1:
0 -4
1 -2
2 0
3 2
-4 0
-2 1
0 2
2 3
4 4 4 4
-8 -6 -4 -2 2 4 6 8
8
6
4
2
-2
-4
-6
-8
x y x y
a. What do you notice about the two tables?
The input (x) and output (y) are interchanged
0 -4
1 -2
2 0
3 2
-4 0
-2 1
0 2
2 3
4 4 4 4
-8 -6 -4 -2 2 4 6 8
8
6
4
2
-2
-4
-6
-8
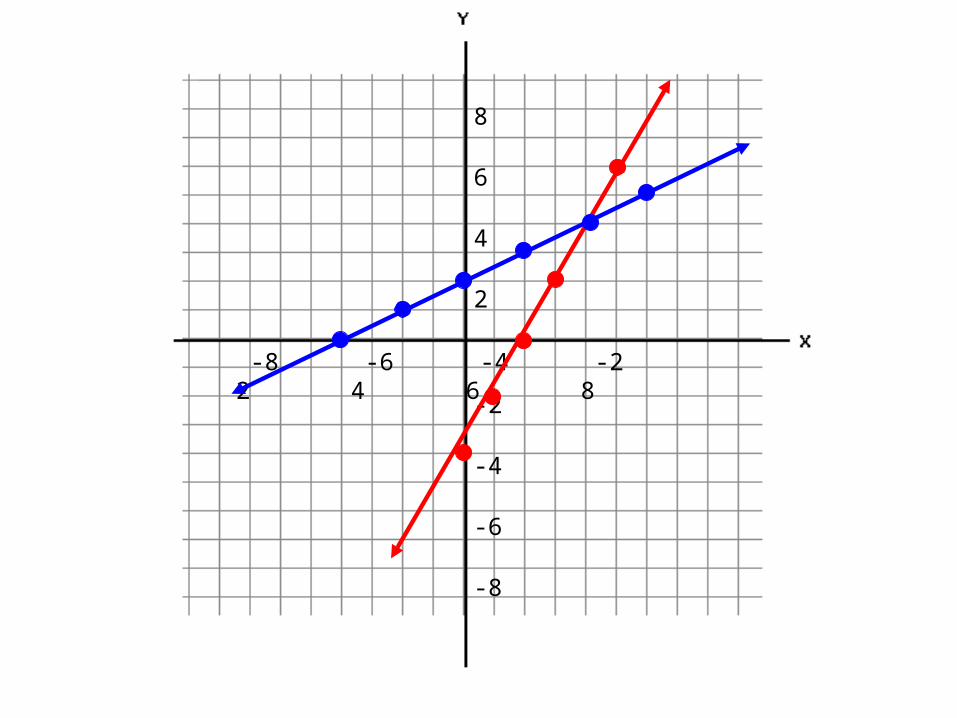
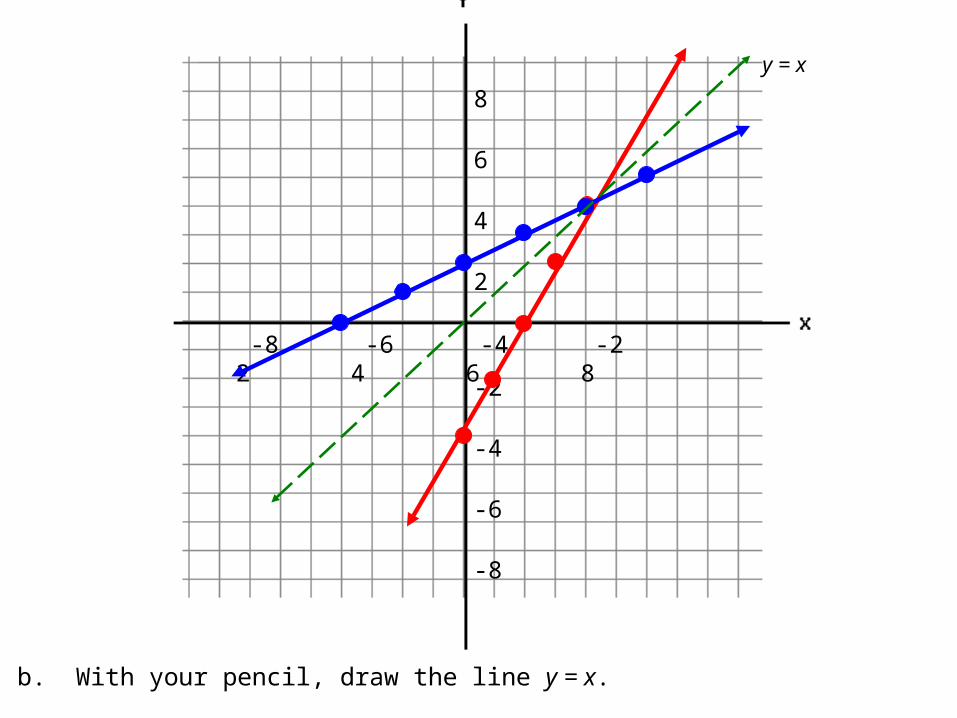
y = x
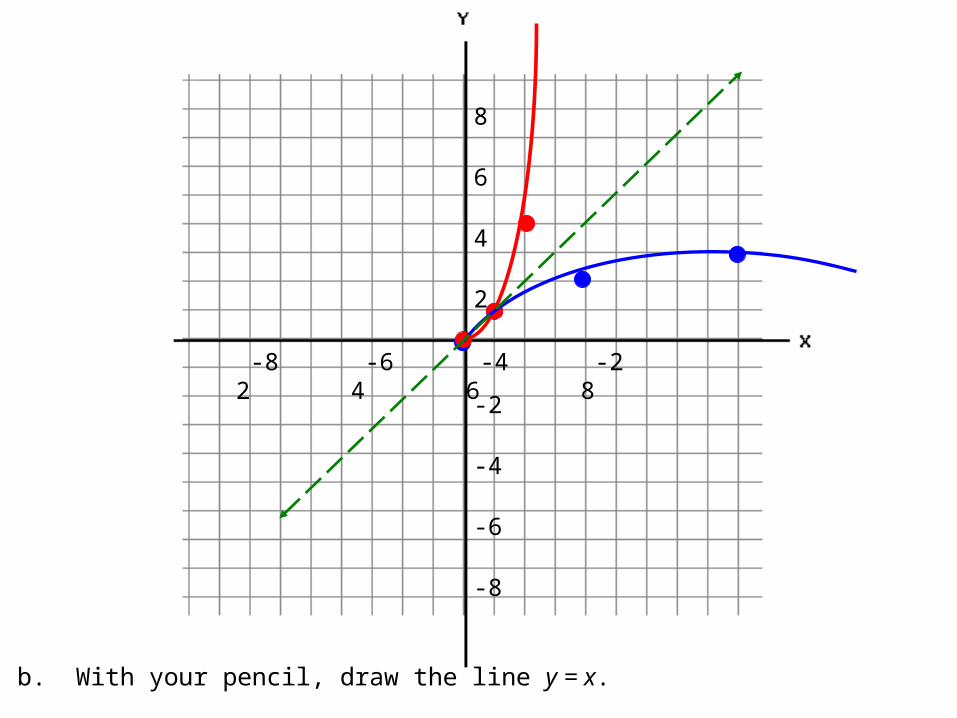
b. With your pencil, draw the line y = x.
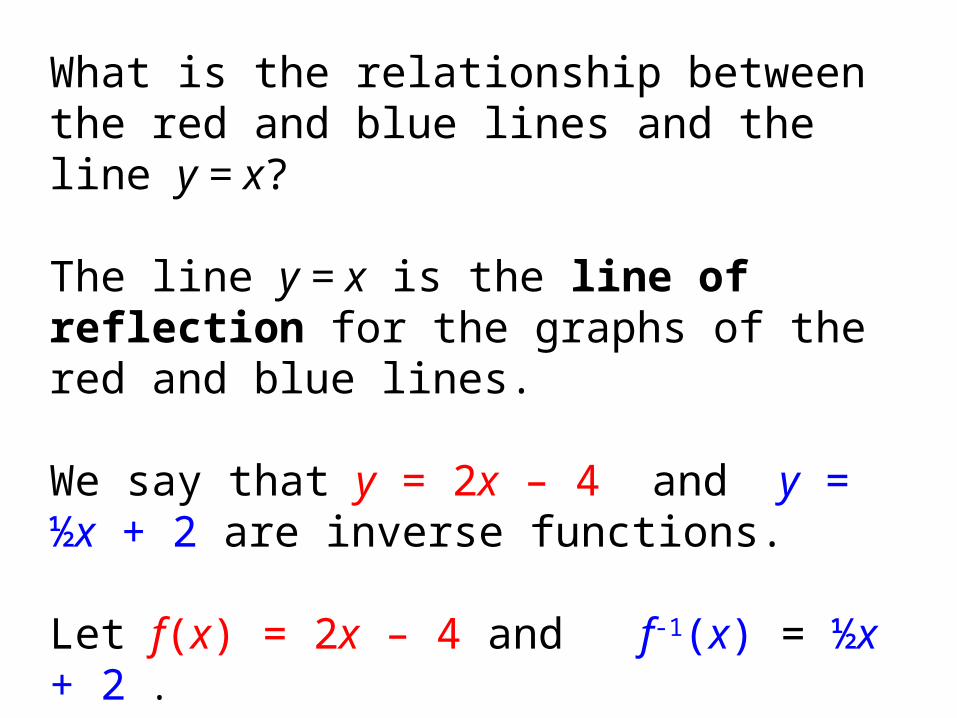
What is the relationship between the red and blue lines and the line y = x?
The line y = x is the line of reflection for the graphs of the red and blue lines.
We say that y = 2x – 4 and y = ½x + 2 are inverse functions.
Let f(x) = 2x – 4 and f-1(x) = ½x + 2 .
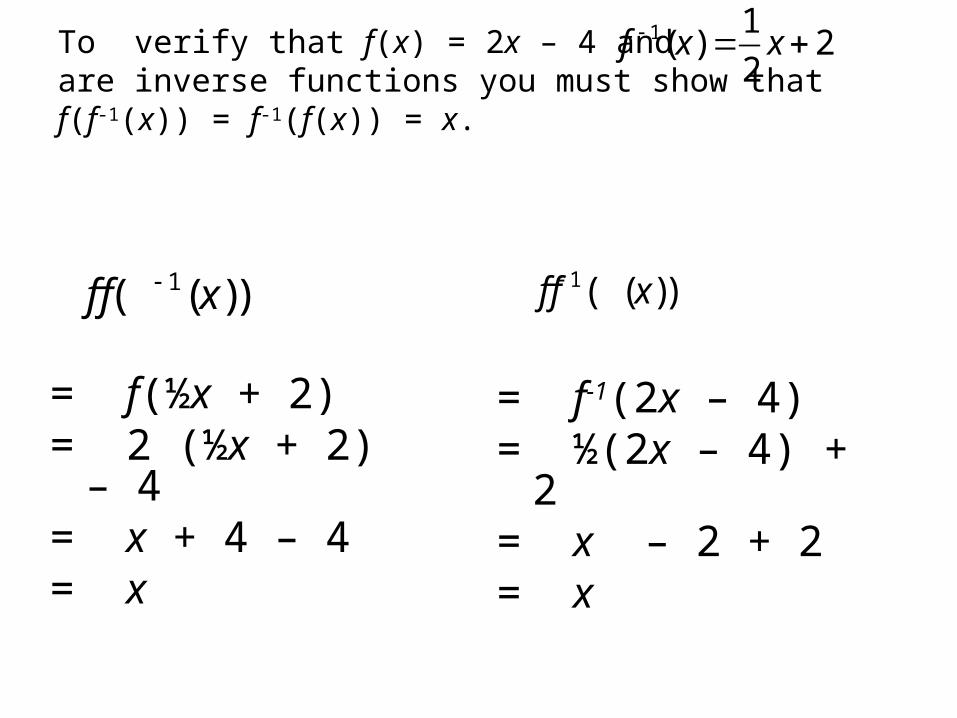
To verify that f(x) = 2x – 4 and are inverse functions you must show thatf(f-1(x)) = f-1(f(x)) = x.
1 1( ) 2
2f x x
1( ( ))f f x 1( ( ))f f x
= f(½x + 2)= 2 (½x + 2) – 4= x + 4 – 4 = x
= f-1(2x – 4)= ½(2x – 4) + 2= x – 2 + 2 = x
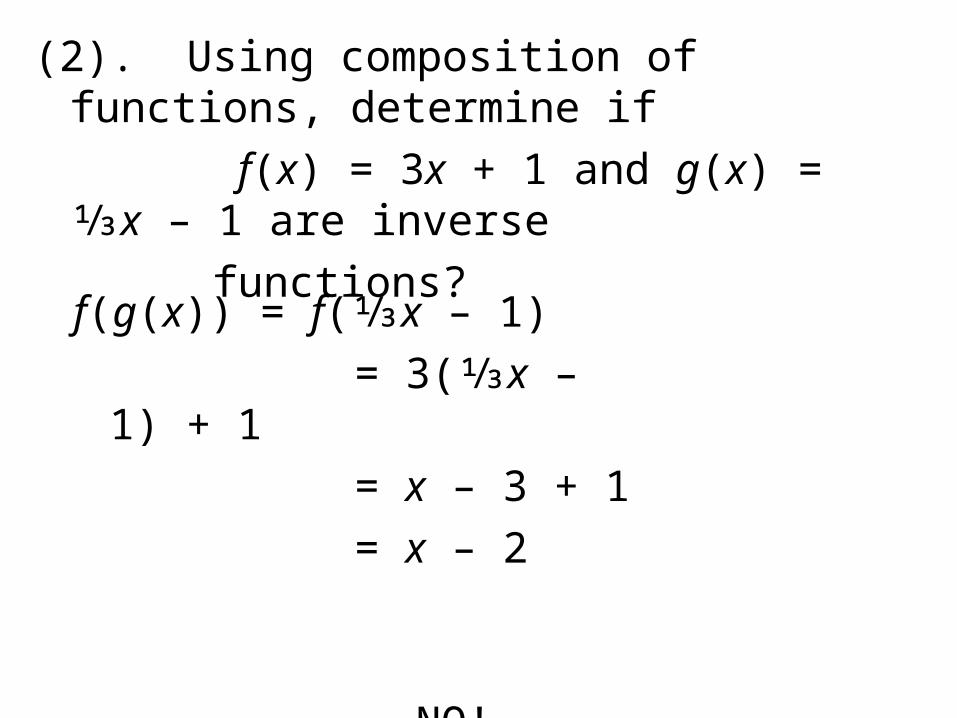
(2). Using composition of functions, determine if
f(x) = 3x + 1 and g(x) = ⅓x – 1 are inverse
functions?
f(g(x)) = f(⅓x – 1)
= 3(⅓x – 1) + 1
= x – 3 + 1
= x – 2
NO!
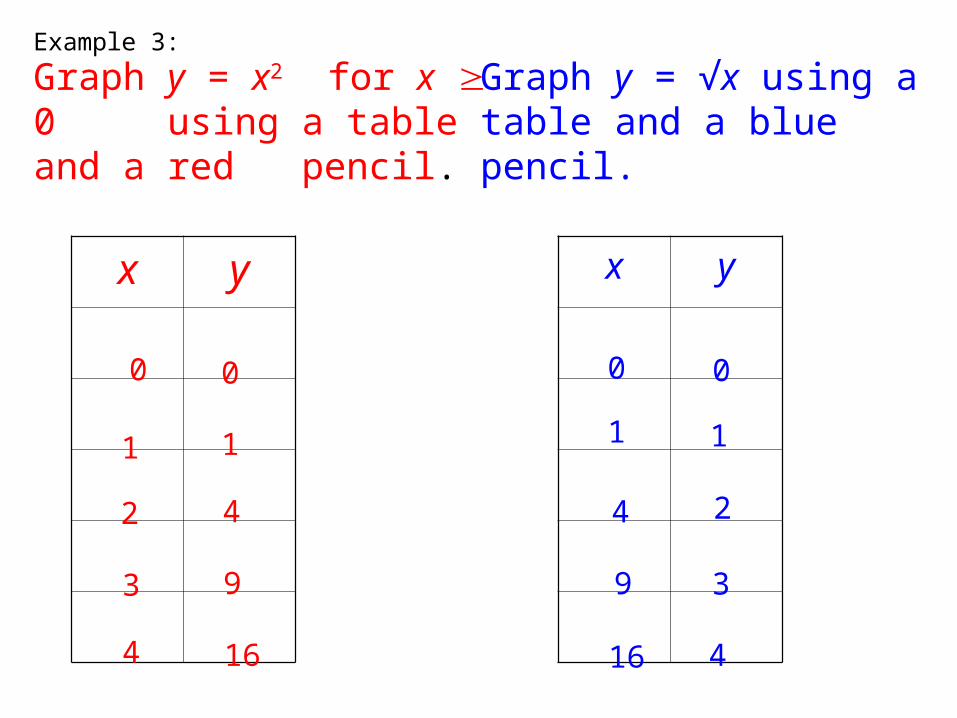
Graph y = x2 for x 0 using a table and a red pencil.
Graph y = √x using a table and a blue pencil.
x y x y
Example 3:
0 0
1 1
2 4
3 9
0 0
1 1
4 2
9 3
4 16 16 4
-8 -6 -4 -2 2 4 6 8
8
6
4
2
-2
-4
-6
-8
x y x y
0 0
1 1
2 4
3 9
0 0
1 1
4 2
9 3
4 16 16 4
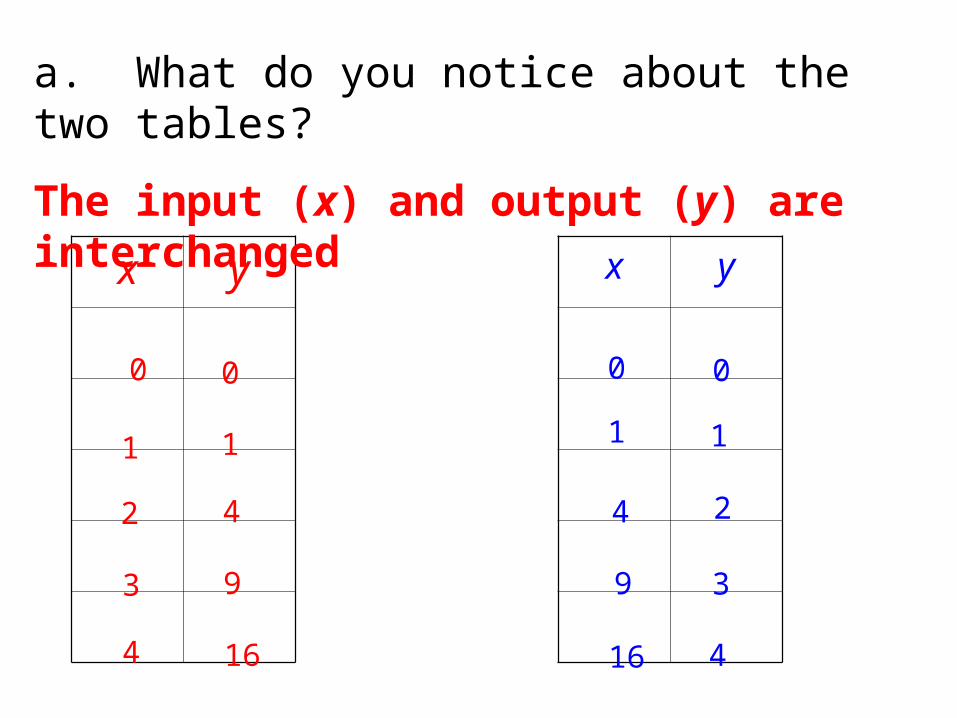
a. What do you notice about the two tables?
The input (x) and output (y) are interchanged
-8 -6 -4 -2 2 4 6 8
8
6
4
2
-2
-4
-6
-8
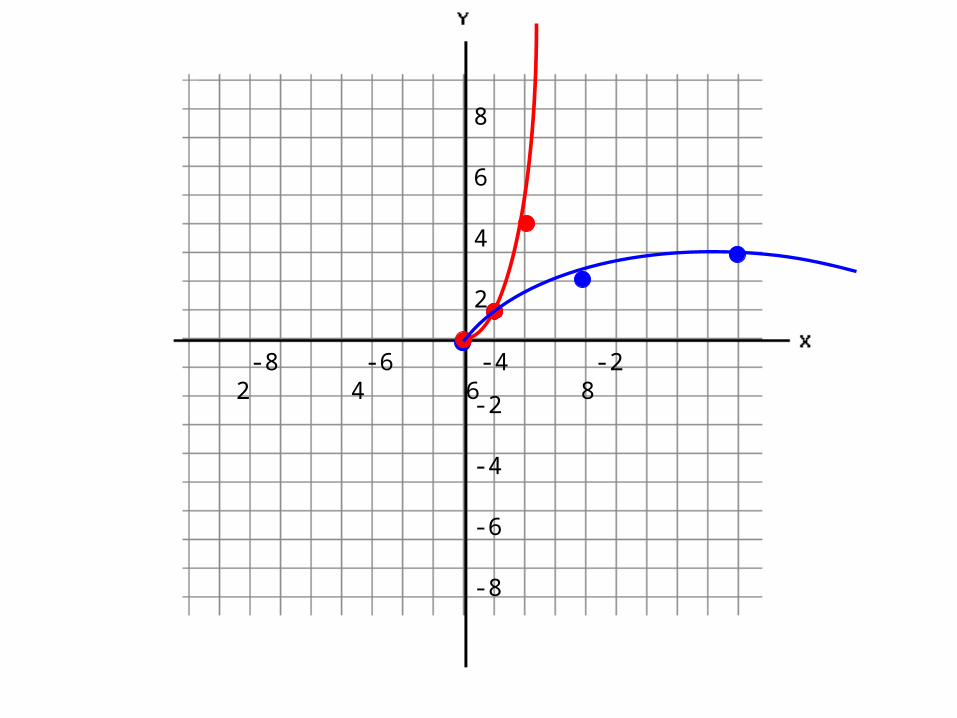
b. With your pencil, draw the line y = x.
What is the relationship between the red and blue graphs and the line y = x?
The line y = x is the line of reflection for the graphs of the red and blue graphs.
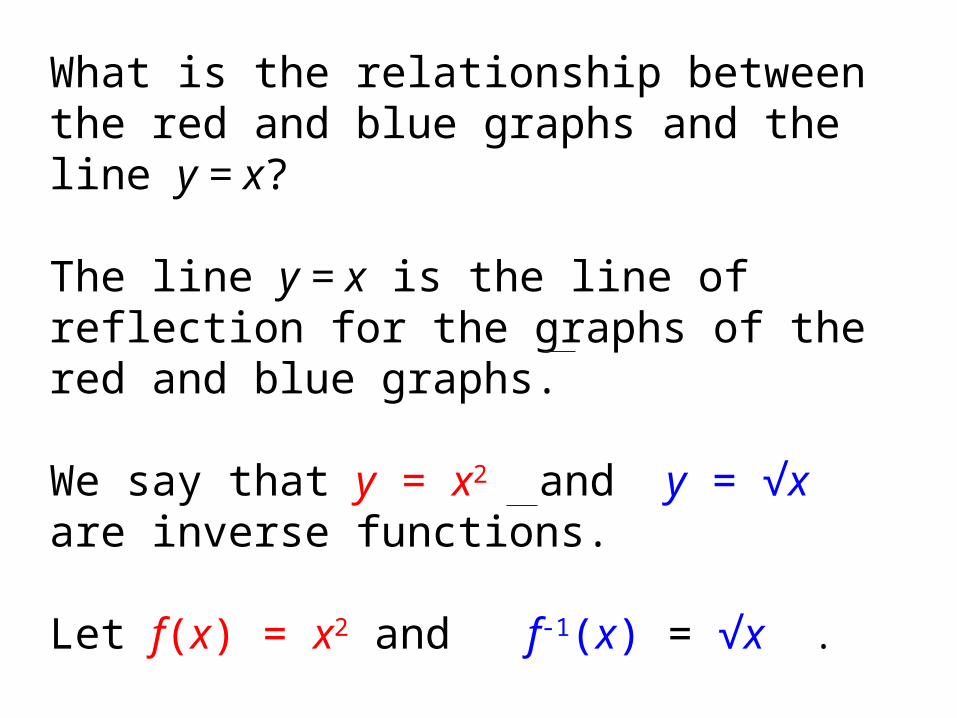
We say that y = x2 and y = √x are inverse functions.
Let f(x) = x2 and f-1(x) = √x .
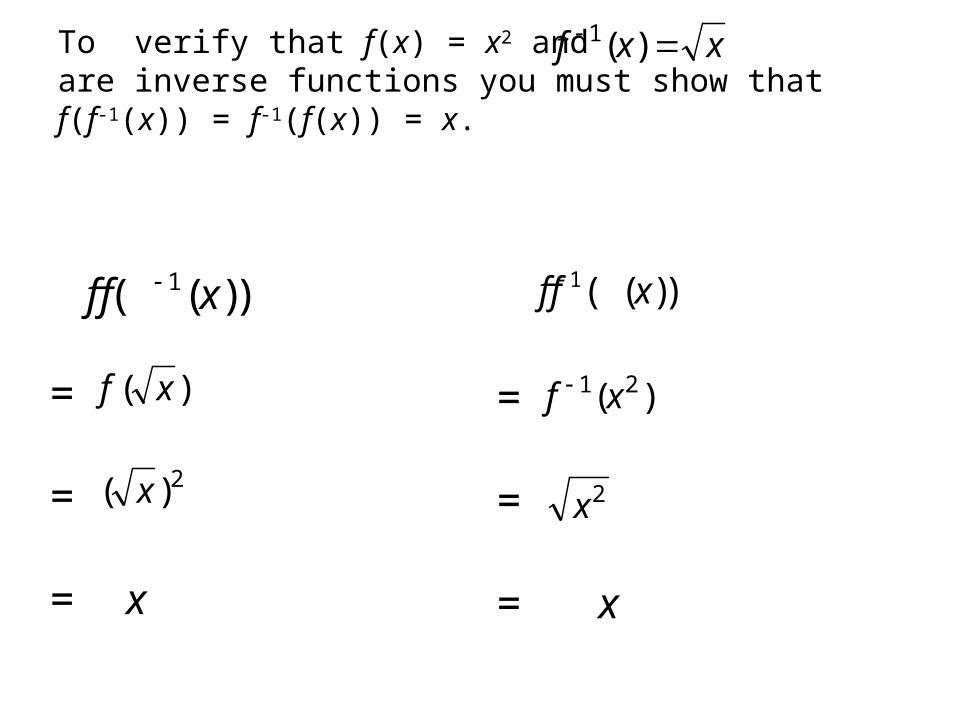
To verify that f(x) = x2 and are inverse functions you must show thatf(f-1(x)) = f-1(f(x)) = x.
1( ( ))f f x 1( ( ))f f x
=
=
= x
=
=
= x
xxf )(1
)( xf
2)( x
)( 21 xf
2x
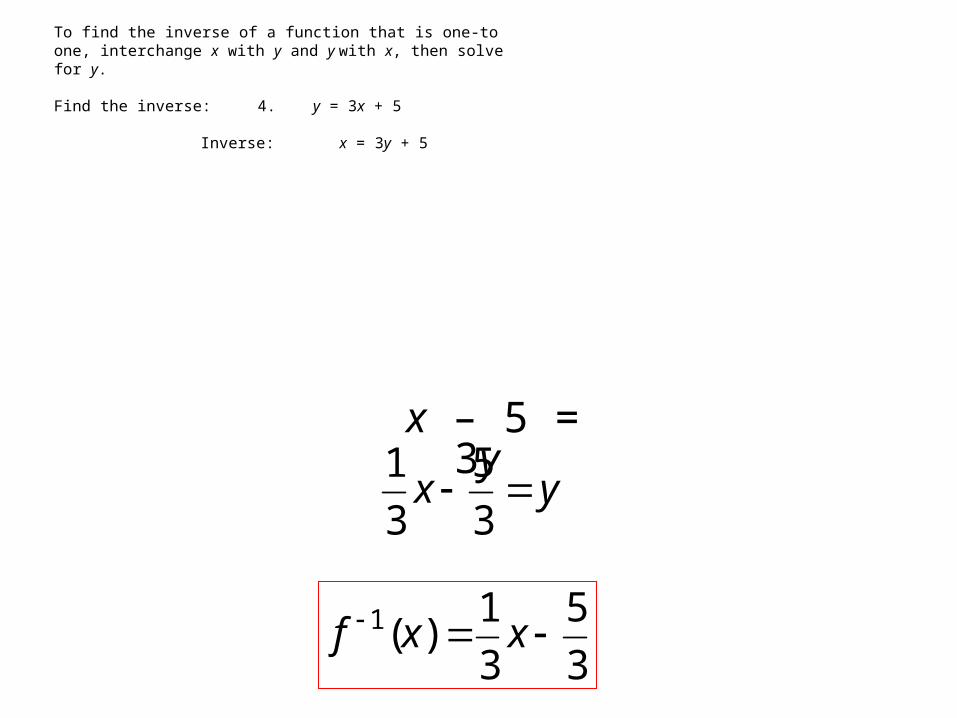
To find the inverse of a function that is one-toone, interchange x with y and y with x, then solvefor y.
Find the inverse: 4. y = 3x + 5
Inverse: x = 3y + 5
yx 3
5
3
1x – 5 = 3y
3
5
3
1)(1 xxf

Find the inverse: 5. y = 2x2 – 1
Inverse: x = 2y2 – 1
2
2
1y
x
x + 1 = 2y2
2
1)(1
xxg
yx
2
1
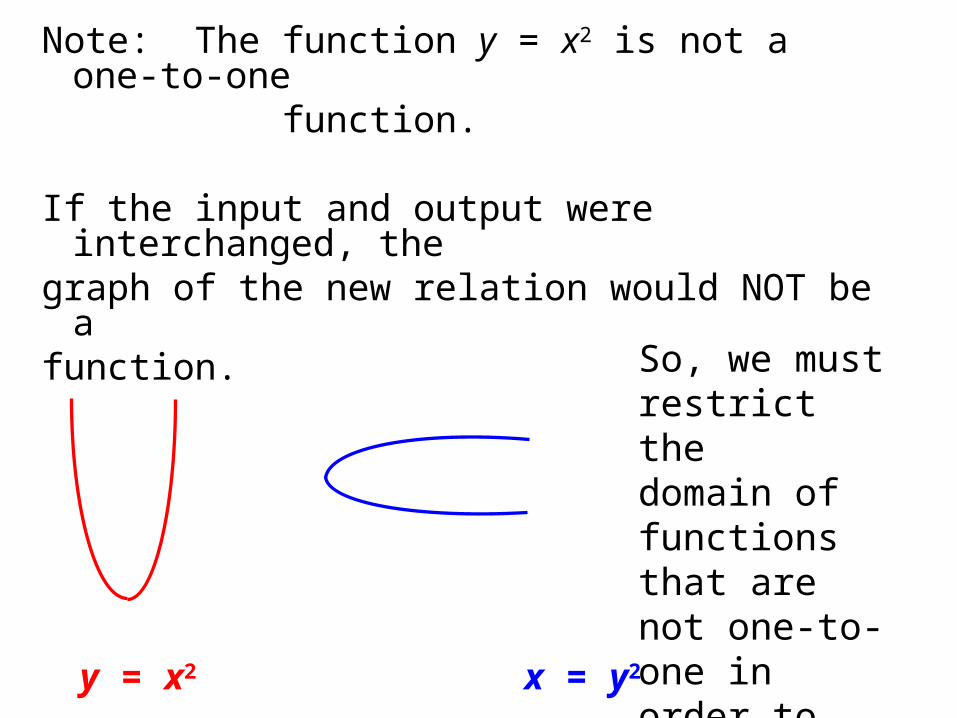
Note: The function y = x2 is not a one-to-one function.
If the input and output were interchanged, thegraph of the new relation would NOT be a function.
y = x2 x = y2
So, we must restrict thedomain of functions that are not one-to-one in order to create a function with an inverse!
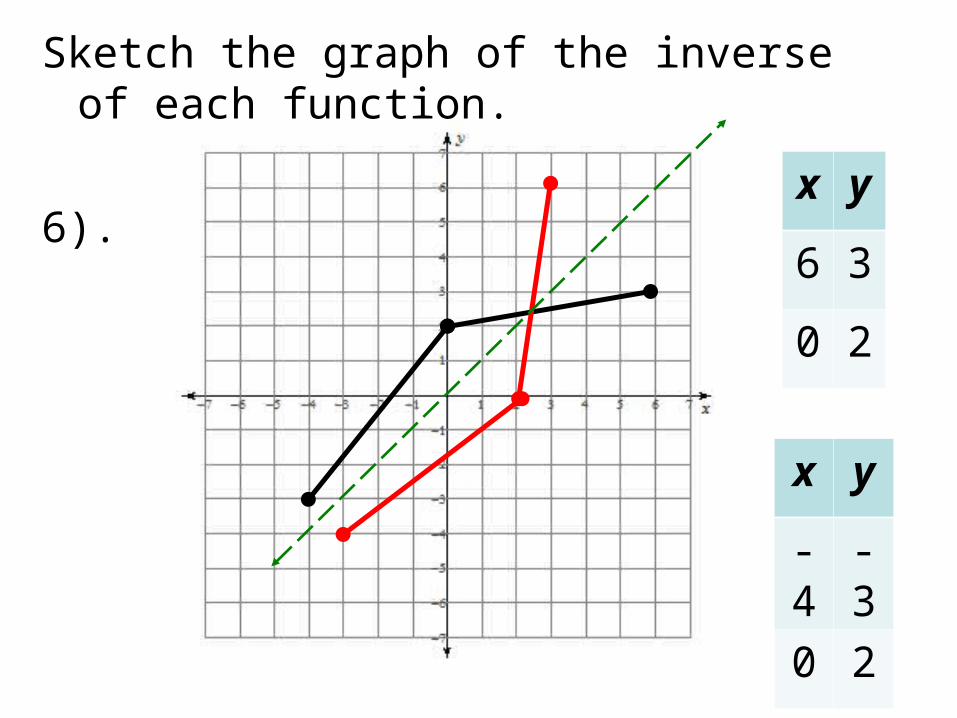
Sketch the graph of the inverse of each function.
6). x y
6 3
0 2
x y
-4 -3
0 2
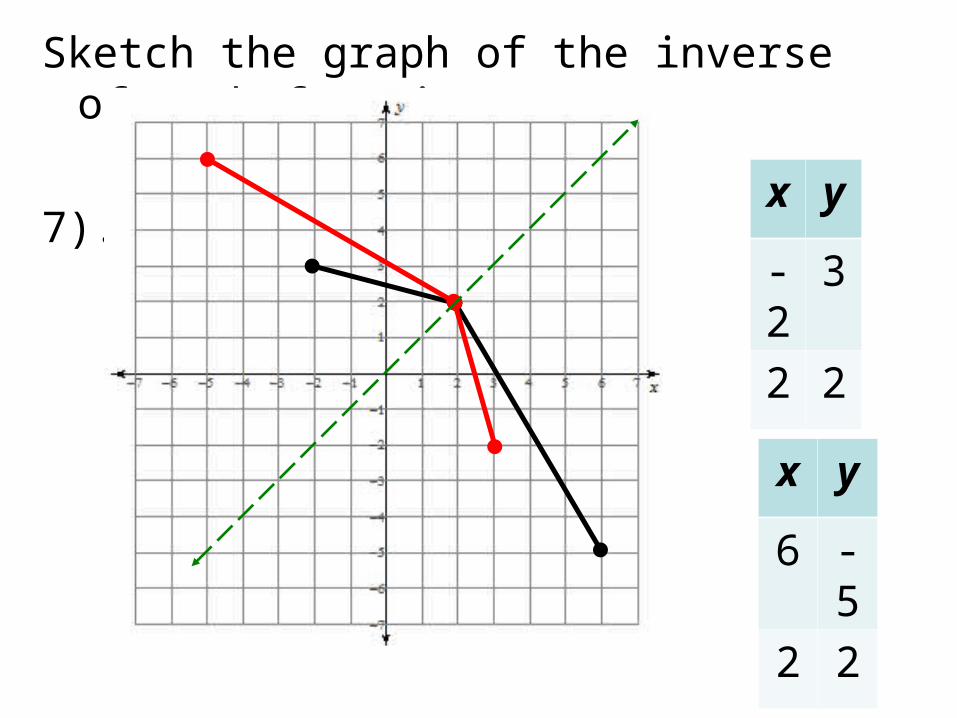
Sketch the graph of the inverse of each function.
7). x y
-2 3
2 2
x y
6 -5
2 2


![[moves] - Neo-Arcadia · moves, perform the motions of the moves using the buttons indicated to feint. Certain moves use alternate motions, they Certain moves use alternate motions,](https://img.pdfslide.net/doc/110x75/5e12441e05bfe76b6d1b9697/moves-neo-moves-perform-the-motions-of-the-moves-using-the-buttons-indicated.jpg)