Embed Size (px)
Citation preview
LETTER Allele surfing promotes microbial adaptation from standing
variation
Matti Gralka,1 Fabian Stiewe,2
Fred Farrell,3 Wolfram M€obius,1
Bartlomiej Waclaw3,4 and
Oskar Hallatschek1*
1Departments of Physics and Inte-
grative Biology, University of Cali-
fornia, Berkeley, CA 94720, USA2Biophysics and Evolutionary
Dynamics Group, Max Planck Insti-
tute for Dynamics and Self-Organi-
zation, 37077 G€ottingen, Germany3SUPA School of Physics and Astron-
omy, The University of Edinburgh,
Mayfield Road, Edinburgh EH9 3JZ,
UK4Centre for Synthetic and Systems
Biology, The University of
Edinburgh, Edinburgh, UK
*Correspondence:
E-mail: [email protected]
Abstract
The coupling of ecology and evolution during range expansions enables mutations to establish atexpanding range margins and reach high frequencies. This phenomenon, called allele surfing, isthought to have caused revolutions in the gene pool of many species, most evidently in microbialcommunities. It has remained unclear, however, under which conditions allele surfing promotes orhinders adaptation. Here, using microbial experiments and simulations, we show that, startingwith standing adaptive variation, range expansions generate a larger increase in mean fitness thanspatially uniform population expansions. The adaptation gain results from ‘soft’ selective sweepsemerging from surfing beneficial mutations. The rate of these surfing events is shown to sensitivelydepend on the strength of genetic drift, which varies among strains and environmental conditions.More generally, allele surfing promotes the rate of adaptation per biomass produced, which couldhelp developing biofilms and other resource-limited populations to cope with environmental chal-lenges.
Keywords
Biological invasions, dynamics of adaptation, eco-evolutionary feedback, gene surfing, geneticdrift, range expansions.
Ecology Letters (2016)
INTRODUCTION
The dynamics of adaptation has been intensely studied boththeoretically and experimentally in situations where the timescales for demographic and adaptive change are vastly sepa-rated. Populations can then be treated as either stable or ashaving an effective population size summarising the effect ofdemographic variations on time scales much faster than theadaptive dynamics considered (Muller 1932; Crow & Kimura1965, 1970).However, demographic equilibrium is frequently disrupted
by, for instance, environmental changes, population growth,competition among species and local adaptation (Excoffieret al. 2009). The fate of a genetic variant then both depends onand influences the demography of a dynamically changing pop-ulation. Consequently, demographic and evolutionary changescan become tightly coupled (Ferriere & Legendre 2013).Such coupling between ecology and evolution is a particu-
larly salient feature of range expansions (Excoffier & Ray2008). Many mutations occur in the bulk of a populationwhere they have to compete for resources with their neigh-bouring conspecifics. Mutations that, by chance, arise in aregion of growing population densities have a two-fold advan-tage: They enjoy a growth rate advantage compared to theirconspecifics in the slow-growing bulk regions, and theiroffspring will have a good chance to benefit from futurenet-growth if parent–offspring locations are correlated. Thesecorrelated founder effects, summarised by the term ‘allele surf-ing’, lead to complex spatiotemporal patterns of neutral muta-tions and can rapidly drive mutations to high frequency by
chance alone (Edmonds et al. 2004; Klopfstein et al. 2006;Travis et al. 2007; Hallatschek & Nelson 2008).The importance of allele surfing has been increasingly recog-
nised over the last 10 years (Currat et al. 2008; Excoffier et al.2009; Waters et al. 2013). Allele surfing is believed to be aubiquitous process in populations that constantly turn over,for instance, by range expansions and contractions, localextinction or expulsion and recolonisation (Hanski 1998;Freckleton & Watkinson 2002; Haag et al. 2005; Taylor &Keller 2007; Arenas et al. 2012). While these features areshared by many populations, they are most evident in micro-bial communities that frequently expand to colonise new sur-face regions in the environment or during infections (Cho &Blaser 2012; Costello et al. 2012).Microbial experiments have shown that in the absence of
selection, allele surfing creates large mutant clones that areextremely unlikely to arise via neutral evolution of well-mixedpopulations. Characteristically, these clones take the shape ofsectors with boundaries that exhibit characteristic fractalproperties (Hallatschek et al. 2007). The random wanderingof sector boundaries is a manifestation of genetic drift, as hasbeen demonstrated experimentally in various micro-organisms,including bacteria, single-celled fungi and social slime moulds,and under various demographic scenarios (Hallatschek et al.2007; Korolev et al. 2011; Nadell et al. 2013; Freese et al.2014; van Gestel et al. 2014).While allele surfing is well understood in the neutral case, we
do not have a comprehensive picture of its adaptive potential.In particular, it is unclear how efficiently pre-existing adaptivevariation (Barrett & Schluter 2008) is selected for during range
© 2016 John Wiley & Sons Ltd/CNRS
Ecology Letters, (2016) doi: 10.1111/ele.12625
expansions: Since allele surfing relies on enhanced genetic drift,it reduces the efficacy of selection per generation (Hallatschek& Nelson 2010; Peischl et al. 2013; Peischl & Excoffier 2015).On the other hand, for populations of the same final size, selec-tion has more time to act at the front of a range expansion thanin a comparable well-mixed expansion, which could promoteadaptation (Hallatschek & Nelson 2010; Zhang et al. 2011;Greulich et al. 2012, 2012; Hermsen et al. 2012).Here, we test whether allele surfing helps or hinders adapta-
tion using microbial competition experiments to measure theefficiency of selection during growth processes. To get a senseof the range of possible evolutionary outcomes, we focus ontwo extreme cases: spatial range expansions and pure demo-graphic growth of panmictic populations. We find increasedadaptation during range expansions and rationalise our quan-titative results using theory and simulations.
MATERIALS AND METHODS
Strains and conditions
Each experiment was performed using a pair of microbialstrains that are distinguished by fluorescence and a selectablemarker. The fluorescent colour difference allows measuringthe relative abundance of each strain in competition experi-ments by fluorescence microscopy as well as flow cytometry.The selectable marker was used to tune the selective differencebetween the strains in the following way: One strain of thepair, the sensitive strain (called ‘wild type’), grows slower inthe presence of a drug, while the other strain, the resistantstrain (called ‘mutant’), is largely unaffected. Tuning the con-centration of the drug in the medium thus allowed us toadjust the selective difference between both strains. Selectiveadvantages on plates and in liquid culture were measured sep-arately for a range of drug concentrations using the collidingcolony assay (Korolev et al. 2012) and flow cytometry (forSaccharomyces cerevisiae), respectively (see Appendix C inSupporting Information), which give consistent results (seesupplementary Fig. B1a). Selective differences reportedthroughout were obtained from linear fits.
StrainsWe used S. cerevisiae strains with W303 backgrounds, whereselective advantages were adjusted using cycloheximide. Forexperiments with Escherichia coli, we used both DH5a andMG1655 strains, tuning fitness differences using tetracyclineand chloramphenicol, respectively. Additionally, pairs ofstrains differing only in the fluorescent marker allowed us toperform truly neutral competition experiments (S. cerevisiae,Schizosaccharomyces pombe, E. coli). S. cerevisiae and E. colistrains with constitutively expressed fluorescent proteins wereused to study the dynamics of cells at the front.A detailed description of all strains and growth conditions
is found in Appendix C.
Main experiment
Adaptation from standing variation during two types of pop-ulation expansions (see Fig. 1a): For each pair of mutant and
wild type, a mixed starting population of size Ni was preparedthat contained an initial frequency Pi of mutants having aselective advantage s, defined as the relative differencebetween mutant and wild-type growth rate (Korolev et al.2012). The population was then grown to final size Nf in twoways, through a range expansion and, for comparison,through uniform growth, and the final mutant frequency Pf
was determined. The associated increase in mean fitness Wfollows as DW ¼ ðPf � PiÞs.
Uniform growthMixtures of cells were grown in well-shaken liquid medium tothe desired final population size and the final fraction ofmutant cells was determined using flow cytometry.
Range expansionColony growth was initiated by placing 2 lL of the mixturesonto plates (2% w/v agar) and incubated until the desiredfinal population size was reached. The number Nsec of sectorswas determined by eye; the final fraction Pf was measuredusing image analysis (see Appendix C for details).
Cell-tracking experiments
To investigate the dynamics of cells at advancing colonyfronts, we continually imaged the first few layers of mostadvanced cells in growing S. cerevisiae and E. coli coloniesbetween a coverslip and an agar pad for about 4 h using aLSM700 (Zeiss AG, Jena, Germany) confocal microscope.The resulting stack of images was segmented and cells weretracked as described in Appendix C.
Meta-population model
To simulate evolutionary change during the different modesof growth, we adapted a classic meta-population model forgrowing microbial colonies, the Eden model (Eden 1961)(Fig. 2a, Appendix A).
Range expansionThe population spreads on a lattice and each lattice point isin one of three states: empty, wild type or mutant. Growth ofthe population occurs by randomly selecting an occupied‘source’ site with empty neighbours and copying it into a ran-domly chosen empty neighbour site. A mutant is more likelyto be picked than a wild-type site by a factor of 1 + s. Thisprocess is repeated until the colony has reached the final aver-age radius Rf and the final mutant fraction Pf is determined.
Uniform growthThe range expansion simulation was modified such that a tar-get site was an empty site randomly drawn from the entire lat-tice, rather than from the sites neighbouring a given sourcesite.
Individual-based simulations
To study the relevance of microscopic details on the adapta-tion process, we simulated a growing colony as a two-
© 2016 John Wiley & Sons Ltd/CNRS
2 M. Gralka et al. Letter
dimensional collection of sphero-cylinders (rods with hemi-spherical caps) of various lengths interacting mechanically (see(Farrell et al. 2013) and Appendix A for details). The cellscontinuously grew (and divided) by consuming nutrients,whose concentration was explicitly computed.
RESULTS
The adaptive potential of range expansions
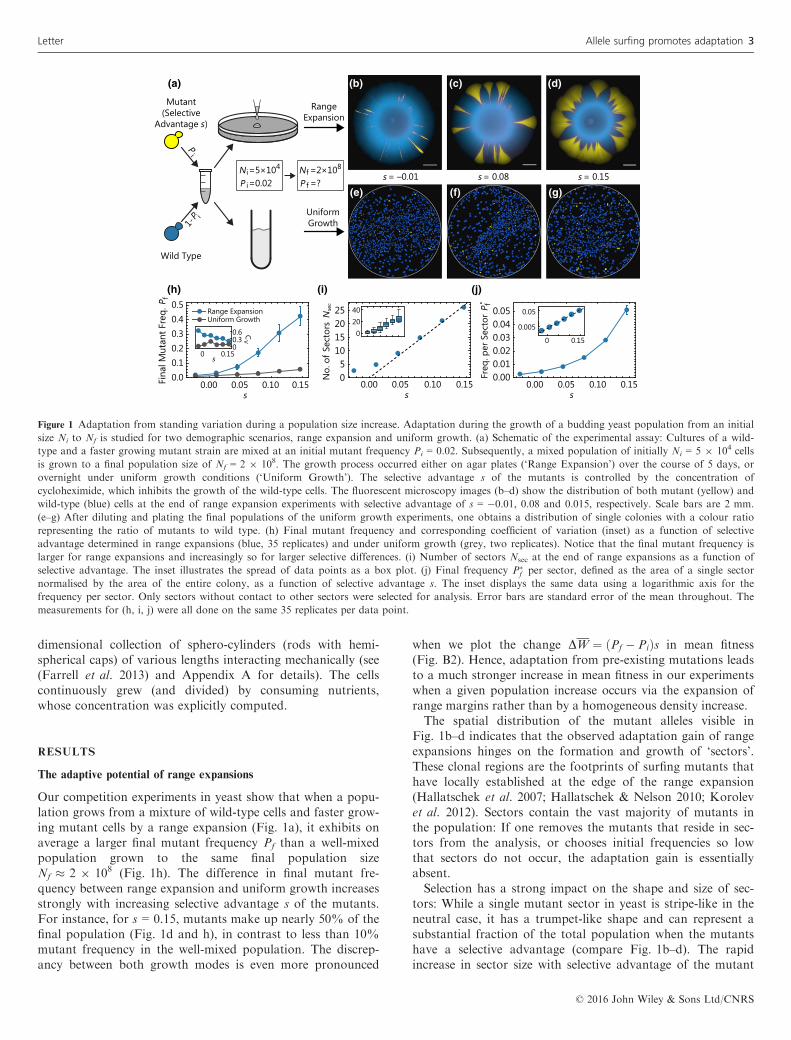
Our competition experiments in yeast show that when a popu-lation grows from a mixture of wild-type cells and faster grow-ing mutant cells by a range expansion (Fig. 1a), it exhibits onaverage a larger final mutant frequency Pf than a well-mixedpopulation grown to the same final population sizeNf � 2 9 108 (Fig. 1h). The difference in final mutant fre-quency between range expansion and uniform growth increasesstrongly with increasing selective advantage s of the mutants.For instance, for s = 0.15, mutants make up nearly 50% of thefinal population (Fig. 1d and h), in contrast to less than 10%mutant frequency in the well-mixed population. The discrep-ancy between both growth modes is even more pronounced
when we plot the change DW ¼ ðPf � PiÞs in mean fitness(Fig. B2). Hence, adaptation from pre-existing mutations leadsto a much stronger increase in mean fitness in our experimentswhen a given population increase occurs via the expansion ofrange margins rather than by a homogeneous density increase.The spatial distribution of the mutant alleles visible in
Fig. 1b–d indicates that the observed adaptation gain of rangeexpansions hinges on the formation and growth of ‘sectors’.These clonal regions are the footprints of surfing mutants thathave locally established at the edge of the range expansion(Hallatschek et al. 2007; Hallatschek & Nelson 2010; Korolevet al. 2012). Sectors contain the vast majority of mutants inthe population: If one removes the mutants that reside in sec-tors from the analysis, or chooses initial frequencies so lowthat sectors do not occur, the adaptation gain is essentiallyabsent.Selection has a strong impact on the shape and size of sec-
tors: While a single mutant sector in yeast is stripe-like in theneutral case, it has a trumpet-like shape and can represent asubstantial fraction of the total population when the mutantshave a selective advantage (compare Fig. 1b–d). The rapidincrease in sector size with selective advantage of the mutant
02040
Ns
(c) (d)(b)(a)
(h) (i) (j)
= –0.01 = 0.08 = 0.15i=5×10⁴
Mutant(Selective
Advantage s)
Wild Type
RangeExpansion
UniformGrowth
(f) (g)(e)
Range ExpansionUniform Growth
0.00 0.05 0.10 0.150.00.10.20.30.40.5
s
Fina
l Mut
ant F
req.
0.00 0.05 0.10 0.1505
10152025
ofSe
ctor
sN
o.
0.00 0.05 0.10 0.150.000.010.020.030.040.05
s
Freq
. per
Sec
tor
P
i=0.02NP
s s s
s
Pi
P i
f
f =?NP
s
0 0.1500.30.6 C
V
s
Nse
c
0 0.15
0.005
0.05
1-
fP f=2×10⁸
Figure 1 Adaptation from standing variation during a population size increase. Adaptation during the growth of a budding yeast population from an initial
size Ni to Nf is studied for two demographic scenarios, range expansion and uniform growth. (a) Schematic of the experimental assay: Cultures of a wild-
type and a faster growing mutant strain are mixed at an initial mutant frequency Pi = 0.02. Subsequently, a mixed population of initially Ni = 5 9 104 cells
is grown to a final population size of Nf = 2 9 108. The growth process occurred either on agar plates (‘Range Expansion’) over the course of 5 days, or
overnight under uniform growth conditions (‘Uniform Growth’). The selective advantage s of the mutants is controlled by the concentration of
cycloheximide, which inhibits the growth of the wild-type cells. The fluorescent microscopy images (b–d) show the distribution of both mutant (yellow) and
wild-type (blue) cells at the end of range expansion experiments with selective advantage of s = �0.01, 0.08 and 0.015, respectively. Scale bars are 2 mm.
(e–g) After diluting and plating the final populations of the uniform growth experiments, one obtains a distribution of single colonies with a colour ratio
representing the ratio of mutants to wild type. (h) Final mutant frequency and corresponding coefficient of variation (inset) as a function of selective
advantage determined in range expansions (blue, 35 replicates) and under uniform growth (grey, two replicates). Notice that the final mutant frequency is
larger for range expansions and increasingly so for larger selective differences. (i) Number of sectors Nsec at the end of range expansions as a function of
selective advantage. The inset illustrates the spread of data points as a box plot. (j) Final frequency P�f per sector, defined as the area of a single sector
normalised by the area of the entire colony, as a function of selective advantage s. The inset displays the same data using a logarithmic axis for the
frequency per sector. Only sectors without contact to other sectors were selected for analysis. Error bars are standard error of the mean throughout. The
measurements for (h, i, j) were all done on the same 35 replicates per data point.
© 2016 John Wiley & Sons Ltd/CNRS
Letter Allele surfing promotes adaptation 3
strain is quantified in Fig. 1j. For instance, a single mutantsector with selective advantage s = 0.15 contains roughly 5%of the total population in our experiments. Under these condi-tions, a single clonal sector is like an adaptive ‘jackpot’ eventthat can cause a substantial increase in the mean fitness of thepopulation.However, the early stages of surfing are a highly stochastic
process, and therefore these jackpot events are rare. This isreflected in the rather small number of sectors (proportionalto the initial frequency of mutants, see Fig. B3) detected inour experiments. The colonies shown in Fig. 1b–d, forinstance, were started with about 103 founder mutants in theinoculum, but only exhibit a handful of sectors (Fig. 1i). Thenumber of sectors varies strongly between replicates (Fig. 1i,inset) and, if the mutants are very infrequent initially, there isa substantial chance that no sectors form (Fig. B4). Impor-tantly, while the number of sectors is generally small, itincreases with selective advantage, further contributing to theadaptation gain in range expansions.
Towards a minimal model for adaptation by gene surfing
The population dynamics of our colonies differs from uniformgrowth in numerous aspects: Cells are delivered to the plate ina droplet, which forms a ring of cells after evaporation (Dee-gan et al. 1997). The cells start to grow and push each otheracross the surface of the agar. The population grows at firstexponentially, until the growth of the core of the colony slowsdown due to nutrient depletion behind the front. The furtheradvancement of the front is driven by a layer of proliferatingcells (the ‘growth layer’ (Hallatschek et al. 2007; Mitri et al.2015)) at the edge of the colony (Fig. B5).
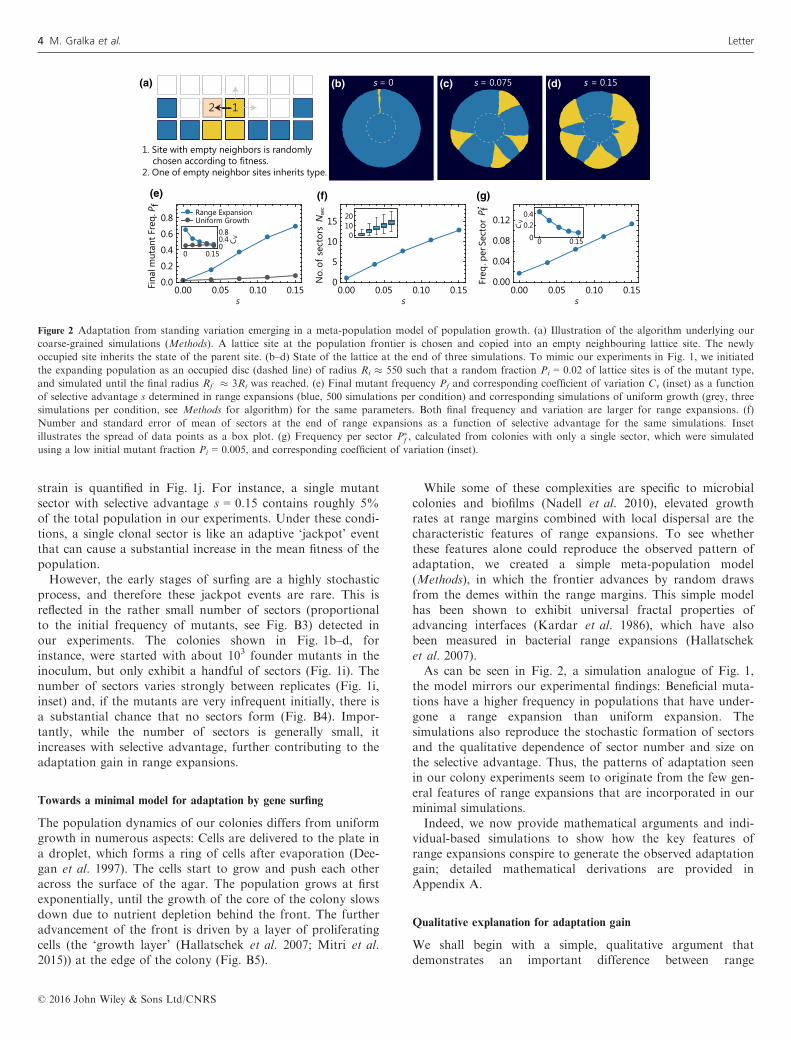
While some of these complexities are specific to microbialcolonies and biofilms (Nadell et al. 2010), elevated growthrates at range margins combined with local dispersal are thecharacteristic features of range expansions. To see whetherthese features alone could reproduce the observed pattern ofadaptation, we created a simple meta-population model(Methods), in which the frontier advances by random drawsfrom the demes within the range margins. This simple modelhas been shown to exhibit universal fractal properties ofadvancing interfaces (Kardar et al. 1986), which have alsobeen measured in bacterial range expansions (Hallatscheket al. 2007).As can be seen in Fig. 2, a simulation analogue of Fig. 1,
the model mirrors our experimental findings: Beneficial muta-tions have a higher frequency in populations that have under-gone a range expansion than uniform expansion. Thesimulations also reproduce the stochastic formation of sectorsand the qualitative dependence of sector number and size onthe selective advantage. Thus, the patterns of adaptation seenin our colony experiments seem to originate from the few gen-eral features of range expansions that are incorporated in ourminimal simulations.Indeed, we now provide mathematical arguments and indi-
vidual-based simulations to show how the key features ofrange expansions conspire to generate the observed adaptationgain; detailed mathematical derivations are provided inAppendix A.
Qualitative explanation for adaptation gain
We shall begin with a simple, qualitative argument thatdemonstrates an important difference between range
B C
E
CB(a) b (c) (d)
(e) (f)
12
1. Site with empty neighbors is randomly chosen according to fitness.2. One of empty neighbor sites inherits type.
s = 0.075= 0 s = 0.15s
0.00 0.05 0.10 0.150.00
0.04
0.08
0.12
Freq
.per
Sect
or
0 0.150
0.20.4
CV
Range ExpansionUniform Growth
0.00 0.05 0.10 0.150.0
0.2
0.4
0.6
0.8
0 0.1500.40.8
CV
s s0.00 0.05 0.10 0.15
0
5
10
15
ofse
ctor
sN
o.N
sec
s
01020
Fina
lmut
ant F
req.
P f
(g)
P f
(b)
Figure 2 Adaptation from standing variation emerging in a meta-population model of population growth. (a) Illustration of the algorithm underlying our
coarse-grained simulations (Methods). A lattice site at the population frontier is chosen and copied into an empty neighbouring lattice site. The newly
occupied site inherits the state of the parent site. (b–d) State of the lattice at the end of three simulations. To mimic our experiments in Fig. 1, we initiated
the expanding population as an occupied disc (dashed line) of radius Ri � 550 such that a random fraction Pi = 0.02 of lattice sites is of the mutant type,
and simulated until the final radius Rf � 3Ri was reached. (e) Final mutant frequency Pf and corresponding coefficient of variation Cv (inset) as a function
of selective advantage s determined in range expansions (blue, 500 simulations per condition) and corresponding simulations of uniform growth (grey, three
simulations per condition, see Methods for algorithm) for the same parameters. Both final frequency and variation are larger for range expansions. (f)
Number and standard error of mean of sectors at the end of range expansions as a function of selective advantage for the same simulations. Inset
illustrates the spread of data points as a box plot. (g) Frequency per sector P�f , calculated from colonies with only a single sector, which were simulated
using a low initial mutant fraction Pi = 0.005, and corresponding coefficient of variation (inset).
© 2016 John Wiley & Sons Ltd/CNRS
4 M. Gralka et al. Letter
expansions and uniform growth. In a well-mixed population,the mutant frequency grows exponentially with time, Pf / esT.The number T of generations, however, increases only loga-rithmically with the final population size, T / lnNf, such thatthe mutant frequency changes by Pf/Pi = (Nf/Ni)
s. In ourexperiments, this leads to a modest relative change in mutantfrequency, e.g. by a factor of 2 for a 6% beneficial mutationover the course of the growth process, which corresponds toabout 12 generations. Importantly, the absolute frequencyremains well below one when the initial frequency is small.Moreover, the final mutant frequency varies relatively littleamong different replicates, as quantified by the coefficient ofvariation (Fig. 1h inset). This is because nearly all initiallypresent cells give rise to clones, with similar clone sizes, eachcorresponding to only a minute fraction of the total popula-tion.In contrast to uniform growth, more generations need to
pass to reach the same final population size Nf in a radiallyexpanding population (T / N
1=2f in a radially expanding popu-
lation, in contrast to T / lnNfÞ in the well-mixed case). Thisimplies that selection has more time to act during a rangeexpansion, so that one might expect an increased final mutantfrequency.
Adaptation gain depends on sector shape and number
The above run-time argument captures the main reason forthe adaptation gain, but it ignores two important counter-forces: (1) The efficacy of selection is reduced during a rangeexpansion because the frequency of a selected mutationincreases only algebraically with time, in contrast to exponen-tial sweeps in uniformly growing populations. (2) Only few ofthe initially present cells give rise to expanding clones. There-fore, to fully understand the adaptive potential of rangeexpansion, we must examine the mechanism of sector expan-sion and formation, the latter being an inherently stochasticprocess caused by enhanced genetic drift at the front (Hal-latschek et al. 2007). Ignoring any interaction between sectorsand the small fraction of mutants in non-surfing clones, wecan estimate the final frequency Pf of mutants by multiplyingthe number Nsec of sectors with their relative frequency P�
f inthe population,
Pf ¼ P�f �Nsec:
While simple deterministic arguments exist to predict thefrequency P�
f of individual clones, new population genetic the-ory is required to predict the number Nsec of sectors. Remark-ably, we shall see that the number of sectors is sensitive tomicroscopic details of the population growth process.
Final frequency P�f of expanding clones
The two boundaries of sectors in radial range expansions arelogarithmic spirals (Korolev et al. 2012). These spirals emergefrom the origin of the sector at a characteristic opening angleuðsÞ � 2
ffiffiffiffiffi
2sp
that is set by the selective advantage s of themutant (Hallatschek & Nelson 2010). Up to logarithmic cor-rections, one therefore expects a final frequency of mutantcells from a single sector to be P�
f � uðsÞ=2p� ffiffi
sp
in large
colonies (see Eq. (A11) for the full result). This means that asingle initial mutant can give rise to a macroscopically largeclone of order
ffiffi
sp
. The fractional size of mutant sectors growseven faster in range expansions with straight rather thancurved fronts (Eq. A7).
Sector number Nsec
The establishment of beneficial mutations is generally a resultof the competition between random genetic drift and thedeterministic force of selection. At the coarse-grained descrip-tion of clones in terms of sectors, genetic drift manifests itselfin the random wandering of sector boundaries, ultimately aresult of randomness in the reproduction process (Hallatscheket al. 2007). Balancing the random sector boundary motionwith the deterministic sector expansion due to selection, weshow in Appendix A (see Eq. (A15)) that the number of sec-tors is proportional to s in two dimensions. Note thatalthough the s-dependence of the number of sectors in twodimensions is identical to Haldane’s classical result ‘2s’ forthe establishment probability of beneficial mutations (Mar-uyama 1970; Patwa & Wahl 2008), the proportionalitychanges in the three-dimensional case to a predicted s3.45
(Appendix A), which may be relevant to the evolution ofsolid tumours.
Modelling the onset of surfing
While our minimal model reproduces aspects of the experi-mental data reasonably well (see Fig. A2), it cannot predicthow microscopic details influence the adaptation dynamics.Microscopic details are summarised by a fit parameter, theeffective deme size, which enters our expression for the num-ber of sectors Nsec (Eq. (A19)).To study directly how these microscopic factors influence
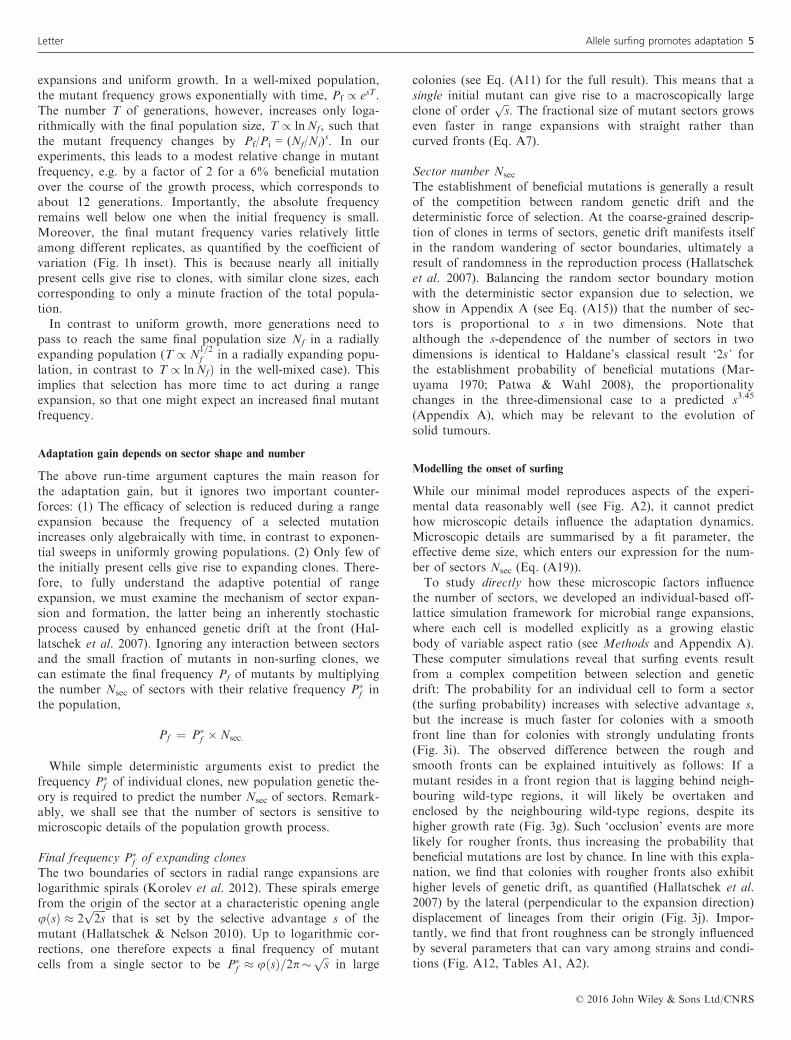
the number of sectors, we developed an individual-based off-lattice simulation framework for microbial range expansions,where each cell is modelled explicitly as a growing elasticbody of variable aspect ratio (see Methods and Appendix A).These computer simulations reveal that surfing events resultfrom a complex competition between selection and geneticdrift: The probability for an individual cell to form a sector(the surfing probability) increases with selective advantage s,but the increase is much faster for colonies with a smoothfront line than for colonies with strongly undulating fronts(Fig. 3i). The observed difference between the rough andsmooth fronts can be explained intuitively as follows: If amutant resides in a front region that is lagging behind neigh-bouring wild-type regions, it will likely be overtaken andenclosed by the neighbouring wild-type regions, despite itshigher growth rate (Fig. 3g). Such ‘occlusion’ events are morelikely for rougher fronts, thus increasing the probability thatbeneficial mutations are lost by chance. In line with this expla-nation, we find that colonies with rougher fronts also exhibithigher levels of genetic drift, as quantified (Hallatschek et al.2007) by the lateral (perpendicular to the expansion direction)displacement of lineages from their origin (Fig. 3j). Impor-tantly, we find that front roughness can be strongly influencedby several parameters that can vary among strains and condi-tions (Fig. A12, Tables A1, A2).
© 2016 John Wiley & Sons Ltd/CNRS
Letter Allele surfing promotes adaptation 5
Moreover, we find that only mutations that occur very closeto the front line have any chance of long-term surfing(Fig. 3h). For our experiments, this implies that only thoseancestral mutants have a chance to surf that, by chance, arein the first few cell layers of the dried inoculated droplet. Thenarrowness of the layer from which surfers are recruited,moreover, makes an important prediction about surfing of denovo mutations: Since the width k of the growth layer wheremutations occur can be much wider than the average width dof the cells in the front line, the effective mutation rate leff ofmutations occurring in the growth layer is the bare mutationrate l reduced by a factor of d/k, which is on the order of afew percent in most microbial colonies. Hence, the vast major-ity of beneficial mutations are effectively wasted in expandingpopulations because they occur behind the front line. There-fore, during range expansions with de novo mutations, a lotfewer surfing events should be observed than expected for agiven mutation rate (as measured by, e.g. fluctuation analysis)and surfing probability (as measured by, e.g. the number ofsectors), especially for a thick growth layer. This may con-tribute to the accumulation of deleterious mutations duringrange expansions.
Experimentally probing the onset of surfing
Our individual-based model made two crucial predictionsabout the early stages of surfing, which we tested in a seriesof experiments described below.
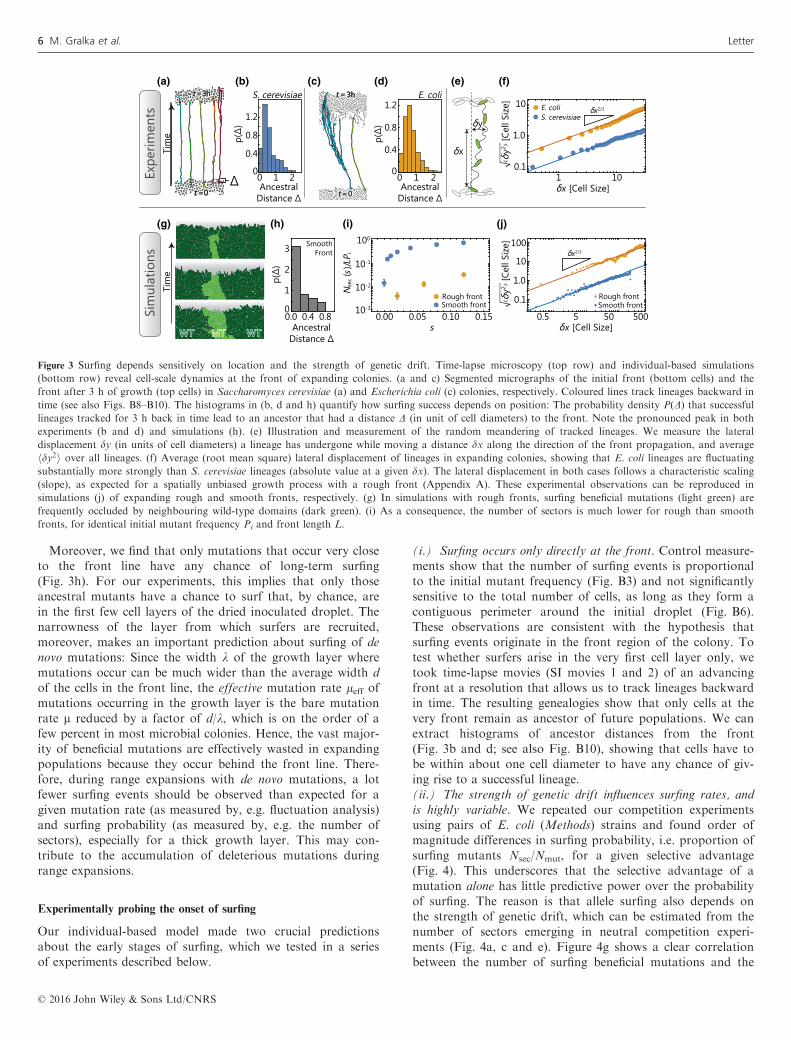
(i.) Surfing occurs only directly at the front. Control measure-ments show that the number of surfing events is proportionalto the initial mutant frequency (Fig. B3) and not significantlysensitive to the total number of cells, as long as they form acontiguous perimeter around the initial droplet (Fig. B6).These observations are consistent with the hypothesis thatsurfing events originate in the front region of the colony. Totest whether surfers arise in the very first cell layer only, wetook time-lapse movies (SI movies 1 and 2) of an advancingfront at a resolution that allows us to track lineages backwardin time. The resulting genealogies show that only cells at thevery front remain as ancestor of future populations. We canextract histograms of ancestor distances from the front(Fig. 3b and d; see also Fig. B10), showing that cells have tobe within about one cell diameter to have any chance of giv-ing rise to a successful lineage.(ii.) The strength of genetic drift influences surfing rates, andis highly variable. We repeated our competition experimentsusing pairs of E. coli (Methods) strains and found order ofmagnitude differences in surfing probability, i.e. proportion ofsurfing mutants Nsec/Nmut, for a given selective advantage(Fig. 4). This underscores that the selective advantage of amutation alone has little predictive power over the probabilityof surfing. The reason is that allele surfing also depends onthe strength of genetic drift, which can be estimated from thenumber of sectors emerging in neutral competition experi-ments (Fig. 4a, c and e). Figure 4g shows a clear correlationbetween the number of surfing beneficial mutations and the
(a)
(g) (h) (i) (j)
(b) (c) (d) (e) (f)
Figure 3 Surfing depends sensitively on location and the strength of genetic drift. Time-lapse microscopy (top row) and individual-based simulations
(bottom row) reveal cell-scale dynamics at the front of expanding colonies. (a and c) Segmented micrographs of the initial front (bottom cells) and the
front after 3 h of growth (top cells) in Saccharomyces cerevisiae (a) and Escherichia coli (c) colonies, respectively. Coloured lines track lineages backward in
time (see also Figs. B8–B10). The histograms in (b, d and h) quantify how surfing success depends on position: The probability density P(D) that successfullineages tracked for 3 h back in time lead to an ancestor that had a distance D (in unit of cell diameters) to the front. Note the pronounced peak in both
experiments (b and d) and simulations (h). (e) Illustration and measurement of the random meandering of tracked lineages. We measure the lateral
displacement dy (in units of cell diameters) a lineage has undergone while moving a distance dx along the direction of the front propagation, and average
hdy2i over all lineages. (f) Average (root mean square) lateral displacement of lineages in expanding colonies, showing that E. coli lineages are fluctuating
substantially more strongly than S. cerevisiae lineages (absolute value at a given dx). The lateral displacement in both cases follows a characteristic scaling
(slope), as expected for a spatially unbiased growth process with a rough front (Appendix A). These experimental observations can be reproduced in
simulations (j) of expanding rough and smooth fronts, respectively. (g) In simulations with rough fronts, surfing beneficial mutations (light green) are
frequently occluded by neighbouring wild-type domains (dark green). (i) As a consequence, the number of sectors is much lower for rough than smooth
fronts, for identical initial mutant frequency Pi and front length L.
© 2016 John Wiley & Sons Ltd/CNRS
6 M. Gralka et al. Letter
number of surfing neutral mutations, for four conditions anddifferent fitness effects. This suggests that measuring thestrength of random genetic drift is necessary to predict theefficacy of adaptation.
The difference between strains can partly be understoodfrom time-lapse movies of the colony growth at single-cell res-olution (SI movies 1 and 2). While cell motion perpendicularto the front direction is limited in yeast colonies, there isstrong dynamics within the E. coli front. Tracking the cellsthrough 3 h of growth elucidates the difference in cellulardynamics, as shown in Fig. 3a and c. We quantify this obser-vation by measuring the cells’ lateral displacement (Fig. 3e–f,Appendix C), which is about an order of magnitude strongerin E. coli compared to budding yeast, explaining (at leastpartly) the difference in genetic drift. The same effect can beobserved in computer simulations of the individual-basedmodel (Fig. 3i and j).While it may not seem surprising that genetic drift varies
somewhat (though not an order of magnitude) between taxadue to differences in the reproductive process, we also foundthat the level of genetic drift varies among different growthconditions for the same species. Figure 4c–f show the resultsof competition experiments between two differently labelledbut otherwise identical E. coli strains (DH5a background) attwo different incubation temperatures. Notice that the neu-tral sectoring pattern undergoes a striking change: Whileonly few sectors can be observed at 37 °C, many spoke-likesectors arise at 21 °C. Importantly, surfing probabilities var-ied, as predicted, with observed variations in the strength ofgenetic drift: repeating the establishment experiments atlower temperatures shows that the number of establishedclones indeed increased for smaller amounts of genetic drift(Fig. 4g and h).
DISCUSSION
Laboratory evolution experiments usually investigate the rateof adaptation per unit time. This is the relevant quantity whenresources are abundant or replenish faster than they are con-sumed, as for example in a chemostat (Kawecki et al. 2012).By contrast, in our experiments, we have compared the
adaptive outcome of two types of population expansions,range expansion and uniform growth, under the conditionthat both types lead to the same final population size, no mat-ter how long it may take. Thus, we have effectively measuredthe rate of adaptation per cell division or, equivalently, perbiomass produced. We believe this is the crucial comparisonwhen population growth is resource-limited, which may argu-ably apply not only to microbial biofilms (Stewart & Franklin2008; Mitri et al. 2015) but also to various other types of nat-ural populations, including tumours, and spreading pathogens(Lee 2002; Ling et al. 2015).Our experiments show that, starting from standing adaptive
variation, range expansions generate a larger, often much lar-ger, mean fitness increase in microbial communities thanequivalent uniform population expansions. In essence, thisresults from the effective serial dilution of the pioneer popula-tion: the offspring of pioneers tend to be the pioneers of thenext generation. As a consequence of these spatiotemporalcorrelations, selection can act over more generations at thefront of a range expansion than in a uniform expansion.However, because the relevant pioneer population is small,
sampling effects (genetic drift) are important: The gain inadaptation comes in partial sweeps, visible in our experimentsas large ‘sectors’, which represent successfully surfing alleles.The total adaptation gain during a range expansion dependson both the number of sectors and the size of sectors. Whilethe shape of sectors simply reflects the selective advantage of
A (g)
(h)
��
��
� �
�
�
�
�
�
�
�
�
�
�
�
�
�
�
�
�
�
0.00 0.05 0.10 0.15 0.20
100
s
(a) (c) (e)
(b) (d) (f)
10-1
10-2
10-3
S. cerevisiae E. coli DH5α 21°C E. coli DH5α 37°C
Neu
tral
Com
petit
ion
P i=
0.5
, s=
0Be
nefic
ial M
utan
tsP i
= 0
.005
, s=
0.1
5
s = 0.04s = 0.09s = 0.15
1 5 10 50 1005
10
50100
5001000
Nsec s=0)/Pi(
Nse
cs)
/ Pi
(se
c/ m
utN
N
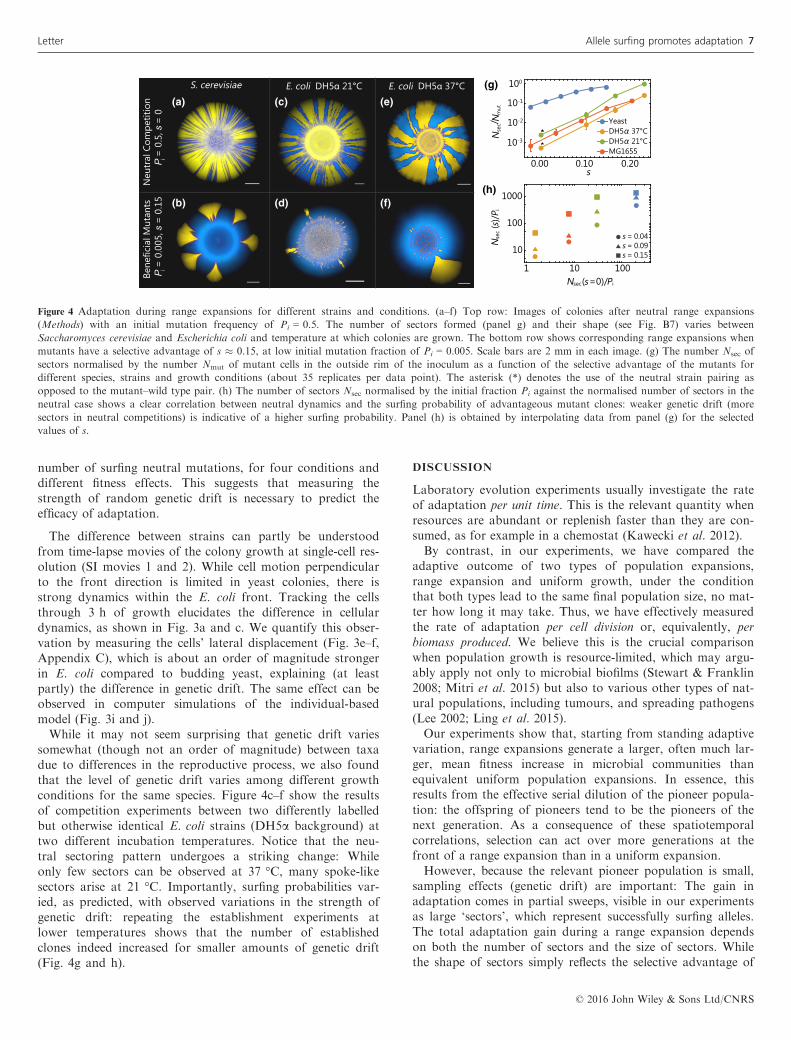
Figure 4 Adaptation during range expansions for different strains and conditions. (a–f) Top row: Images of colonies after neutral range expansions
(Methods) with an initial mutation frequency of Pi = 0.5. The number of sectors formed (panel g) and their shape (see Fig. B7) varies between
Saccharomyces cerevisiae and Escherichia coli and temperature at which colonies are grown. The bottom row shows corresponding range expansions when
mutants have a selective advantage of s � 0.15, at low initial mutation fraction of Pi = 0.005. Scale bars are 2 mm in each image. (g) The number Nsec of
sectors normalised by the number Nmut of mutant cells in the outside rim of the inoculum as a function of the selective advantage of the mutants for
different species, strains and growth conditions (about 35 replicates per data point). The asterisk (*) denotes the use of the neutral strain pairing as
opposed to the mutant–wild type pair. (h) The number of sectors Nsec normalised by the initial fraction Pi against the normalised number of sectors in the
neutral case shows a clear correlation between neutral dynamics and the surfing probability of advantageous mutant clones: weaker genetic drift (more
sectors in neutral competitions) is indicative of a higher surfing probability. Panel (h) is obtained by interpolating data from panel (g) for the selected
values of s.
© 2016 John Wiley & Sons Ltd/CNRS
Letter Allele surfing promotes adaptation 7
the mutants, the stochastic number of sectors is a result of thecompetition between selection and (strong) genetic drift in thepioneer population.Thus, predicting the number of sectors, and ultimately the
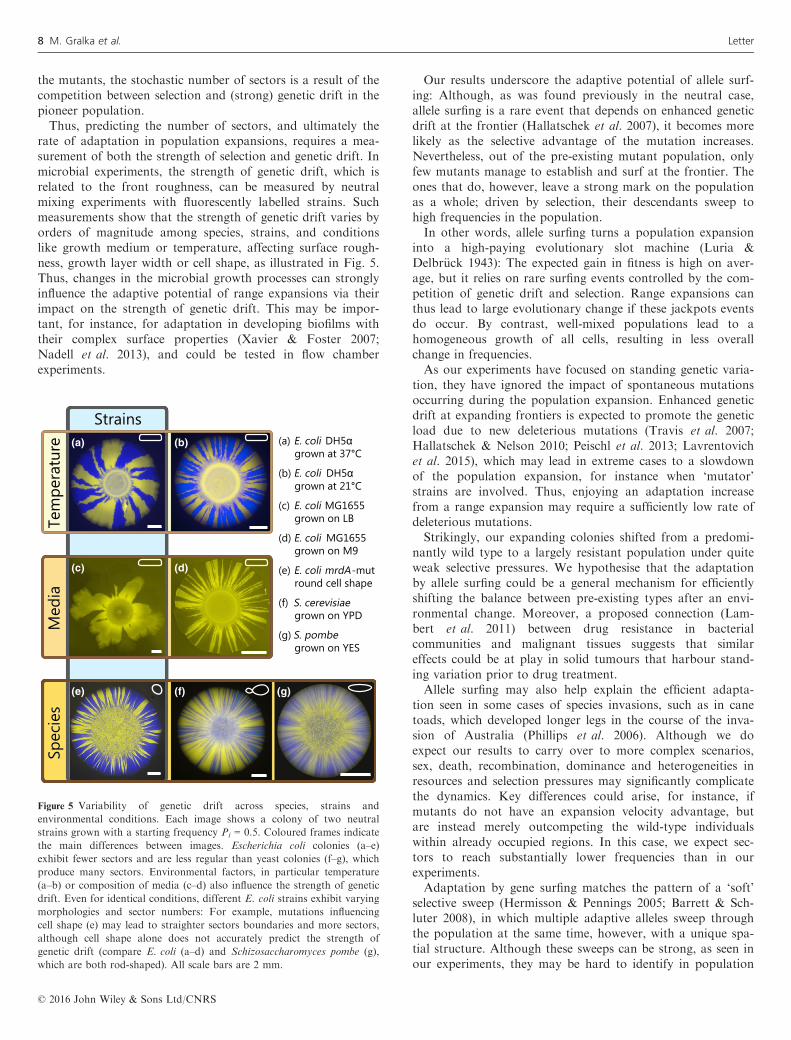
rate of adaptation in population expansions, requires a mea-surement of both the strength of selection and genetic drift. Inmicrobial experiments, the strength of genetic drift, which isrelated to the front roughness, can be measured by neutralmixing experiments with fluorescently labelled strains. Suchmeasurements show that the strength of genetic drift varies byorders of magnitude among species, strains, and conditionslike growth medium or temperature, affecting surface rough-ness, growth layer width or cell shape, as illustrated in Fig. 5.Thus, changes in the microbial growth processes can stronglyinfluence the adaptive potential of range expansions via theirimpact on the strength of genetic drift. This may be impor-tant, for instance, for adaptation in developing biofilms withtheir complex surface properties (Xavier & Foster 2007;Nadell et al. 2013), and could be tested in flow chamberexperiments.
Our results underscore the adaptive potential of allele surf-ing: Although, as was found previously in the neutral case,allele surfing is a rare event that depends on enhanced geneticdrift at the frontier (Hallatschek et al. 2007), it becomes morelikely as the selective advantage of the mutation increases.Nevertheless, out of the pre-existing mutant population, onlyfew mutants manage to establish and surf at the frontier. Theones that do, however, leave a strong mark on the populationas a whole; driven by selection, their descendants sweep tohigh frequencies in the population.In other words, allele surfing turns a population expansion
into a high-paying evolutionary slot machine (Luria &Delbr€uck 1943): The expected gain in fitness is high on aver-age, but it relies on rare surfing events controlled by the com-petition of genetic drift and selection. Range expansions canthus lead to large evolutionary change if these jackpots eventsdo occur. By contrast, well-mixed populations lead to ahomogeneous growth of all cells, resulting in less overallchange in frequencies.As our experiments have focused on standing genetic varia-
tion, they have ignored the impact of spontaneous mutationsoccurring during the population expansion. Enhanced geneticdrift at expanding frontiers is expected to promote the geneticload due to new deleterious mutations (Travis et al. 2007;Hallatschek & Nelson 2010; Peischl et al. 2013; Lavrentovichet al. 2015), which may lead in extreme cases to a slowdownof the population expansion, for instance when ‘mutator’strains are involved. Thus, enjoying an adaptation increasefrom a range expansion may require a sufficiently low rate ofdeleterious mutations.Strikingly, our expanding colonies shifted from a predomi-
nantly wild type to a largely resistant population under quiteweak selective pressures. We hypothesise that the adaptationby allele surfing could be a general mechanism for efficientlyshifting the balance between pre-existing types after an envi-ronmental change. Moreover, a proposed connection (Lam-bert et al. 2011) between drug resistance in bacterialcommunities and malignant tissues suggests that similareffects could be at play in solid tumours that harbour stand-ing variation prior to drug treatment.Allele surfing may also help explain the efficient adapta-
tion seen in some cases of species invasions, such as in canetoads, which developed longer legs in the course of the inva-sion of Australia (Phillips et al. 2006). Although we doexpect our results to carry over to more complex scenarios,sex, death, recombination, dominance and heterogeneities inresources and selection pressures may significantly complicatethe dynamics. Key differences could arise, for instance, ifmutants do not have an expansion velocity advantage, butare instead merely outcompeting the wild-type individualswithin already occupied regions. In this case, we expect sec-tors to reach substantially lower frequencies than in ourexperiments.Adaptation by gene surfing matches the pattern of a ‘soft’
selective sweep (Hermisson & Pennings 2005; Barrett & Sch-luter 2008), in which multiple adaptive alleles sweep throughthe population at the same time, however, with a unique spa-tial structure. Although these sweeps can be strong, as seen inour experiments, they may be hard to identify in population
Spec
ies
Spec
ies
Tem
pera
ture
Tem
pera
ture
Med
iaM
edia
StrainsStrains Pi
(a) (b)
(c) (d)
(e) (f) (g)
(a) E. coli DH5αgrown at 37°C
(b) E. coli DH5αgrown at 21°C
(c) E. coli MG1655 grown on LB
(d) E. coli MG1655 grown on M9
(e) E. coli mrdA -mutround cell shape
(f) S. cerevisiaegrown on YPD
(g) S. pombegrown on YES
E. coli
E. coli
E. coli
E. coli
E. coli mrdA
S. cerevisiae
S. pombe
Figure 5 Variability of genetic drift across species, strains and
environmental conditions. Each image shows a colony of two neutral
strains grown with a starting frequency Pi = 0.5. Coloured frames indicate
the main differences between images. Escherichia coli colonies (a–e)exhibit fewer sectors and are less regular than yeast colonies (f–g), whichproduce many sectors. Environmental factors, in particular temperature
(a–b) or composition of media (c–d) also influence the strength of genetic
drift. Even for identical conditions, different E. coli strains exhibit varying
morphologies and sector numbers: For example, mutations influencing
cell shape (e) may lead to straighter sectors boundaries and more sectors,
although cell shape alone does not accurately predict the strength of
genetic drift (compare E. coli (a–d) and Schizosaccharomyces pombe (g),
which are both rod-shaped). All scale bars are 2 mm.
© 2016 John Wiley & Sons Ltd/CNRS
8 M. Gralka et al. Letter
genomic studies when they carry along different genomicbackgrounds. However, as sequencing costs drop further andspatial sampling resolution increases, the genomic signal ofthese localised soft sweeps may become directly discernable.
ACKNOWLEDGEMENTS
We thank Melanie M€uller and the lab of Andrew W. Mur-ray for providing us with the unpublished strain yMM9. Wethank Laurent Excoffier and Stephan Peischl for helpful dis-cussions and a critical reading of the manuscript. Researchreported in this publication was supported by the NationalInstitute of General Medical Sciences of the National Insti-tutes of Health under Award Number R01GM115851, andby a Simons Investigator award from the Simons Founda-tion (O.H.). The content is solely the responsibility of theauthors and does not necessarily represent the official viewsof the National Institutes of Health. B.W. thanks the RoyalSociety of Edinburgh for support. This research usedresources of the National Energy Research Scientific Com-puting Center, a DOE Office of Science User Facility sup-ported by the Office of Science of the U.S. Department ofEnergy under Contract No. DE-AC02-05CH11231, and theEdinburgh Compute and Data Facility (ECDF) (http://www.ecdf.ed.ac.uk/).
AUTHORSHIP
OH, MG, FS designed study; MG, FS performed experiments.WM contributed new reagents/analytical tools; MG, OHdeveloped theory; MG, OH developed coarse-grained simula-tions; FF, BW developed individual-based simulations; MG,FF, BW, OH analysed data; MG, BW, WM, OH wrote thepaper. All authors commented on and edited the manuscript.
REFERENCES
Arenas, M., Ray, N., Currat, M. & Excoffier, L. (2012). Consequences of
range contractions and range shifts on molecular diversity. Mol. Biol.
Evol., 29, 207–218.Barrett, R.D. & Schluter, D. (2008). Adaptation from standing genetic
variation. Trends Ecol. Evol., 23, 38–44.Cho, I. & Blaser, M.J. (2012). The human microbiome: at the interface of
health and disease. Nat. Rev. Genet., 13, 260–270.Costello, E.K., Stagaman, K., Dethlefsen, L., Bohannan, B.J. & Relman,
D.A. (2012). The application of ecological theory toward an
understanding of the human microbiome. Science, 336, 1255–1262.Crow, J.F. & Kimura, M. (1965). Evolution in sexual and asexual
populations. Am. Nat., 99, 439–450.Crow, J.F. & Kimura, M. (1970). An Introduction to Population Genetics
Theory. New York, Evanston and London: Harper & Row, Publishers.
Currat, M., Ruedi, M., Petit, R.J. & Excoffier, L. (2008). The hidden side
of invasions: massive introgression by local genes. Evolution, 62, 1908–1920.
Deegan, R.D., Bakajin, O., Dupont, T.F., Huber, G., Nagel, S.R. &
Witten, T.A. (1997). Capillary flow as the cause of ring stains from
dried liquid drops. Nature, 389, 827–829.Eden, M. (1961). A two-dimensional growth process. Proceedings of the
Fourth Berkeley Symposium on Mathematical Statistics and Probability,
Contributions to Biology and Problems of Medicine. The Regents of the
University of California, University of California Press, Berkeley,
California, 4, pp. 223–239.
Edmonds, C.A., Lillie, A.S. & Cavalli-Sforza, L.L. (2004). Mutations
arising in the wave front of an expanding population. Proc. Natl Acad.
Sci. USA, 101, 975–979.Excoffier, L. & Ray, N. (2008). Surfing during population expansions
promotes genetic revolutions and structuration. Trends Ecol. Evol., 23,
347–351.Excoffier, L., Foll, M. & Petit, R.J. (2009). Genetic consequences of range
expansions. Annu. Rev. Ecol. Evol. Syst., 40, 481–501.Farrell, F.D.C., Hallatschek, O., Marenduzzo, D. & Waclaw, B. (2013).
Mechanically driven growth of quasi-two-dimensional microbial
colonies. Phys. Rev. Lett., 111, 168101.
Ferriere, R. & Legendre, S. (2013). Eco-evolutionary feedbacks, adaptive
dynamics and evolutionary rescue theory. Philos. Trans. R. Soc. Lond.
B Biol. Sci., 368, 20120081.
Freckleton, R.P. & Watkinson, A.R. (2002). Large-scale spatial dynamics
of plants: metapopulations, regional ensembles and patchy populations.
J. Ecol., 90, 419–434.Freese, P.D., Korolev, K.S., Jimenez, J.I. & Chen, I.A. (2014). Genetic
drift suppresses bacterial conjugation in spatially structured
populations. Biophys. J., 106, 944–954.van Gestel, J., Weissing, F.J., Kuipers, O.P. & Kov�acs, A.T. (2014).
Density of founder cells affects spatial pattern formation and
cooperation in Bacillus subtilis biofilms. ISME J., 8, 2069–2079.Greulich, P., Waclaw, B. & Allen, R.J. (2012). Mutational pathway
determines whether drug gradients accelerate evolution of drug-resistant
cells. Phys. Rev. Lett., 109, 088101.
Haag, C.R., Riek, M., Hottinger, J.W., Pajunen, V.I. & Ebert, D. (2005).
Genetic diversity and genetic differentiation in Daphnia
metapopulations with subpopulations of known age. Genetics, 170,
1809–1820.Hallatschek, O. & Nelson, D.R. (2008). Gene surfing in expanding
populations. Theor. Popul. Biol., 73, 158–170.Hallatschek, O. & Nelson, D.R. (2010). Life at the front of an expanding
population. Evolution, 64, 193–206.Hallatschek, O., Hersen, P., Ramanathan, S. & Nelson, D.R. (2007).
Genetic drift at expanding frontiers promotes gene segregation. Proc.
Natl Acad. Sci., 104, 19926–19930.Hanski, I. (1998). Metapopulation dynamics. Nature, 396, 41–49.Hermisson, J. & Pennings, P.S. (2005). Soft sweeps molecular population
genetics of adaptation from standing genetic variation. Genetics, 169,
2335–2352.Hermsen, R., Deris, J.B. & Hwa, T. (2012). On the rapidity of antibiotic
resistance evolution facilitated by a concentration gradient. Proc. Natl
Acad. Sci., 109, 10775–10780.Kardar, M., Parisi, G. & Zhang, Y.C. (1986). Dynamic scaling of
growing interfaces. Phys. Rev. Lett., 56, 889.
Kawecki, T.J., Lenski, R.E., Ebert, D., Hollis, B., Olivieri, I. &
Whitlock, M.C. (2012). Experimental evolution. Trends Ecol. Evol.,
27, 547–560.Klopfstein, S., Currat, M. & Excoffier, L. (2006). The fate of mutations
surfing on the wave of a range expansion. Mol. Biol. Evol., 23, 482–490.
Korolev, K.S., Xavier, J.B., Nelson, D.R. & Foster, K.R. (2011). A
quantitative test of population genetics using spatiogenetic patterns in
bacterial colonies. Am. Nat., 178, 538.
Korolev, K.S., M€uller, M.J., Karahan, N., Murray, A.W., Hallatschek,
O. & Nelson, D.R. (2012). Selective sweeps in growing microbial
colonies. Phys. Biol., 9, 026008.
Lambert, G., Est�evez-Salmeron, L., Oh, S., Liao, D., Emerson, B.M.,
Tlsty, T.D. et al. (2011). An analogy between the evolution of drug
resistance in bacterial communities and malignant tissues. Nat. Rev.
Cancer, 11, 375–382.Lavrentovich, M., Wahl, M.E., Murray, A.W. & Nelson, D.R. (2015).
Spatially-constrained growth enhances conversional meltdown. bioRxiv,
027292.
Lee, C.E. (2002). Evolutionary genetics of invasive species. Trends Ecol.
Evol., 17, 386–391.
© 2016 John Wiley & Sons Ltd/CNRS
Letter Allele surfing promotes adaptation 9
Ling, S., Hu, Z., Yang, Z., Yang, F., Li, Y., Lin, P. et al. (2015).
Extremely high genetic diversity in a single tumor points to prevalence
of non-Darwinian cell evolution. Proc. Natl Acad. Sci., 112, E6496–E6505.
Luria, S.E. & Delbr€uck, M. (1943). Mutations of bacteria from virus
sensitivity to virus resistance. Genetics, 28, 491.
Maruyama, T. (1970). On the fixation probability of mutant genes in a
subdivided population. Genet. Res., 15, 221–225.Mitri, S., Clarke, E. & Foster, K.R. (2015). Resource limitation drives
spatial organization in microbial groups. The ISME Journal, 10, 1471–1482.
Muller, H.J. (1932). Some genetic aspects of sex. Am. Nat., 66, 118–138.Nadell, C.D., Foster, K.R. & Xavier, J.B. (2010). Emergence of spatial
structure in cell groups and the evolution of cooperation. PLoS
Comput. Biol., 6, e1000716.
Nadell, C.D., Bucci, V., Drescher, K., Levin, S.A., Bassler, B.L. &
Xavier, J.B. (2013). Cutting through the complexity of cell collectives.
Proceedings of the Royal Society of London B: Biological Sciences, 280,
20122770.
Patwa, Z. & Wahl, L.M. (2008). The fixation probability of beneficial
mutations. J. R. Soc. Interface, 5, 1279–1289.Peischl, S. & Excoffier, L. (2015). Expansion load: recessive mutations
and the role of standing genetic variation. Mol. Ecol., 24, 2084–2094.Peischl, S., Dupanloup, I., Kirkpatrick, M. & Excoffier, L. (2013). On the
accumulation of deleterious mutations during range expansions. Mol.
Ecol., 22, 5972–5982.Phillips, B.L., Brown, G.P., Webb, J.K. & Shine, R. (2006). Invasion and
the evolution of speed in toads. Nature, 439, 803.
Stewart, P.S. & Franklin, M.J. (2008). Physiological heterogeneity in
biofilms. Nat. Rev. Microbiol., 6, 199–210.
Taylor, D.R. & Keller, S.R. (2007). Historical range expansion determines
the phylogenetic diversity introduced during contemporary species
invasion. Evolution, 61, 334–345.Travis, J.M., M€unkem€uller, T., Burton, O.J., Best, A., Dytham, C. &
Johst, K. (2007). Deleterious mutations can surf to high densities on
the wave front of an expanding population. Mol. Biol. Evol., 24,
2334–2343.Waters, J.M., Fraser, C.I. & Hewitt, G.M. (2013). Founder takes all:
density-dependent processes structure biodiversity. Trends Ecol. Evol.,
28, 78–85.Xavier, J.B. & Foster, K.R. (2007). Cooperation and conflict in microbial
biofilms. Proc. Natl Acad. Sci., 104, 876–881.Zhang, Q., Lambert, G., Liao, D., Kim, H., Robin, K., Tung, C.K. et al.
(2011). Acceleration of emergence of bacterial antibiotic resistance in
connected microenvironments. Science, 333, 1764–1767.
SUPPORTING INFORMATION
Additional Supporting Information may be found online inthe supporting information tab for this article.
Editor, Bernd BlasiusManuscript received 6 January 2016First decision made 8 February 2016Second decision made 15 April 2016Manuscript accepted 18 April 2016
© 2016 John Wiley & Sons Ltd/CNRS
10 M. Gralka et al. Letter