Embed Size (px)
Citation preview


Letter From the Editor
This issue of the State of the Internet report marks the beginning of the fifth year of the report’s publication.
With the start of this fifth volume, we are taking the opportunity to introduce some changes to the report:
• The report has defined “broadband” as connections to Akamai at speeds of 2 Mbps or greater for the last
four years. Going forward, we are revising the definition with a 4 Mbps threshold. This brings it into line
with the definition used as part of the United States National Broadband Plan, as well as with target speeds
in the European Union and China.
• The report has defined “high broadband” as connections to Akamai at speeds of 5 Mbps or greater for the
last four years. Going forward, we are revising the definition with a 10 Mbps threshold. Many countries and
regions (such as the European Union) have longer-term connection speed targets in the tens or hundreds of
Mbps, gigabit projects are underway in many countries, and in countries with established broadband infra-
structure and multiple service providers, advertised service tiers above 10 Mbps are generally affordable by
most subscribers. As such, we believe our revised definition aligns well with the current state of connectivity,
and should accommodate expected future growth and improvements in Internet connectivity.
• The report has defined “narrowband” as connections to Akamai at speeds of 256 kbps or below.
As connection speeds continue to increase globally, especially in countries with developing infrastructure,
the number of connections that Akamai sees at these levels continues to decline. As such, we have
decided to remove narrowband adoption statistics from the report going forward.
• The report will also no longer include city-level data due to the level of manual effort required to review the
data. In addition, the report will also no longer include insight into attack traffic originating from mobile net-
works, as we work behind the scenes to enhance and expand the data sources used to identify such traffic.
We expect to continue to make additional changes, additions, and improvements across the remaining 2012 issues,
as outlined in last quarter’s “Letter From The Editor”.
In line with our goal of moving more of the State of the Internet online, Akamai is also working to make additional
insights from our platform available through “Akamai IO,” a destination site that strives to deepen understanding
of the Akamai Intelligent Platform through data and visualizations derived from usage of the platform by thousands
of enterprise customers and millions of end users around the world. Akamai IO is available at www.akamai.com/io;
it includes an initial data set that highlights browser usage across PC and mobile devices, connecting via fixed and
mobile networks.
As always, if you have questions, comments, or suggestions about the State of the Internet report, connect with
us via e-mail at [email protected], or on Twitter at @akamai_soti.
– David Belson

4 © 2012 Akamai Technologies, Inc. All Rights Reserved
Table of Contents
EXECUTIVE SUMMARY 5
SECTION 1: SECURITY 6
1.1 Attack Traffic, Top Originating Countries 6
1.2 Attack Traffic, Top Ports 7
1.3 SSL Insight, Client-Side Ciphers 7
1.4 Observed Denial-of-Service (DoS) Attack Activity 8
SECTION 2: INTERNET PENETRATION 9
2.1 Unique IPv4 Addresses 9
2.2 IPv4 Exhaustion 10
2.3 IPv6 Adoption 10
SECTION 3: GEOGRAPHY – GLOBAL 13
3.1 Global Average Connection Speeds 13
3.2 Global Average Peak Connection Speeds 14
3.3 Global High Broadband Connectivity 15
3.4 Global Broadband Connectivity 16
SECTION 4: GEOGRAPHY – UNITED STATES 17
4.1 United States Average Connection Speeds 17
4.2 United States Average Peak Connection Speeds 18
4.3 United States High Broadband Connectivity 19
4.4 United States Broadband Connectivity 20
SECTION 5: GEOGRAPHY – ASIA PACIFIC REGION 21
5.1 Asia Pacific Average Connection Speeds 21
5.2 Asia Pacific Average Peak Connection Speeds 22
5.3 Asia Pacific High Broadband Connectivity 23
5.4 Asia Pacific Broadband Connectivity 24
SECTION 6: GEOGRAPHY – EMEA 25
6.1 EMEA Connection Speeds 25
6.2 EMEA Average Peak Connection Speeds 26
6.3 EMEA High Broadband Connectivity 27
6.4 EMEA Broadband Connectivity 28
SECTION 7: MOBILE CONNECTIVITY 29
7.1 Connection Speeds on Mobile Networks 29
7.2 Mobile Traffic Growth As Observed By Ericsson 31
7.3 Traffic Variation By Application and Data Plan 32
SECTION 8: INTERNET DISRUPTIONS 33
8.1 Iran 33
8.2 Australia 33
SECTION 9: APPENDIX 35
SECTION 10: ENDNOTES 36
5© 2012 Akamai Technologies, Inc. All Rights Reserved
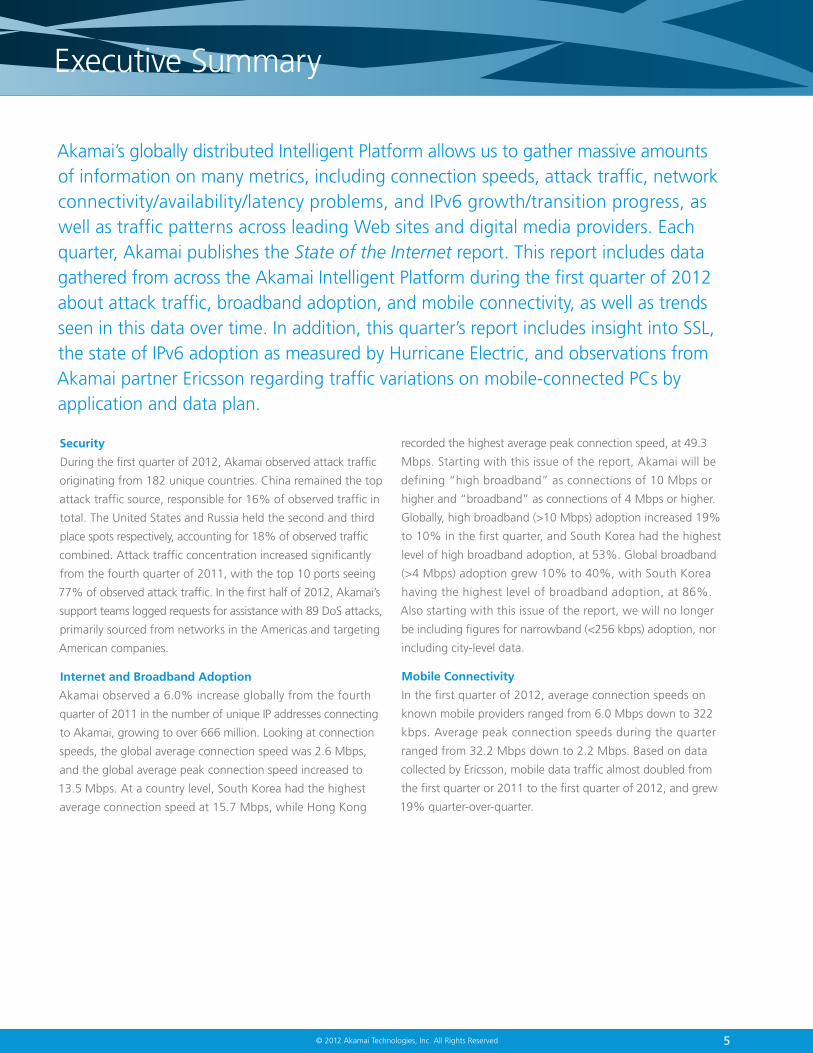
Akamai’s globally distributed Intelligent Platform allows us to gather massive amounts of information on many metrics, including connection speeds, attack traffic, network connectivity/availability/latency problems, and IPv6 growth/transition progress, as well as traffic patterns across leading Web sites and digital media providers. Each quarter, Akamai publishes the State of the Internet report. This report includes data gathered from across the Akamai Intelligent Platform during the first quarter of 2012 about attack traffic, broadband adoption, and mobile connectivity, as well as trends seen in this data over time. In addition, this quarter’s report includes insight into SSL, the state of IPv6 adoption as measured by Hurricane Electric, and observations from Akamai partner Ericsson regarding traffic variations on mobile-connected PCs by application and data plan.
Security
During the first quarter of 2012, Akamai observed attack traffic
originating from 182 unique countries. China remained the top
attack traffic source, responsible for 16% of observed traffic in
total. The United States and Russia held the second and third
place spots respectively, accounting for 18% of observed traffic
combined. Attack traffic concentration increased significantly
from the fourth quarter of 2011, with the top 10 ports seeing
77% of observed attack traffic. In the first half of 2012, Akamai’s
support teams logged requests for assistance with 89 DoS attacks,
primarily sourced from networks in the Americas and targeting
American companies.
Internet and Broadband Adoption
Akamai observed a 6.0% increase globally from the fourth
quarter of 2011 in the number of unique IP addresses connecting
to Akamai, growing to over 666 million. Looking at connection
speeds, the global average connection speed was 2.6 Mbps,
and the global average peak connection speed increased to
13.5 Mbps. At a country level, South Korea had the highest
average connection speed at 15.7 Mbps, while Hong Kong
recorded the highest average peak connection speed, at 49.3
Mbps. Starting with this issue of the report, Akamai will be
defining “high broadband” as connections of 10 Mbps or
higher and “broadband” as connections of 4 Mbps or higher.
Globally, high broadband (>10 Mbps) adoption increased 19%
to 10% in the first quarter, and South Korea had the highest
level of high broadband adoption, at 53%. Global broadband
(>4 Mbps) adoption grew 10% to 40%, with South Korea
having the highest level of broadband adoption, at 86%.
Also starting with this issue of the report, we will no longer
be including figures for narrowband (<256 kbps) adoption, nor
including city-level data.
Mobile Connectivity
In the first quarter of 2012, average connection speeds on
known mobile providers ranged from 6.0 Mbps down to 322
kbps. Average peak connection speeds during the quarter
ranged from 32.2 Mbps down to 2.2 Mbps. Based on data
collected by Ericsson, mobile data traffic almost doubled from
the first quarter or 2011 to the first quarter of 2012, and grew
19% quarter-over-quarter.
Executive Summary

6 © 2012 Akamai Technologies, Inc. All Rights Reserved
SECTION 1:
Security
Akamai maintains a distributed set of agents deployed across the Internet that monitor attack traffic. Based on data collected by these agents, Akamai is able to identify the top countries from which attack traffic originates, as well as the top ports targeted by these attacks. (Ports are network-level protocol identifiers.) This section provides insight into port-level attack traffic, as observed and measured by Akamai, during the first quarter of 2012. It also provides insight into trends related to the usage of client-side ciphers for SSL connections to Akamai, as well as insight into application-layer Distributed Denial of Service (DDoS) activity observed on the Akamai Platform.
3
19
Figure 1: Attack Traffic, Top Originating Countries
1 China 16% 13%
2 United States 11% 10%
3 Russia 7.0% 6.8%
4 Turkey 5.7% 5.6%
5 Taiwan 5.3% 7.5%
6 South Korea 4.3% 5.2%
7 Brazil 4.0% 4.4%
8 Romania 3.0% 2.6%
9 India 3.0% 3.0%
10 Germany 1.9% 1.8%
– Other 39% 35%
Q4 ‘11 %Q1 ‘12 % TrafficCountry
2
8
7
4
10
5
6
1.1 Attack Traffic, Top Originating Countries
During the first quarter of 2012, Akamai observed attack traffic
originating from 182 unique countries/regions, down from 187
in the prior quarter. After spending the prior two quarters in the
top three, Indonesia fell to twentieth place this quarter, respon-
sible for just one percent of observed traffic, likely indicating
that the threats seen from the country have shifted elsewhere,
or that they have been largely mitigated. With Indonesia gone
from the top 10, Germany moved back into the tenth place spot,
as shown in Figure 1, responsible for just under two percent
of observed attack traffic. Aside from Germany, the other nine
countries in the top 10 remained consistent with the fourth
quarter of 2011. Quarterly growth in the percentage of observed
attack traffic was seen in China, the United States, Russia, Turkey,
Romania, and Germany, while Taiwan, South Korea, and Brazil
all saw percentages drop relative to the prior quarter.
In examining the regional distribution of observed attack traffic
in the first quarter, we found that over 42% originated in the
Asia Pacific/Oceania region, 35% in Europe, 21% in North and
South America, and just under 1.5% came from Africa.
DID YOU KNOW?
Over the last four years:
• The United States has been responsible
for as little as 6.9% and as much
as 22.9% of observed attack traffic.
• The highest concentration of observed
attack traffic was seen in China, which
originated 26.9% back in the third
quarter of 2008.
• Among major South American countries,
Brazil has originated the most observed
attack traffic.

7© 2012 Akamai Technologies, Inc. All Rights Reserved
1.2 Attack Traffic, Top Ports
As shown in Figure 2, attack traffic concentration among the
top 10 ports increased significantly in the first quarter of 2012,
with these ports responsible for 77% of observed attacks, up
from 62% in the fourth quarter of 2011. It appears that this
increase is largely attributable to significant growth in the
percentage of attacks targeting Port 445, after seeing declines
over the prior several quarters. As has been noted multiple
times in past reports, Port 445 is associated with the Confick-
er worm, which caused significant alarm back in early 2009.
Despite patches issued by Microsoft and mitigation activities
by the Conficker Working Group, it appears that the worm/
botnet is still actively infecting user systems. According to a
statement from Microsoft, Conficker infected or tried to infect
1.7 million computers running Windows operating systems in
the fourth quarter of 2011, an increase of 100,000 from the
previous quarter.1 (Figures for the first quarter of 2012 were
not available as of the date of publication.)
In addition to the increase seen in the percentage of attack
traffic targeting Port 445, increases were also seen for Port 23
(Telnet), Port 3389 (Microsoft Terminal Services), Port 22 (SSH),
Port 4899 (Remote Administrator), Port 5900 (Virtual Network
Computer), and Port 3306 (MySQL). The relative increases
seen were fairly significant across most of these ports, ranging
from 16% to 114%. MySQL may have been targeted more
in the first quarter due to a vulnerability that was published
in January, which allowed attackers to crash MySQL instances
running on Microsoft Windows servers by sending a special
packet to Port 3306.2 In March, Microsoft published3 an advisory
on a vulnerability in its Remote Desktop software, which,
according to4 security vendors, can be exploited by connec-
tions to Port 3389. Attempts to exploit this vulnerability may
be responsible for the increase in attacks targeting Port 3389.
In past issues of the State of the Internet report, we have
highlighted similar behavior, where attacks targeting a specific
port increased during the same quarter in which related
vulnerabilities are discovered/published.
Unsurprisingly, Port 445 was the most attacked port in seven
of the top 10 countries, accounting for as many as 66 times
(in Romania) the number of attacks seen by the next most
targeted port. Port 23 continued to be the most targeted port
in South Korea and Turkey, while Port 1433 remained the top
target for observed attacks originating in China. In the United
States, Germany, and Brazil, Port 80 was the second-most
targeted port, likely indicating that attackers were search-
ing for the presence of Web-based applications with known
vulnerabilities that could be exploited to gain control of the
system or to install malware. In Russia and Taiwan, Port 23
was the second-most targeted port, likely indicating attempts
to exploit default or common passwords that would allow
attackers to gain access to a system.
1.3 SSL Insight, Client-Side Ciphers
In addition to the large number of requests for content that
Akamai serves over HTTP (Port 80), the Akamai Intelligent
Platform also services millions of requests per second for secure
content over HTTPS/SSL (Port 443). This massive volume of
encrypted traffic provides Akamai with a unique perspective
on the client-side SSL ciphers that are in popular use, as well
as their usage trends over time. The statistics presented in this
section are for SSLv3 and TLSv1.
MySQL 1.4% Virtual Network Computer 1.5% Remote Administrator 1.6%
Microsoft RPC 1.6% SSH 3.4%
Microsoft Terminal Services 4.6%Microsoft SQL Sever 4.9%
Microsoft<MWWW (HTTP) 5%
Figure 2: Attack Traffic, Top Ports
445 Microsoft-DS 42% 25%
23 Telnet 11% 6.3%
80 WWW (HTTP) 5.0% 8.3%
1433 Microsoft SQL Server 4.9% 12%
3389 Microsoft Terminal Services 4.6% 3.0%
22 SSH 3.4% 2.7%
135 Microsoft-RPC 1.6% 1.6%
4899 Remote Administrator 1.6% 0.9%
5900 Virtual Network Computer 1.5% 0.7%
3306 MySQL 1.4% 1.2%
Various Other 23% –
Q4 ‘11 %Q1 ‘12 % TrafficPort UsePort
Telnet 11%
Other 23%
Microsoft-DS 42%
8 © 2012 Akamai Technologies, Inc. All Rights Reserved
SECTION 1:
Security (continued)
Looking at the set of DoS attacks where customers engaged
Akamai for additional assistance, online retailers and public
sector (government) sites were targeted in roughly equal
proportion, each seeing approximately 20% of these reported
attacks. Historically, online retailers have been tempting targets
for extortion efforts, with some being targeted by attacks that
promise to return if demands for money are not met. The Public
Sector has largely been targeted by protestors, a trend that
shows little indication of changing in the near future. The
remaining attacks were nearly evenly distributed between
Digital Media, Enterprise and High Tech customers. Perhaps
unsurprisingly, once a site has become a target, it is almost a
given that attackers will return again in the future in an attempt
to further their agendas.
Note that the set of attacks reviewed here does not constitute
the full set of attacks experienced by Akamai customers. Because
Akamai drops network-level attacks at the edge of the Internet
(typically 80% or more of DoS attacks), customer sites do not
experience service interruptions or other negative impacts from
these attacks. Other customer sites may have experienced
volumetric or application-level DoS attacks during 2012 but
were able to mitigate the impact of the attacks through the use
of Akamai’s Kona Security Solutions; alternatively, targeted cus-
tomers may have chosen not to engage with Akamai’s support
teams in relation to an attack.
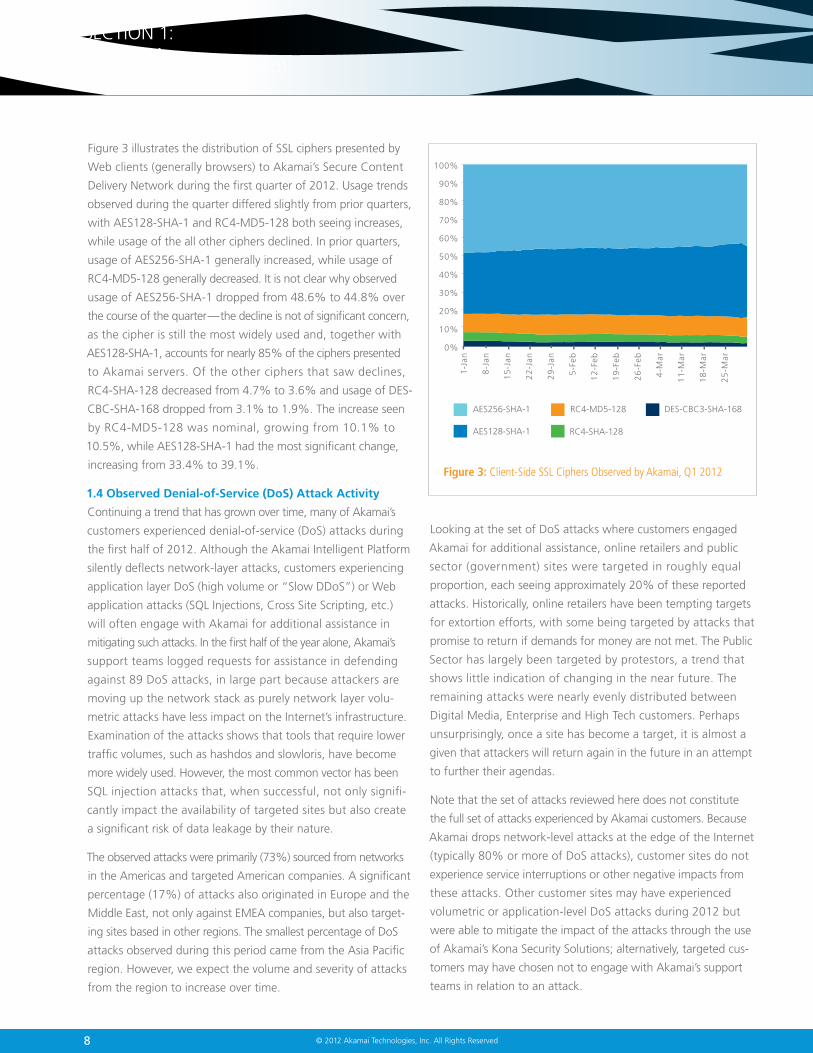
Figure 3: Client-Side SSL Ciphers Observed by Akamai, Q1 2012
AES256-SHA-1
AES128-SHA-1
RC4-MD5-128
RC4-SHA-128
DES-CBC3-SHA-168
1-J
an
8-J
an
15
-Jan
22
-Jan
29
-Jan
5-F
eb
12
-Feb
19
-Feb
26
-Feb
4-M
ar
11
-Mar
18
-Mar
25
-Mar
100%
90%
80%
70%
60%
50%
40%
30%
20%
10%
0%
Figure 3 illustrates the distribution of SSL ciphers presented by
Web clients (generally browsers) to Akamai’s Secure Content
Delivery Network during the first quarter of 2012. Usage trends
observed during the quarter differed slightly from prior quarters,
with AES128-SHA-1 and RC4-MD5-128 both seeing increases,
while usage of the all other ciphers declined. In prior quarters,
usage of AES256-SHA-1 generally increased, while usage of
RC4-MD5-128 generally decreased. It is not clear why observed
usage of AES256-SHA-1 dropped from 48.6% to 44.8% over
the course of the quarter — the decline is not of significant concern,
as the cipher is still the most widely used and, together with
AES128-SHA-1, accounts for nearly 85% of the ciphers presented
to Akamai servers. Of the other ciphers that saw declines,
RC4-SHA-128 decreased from 4.7% to 3.6% and usage of DES-
CBC-SHA-168 dropped from 3.1% to 1.9%. The increase seen
by RC4-MD5-128 was nominal, growing from 10.1% to
10.5%, while AES128-SHA-1 had the most significant change,
increasing from 33.4% to 39.1%.
1.4 Observed Denial-of-Service (DoS) Attack Activity
Continuing a trend that has grown over time, many of Akamai’s
customers experienced denial-of-service (DoS) attacks during
the first half of 2012. Although the Akamai Intelligent Platform
silently deflects network-layer attacks, customers experiencing
application layer DoS (high volume or “Slow DDoS”) or Web
application attacks (SQL Injections, Cross Site Scripting, etc.)
will often engage with Akamai for additional assistance in
mitigating such attacks. In the first half of the year alone, Akamai’s
support teams logged requests for assistance in defending
against 89 DoS attacks, in large part because attackers are
moving up the network stack as purely network layer volu-
metric attacks have less impact on the Internet’s infrastructure.
Examination of the attacks shows that tools that require lower
traffic volumes, such as hashdos and slowloris, have become
more widely used. However, the most common vector has been
SQL injection attacks that, when successful, not only signifi-
cantly impact the availability of targeted sites but also create
a significant risk of data leakage by their nature.
The observed attacks were primarily (73%) sourced from networks
in the Americas and targeted American companies. A significant
percentage (17%) of attacks also originated in Europe and the
Middle East, not only against EMEA companies, but also target-
ing sites based in other regions. The smallest percentage of DoS
attacks observed during this period came from the Asia Pacific
region. However, we expect the volume and severity of attacks
from the region to increase over time.
9© 2012 Akamai Technologies, Inc. All Rights Reserved
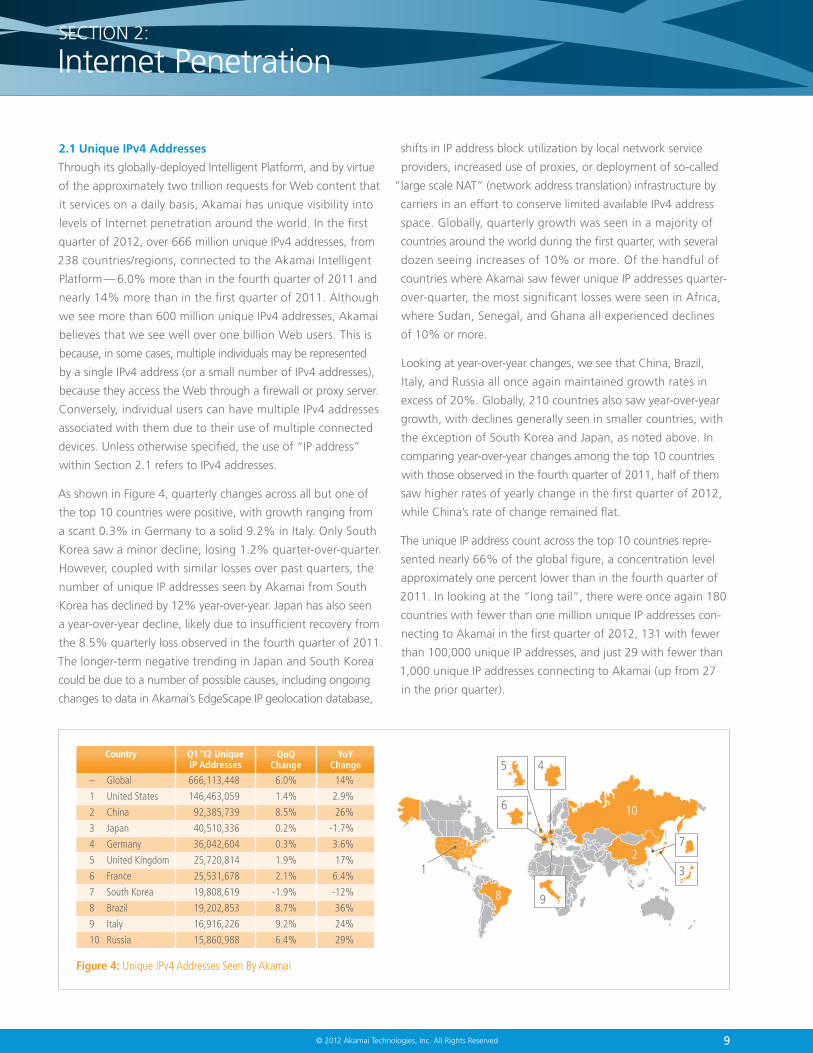
2.1 Unique IPv4 Addresses
Through its globally-deployed Intelligent Platform, and by virtue
of the approximately two trillion requests for Web content that
it services on a daily basis, Akamai has unique visibility into
levels of Internet penetration around the world. In the first
quarter of 2012, over 666 million unique IPv4 addresses, from
238 countries/regions, connected to the Akamai Intelligent
Platform — 6.0% more than in the fourth quarter of 2011 and
nearly 14% more than in the first quarter of 2011. Although
we see more than 600 million unique IPv4 addresses, Akamai
believes that we see well over one billion Web users. This is
because, in some cases, multiple individuals may be represented
by a single IPv4 address (or a small number of IPv4 addresses),
because they access the Web through a firewall or proxy server.
Conversely, individual users can have multiple IPv4 addresses
associated with them due to their use of multiple connected
devices. Unless otherwise specified, the use of “IP address”
within Section 2.1 refers to IPv4 addresses.
As shown in Figure 4, quarterly changes across all but one of
the top 10 countries were positive, with growth ranging from
a scant 0.3% in Germany to a solid 9.2% in Italy. Only South
Korea saw a minor decline, losing 1.2% quarter-over-quarter.
However, coupled with similar losses over past quarters, the
number of unique IP addresses seen by Akamai from South
Korea has declined by 12% year-over-year. Japan has also seen
a year-over-year decline, likely due to insufficient recovery from
the 8.5% quarterly loss observed in the fourth quarter of 2011.
The longer-term negative trending in Japan and South Korea
could be due to a number of possible causes, including ongoing
changes to data in Akamai’s EdgeScape IP geolocation database,
shifts in IP address block utilization by local network service
providers, increased use of proxies, or deployment of so-called
“large scale NAT” (network address translation) infrastructure by
carriers in an effort to conserve limited available IPv4 address
space. Globally, quarterly growth was seen in a majority of
countries around the world during the first quarter, with several
dozen seeing increases of 10% or more. Of the handful of
countries where Akamai saw fewer unique IP addresses quarter-
over-quarter, the most significant losses were seen in Africa,
where Sudan, Senegal, and Ghana all experienced declines
of 10% or more.
Looking at year-over-year changes, we see that China, Brazil,
Italy, and Russia all once again maintained growth rates in
excess of 20%. Globally, 210 countries also saw year-over-year
growth, with declines generally seen in smaller countries, with
the exception of South Korea and Japan, as noted above. In
comparing year-over-year changes among the top 10 countries
with those observed in the fourth quarter of 2011, half of them
saw higher rates of yearly change in the first quarter of 2012,
while China’s rate of change remained flat.
The unique IP address count across the top 10 countries repre-
sented nearly 66% of the global figure, a concentration level
approximately one percent lower than in the fourth quarter of
2011. In looking at the “long tail”, there were once again 180
countries with fewer than one million unique IP addresses con-
necting to Akamai in the first quarter of 2012, 131 with fewer
than 100,000 unique IP addresses, and just 29 with fewer than
1,000 unique IP addresses connecting to Akamai (up from 27
in the prior quarter).
SECTION 2:
Internet Penetration
Figure 4: Unique IPv4 Addresses Seen By Akamai
– Global 666,113,448 6.0% 14%
1 United States 146,463,059 1.4% 2.9%
2 China 92,385,739 8.5% 26%
3 Japan 40,510,336 0.2% -1.7%
4 Germany 36,042,604 0.3% 3.6%
5 United Kingdom 25,720,814 1.9% 17%
6 France 25,531,678 2.1% 6.4%
7 South Korea 19,808,619 -1.9% -12%
8 Brazil 19,202,853 8.7% 36%
9 Italy 16,916,226 9.2% 24%
10 Russia 15,860,988 6.4% 29%
YoY Change
QoQ Change
Q1 ‘12 Unique IP Addresses
Country4
8
2
10
3
7
6
5
1
9

10 © 2012 Akamai Technologies, Inc. All Rights Reserved
As more end-user networks roll out native IPv6 connectivity
to their subscribers, and as more popular content is made
available over IPv6, the number of unique IPv4 addresses
making requests to Akamai from a given network provider
may decline. Over the long-term, we expect measurements
to show movement of unique addresses from IPv4-based
to IPv6-based.
2.2 IPv4 Exhaustion
The number of available IPv4 addresses continued to decline
during the first quarter of 2012, as Regional Internet Registries
(RIRs) continued to assign/allocate blocks of address space to
requesting organizations within their respective territories.5
Based on data published by the RIRs,6 Figure 5 compares the
total volume of IPv4 addresses assigned/allotted during the first
quarter with the number of requests for address space.
As the figure illustrates, RIPE (Europe) was the most active RIR,
fielding over 1,400 requests for address space, assigning/allocating
over 13.5 million IPv4 addresses in response. This address
volume was surpassed only by ARIN (North America), which
allotted over 14.7 million IPv4 addresses in response to 35% as
many requests as seen in Europe. The volume of requests seen
by AFRINIC (Africa), APNIC (Asia Pacific) and LACNIC (Latin and
South America) were all below those seen by ARIN and RIPE,
as were the total volume of IPv4 addresses assigned/allocated.
RIRs in the Americas gave out, on average, the largest number
of IPv4 addresses in response to a request, at over 50,000 per
request from LACNIC, and nearly 30,000 per request from
ARIN. RIPE gave out an average of over 9,600 IPv4 addresses
per request, while AFRINIC gave out an average of just over
5,000 per request. APNIC distributed an average of just over
2,000 IPv4 addresses per request. It is not surprising that APNIC’s
average was the lowest, as the RIR has been in “austerity mode”
since the first quarter of 2011, placing significant limits on the
amount of IPv4 address space that can be requested.
Secondary market sales of IPv4 address space continued to take
place in the first quarter. For example, as of March 31, ARIN had
recorded the transfer of 88 IPv4 address blocks totaling more
than 4 million IPv4 addresses, with two of these transfers involv-
ing more than 1 million IPv4 addresses each. Similar transfers
may increase in coming quarters if ARIN and the other regional
registries agree to a proposed policy change that would allow
IPv4 address transfers between regions.7 This could potentially
allow providers under APNIC, for example, to ease their address
space crunch by obtaining addresses from organizations under
ARIN that hold larger blocks. While the adoption of IPv6 continues
to increase, organizations will need IPv4 address space
to accommodate continued growth in the short term.
2.3 IPv6 Adoption
As Akamai rolls out IPv6 support across its solution portfolio
throughout 2012, we will endeavor to include data in the State
of the Internet report on IPv6 adoption based on the analysis of
IPv6 requests to, and traffic delivered by, the Akamai Intelligent
Platform. However, until such time as we can include compre-
hensive Akamai data on IPv6 adoption, we will continue to look
to third-party data.
One helpful source of IPv6 information is Hurricane Electric,
which provides Internet transit, Web hosting, and collocation
services and notes that it is “considered the largest IPv6 backbone
in the world as measured by number of networks connected.”8
A white paper9 available from Hurricane Electric notes that it
has operated IPv6 network elements since 2000 and that it
implemented extensive native IPv6 peering in early 2006 as a
SECTION 2:
Internet Penetration (continued)
Figure 5: IPv4 Address Allocation/Assigment by RIR, Q1 2012
AFRINIC APNIC ARIN LACNIC RIPE
16
14
12
10
8
6
4
2
0
Mill
ion
s o
f A
dd
ress
es
1600
1400
1200
1000
800
600
400
200
0
Assig
nm
ents/A
llotm
ents

11© 2012 Akamai Technologies, Inc. All Rights Reserved
result of a core router and backbone upgrade. Hurricane Electric
also publishes the output of a set of measurement tools on its
“Global IPv6 Deployment Progress Report” page, available
at http://bgp.he.net/ipv6-progress-report.cgi.
In contrast to previous reports, going forward we will only be
reviewing the “IPv6 ASes” metric, dropping the “ASes using
only IPv6” metric due to lack of relevance. (Networks connected
only via IPv6 are generally special-purpose or research networks.)
While the “IPv6 ASes” metric provides some perspective around
IPv6 adoption, it is also important to recognize that not all
autonomous systems are equivalent. That is, IPv6 adoption on
an autonomous system that is associated with a large number
of end users/subscribers is ultimately more meaningful and
impactful for measuring the ultimate success of IPv6 than adoption
by an autonomous system that is not directly associated with
end user connectivity/traffic.
Figure 6 illustrates the growth in the number of ASes in the
global IPv6 routing table during the first quarter of 2012,
comparing it to the first quarters of the previous three years as
well. As shown in the figure, the 10% rate of growth seen in
the first quarter of 2012 was half that seen during the same
period in 2011; the net increase in the number of IPv6 ASes
was lower as well — 489 more during the first quarter of 2012
versus 589 more during the first quarter of 2011. 2012’s rate
of growth was the lowest of the past three years, with 2010
seeing growth of 12% and 2009 seeing growth of 11%. RIPE
Labs, associated with the European RIR, examined the percent-
age of IPv6-enabled networks across all global regions and also
observed that their graphs for most regions show some flat-
tening after a rather steep increase earlier last year (around the
time the IANA allocated the last IPv4 address space to the RIRs).10
We do not believe, however, that the lower growth rate seen
during the first quarter portends slowing IPv6 adoption. With
a larger baseline, higher growth rates become harder to achieve
and maintain and, in 2011, growth ramped significantly as the
Internet prepared for World IPv6 Day. It appears that a similar
acceleration of growth started to occur at the end of the first
quarter — the hook at the end of the 2012 line represents the
addition of 210 ASes to the IPv6 routing table during the last
day of the quarter. Furthermore, cable providers in the United
States, including Comcast, Time Warner Cable, and Cox are
all pursuing aggressive plans to bring subscribers onto IPv6
capable networks over the course of 2012.11
Also critically important to driving adoption is the availability of
content over IPv6. There are various measures of site readiness
and content availability:
Figure 6: Total Number of Autonomous Systems in the IPv6 Routing Table
2012201120102009
6000
5000
4000
3000
2000
1000
0
1-Ja
n
8-Ja
n
15-J
an
22-J
an
29-J
an
5-Fe
b
12-F
eb
19-F
eb
26-F
eb
4-M
ar
11-M
ar
18-M
ar
25-M
ar

12 © 2012 Akamai Technologies, Inc. All Rights Reserved
SECTION 2:
Internet Penetration (continued)
• Hurricane Electric makes use of Alexa’s Top 1 Million Domains
list, providing insight into “Top Websites Running IPv6”
at http://bgp.he.net/ipv6-progress-report.cgi
• The United States National Institute of Standards and Technology
(NIST) tracks the IPv6 availability of Web sites for key U.S.
government agencies, colleges and universities, and
top “industry” organizations (enterprises) at
http://usgv6-deploymon.antd.nist.gov/. NIST also tracks the avail-
ability of DNS and mail servers over IPv6 for these organizations.
Akamai is enabling customers to make their content and
applications available over IPv6 by including IPv6 support in
newer solution families, as well as through IPv6 support mod-
ules available to customers using older solutions. Akamai’s IPv6
White Paper and a visualization of current and historical
IPv6 traffic volumes on the Akamai Intelligent Platform are
available at http://www.akamai.com/ipv6.
DID YOU KNOW?
• According to network security and monitor-
ing firm Arbor Networks, this year marked the
first time that respondents to the survey gath-
ering data for the Worldwide Infrastructure
Security Report VII indicated that they had
observed DDoS attacks on their networks. [Source: http://www.arbornetworks.com/report]
• In January, the Internet Society announced
plans to hold the World IPv6 Launch event
on June 6, 2012, with commitments from
participating ISPs to enable IPv6 connectivity
for at least 1% of wireline residential
subscribers, from participating home
networking equipment manufacturers to
enable IPv6 by default through the range
of their home router products, and from
participating Web sites to permanently
enable access over IPv6. [Source: http://www.internetsociety.org/news/world-ipv6-
launch-solidifies-global-support-new-internet-protocol]

13© 2012 Akamai Technologies, Inc. All Rights Reserved
SECTION 3:
Geography– Global
By virtue of the nearly two trillion requests for Web content that it services on a daily basis through its globally deployed Intelligent Platform, Akamai has a unique level of visibility into the speeds of end-user connections and, therefore, into broadband adoption around the globe. Because Akamai has implemented a distributed platform model, deploying servers within edge networks, it can deliver content more reliably and consistently than centralized providers that rely on fewer deployments in large data centers. For more information on why this is possible, please see Akamai’s How Will The Internet Scale? white paper12 or the video explanation at http://www.akamai.com/whytheedge.
The data presented within this section was collected during
the first quarter of 2012 through Akamai’s globally-deployed
Intelligent Platform and includes all countries that had more
than 25,000 unique IP addresses make requests for content to
Akamai during the quarter. For purposes of classification within
this report, the “high broadband” data included below is for
connections at greater than 10 Mbps, and “broadband” is for
connections of 4 Mbps or greater. Note that these definitions
are different than those used in the prior four volumes of the
State of the Internet report and have been updated to reflect
a more current definition of broadband, as it is used by the
United States,13 China,14 and by the European Commission,15 as
well as the overall trend toward greater availability of higher-
speed connections. To this end, the State of the Internet report
will no longer include “narrowband” data, as fewer and fewer
countries over time have had the requisite unique IP address
counts to qualify for inclusion.
In addition to providing insight into high broadband and broad-
band adoption levels, the report also includes data on average
and average peak connection speeds — the latter provides
insight into the peak speeds that users can likely expect from
their Internet connections. All of these metrics are reported at
country and state (U.S) levels. Note that the State of the Internet
report will no longer include city-level data due to the level
of manual review required to compile the data.
Finally, traffic from known mobile networks will be analyzed
and reviewed in a separate section of the report; mobile net-
work data has been removed from the data set used to calculate
the metrics in the present section.
3.1 Global Average Connection Speeds
Reversing the significant decline seen in the fourth quarter of
2011, the global average connection speed experienced a 14%
quarter-over-quarter increase in the first three months of 2012,
returning to 2.6 Mbps, as shown in Figure 7. Growth returned to
105
Figure 7: Average Measured Connection Speed by Country
122
3
1
7
8
56
410
9Country
– Global 2.6 14% 25%
1 South Korea 15.7 -1.5% 9.4%
2 Japan 10.9 21% 35%
3 Hong Kong 9.3 5.4% 1.3%
4 Netherlands 8.8 6.5% 18%
5 Latvia 8.8 18% 38%
6 Switzerland 8.1 11% 30%
7 Ireland 7.3 3.4% 30%
8 Czech Republic 7.1 6.2% 9.7%
9 Belgium 7.1 13% 16%
10 Finland 6.9 16% 39%
…
12 United States 6.7 17% 29%
YoY Change
QoQ Change
Q1 ‘12 Avg. Mbps
Country

14 © 2012 Akamai Technologies, Inc. All Rights Reserved
most of the top 10 countries and the United States, after a number
of these countries saw quarterly declines in the fourth quarter of
2011. Globally, 117 countries that qualified for inclusion saw aver-
age connection speeds increase quarter-over-quarter, with gains
ranging from 0.2% in Montenegro (to 2.8 Mbps) to 75% in Libya
(to 0.5 Mbps). South Korea was the lone standout among the
top 10, with a 1.5% drop, though it remains nearly 5 Mbps faster
than second place Japan. Globally, just 18 qualifying countries
saw average connection speeds decline quarter-over-quarter, with
losses ranging from 1.4% in Kuwait (to 1.8 Mbps) to a highly
unusual, and unexpected, 35% decline in Australia (to 3.5 Mbps).
(Further research appears to indicate that the decline in Australia
was related to issues with a single large network provider.)
Long term trends were once again very positive, reflecting a
continuing shift toward higher speed connectivity. All of the top
10 countries, as well as the United States, experienced positive
year-over-year changes in average connection speeds. Particularly
strong increases were seen in Japan, Latvia, Switzerland, Ireland,
and Finland – all five countries had average connection speeds
more than 30% higher than in the first quarter of 2011. Globally, a
total of 125 countries saw year-over-year increases in average con-
nection speeds in the first quarter, ranging from 195% in the small
French territory of New Caledonia (to 3.6 Mbps) to Hong Kong
increasing just 1.3% (to 9.3 Mbps). Declines in average connection
speeds were seen in just 10 countries that qualified for inclusion.
In the first quarter, 24 countries had average connection speeds of
1 Mbps or less, down from 31 in the fourth quarter of 2011. Libya
remained the country with the lowest average connection speed,
up 75% from the prior quarter, to 0.5 Mbps.
3.2 Global Average Peak Connection Speeds
The average peak connection speed metric represents an average
of the maximum measured connection speeds across all of the
unique IP addresses seen by Akamai from a particular geography.
The average is used in order to mitigate the impact of unrepre-
sentative maximum measured connection speeds. In contrast
to the average measured connection speed, the average peak
connection speed metric is more representative of Internet con-
nection capacity. (This includes the application of so-called speed
boosting technologies that may be implemented within the net-
work by providers in order to deliver faster download speeds for
some larger files.) Note that data from known mobile networks
has been removed from the source data set for this metric.
The global average peak connection speed showed strong
improvement in the first quarter, increasing nearly 10% to 13.5
Mbps. Figure 8 shows that this improvement was echoed across
the top 10 countries, with Singapore’s 20% increase (to 28.6
Mbps) the largest. Hong Kong bested perennial leader South
Korea in the first quarter with an average peak connection speed
that approached the 50 Mbps mark, though South Korea lags by
only 1.5 Mbps; the country also had the smallest increase seen
among the top 10 countries — a solid 4.6%. On a global basis,
the vast majority of the countries that qualified for inclusion had
higher average peak connection speeds quarter-over-quarter,
with growth ranging from a meager 0.6%% in Mauritius (to
7.8 Mbps) to 56% growth in Sudan (to 8.5 Mbps). Quarterly
growth of 10% or more was seen in 70 qualifying countries.
Just 12 qualifying countries saw average peak connection speeds
decline from the fourth quarter of 2011, with losses ranging
from just 0.7% in Lithuania (to 23.3 Mbps) to a highly unusual,
SECTION 3:
Geography– Global (continued)
8
5
4
3
1
2
7
9
10
6
Figure 8: Average Peak Connection Speed by Country
– Global 13.5 9.9% 25%
1 Hong Kong 49.3 7.1% 25%
2 South Korea 47.8 4.6% 52%
3 Japan 39.5 17% 32%
4 Romania 38.8 9.9% 19%
5 Latvia 33.5 14% 37%
6 Netherlands 29.4 13% 34%
7 Belgium 29.2 5.7% 18%
8 United States 28.7 14% 39%
9 Switzerland 28.7 12% 35%
10 Singapore 28.6 20% 47%
YoY Change
QoQ Change
Q1 ‘12 Peak Mbps
Country
15© 2012 Akamai Technologies, Inc. All Rights Reserved
and unexpected, 49% decline in Australia (to 16.6 Mbps).
We do not believe that there has been a significant decline in
the quality of Australian Internet connectivity that would explain
the large quarterly declines in average and average peak con-
nection speed — these observed losses are likely due to anomalies
in the underlying data set related to issues with a single large
network provider, as noted previously.
Looking at year-over-year changes, the global average peak con-
nection speed was once again up by 25% as compared to the
same period a year ago. Extremely strong yearly increases were
seen across all of the top 10 countries, with Belgium having the
lowest growth rate at 18%. Globally, nearly 130 qualifying coun-
tries saw year-over-year increases in average connection speeds,
ranging from 3.8% growth in Pakistan (to 5.9 Mbps) to a 213%
jump in Libya (to 3.8 Mbps). Only five countries saw a yearly
decline in average peak connection speed, with the greatest loss
in Tanzania, which dropped 21% (to 5.1 Mbps).
The positive short- and long-term trends for average peak
connection speeds, and especially the very solid year-over-year
growth numbers, indicate that the state of Internet connectivity
has continued to improve around the world.
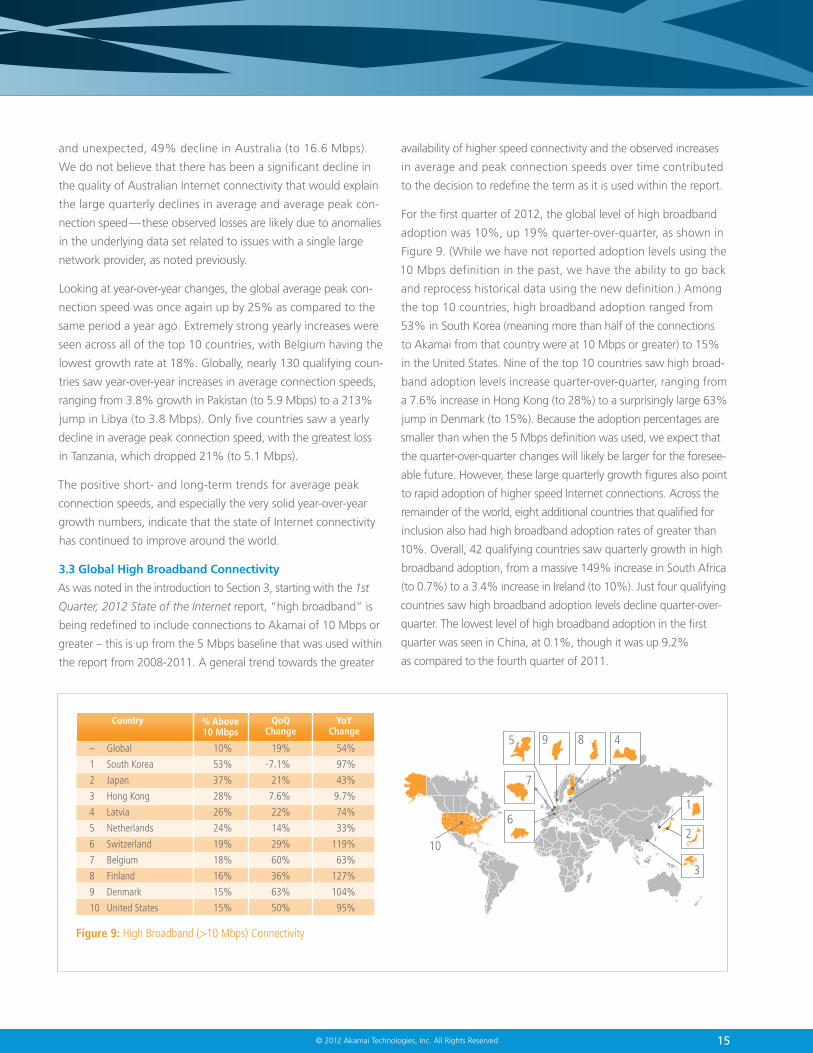
3.3 Global High Broadband Connectivity
As was noted in the introduction to Section 3, starting with the 1st
Quarter, 2012 State of the Internet report, “high broadband” is
being redefined to include connections to Akamai of 10 Mbps or
greater – this is up from the 5 Mbps baseline that was used within
the report from 2008-2011. A general trend towards the greater
10
48
2
3
1
7
6
5 9– Global 10% 19% 54%
1 South Korea 53% -7.1% 97%
2 Japan 37% 21% 43%
3 Hong Kong 28% 7.6% 9.7%
4 Latvia 26% 22% 74%
5 Netherlands 24% 14% 33%
6 Switzerland 19% 29% 119%
7 Belgium 18% 60% 63%
8 Finland 16% 36% 127%
9 Denmark 15% 63% 104%
10 United States 15% 50% 95%
YoY Change
QoQ Change
% Above 10 Mbps
Country
Figure 9: High Broadband (>10 Mbps) Connectivity
availability of higher speed connectivity and the observed increases
in average and peak connection speeds over time contributed
to the decision to redefine the term as it is used within the report.
For the first quarter of 2012, the global level of high broadband
adoption was 10%, up 19% quarter-over-quarter, as shown in
Figure 9. (While we have not reported adoption levels using the
10 Mbps definition in the past, we have the ability to go back
and reprocess historical data using the new definition.) Among
the top 10 countries, high broadband adoption ranged from
53% in South Korea (meaning more than half of the connections
to Akamai from that country were at 10 Mbps or greater) to 15%
in the United States. Nine of the top 10 countries saw high broad-
band adoption levels increase quarter-over-quarter, ranging from
a 7.6% increase in Hong Kong (to 28%) to a surprisingly large 63%
jump in Denmark (to 15%). Because the adoption percentages are
smaller than when the 5 Mbps definition was used, we expect that
the quarter-over-quarter changes will likely be larger for the foresee-
able future. However, these large quarterly growth figures also point
to rapid adoption of higher speed Internet connections. Across the
remainder of the world, eight additional countries that qualified for
inclusion also had high broadband adoption rates of greater than
10%. Overall, 42 qualifying countries saw quarterly growth in high
broadband adoption, from a massive 149% increase in South Africa
(to 0.7%) to a 3.4% increase in Ireland (to 10%). Just four qualifying
countries saw high broadband adoption levels decline quarter-over-
quarter. The lowest level of high broadband adoption in the first
quarter was seen in China, at 0.1%, though it was up 9.2%
as compared to the fourth quarter of 2011.
16 © 2012 Akamai Technologies, Inc. All Rights Reserved
Looking at year-over-year changes, the global high broadband
adoption level was up by more than half, increasing 54%. Among
the top 10 countries, three (Switzerland, Finland, and Denmark)
had adoption levels more than double year-over-year, highlighting
the progress being made in bringing high-speed connectivity to
Northern Europe. Hong Kong was the only country among the
top 10 that did not see double-digit percentage growth on a
yearly basis, falling just below with a 9.7% increase. Around the
world, a total of 16 countries that qualified for inclusion saw high
broadband adoption levels more than double year-over-year, led
by South Africa, Israel, and Lithuania, which all grew by 190% or
more. Yearly growth was seen in 41 qualifying countries around
the world, with Hong Kong’s 9.7% increase the smallest — having
such a solid growth rate as the smallest one seen globally is an
encouraging sign. Just five qualifying countries saw high broadband
adoption levels decline as compared to the first quarter of 2011.
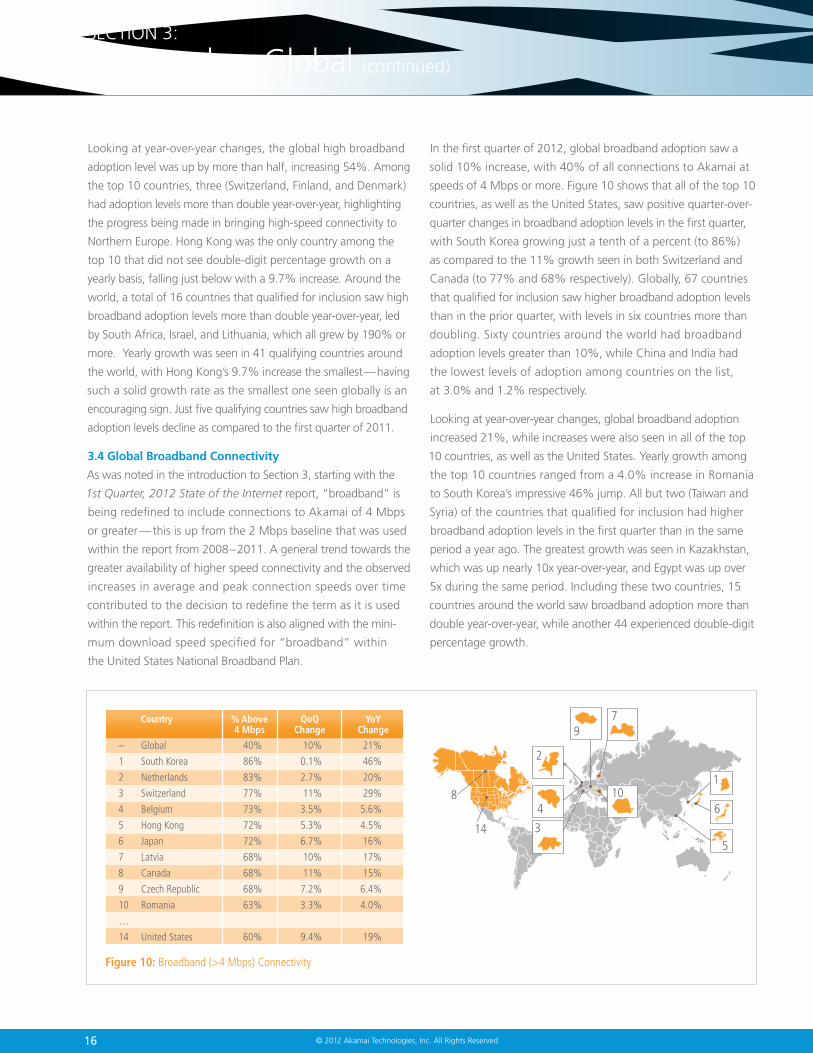
3.4 Global Broadband Connectivity
As was noted in the introduction to Section 3, starting with the
1st Quarter, 2012 State of the Internet report, “broadband” is
being redefined to include connections to Akamai of 4 Mbps
or greater — this is up from the 2 Mbps baseline that was used
within the report from 2008 – 2011. A general trend towards the
greater availability of higher speed connectivity and the observed
increases in average and peak connection speeds over time
contributed to the decision to redefine the term as it is used
within the report. This redefinition is also aligned with the mini-
mum download speed specified for “broadband” within
the United States National Broadband Plan.
In the first quarter of 2012, global broadband adoption saw a
solid 10% increase, with 40% of all connections to Akamai at
speeds of 4 Mbps or more. Figure 10 shows that all of the top 10
countries, as well as the United States, saw positive quarter-over-
quarter changes in broadband adoption levels in the first quarter,
with South Korea growing just a tenth of a percent (to 86%)
as compared to the 11% growth seen in both Switzerland and
Canada (to 77% and 68% respectively). Globally, 67 countries
that qualified for inclusion saw higher broadband adoption levels
than in the prior quarter, with levels in six countries more than
doubling. Sixty countries around the world had broadband
adoption levels greater than 10%, while China and India had
the lowest levels of adoption among countries on the list,
at 3.0% and 1.2% respectively.
Looking at year-over-year changes, global broadband adoption
increased 21%, while increases were also seen in all of the top
10 countries, as well as the United States. Yearly growth among
the top 10 countries ranged from a 4.0% increase in Romania
to South Korea’s impressive 46% jump. All but two (Taiwan and
Syria) of the countries that qualified for inclusion had higher
broadband adoption levels in the first quarter than in the same
period a year ago. The greatest growth was seen in Kazakhstan,
which was up nearly 10x year-over-year, and Egypt was up over
5x during the same period. Including these two countries, 15
countries around the world saw broadband adoption more than
double year-over-year, while another 44 experienced double-digit
percentage growth.
SECTION 3:
Geography– Global (continued)
Figure 10: Broadband (>4 Mbps) Connectivity
– Global 40% 10% 21%
1 South Korea 86% 0.1% 46%
2 Netherlands 83% 2.7% 20%
3 Switzerland 77% 11% 29%
4 Belgium 73% 3.5% 5.6%
5 Hong Kong 72% 5.3% 4.5%
6 Japan 72% 6.7% 16%
7 Latvia 68% 10% 17%
8 Canada 68% 11% 15%
9 Czech Republic 68% 7.2% 6.4%
10 Romania 63% 3.3% 4.0%
…
14 United States 60% 9.4% 19%
YoY Change
QoQ Change
% Above 4 Mbps
Country
8
14
7
106
5
1
2
4
9
3

17© 2012 Akamai Technologies, Inc. All Rights Reserved
4.1 United States Average Connection Speeds
In the first quarter of 2012, Delaware remained the fastest
state in the union, with an average connection speed that
improved 24% quarter-over-quarter to just over 10 Mbps,
as shown in Figure 11. New Hampshire remained the second
fastest state, improving 15% to 9.4 Mbps. All of the top 10
states joined Delaware and New Hampshire in having quarterly
changes that exceeded 10%, as did 38 other states across the
country. Only Minnesota, California, and Nebraska improved
by less than 10% as compared to the fourth quarter of 2011,
though they did not trail very far behind, with average growth
rates around 9%. Arkansas remained the state with the lowest
average connection speed, though it increased 14% quarter-
over-quarter to 3.6 Mbps.
Looking at year-over-year trends, all of the top 10 states saw
average connection speeds increase, and significantly so. The
lowest growth rate among the group was seen in Rhode Island,
at an extremely strong 26%; New Hampshire’s 58% yearly
increase was the largest of the group. Across the country, all
states saw yearly increases in average connection speeds,
and all of the increases were in excess of 10%. Kansas,
New Hampshire, and Vermont all improved by more than
50% year-over-year, while another 34 states had growth rates
higher than 20%.
The strong growth seen across both the short- and long-term
is extremely encouraging, and hopefully bodes well for the
continued adoption of high speed Internet connections across
the United States throughout 2012. In a January speech at the
2012 International Consumer Electronics Show in Las Vegas,
FCC Chairman Julius Genachowski made the point that the
United States needs ubiquitous broadband and universal
broadband adoption, which he said means world-class wired
and wireless infrastructure. To that end, he also noted that
the FCC has removed barriers to wired and wireless broadband
buildout.16 In February, however, a posting on technology
industry blog GigaOm17 noted that some states are working
to advance legislation that would restrict community/municipal
broadband efforts, which could effectively limit consumer
choice to the service tiers and speeds that the incumbent tele-
com and cable providers have made available to that market,
slowing the progress towards ubiquitous broadband and universal
broadband adoption.
SECTION 4:
Geography– United States
The metrics presented here for the United States are based on a subset of data used for Section 3 and are subject to the same thresholds and filters discussed within that section. (The subset used for this section includes connections identified as coming from networks in the United States based on classification by Akamai’s EdgeScape geolocation tool.) As was noted in the introduction to Section 3, this section will no longer include city-level data nor data on narrowband (<256 kbps), and the “new” definitions of high broadband (>10 Mbps) and broadband (>4 Mbps) are used here as well.
Figure 11: Average Measured Connection Speed by State
1 Delaware 10.2 24% 35%
2 New Hampshire 9.4 15% 58%
3 Vermont 9.1 16% 54%
4 District Of Columbia 8.9 19% 32%
5 Utah 8.5 14% 28%
6 Rhode Island 8.5 14% 26%
7 Connecticut 8.4 19% 43%
8 Massachusetts 8.2 14% 31%
9 Maryland 8.1 24% 47%
10 Washington 7.9 19% 40%
YoY Change
QoQ Change
Q1 ‘12 Avg. Mbps
State
1
6
794
83 2
5
10

18 © 2012 Akamai Technologies, Inc. All Rights Reserved
SECTION 4:
Geography– United States (Continued)
4.2 United States Average Peak Connection Speeds
Delaware remained solidly in first place for the average peak
connection speed metric as well, with an average peak speed 8 Mbps
higher than second place Vermont. As shown in Figure 12, very
strong quarterly growth across the top 10 states propelled them
all to average peak connection speeds above 30 Mbps in the
first quarter. Across the country, eight additional states also
had average peak connection speeds above 30 Mbps, while
another 31 had average peak connection speeds above 20 Mbps.
Missouri and Arkansas were the only two states in the union
with average peak speeds below 20 Mbps in the first quarter,
at 18.2 Mbps and 16.6 Mbps respectively. In line with the top
10 states, all of the other states also saw quarterly increases
for the first quarter, with 44 experiencing growth of 10% or
more, and five of those growing 20% or more. The lowest
level of quarterly growth was seen in New Mexico, which
increased 8.1% (to 23.2 Mbps.)
Year-over-year changes among the top 10 were all very strong
as well, with half of them over 40%. The lowest level of
change among these states was seen in Rhode Island, which
increased by “only” 24% year-over-year. Across the whole
country, all of the states in the U.S. saw yearly improvement
in average peak connection speeds, with Maine’s 15% increase
the smallest. Six states improved by 50% or more as compared
to the first quarter of 2011, while an additional 44 states
improved by 20% or more.
The recent Measuring Broadband America18 report published
by the FCC noted that consumers today are experiencing
performance more closely aligned with what is advertised than
they experienced one year ago. The report’s findings noted that
the average ISP delivers 96% of advertised download speeds
during peak usage periods, up from 87% in 2011. The report
also noted that analysis showed that the improvements of ISPs
in meeting their advertised speeds were largely driven by
improvements in network performance and not downward
adjustments to the speed tiers offered. We believe that the FCC’s
findings on the improving quality of broadband connectivity
in the United States are supported by the strong year-over-year
growth presented within the 1st Quarter, 2012 State of the
Internet report.
Figure 12: Average Peak Connection Speed by State
1 Delaware 43.4 17% 44%
2 Vermont 35.4 11% 46%
3 District Of Columbia 34.4 9.8% 35%
4 Virginia 33.9 13% 37%
5 New Hampshire 33.8 12% 46%
6 Rhode Island 33.5 13% 24%
7 Massachusetts 32.8 12% 37%
8 New York 32.5 13% 31%
9 Indiana 32.4 17% 44%
10 New Jersey 32.2 17% 48%
YoY Change
QoQ Change
Q1 ‘12 Peak Mbps
State
10
2
8
57
16
34
9
DID YOU KNOW?
Among the 20 states with fewer than one
million unique IP addresses connecting to
Akamai, average peak connection speeds
ranged from 43.4 Mbps in Delaware down
to 20.0 Mbps in Idaho. California was the
only state that had more than ten million
unique IP addresses connecting to Akamai,
and had an average peak connection speed
of 30.6 Mbps in the first quarter.
19© 2012 Akamai Technologies, Inc. All Rights Reserved
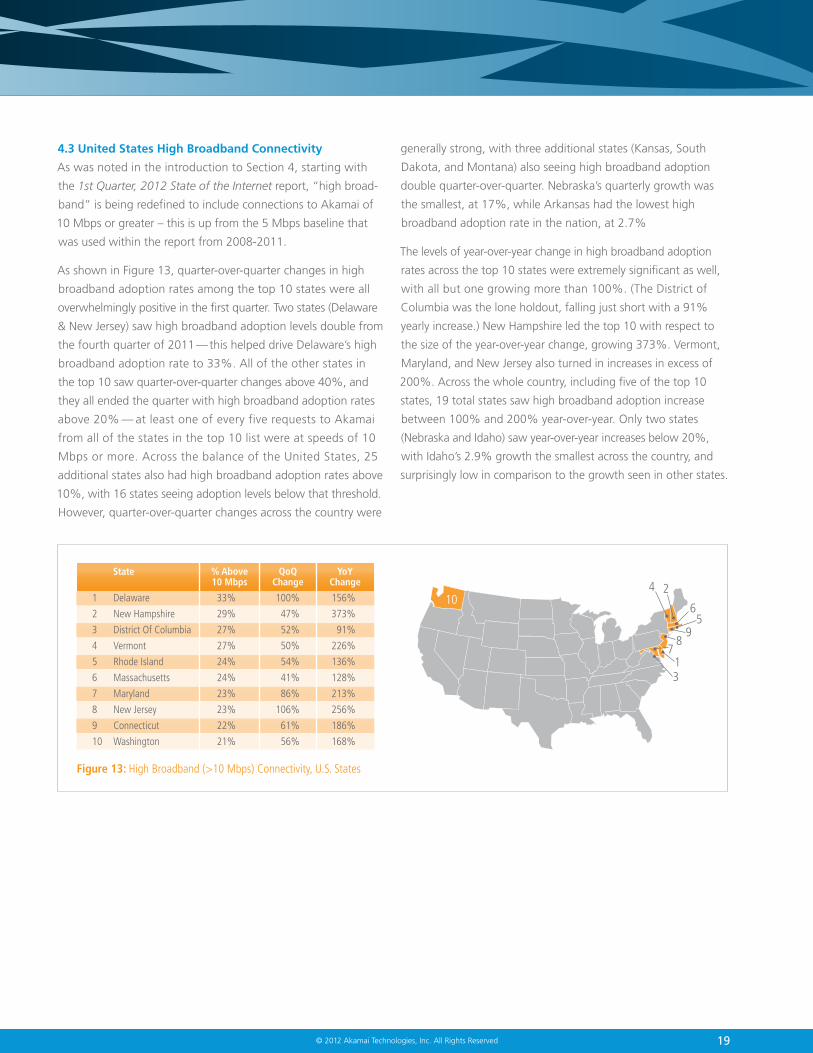
4.3 United States High Broadband Connectivity
As was noted in the introduction to Section 4, starting with
the 1st Quarter, 2012 State of the Internet report, “high broad-
band” is being redefined to include connections to Akamai of
10 Mbps or greater – this is up from the 5 Mbps baseline that
was used within the report from 2008-2011.
As shown in Figure 13, quarter-over-quarter changes in high
broadband adoption rates among the top 10 states were all
overwhelmingly positive in the first quarter. Two states (Delaware
& New Jersey) saw high broadband adoption levels double from
the fourth quarter of 2011 — this helped drive Delaware’s high
broadband adoption rate to 33%. All of the other states in
the top 10 saw quarter-over-quarter changes above 40%, and
they all ended the quarter with high broadband adoption rates
above 20% — at least one of every five requests to Akamai
from all of the states in the top 10 list were at speeds of 10
Mbps or more. Across the balance of the United States, 25
additional states also had high broadband adoption rates above
10%, with 16 states seeing adoption levels below that threshold.
However, quarter-over-quarter changes across the country were
generally strong, with three additional states (Kansas, South
Dakota, and Montana) also seeing high broadband adoption
double quarter-over-quarter. Nebraska’s quarterly growth was
the smallest, at 17%, while Arkansas had the lowest high
broadband adoption rate in the nation, at 2.7%
The levels of year-over-year change in high broadband adoption
rates across the top 10 states were extremely significant as well,
with all but one growing more than 100%. (The District of
Columbia was the lone holdout, falling just short with a 91%
yearly increase.) New Hampshire led the top 10 with respect to
the size of the year-over-year change, growing 373%. Vermont,
Maryland, and New Jersey also turned in increases in excess of
200%. Across the whole country, including five of the top 10
states, 19 total states saw high broadband adoption increase
between 100% and 200% year-over-year. Only two states
(Nebraska and Idaho) saw year-over-year increases below 20%,
with Idaho’s 2.9% growth the smallest across the country, and
surprisingly low in comparison to the growth seen in other states.
Figure 13: High Broadband (>10 Mbps) Connectivity, U.S. States
1 Delaware 33% 100% 156%
2 New Hampshire 29% 47% 373%
3 District Of Columbia 27% 52% 91%
4 Vermont 27% 50% 226%
5 Rhode Island 24% 54% 136%
6 Massachusetts 24% 41% 128%
7 Maryland 23% 86% 213%
8 New Jersey 23% 106% 256%
9 Connecticut 22% 61% 186%
10 Washington 21% 56% 168%
YoY Change
QoQ Change
% Above10 Mbps
State
95
2
1
10
3
8 7
4
6

20 © 2012 Akamai Technologies, Inc. All Rights Reserved
4.4 United States Broadband Connectivity
As was noted in the introduction to Section 4, starting with the
1st Quarter, 2012 State of the Internet report, “broadband” is
being redefined to include connections to Akamai of 4 Mbps
or greater — this is up from the 2 Mbps baseline that was used
within the report from 2008-2011.
In previous issues of the report, using the 2 Mbps definition
of broadband, Delaware led the top 10 list, with an adoption
level that had leveled off around 98%. Under the new 4 Mbps
definition, Delaware remains the state with the highest level of
broadband adoption, at 92%. (The fact that it remains so high,
coupled with Delaware’s high broadband adoption rate, highlights
that a very large percentage of Delaware’s connections to Akamai
are at speeds between 4-10 Mbps.) Broadband adoption levels
among the remainder of the top 10 states remained strong in
the first quarter, with all of them seeing quarterly growth albeit
at rates significantly smaller than those seen for high broadband
adoption. Although Delaware had the highest level of broad-
band adoption in the United States, it also had the smallest
quarterly change, at just 2.4%. Twenty-one other states joined it
in having quarterly changes below 10%, while 29 saw growth
of 10% or more quarter-over quarter.
Looking at year-over-year changes, Delaware and Rhode Island
were the only states among the top 10 to improve by less than
10%, though there were four states (Vermont, New Jersey,
Maryland, and Connecticut) that improved by more than 20%.
Similar growth rates were seen by 26 additional states across
the country, including in four states (Kansas, Mississippi, Wyo-
ming, and New Mexico) that saw broadband adoption increase
by more than 50%. Hawaii joined Delaware and Rhode Island
as the only other state that grew broadband adoption by less
than 10% year-over-year, increasing 4.7% (to 15% adoption).
1 Delaware 92% 2.4% 7.2%
2 New Hampshire 84% 3.1% 14%
3 Rhode Island 81% 4.3% 3.5%
4 Vermont 80% 5.2% 21%
5 New Jersey 75% 8.5% 21%
6 Maryland 72% 8.5% 22%
7 New York 71% 9.6% 17%
8 Connecticut 71% 7.9% 28%
9 Massachusetts 69% 4.2% 14%
10 District Of Columbia 68% 4.7% 11%
YoY Change
QoQ Change
% Above4 Mbps
State
3
2
7
1
5 8 6
10
49
Figure 14: Broadband (>4 Mbps) Connectivity, U.S. States
DID YOU KNOW?
The Measuring Broadband America report published by the U.S. Federal Communications
Commission notes that the increase in the availability and adoption of faster speed tiers
is a positive indicator that the U.S. market is moving toward the goal, set out in the National
Broadband Plan, that at least 100 million homes should have affordable access to actual
download speeds of at least 50 Mbps by 2015, and 100 Mbps by 2020. [Source: http://transition.fcc.gov/cgb/measuringbroadbandreport/2012/Measuring-Broadband-America.pdf]
SECTION 4:
Geography– United States (continued)

21© 2012 Akamai Technologies, Inc. All Rights Reserved
decline was unusually, and unexpectedly, large, and we believe
that it is related to issues seen with a single large network
provider within the country.
Similar to the long-term trends seen globally, and in the other
regions, year-over-year changes among Asia Pacific countries
were generally positive in the first quarter. Aside from a 5.7%
loss in Taiwan, the other surveyed countries within the region
showed higher average connection speeds as compared
to the same period a year ago. Growth was extremely strong
in China, which improved by 46% year-over-year, as well as in
Japan, Singapore, Malaysia, and India, which all delivered yearly
growth in excess of 20% in the first quarter. Despite the unusu-
ally large quarterly loss, Australia’s average connection speed
continued to grow on a yearly basis, up 4.8%. Hong Kong
and the Philippines joined Australia in having year-over-year
changes below 5%.
The metrics presented here for the Asia Pacific region are based on a subset of data used for Section 3 and are subject to the same thresholds and filters discussed within that section. (The subset used for this section includes connections identified as coming from networks in the Asia Pacific region, based on classification by Akamai’s EdgeScape geolocation tool.) As was noted in the introduction to Section 3, this section will no longer include city-level data, nor data on narrowband (<256 kbps), and the “new” definitions of high broadband (>10 Mbps) and broadband (>4 Mbps) are used here as well.
SECTION 5:
Geography– Asia Pacific Region
Figure 15: Average Measured Connection Speed by Asia Pacific Country
YoY Change
QoQ Change
Q1 ‘12 Avg. Mbps
Country
1 South Korea 15.7 -1.5% 9.4%
2 Japan 10.9 21% 35%
3 Hong Kong 9.3 5.4% 1.3%
25 Singapore 5.3 15% 25%
44 Taiwan 3.9 4.1% -5.7%
46 New Zealand 3.9 11% 10%
48 Australia 3.5 -35% 4.8%
51 Thailand 3.3 7.4% 16%
74 Malaysia 2.0 15% 40%
93 China 1.5 9.0% 46%
110 Philippines 1.2 8.3% 2.3%
112 India 1.0 16% 24%
Global Rank
4648
93
112
2
1
3
44
51
2574
110
5.1 Asia Pacific Average Connection Speeds
In the first quarter of 2012, the top three countries in the Asia
Pacific region remained South Korea, Japan, and Hong Kong,
as shown in Figure 15. Despite a slight quarterly decline, South
Korea remained nearly 5 Mbps ahead of Japan — the 21%
quarterly increase seen in Japan helped close the 8 Mbps gap
between the two countries seen in the fourth quarter of 2011.
As we saw globally, and in the other regions, quarterly changes
were generally positive, with fairly solid increases observed
among the surveyed countries. In addition to Japan’s 21%
increase, Singapore, New Zealand, Malaysia, and India
also improved by more than 10% quarter-over-quarter. The
16% jump in India’s average connection speed pushed the country
back up to the 1 Mbps mark, after falling just below it last
quarter. China continues to see improvement as well, reaching
1.5 Mbps in the first quarter. Aside from South Korea, the only
other quarter decline among the surveyed Asia Pacific countries
was seen in Australia. As noted in Section 3.1, Australia’s

22 © 2012 Akamai Technologies, Inc. All Rights Reserved
Figure 16: Average Peak Connection Speed by Asia Pacific Country
YoY Change
QoQ Change
Q1 ‘12 Peak MbpsCountry Global
Rank
5349
121
114
3
2
1
16
40
1054
85
1 Hong Kong 49.3 7.1% 25%
2 South Korea 47.8 4.6% 52%
3 Japan 39.5 17% 32%
10 Singapore 28.6 20% 47%
16 Taiwan 24.8 8.7% 36%
40 Thailand 19.4 7.8% 38%
49 Australia 16.6 -49% 13%
53 New Zealand 16.1 4.7% 17%
54 Malaysia 15.4 9.6% 84%
85 Philippines 10.0 5.7% 22%
114 India 6.9 21% 33%
121 China 5.9 8.8% 46%
The first quarter of 2012 saw only two countries (South Korea
& Japan) with average connection speeds that exceeded the
newly redefined “high broadband” (10 Mbps) threshold, while
only two more (Hong Kong & Singapore) had average connection
speeds that exceeded the newly redefined “broadband” (4 Mbps)
threshold. India remains the country with the lowest average
connection speed in the region, at 1 Mbps.
5.2 Asia Pacific Average Peak Connection Speeds
As shown in Figure 16, quarterly improvements for average
peak connection speeds were fairly solid across surveyed
countries in the Asia Pacific region during the first quarter. India
had the largest increase, at 21%, improving its average peak
connection speed to 6.9 Mbps, followed closely by Singapore’s
20% increase, to 28.6 Mbps. Japan was the only other country
to see quarterly growth in excess of 10%, growing 17% to
reach 39.5 Mbps in the first quarter. With just a small increase
in the next quarter, Japan will join South Korea and Hong Kong
as the only countries regionally, and in the world, with average
peak connection speeds above 40 Mbps. To that end, another
quarter of solid growth in Hong Kong will push the country’s
average peak connection speed above 50 Mbps. As noted previ-
ously, Australia’s massive quarterly decline was likely due to issues
related to a single large network provider within the country.
In looking at year-over-year changes in average peak connec-
tion speeds, very strong improvements were seen across all of
the surveyed countries. Malaysia’s massive 84% yearly increase
(to 15.4 Mbps) led the region, with South Korea the only other
country to see a yearly increase higher than 50%. Although
India and China have the lowest average peak connection
speeds in the region, these speeds have continued to increase
over the long-term, as they grew 33% and 46% respectively
from the first quarter of 2011. Year-over-year changes above
20% were seen in all but two of the rest of the countries in the
region — New Zealand grew 17%, while Australia increased
13% on a yearly basis, despite the unusually large, and
unexpected, quarterly loss.
DID YOU KNOW?
China is expected to have 20 million new broadband Internet subscribers this year and a total
of 250 million subscribers by the end of 2015, and is aiming to install fiber-to-the-home (FTTH)
broadband connections for 35 million families this year. [Source: http://news.xinhuanet.com/english/china/2012-03/31/c_131500466.htm]
SECTION 5:
Geography– Asia Pacific Region (Continued)
23© 2012 Akamai Technologies, Inc. All Rights Reserved
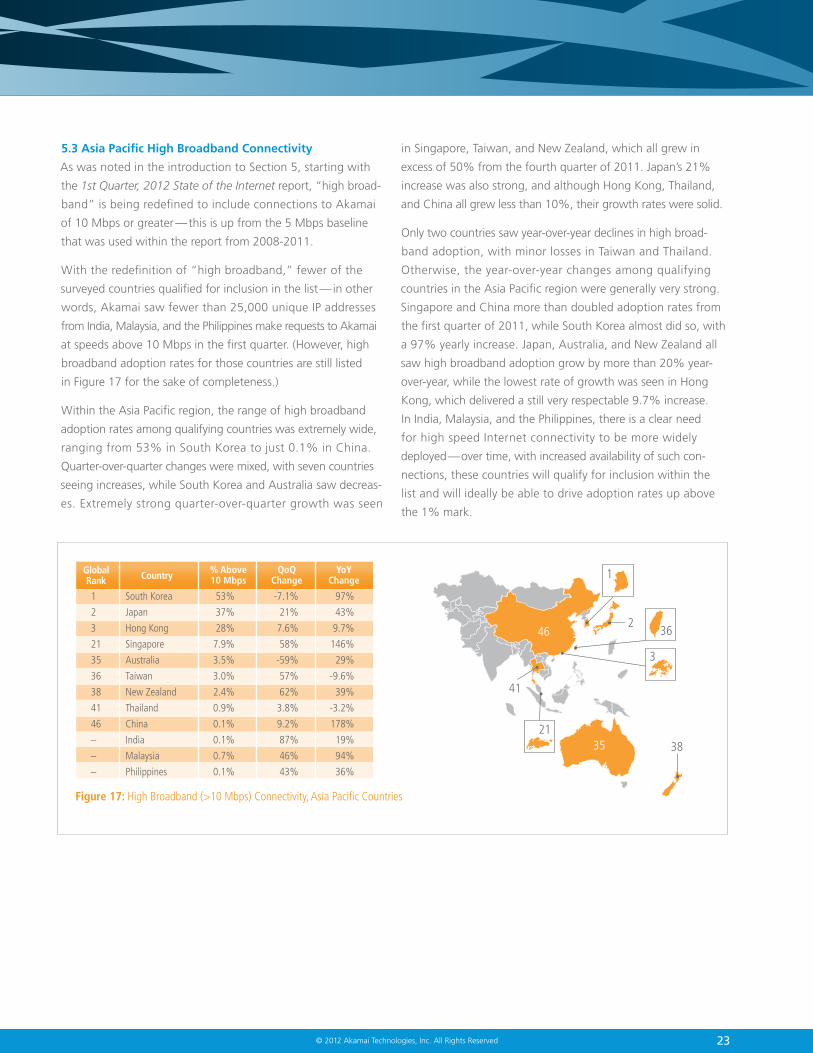
5.3 Asia Pacific High Broadband Connectivity
As was noted in the introduction to Section 5, starting with
the 1st Quarter, 2012 State of the Internet report, “high broad-
band” is being redefined to include connections to Akamai
of 10 Mbps or greater — this is up from the 5 Mbps baseline
that was used within the report from 2008-2011.
With the redefinition of “high broadband,” fewer of the
surveyed countries qualified for inclusion in the list — in other
words, Akamai saw fewer than 25,000 unique IP addresses
from India, Malaysia, and the Philippines make requests to Akamai
at speeds above 10 Mbps in the first quarter. (However, high
broadband adoption rates for those countries are still listed
in Figure 17 for the sake of completeness.)
Within the Asia Pacific region, the range of high broadband
adoption rates among qualifying countries was extremely wide,
ranging from 53% in South Korea to just 0.1% in China.
Quarter-over-quarter changes were mixed, with seven countries
seeing increases, while South Korea and Australia saw decreas-
es. Extremely strong quarter-over-quarter growth was seen
in Singapore, Taiwan, and New Zealand, which all grew in
excess of 50% from the fourth quarter of 2011. Japan’s 21%
increase was also strong, and although Hong Kong, Thailand,
and China all grew less than 10%, their growth rates were solid.
Only two countries saw year-over-year declines in high broad-
band adoption, with minor losses in Taiwan and Thailand.
Otherwise, the year-over-year changes among qualifying
countries in the Asia Pacific region were generally very strong.
Singapore and China more than doubled adoption rates from
the first quarter of 2011, while South Korea almost did so, with
a 97% yearly increase. Japan, Australia, and New Zealand all
saw high broadband adoption grow by more than 20% year-
over-year, while the lowest rate of growth was seen in Hong
Kong, which delivered a still very respectable 9.7% increase.
In India, Malaysia, and the Philippines, there is a clear need
for high speed Internet connectivity to be more widely
deployed — over time, with increased availability of such con-
nections, these countries will qualify for inclusion within the
list and will ideally be able to drive adoption rates up above
the 1% mark.
Figure 17: High Broadband (>10 Mbps) Connectivity, Asia Pacific Countries
YoY Change
QoQ Change
% Above 10 MbpsCountry Global
Rank
3835
462
1
3
36
41
21
1 South Korea 53% -7.1% 97%
2 Japan 37% 21% 43%
3 Hong Kong 28% 7.6% 9.7%
21 Singapore 7.9% 58% 146%
35 Australia 3.5% -59% 29%
36 Taiwan 3.0% 57% -9.6%
38 New Zealand 2.4% 62% 39%
41 Thailand 0.9% 3.8% -3.2%
46 China 0.1% 9.2% 178%
– India 0.1% 87% 19%
– Malaysia 0.7% 46% 94%
– Philippines 0.1% 43% 36%

24 © 2012 Akamai Technologies, Inc. All Rights Reserved
YoY Change
QoQ Change
% Above 4 MbpsCountry
Global Rank
Figure 18: Broadband (>4 Mbps) Connectivity, Asia Pacific Countries
4245
68
69
6
1
5
39
47
2060
1 South Korea 86% 0.1% 46%
5 Hong Kong 72% 5.3% 4.5%
6 Japan 72% 6.7% 16%
20 Singapore 51% 13% 11%
39 Taiwan 36% 1.2% -6.6%
42 New Zealand 34% 20% 27%
45 Australia 27% -15% 3.1%
47 Thailand 23% 24% 69%
60 Malaysia 11% 57% 176%
68 China 3.0% 23% 209%
69 India 1.2% 62% 85%
– Philippines 1.2% 45% 18%
5.4 Asia Pacific Broadband Connectivity
As was noted in the introduction to Section 5, starting with
the 1st Quarter, 2012 State of the Internet report, “broadband”
is being redefined to include connections to Akamai of 4 Mbps
or greater – this is up from the 2 Mbps baseline that was used
within the report from 2008 – 2011.
Even with the redefinition of “broadband”, there continued to
be a very wide spread in adoption rates across the Asia Pacific
region, as evidenced by Figure 18. Adoption ranges from 86%
in top-ranked South Korea to just 1.2% in India. Broadband
adoption was also 1.2% in the Philippines in the first quarter,
but it did not have enough unique IP addresses connecting to
Akamai at speeds above 4 Mbps to be officially included in the
list. Although India and China were the only two countries in
the region with broadband adoption levels below 10%, they
both saw extremely strong quarterly growth, indicating that
the state of connectivity has continued to improve in both
countries. Double-digit quarterly percentage growth was also
seen in Singapore, New Zealand, Thailand, and Malaysia, which
grew adoption rates to 51%, 34%, 23%, and 11% respectively.
The smallest change among Asia Pacific countries was the 0.1%
increase in South Korea, though its adoption rate remains
significantly ahead of Hong Kong and Japan.
Year-over-year changes were overwhelmingly positive, with
growth seen in all but one of the surveyed Asia Pacific countries.
Yearly increases ranged from just 3.1% in Australia and 4.5%
in Hong Kong to 176% in Malaysia and 209% in China. India,
which ranked just below China, also saw extremely strong
yearly growth, increasing 85%. The only country to show a
year-over-year decline in broadband adoption was Taiwan,
which lost 6.6%.
In examining broadband adoption levels for the old (>2 Mbps)
and new (>4 Mbps) definitions, we find that there are some
striking differences. In South Korea, the adoption rate under
the new definition is only 10% below that for the old definition.
However, in countries including New Zealand, Taiwan, Thailand,
Australia, and Malaysia, the difference is approximately
2x — the new adoption rates are half, or just slightly less than
half, of the old adoption rates. The most striking differences,
however, were seen in India and China, where the difference
between old and new was more than 6x. For many of these
countries, this highlights that the 2-4 Mbps tier is a “sweet
spot” with high numbers of connections in that range.
SECTION 5:
Geography– Asia Pacific Region (Continued)

25© 2012 Akamai Technologies, Inc. All Rights Reserved
Previously titled “Europe”, this section has been renamed “EMEA” to reflect the inclusion of the United Arab Emirates and Israel. The metrics presented here for the Europe/Middle East/Africa (EMEA) region are based on a subset of data used for Section 3 and are subject to the same thresholds and filters discussed within that section. The subset used for this section includes connections identified as coming from networks in the EMEA region, based on classification by Akamai’s EdgeScape geolocation tool.
SECTION 6:
Geography– EMEA
As was noted in the introduction to Section 3, this section
will no longer include city-level data, nor data on narrowband
(<256 kbps), and the “new” definitions of high broadband
(>10 Mbps) and broadband (>4 Mbps) are used here as well.
6.1 EMEA Average Connection Speeds
After finishing 2011 as the EMEA country with the highest
average connection speed, the Netherlands topped the list
going into 2012, leading the region with an average connec-
tion speed of 8.8 Mbps. Similar to the trends seen globally,
and across the other regions, quarterly changes were over-
whelmingly positive in the first quarter, as shown in Figure 19.
Quarter-over-quarter increases ranged from 3.4% in Ireland
(to 7.3 Mbps) and Turkey (to 2.9 Mbps) to 20% in Denmark
(to 6.7 Mbps) and France (to 4.9 Mbps). Nine other countries
within the region saw average connection speeds improve by
10% or more during the first quarter. Among the surveyed
countries, only Turkey’s average connection speed fell below
the new “broadband” definition of 4 Mbps, and only the
United Arab Emirates had a lower average connection speed
than in the first quarter, losing 2.0% (to 4.7 Mbps).
Year-over-year changes were extremely strong as well, with
the Czech Republic and Portugal the only two countries within
the EMEA region that saw average connection speeds increase
less than 10% year-over-year. (Though they weren’t that
far below 10%, experiencing increases of 9.7% and 9.1%,
respectively.) The 39% year-over-year increases in Finland and
Poland were the highest in the region, although five additional
countries also saw yearly growth of 30% or more.
Although the United Kingdom fell roughly in the middle of
the pack from an average connection speed perspective, efforts
announced by BT Openreach may help push the country further
up the list in the future. In January, Openreach said it was look-
ing for around 1,000 apartment buildings that are within the
company’s current fiber deployment footprint to take part in a
pilot project that will eventually bring download speeds of up
to 300Mbps to residents.19 The UK government is also offering Figure 19: Average Measured Connection Speed by EMEA Country
YoY Change
QoQ ChangeCountryGlobal
Rank
4 Netherlands 8.8 6.5% 18%
6 Switzerland 8.1 11% 30%
7 Ireland 7.3 3.4% 30%
8 Czech Republic 7.1 6.2% 9.7%
9 Belgium 7.1 13% 16%
10 Finland 6.9 16% 39%
11 Denmark 6.7 20% 24%
13 Romania 6.6 3.6% -0.3%
15 Sweden 6.3 12% 26%
16 Hungary 5.9 5.9% 15%
17 Germany 5.8 13% 22%
18 Slovakia 5.7 7.6% 20%
19 Norway 5.7 12% 22%
20 Austria 5.7 7.0% 30%
21 United Kingdom 5.6 9.8% 20%
22 Portugal 5.4 8.3% 9.1%
28 Poland 5.0 18% 39%
30 France 4.9 20% 35%
33 United Arab Emirates 4.7 -2.0% 15%
35 Spain 4.6 16% 35%
36 Israel 4.6 14% 27%
41 Italy 4.1 4.7% 13%
58 Turkey 2.9 3.4% 15%
Q1 ‘12Avg. Mbps
815
17
10
58
4
9
7
30
1119
41
35
21
28
13
18
16
6 2022 33
36

26 © 2012 Akamai Technologies, Inc. All Rights Reserved
Figure 20: Average Peak Connection Speed by EMEA Country
YoY Change
QoQ ChangeCountryGlobal
Rank
4 Romania 38.8 9.9% 19%
6 Netherlands 29.4 13% 34%
7 Belgium 29.2 5.7% 18%
9 Switzerland 28.7 12% 35%
11 Portugal 28.2 10% 13%
12 Hungary 28.0 13% 31%
15 Ireland 25.2 4.6% 36%
17 Czech Republic 24.5 8.3% 19%
18 Slovakia 24.2 11% 31%
19 Sweden 24.1 8.4% 24%
20 Spain 24.0 20% 52%
22 United Kingdom 23.7 12% 37%
23 Israel 23.5 13% 48%
24 Finland 23.5 15% 43%
25 Germany 23.4 10% 28%
28 Poland 22.0 18% 58%
30 Denmark 21.5 13% 29%
36 Austria 20.2 8.6% 29%
37 Norway 20.1 8.0% 24%
41 France 19.1 12% 34%
43 Turkey 18.5 11% 37%
46 Italy 17.7 7.8% 19%
Q1 ‘12Peak Mbps
1719
25
24
43
6
7
15
41
3037
46
20
22
28
4
18
12
9 3611
23
cash to local councils — that can secure matched funding —
for broadband infrastructure improvements through its
Broadband Delivery UK scheme, though the UK’s culture
secretary proposed take back funding for the plan if broadband
contracts are not in place before the end of the year.20
6.2 EMEA Average Peak Connection Speeds
As shown in Figure 20, the average peak connection speed
across all of the surveyed EMEA countries improved in the
first quarter of 2012. Quarter-over-quarter increases ranged
from 4.6% in Ireland (to 25.2 Mbps) to 20% in Spain (to 24.0 Mbps).
Across the region, 13 additional countries joined Spain in
having quarterly increases greater than 10%. At 38.8 Mbps,
Romania’s average peak connection speed is over 9 Mbps faster
than the Netherlands’ average peak connection speed, and
more than 20 Mbps faster than Italy’s, which had the region’s
lowest speed, at 17.7 Mbps. (As has been the case over the
last several quarters, the United Arab Emirates is not included
in Figure 20 due to anomalies in the data we believe are related
to the network architecture within the country.)
Similar to last quarter, year-over-year changes remained
extremely positive, with double-digit percentage increases seen
in all of the surveyed countries. Yearly growth ranged from a
13% increase in Portugal (to 28.2 Mbps) to the 58% increase
seen in Poland (to 22.0 Mbps). Both Poland and Spain grew
more than 50% year-over-year, while Israel and Finland saw
average peak connection speeds increase by more than 40%
over the same period. Only five of the surveyed countries had
yearly growth rates below 20%. Coupled with the strong yearly
increases in average connection speeds, these long-term trends
point towards increases in availability and quality of high speed
Internet connectivity across countries in the EMEA region.
SECTION 6:
Geography– EMEA (Continued)

27© 2012 Akamai Technologies, Inc. All Rights Reserved
Figure 21: High Broadband (>10 Mbps) Connectivity, EMEA Countries
YoY Change
QoQ ChangeCountryGlobal
Rank
5 Netherlands 24% 14% 33%
6 Switzerland 19% 29% 119%
7 Belgium 18% 60% 63%
8 Finland 16% 36% 127%
9 Denmark 15% 63% 104%
11 Sweden 14% 30% 50%
12 Romania 13% 4.5% -8.7%
13 Norway 12% 40% 81%
14 Czech Republic 12% 9.9% 18%
16 Ireland 10% 3.4% 35%
17 Austria 10% 13% 100%
18 Hungary 10% 17% 78%
19 Slovakia 8.9% 16% 56%
20 Germany 8.3% 37% 98%
25 Poland 7.0% 77% 140%
26 Portugal 6.8% 31% 63%
27 United Kingdom 6.5% 30% 86%
30 United Arab Emirates 5.9% -6.8% -26%
32 Israel 5.6% 57% 191%
33 France 4.5% 66% 140%
34 Spain 4.2% 83% 181%
37 Italy 2.6% 10% 25%
44 Turkey 0.4% 7.2% -32%
% Above 10 Mbps
1411
20
8
44
5
7
16
33
913
37
34
27
25
12
19
18
6 1726 30
32
DID YOU KNOW?
In February, industry analyst firm Point Topic
announced that they had joined with the
European Commission to launch “the most
detailed broadband coverage mapping
survey ever made across Europe.” [Source: http://www.ispreview.co.uk/story/2012/02/27/point-topic-be-
gins-major-digital-agenda-mapping-survey-of-eu-broadband-cover.html]
6.3 EMEA High Broadband Connectivity
As expected, high broadband adoption levels under the new
10 Mbps definition are significantly lower than were seen with
the 5 Mbps threshold. As shown in Figure 21, none of the
countries within the EMEA region had even a quarter of their
connections to Akamai at speeds above 10 Mbps; just under
half of them didn’t even have 10% of their connections at
those speeds. However, quarter-over-quarter changes among
the surveyed countries were generally rather strong, with only
the United Arab Emirates seeing a slight decline. Quarterly
increases of over 50% were seen across six countries, while
another six countries saw growth of 30% or more. Across
the region, increases ranged from 3.4% in Ireland (to 10%)
to a massive 83% increase in Spain (to 4.2%).
Looking at year-over-year changes, three countries (Romania,
United Arab Emirates, and Turkey) saw high broadband
adoption drop year over year, with the United Arab Emirates
and Turkey seeing fairly significant declines. In contrast, eight
countries (Switzerland, Finland, Denmark, Austria, Poland, Israel,
France, and Spain) all saw high broadband adoption levels of
double or more as compared to the first quarter of 2011, while
eight more countries had year-over-year increases above 50%.
The 18% increase in the Czech Republic was the lowest level
of yearly growth seen in the region.

28 © 2012 Akamai Technologies, Inc. All Rights Reserved
Figure 22: Broadband (>4 Mbps) Connectivity, EMEA Countries
YoY Change
QoQ ChangeCountryGlobal
Rank
2 Netherlands 83% 2.7% 20%
3 Switzerland 77% 11% 29%
4 Belgium 73% 3.5% 5.6%
9 Czech Republic 68% 7.2% 6.4%
10 Romania 63% 3.3% 4.0%
11 Denmark 62% 15% 11%
12 Portugal 61% 10% 4.3%
13 Hungary 60% 8.9% 16%
15 Finland 59% 15% 42%
16 United Kingdom 58% 14% 35%
17 Germany 57% 17% 30%
19 Ireland 52% 6.8% 32%
23 France 49% 47% 99%
24 Sweden 48% 11% 23%
26 Austria 46% 7.1% 33%
28 Norway 45% 10% 11%
30 Spain 44% 31% 99%
31 United Arab Emirates 44% -2.5% 22%
32 Poland 44% 22% 73%
35 Israel 40% 36% 97%
36 Slovakia 40% 13% 33%
44 Italy 32% 16% 50%
57 Turkey 12% 36% 132%
% Above 4 Mbps
924
17
15
57
2
4
19
23
1128
44
30
16
32
10
36
13
3 2612 31
35
6.4 EMEA Broadband Connectivity
As shown in Figure 22, broadband adoption levels remained
strong in the first quarter of 2012, even as the speed used as
the broadband cutoff was higher than in the prior quarter. The
Netherlands had the highest level of broadband adoption in
the EMEA region, at 83%, up 2.7% from the prior quarter. An
additional 11 countries had more than half of their connections
to Akamai at speeds above 4 Mbps. Quarter-over-quarter changes
ranged from moderate to significant, ranging from a 2.7%
increase in the Netherlands to a 47% increase in France.
Fifteen countries across the region saw broadband adoption
levels grow by more than 10% from the fourth quarter of 2011,
including Turkey, which had the lowest level of broadband
adoption (12%) in the region. The United Arab Emirates was
the only country in the EMEA region where broadband adoption
declined quarter-over-quarter – it lost 2.5%.
All of the countries in the EMEA region saw broadband adoption
levels increase year-over-year, with extremely strong growth
seen in several countries. France, Spain, and Israel all fell just
short of doubling broadband adoption year-over-year, while
Turkey saw broadband adoption more than double. Only four
countries in the region (Belgium, Czech Republic, Romania,
and Portugal) saw adoption levels increase less than 10% —
the lowest level of growth was Romania’s 4.0% increase.
As noted in the Asia Pacific section above, in examining broad-
band adoption levels for the old (>2 Mbps) and new (>4 Mbps)
definitions, we find that there are some striking differences
among the countries in EMEA as well. The smallest difference
was seen in the Netherlands, where broadband adoption
under the new definition was 11% lower than under the old
definition. The largest difference was seen in Turkey, where the
broadband adoption figure is now one-sixth of what it was
under the 2 Mbps definition. The remainder of the countries
now sees broadband adoption levels that are generally on the
order of 30-50% lower. Again, for many of these countries,
this highlights that the 2-4 Mbps tier is a “sweet spot” with
high numbers of connections in that range.
SECTION 6:
Geography– EMEA (Continued)

29© 2012 Akamai Technologies, Inc. All Rights Reserved
Building on the data presented in previous editions of the State of the Internet report, Akamai continues to attempt to identify additional mobile networks for inclusion in the report, as well as filtering out networks subsequently identified as having proxy gateway configurations that could skew results. The source data in this section encompasses usage not only from smartphones, but also laptops, tablets, and other devices that connect to the Internet through these mobile networks. In addition, this edition of the State of the Internet report once again includes insight into mobile traffic growth and data traffic patterns contributed by Ericsson, a leading provider of telecommunications equipment and related services to mobile and fixed network operators globally. Akamai and Ericsson have partnered to develop the first ever end-to-end solution to address performance, scalability, and availability of mobile content and applications on a global scale.
As has been noted in prior quarters, the source data set for this
section is subject to the following constraints:
• A minimum of 1,000 unique IP addresses connecting to
Akamai from the network in the first quarter of 2012 was
required for inclusion in the list.
• In countries where Akamai had data for multiple network
providers, only the top three are listed, based on unique
IP address count.
• The names of specific mobile network providers have been
made anonymous, and providers are identified by a unique ID.
• Data is included only for networks where Akamai believes
that the entire Autonomous System (AS) is mobile — that is,
if a network provider mixes traffic from fixed/wireline (DSL,
cable, etc.) connections with traffic from mobile connections
on a single network identifier, that AS was not included
in the source data set.
• Akamai’s EdgeScape database was used for the geographic
assignments.
7.1 Connection Speeds on Mobile Networks
In the first quarter of 2012, German mobile provider DE-2
continued to have the highest average connection speed,
increasing 7.4% to just under 6.0 Mbps. In reviewing the full
list of providers listed in Figure 25, we find that there are five
providers (DE-2, GR-1, CZ-3, ES-1, and UA-1) that had average
connection speeds in the newly redefined “broadband” (>4 Mbps)
range. An additional 65 mobile providers had average connec-
tion speeds greater than 1 Mbps in the first quarter. The mobile
provider with the lowest average connection speed was NG-1
in Nigeria, at 322 kbps. Only three providers had average
connection speeds below 500 kbps in the first quarter: NG-1,
South African provider ZA-1 and Bolivian provider BO-1. Thai
mobile provider TH-1, which was ranked as the slowest provider
in the last several reports, saw its average connection speed
rebound in the first quarter of 2012, growing over 450%
quarter-over-quarter to just shy of 1 Mbps.
Examining the average peak connection speed data for the first
quarter of 2012, we find that Hong Kong mobile provider HK-1
tops the list, with an average peak connection speed of 32.2
Mbps. However, as this represents an increase of over 250% from
the prior quarter, it may be indicative of a change in network
architecture within the provider, such as the installation of caching
servers or gateways. A German provider had the highest average
peak connection speed last quarter, and placed second this quar-
ter, at 31.2 Mbps, up almost 19% quarter-over-quarter. Six mobile
providers had average peak connection speeds above 20 Mbps in
the first quarter, double the number in the prior quarter — provider
GR-1 missed the 20 Mbps mark by just 64 kbps. Average peak
connection speeds above 10 Mbps were seen in an additional 31
mobile providers. All mobile providers had average peak
connection speeds above 2 Mbps, though last place South African
provider ZA-1 was just above the threshold, losing over 13%
from the prior quarter, at 2.2 Mbps. Thai mobile provider TH-1
rebounded very well for this section too, seeing a nearly 400%
increase in average peak connection speed to 8.6 Mbps.
Note that starting with this issue, the State of the Internet report will no
longer include per-provider average MB per month consumption data.
SECTION 7:
Mobile Connectivity

30 © 2012 Akamai Technologies, Inc. All Rights Reserved
Figure 23: Average and Average Peak Connection Speed per Month by Mobile Provider
AFRICA Egypt EG-1 592 3914Morocco MA-1 996 9579Nigeria NG-1 322 5674South Africa ZA-1 496 2172ASIA China CN-1 2020 5125Hong Kong HK-2 1997 11187Hong Kong HK-1 2382 32172Indonesia ID-1 742 10085Israel IL-1 1506 7947Kuwait KW-1 1323 7115Malaysia MY-3 1117 8518Malaysia MY-1 550 7040Pakistan PK-1 1144 6246Qatar QA-1 1289 3568Saudi Arabia SA-1 1351 4688Singapore SG-3 1477 8575Sri Lanka LK-1 817 7237Taiwan TW-1 1717 8322Taiwan TW-2 1084 6558Thailand TH-1 979 8584EUROPE Austria AT-1 2558 11171Belgium BE-1 3731 14549Belgium BE-3 945 4545Belgium BE-2 1976 5323Czech Republic CZ-1 1799 9714Czech Republic CZ-3 4656 14550Czech Republic CZ-2 1273 7199Estonia EE-1 1637 8223France FR-2 2862 10900Germany DE-1 1122 4665Germany DE-2 5976 31224Germany DE-3 1828 8137Greece GR-1 4928 19934Hungary HU-2 2422 12483Hungary HU-1 1785 8899Ireland IE-1 3017 14895Ireland IE-2 2077 16679Ireland IE-3 2303 18228Italy IT-2 3481 18004Italy IT-3 3367 16700Italy IT-4 1977 12226Lithuania LT-2 2185 16320Lithuania LT-1 3284 19081
Q1 ‘12 Avg. kbps
IDQ1 ‘12 Peak kbps
Country
ASIA
EUROPE
AFRICA
Q1 ‘12 Avg. kbps
IDQ1 ‘12 Peak kbps
Country
Moldova MD-1 1850 8496Netherlands NL-2 2239 5827Netherlands NL-1 1820 4133Netherlands NL-3 1830 8102Norway NO-1 2458 9074Poland PL-1 3615 17929Poland PL-2 1765 9054Poland PL-3 1709 10385Romania RO-1 937 5330Russia RU-4 3631 16588Russia RU-3 825 4550Russia RU-2 1094 6250Slovakia SK-1 605 4173Slovenia SI-1 2228 8402Spain ES-1 4527 21979Turkey TR-1 1875 9191Ukraine UA-1 4239 14092United Kingdom UK-3 3502 14143United Kingdom UK-2 3433 12378United Kingdom UK-1 2691 27869NORTH AMERICA Canada CA-2 1018 2485El Salvador SV-2 1932 11932El Salvador SV-1 1548 9203El Salvador SV-3 631 3172Guatemala GT-2 1590 10236Nicaragua NI-1 1826 11962United States US-1 2515 7388United States US-2 1118 4613United States US-3 1222 3884OCEANIA Australia AU-3 1881 12262Australia AU-1 1498 14167New Zealand NZ-2 1785 10411SOUTH AMERICA Argentina AR-1 1051 7979Argentina AR-2 2699 20543Bolivia BO-1 473 4604Brazil BR-1 827 8013Brazil BR-2 1417 7911Chile CL-3 1487 12828Chile CL-4 1255 13932Colombia CO-1 1010 6801Paraguay PY-2 684 5627Uruguay UY-1 1497 11222Venezuela VE-1 983 7334
NORTH AMERICA
OCEANIA
SOUTH AMERICA
SECTION 7:
Mobile Connectivity (continued)

31© 2012 Akamai Technologies, Inc. All Rights Reserved
7.2 Mobile Traffic Growth As Observed By Ericsson
In mobile networks, the access medium (spectrum) is being
shared by different users in the same cell. It is important to
understand traffic volumes and usage patterns in order to enable
a good customer experience. Ericsson’s presence in more
than 180 countries and its customer base representing more
than 1,000 networks enables it to measure mobile voice and
data volumes. The result is a representative base for calculating
world total mobile traffic in 2G, 3G, and 4G networks (not
including DVB-H, WiFi, and Mobile WiMax).
These measurements have been performed for several years
and the seasonal slowdown in growth observed in Q2 2011 has
been replaced by continued strong growth in the last 3 quarters.
However, the measurements of data and voice traffic in these
networks (2G, 3G, 4G/LTE) around the world show large differ-
ences in traffic levels between markets and regions, and also
between operators due to their different customer profiles.
As illustrated in Figure 24, the volume of mobile data traffic
almost doubled from the first quarter of 2011 to the first quarter
of 2012, and grew 19% between the fourth quarter of 2011
and the first quarter of 2012.
Figure 24: Total Monthly Mobile Voice and Data as Measured by Ericsson
700
600
500
400
300
200
100
0Q1‘07
Q2‘07
Q3‘07
Q4‘07
Q1‘08
Q2‘08
Q3‘08
Q4‘08
Q1‘09
Q2‘09
Q3‘09
Q4‘09
Q1‘10
Q1‘11
Q2‘11
Q3‘11
Q4‘11
Q1‘12
Q2‘10
Q3‘10
Q4‘10
Tota
l (U
L +
DL)
mon
thly
tra
ffic
(Pet
abye
s/m
onth
)
DataVoice
DID YOU KNOW?
• The traffic generated by mobile PC users
differs significantly between individuals
and markets. The global average is
estimated to be around 2 GB per
month, based on Ericsson measurements. [Source: http://www.ericsson.com/res/docs/2012/tmd_report_
feb_web.pdf]
• Mobile PCs dominate traffic in most
mobile networks today, but smartphone
traffic is growing faster, due to high
growth in subscriptions. [Source: http://www.ericsson.com/res/docs/2012/traffic_and_
market_report_june_2012.pdf]

32 © 2012 Akamai Technologies, Inc. All Rights Reserved
7.3 Traffic Variation By Application And Data Plan
As Observed By Ericsson
Figure 25 shows the variation of a subscriber’s average monthly
traffic volume for different applications for mobile PC devices. It
is measured at two different occasions during 2011 in one selected
network. As an example, a user on a data plan of around 15 GB
consumed on average 2-3 GB per month of HTTP video in Q1,
while in Q4 this figure was 3-4 GB per month. In this study, the
majority of users are on medium data plans between 2-5 GB/month.
In Q4, higher data plans were available.
The first observation one can make is that the monthly subscriber
traffic from applications such as HTTP video and web browsing
both reach saturation points, although at different levels. At the
same time, P2P file sharing increases with the monthly data plan
(at least for the range of currently available data plans).
The second observation one can make is that both web
browsing and P2P file sharing usage remain fairly constant
within the same data plan between Q1 and Q4, while HTTP
video has increased dramatically.
Web browsing has not increased because it is a low bandwidth
application and there are limitations on the time an individual
can spend browsing the web. There are several reasons to that
HTTP video is increasing and has likely not yet reached its peak.
One reason is that bit rates from video applications such as
YouTube, Netflix and Hulu continue to increase as they gradually
improve quality by offering content in increasingly higher
resolution (e.g. “Full HD”). Another reason is increasing screen
resolution, which means viewers tend to look at longer clips,
or that they keep watching for a longer time. The increasing
availability of quality content also has an impact.
Figure 25: Average per subscription monthly traffic volume per application as a function of data plan
5
4
3
2
1
0
HTTP video (2011 Q1)
Web browsing (2011 Q1)
P2P file sharing (2011 Q1)
HTTP video (2011 Q4)
Web browsing (2011 Q4)
P2P file sharing (2011 Q4)
5 10 15 20 25
GB
/ m
on
th /
su
bsc
rip
tio
n
User monthly data plan (GB)
DID YOU KNOW?
• Global mobile penetration reached 87
percent in Q1 2012 and mobile subscrip-
tions now total around 6.2 billion. However,
the actual number of subscribers is around 4.2
billion, since many have several subscriptions.
• The data plan is one of the most important
factors determining level of traffic usage. [Source: http://www.ericsson.com/res/docs/2012/traffic_and_
market_report_june_2012.pdf]
SECTION 7:
Mobile Connectivity (continued)

33© 2012 Akamai Technologies, Inc. All Rights Reserved
8.1 Iran
In February, Reuters reported21 that millions of Iranians had
recently suffered serious disruptions in accessing e-mail and
Internet social networking sites, which raised concerns that
authorities within the country were stepping up censorship of
opposition supporters ahead of parliamentary elections sched-
uled to take place in March. According to the report, the
disruptions appeared to target all international Web sites
outside Iran that depend on SSL encryption and took place
from Friday, February 10, through the following Monday.
Figure 26 illustrates the traffic patterns for HTTP (non-secure)
traffic delivered by Akamai to Iran between February 7 and
February 14. The graph clearly shows that traffic peaks for the
three-day period of February 9th to 11th were lower than
the previous several days, potentially indicative of some sort
of traffic filtering. However, Figure 27 clearly illustrates the
reported disruption in access to SSL-encrypted content (known
as HTTPS traffic) during the time period in question. As the
figure shows, HTTPS traffic delivered by Akamai to Iran dropped
precipitously to near-zero levels on February 9th and started to
recover somewhat on the 11th and 12th. HTTPS traffic peaks
had returned to near-normal levels by February 13th.
The following week, Reuters again reported22 that a second and
more extensive disruption of Internet access had taken place on
Monday, February 20, again targeting international Web sites
outside Iran that depend on SSL encryption. The report also
highlighted claims that virtual private networking (VPN) traffic
was blocked during this disruption as well. Figure 28 illustrates
the traffic patterns for HTTPS (secured) traffic delivered by Akamai
to Iran between February 17 and February 21. Once again, a
significant decline in traffic is evident on February 20, in line with
the date of the reported disruption.
8.2 Australia
According to a published report,23 on February 23, Australian
network provider Dodo revealed a “minor hardware issue” was
behind a Telstra outage that impacted multiple service providers
and Internet services across the country. The report noted that
the 35-minute outage impacted an international link used by
major service providers Telstra, Optus and iiNet for ADSL, cable
and 3G data services. Because the disruption affected multiple
service providers, it also briefly disrupted the ability of users in
Australia to retrieve content from Akamai. Figure 29 illustrates
the traffic patterns for HTTP traffic delivered by Akamai to Australia
on the morning (Eastern Time) of February 23. There is a clear
dip in traffic concurrent with the reported outage, with traffic
patterns returning to normal thereafter.
SECTION 8:
Internet Disruptions
Figure 26: HTTP Traffic Served to Iran, February 7 – 14, 2012
8-F
eb
9-F
eb
10
-Feb
11
-Feb
12
-Feb
13
-Feb
14
-Feb

34 © 2012 Akamai Technologies, Inc. All Rights Reserved
Figure 28: HTTPS Traffic to Iran, February 17 – 21, 20121
8-F
eb
19
-Feb
20
-Feb
21
-Feb
Figure 29: HTTP Traffic Served to Australia, February 23, 2012
12
:00
12
:30
1:0
0
1:3
0
2:0
0
2:3
0
3:0
0
3:3
0
4:0
0
4:3
0
5:0
0
5:3
0
6:0
0
SECTION 8:
Internet Disruptions (Continued)
Figure 27: HTTPS Traffic Served to Iran, February 7 – 14, 2012
8-F
eb
9-F
eb
10
-Feb
11
-Feb
12
-Feb
13
-Feb
14
-Feb

35© 2012 Akamai Technologies, Inc. All Rights Reserved
SECTION 9:
Appendix*
Cou
ntrie
s lis
ted
with
“—
“ ha
d fe
wer
tha
n 25
,000
uni
que
IP a
ddre
sses
con
nect
ing
to A
kam
ai d
urin
g th
e fir
st q
uart
er a
t th
is s
peed
. Bas
ed o
n th
e re
vise
d th
resh
old
for
incl
usio
n, t
hey
wer
e no
t in
clud
ed in
the
glo
bal r
anki
ng.
Unique IP Addresses
Avg. Connection Speed (Mbps)
Peak Connection Speed (Mbps)
% Attack Traffic
% Above 10 Mbps*
% Above 4 Mbps*
Region
EUROPE
Austria 0.2% 3,091,940 5.7 20.2 10% 46%
Belgium 0.1% 4,320,174 7.1 29.2 18% 73%
Czech Republic 0.5% 2,231,060 7.1 24.5 12% 68%
Denmark 0.1% 3,146,650 6.7 21.5 15% 62%
Finland 0.1% 3,082,796 6.9 23.5 16% 59%
France 1.0% 25,531,678 4.9 19.1 4.5% 49%
Germany 1.9% 36,042,604 5.8 23.4 8.3% 57%
Greece 0.2% 2,795,843 4.0 20.9 1.6% 34%
Hungary 1.7% 2,599,912 5.9 28.0 10% 60%
Iceland <0.1% 152,764 5.4 23.9 6.0% 45%
Ireland 0.1% 1,600,721 7.3 25.2 10% 52%
Italy 1.9% 16,916,226 4.1 17.7 2.6% 32%
Luxembourg <0.1% 175,955 4.7 16.7 3.1% 50%
Netherlands 0.6% 8,183,991 8.8 29.4 24% 83%
Norway 0.1% 3,708,569 5.7 20.1 12% 45%
Poland 1.8% 8,016,244 5.0 22.0 7.0% 44%
Portugal 0.2% 3,022,278 5.4 28.2 6.8% 61%
Romania 3.2% 2,676,118 6.6 38.8 13% 63%
Slovakia 0.1% 903,926 5.7 24.2 8.9% 40%
Spain 0.8% 13,990,828 4.6 24.0 4.2% 44%
Sweden 0.3% 6,457,731 6.3 24.1 14% 48%
Switzerland 0.3% 3,208,453 8.1 28.7 19% 77%
United Kingdom 0.8% 25,720,814 5.6 23.7 6.5% 58%
ASIA/PACIFIC
Australia 0.4% 13,859,005 3.5 16.6 3.5% 27%
China 16% 92,385,739 1.5 5.9 0.1% 3.0%
Hong Kong 0.9% 2,870,568 9.3 49.3 28% 72%
India 3.1% 11,498,812 1.0 6.9 0.1% 1.2%
Japan 1.8% 40,510,336 10.9 39.5 37% 72%
Malaysia 1.1% 2,156,957 2.0 15.4 0.7% 11%
New Zealand 0.3% 2,022,538 3.9 16.1 2.4% 34%
Singapore 0.2% 1,349,758 5.3 28.6 7.9% 51%
South Korea 4.4% 19,808,619 15.7 47.8 53% 86%
Taiwan 5.5% 10,494,010 3.9 24.8 3.0% 36%
MIDDLE EAST
Egypt 0.7% 2,256,682 1.3 7.6 0.1% 4.6%
Israel 1.8% 2,835,458 4.6 23.5 5.6% 40%
Kuwait 0.2% 728,398 1.8 13.4 0.6% 3.7%
Saudi Arabia 0.3% 3,409,894 2.3 9.8 0.1% 3.6%
Sudan <0.1% 71,305 0.9 8.5 <0.1% 0.2%
Syria <0.1% 529,987 1.7 5.4 0.1% 4.8%
United Arab Emirates (UAE) 0.2% 1,185,060 4.7 n/a 5.9% 44%
LATIN & SOUTH AMERICA
Argentina 1.3% 6,217,745 2.2 14.4 0.4% 12%
Brazil 4.1% 19,202,853 2.2 15.1 0.5% 12%
Chile 0.5% 3,245,647 3.4 19.7 1.0% 22%
Colombia 0.6% 4,193,378 2.7 14.4 0.4% 11%
Mexico 0.6% 10,835,278 2.8 13.5 0.4% 12%
Peru 0.4% 938,240 1.6 11.6 0.1% 0.9%
Venezuela 0.5% 2,335,262 0.9 6.8 <0.1% 0.6%
NORTH AMERICA
Canada 1.0% 13,544,437 6.5 25.4 11% 68%
United States 11% 146,463,059 6.7 28.7 15% 60%

36 © 2012 Akamai Technologies, Inc. All Rights Reserved
1 http://www.pcadvisor.co.uk/news/security/3354324/obstinate-conficker-worm-infests-millions-of-pcs-years-later/?olo=rsst
2 http://www.cvedetails.com/cve/CVE-2011-5049/
3 http://technet.microsoft.com/en-us/security/bulletin/ms12-020
4 http://laws.qualys.com/2012/03/march-patch-tuesday-2012.html
5 https://www.arin.net/knowledge/rirs.html
6 ftp://ftp.arin.net/pub/stats/arin/delegated-arin-latest
ftp://ftp.apnic.net/apnic/stats/apnic/delegated-apnic-extended-latest
ftp://ftp.ripe.net/pub/stats/ripencc/delegated-ripencc-latest
ftp://ftp.afrinic.net/pub/stats/afrinic/delegated-afrinic-latest
ftp://ftp.lacnic.net/pub/stats/lacnic/delegated-lacnic-latest
7 http://www.networkworld.com/news/2012/052412-ipv4-resales-259588.html
8 http://he.net/about_us.html
9 http://bgp.he.net/going-native.pdf
10 http://www.circleid.com/posts/20120305_networks_announcing_ipv6_one_year_later/
11 http://www.lightreading.com/document.asp?doc_id=218942
12 http://www.akamai.com/dl/whitepapers/How_will_the_internet_scale.pdf
13 http://download.broadband.gov/plan/national-broadband-plan.pdf
14 http://www.techinasia.com/state-councils-plan-china-2015-3g-100-mbps-broadband/
15 http://broadbandtrends.com/blog1/2012/04/09/european-commission-updates-on-national-broadband-plans/
16 http://www.forbes.com/sites/ericsavitz/2012/01/11/ces-live-fcc-chair-genachowski-wants-uniquitous-broadband/
17 http://gigaom.com/broadband/legislators-aim-to-turn-states-into-broadband-backwaters/
18 http://www.fcc.gov/measuring-broadband-america/2012/july
19 http://www.zdnet.com/bt-plan-puts-300mbps-in-apartment-blocks-4010025296/
20 Ibid.
21 http://www.reuters.com/article/2012/02/14/iran-internet-idUSL5E8DE26N20120214
22 http://www.reuters.com/article/2012/02/20/us-iran-internet-idUSTRE81J0ML20120220
23 http://www.itnews.com.au/News/291364,dodo-cops-blame-for-national-internet-outages.aspx
SECTION 10:
Endnotes

AKAMAI TECHNOLOGIES PUTS THE INTERNET IN YOUR HANDSAkamai’s Internet Visualization
App gives you a custom view
of traffic carried by our more
than 100,000 servers, located
in countries all over the world.
The Internet Visualization App
also enables you to view attack
traffic as it happens, on a global
or local scale.
To download, search for “Akamai Internet Visualization App” on iTunes, or go to http://bit.ly/akamaiapp


![akamai’s [state of the internet] Q3 2015 report can also interact with us in the State of the Internet subspace on the Akamai Community at . —Dvid a onsBl e [LETTER FROM THE EDITOR]](https://img.pdfslide.net/doc/110x75/5aa6f7c87f8b9a50528bb9ed/akamais-state-of-the-internet-q3-2015-report-can-also-interact-with-us-in-the.jpg)