Embed Size (px)
Citation preview
912240
2SUPERVISOR’S USE ONLY
9 1 2 2 4
© New Zealand Qualifications Authority, 2016. All rights reserved.No part of this publication may be reproduced by any means without the prior permission of the New Zealand Qualifications Authority.
Level 2 Economics, 201691224 Analyse economic growth
using economic concepts and models
2.00 p.m. Tuesday 15 November 2016 Credits: Four
Achievement Achievement with Merit Achievement with ExcellenceAnalyse economic growth using economic concepts and models.
Analyse economic growth in depth using economic concepts and models.
Analyse economic growth comprehensively using economic concepts and models.
Check that the National Student Number (NSN) on your admission slip is the same as the number at the top of this page.
You should attempt ALL the questions in this booklet.
If you need more room for any answer, use the extra space provided at the back of this booklet.
Check that this booklet has pages 2–11 in the correct order and that none of these pages is blank.
YOU MUST HAND THIS BOOKLET TO THE SUPERVISOR AT THE END OF THE EXAMINATION.
ASSESSOR’S USE ONLY
TOTAL
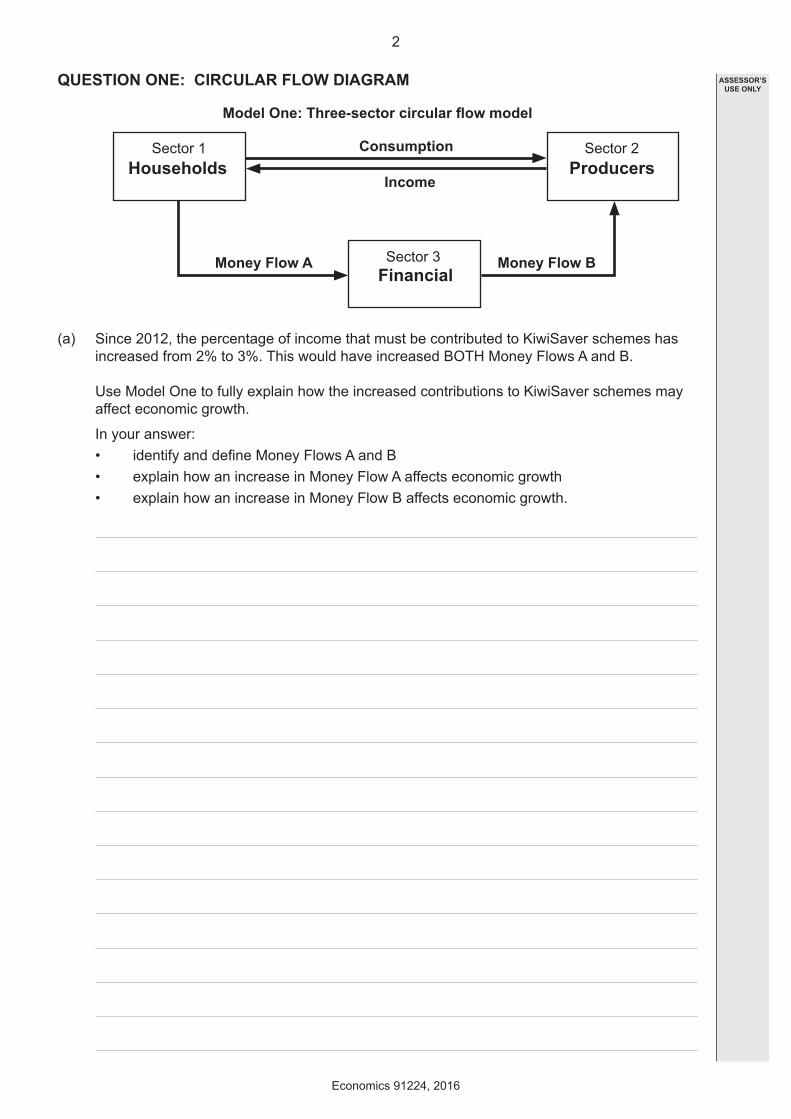
QUESTION ONE: CIRCULAR FLOW DIAGRAM
Model One: Three-sector circular flow model
Consumption
Money Flow A
Income
Money Flow B
ProducersSector 2
FinancialSector 3
HouseholdsSector 1
(a) Since 2012, the percentage of income that must be contributed to KiwiSaver schemes has increased from 2% to 3%. This would have increased BOTH Money Flows A and B.
Use Model One to fully explain how the increased contributions to KiwiSaver schemes may affect economic growth.
In your answer:• identify and define Money Flows A and B• explain how an increase in Money Flow A affects economic growth• explain how an increase in Money Flow B affects economic growth.
2
Economics 91224, 2016
ASSESSOR’S USE ONLY
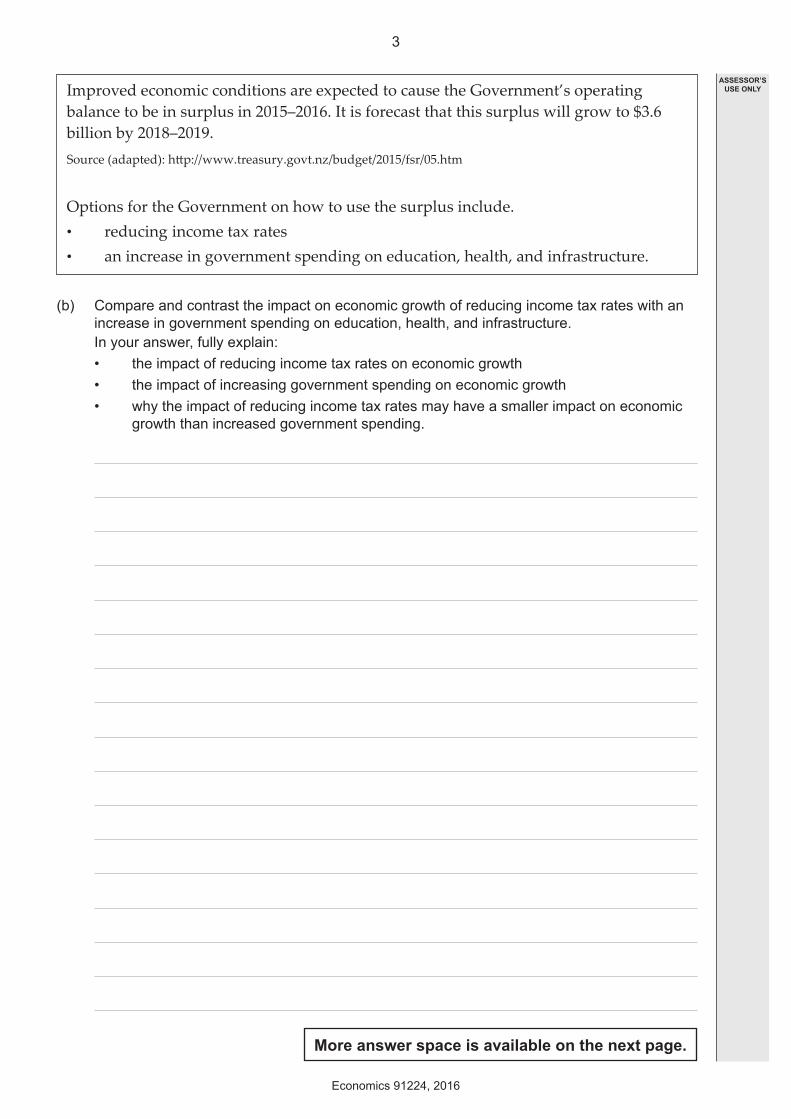
Improved economic conditions are expected to cause the Government’s operating balance to be in surplus in 2015–2016. It is forecast that this surplus will grow to $3.6 billion by 2018–2019. Source (adapted): http://www.treasury.govt.nz/budget/2015/fsr/05.htm
Options for the Government on how to use the surplus include.• reducing income tax rates • an increase in government spending on education, health, and infrastructure.
(b) Compare and contrast the impact on economic growth of reducing income tax rates with an increase in government spending on education, health, and infrastructure.
In your answer, fully explain:• the impact of reducing income tax rates on economic growth• the impact of increasing government spending on economic growth• why the impact of reducing income tax rates may have a smaller impact on economic
growth than increased government spending.
More answer space is available on the next page.
3
Economics 91224, 2016
ASSESSOR’S USE ONLY
4
Economics 91224, 2016
ASSESSOR’S USE ONLY
5
Economics 91224, 2016
This page has been deliberately left blank.The examination continues on the following page.
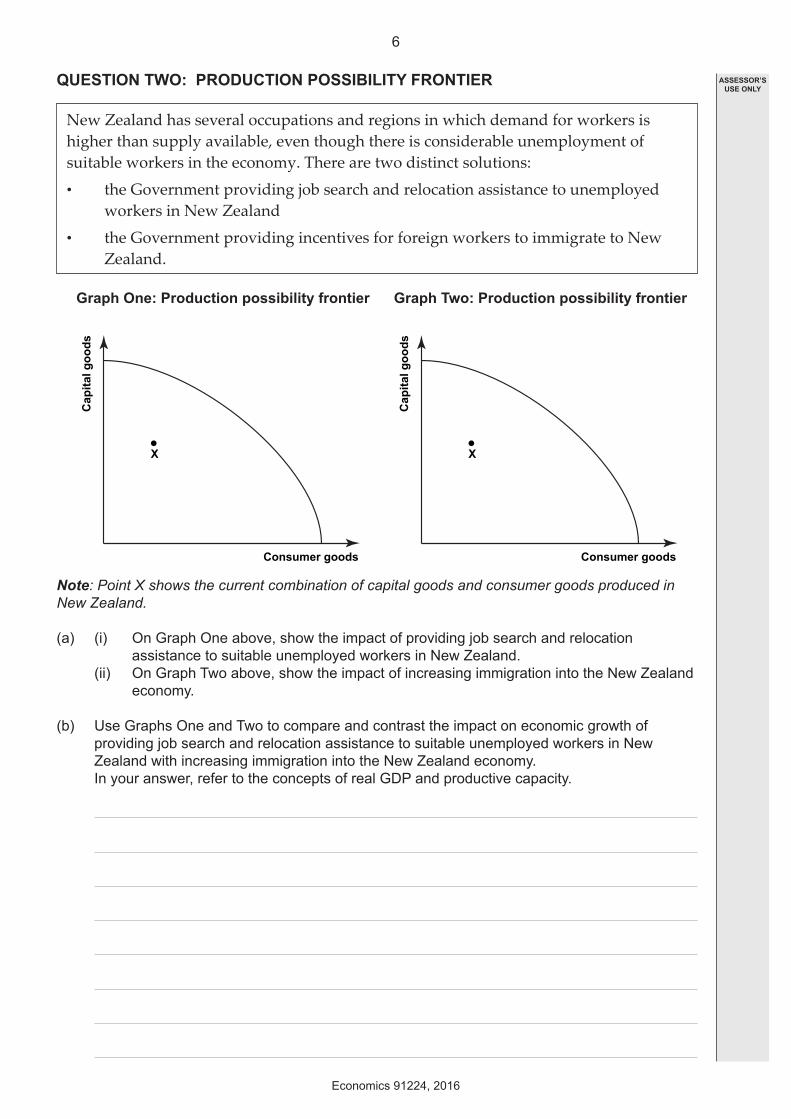
Graph One: Production possibility frontier Graph Two: Production possibility frontier
Consumer goods
Cap
ital g
oods
X.
Consumer goods
Cap
ital g
oods
X.
QUESTION TWO: PRODUCTION POSSIBILITY FRONTIER
New Zealand has several occupations and regions in which demand for workers is higher than supply available, even though there is considerable unemployment of suitable workers in the economy. There are two distinct solutions:
• the Government providing job search and relocation assistance to unemployed workers in New Zealand
• the Government providing incentives for foreign workers to immigrate to New Zealand.
Note: Point X shows the current combination of capital goods and consumer goods produced in New Zealand.
(a) (i) On Graph One above, show the impact of providing job search and relocation assistance to suitable unemployed workers in New Zealand.
(ii) On Graph Two above, show the impact of increasing immigration into the New Zealand economy.
(b) Use Graphs One and Two to compare and contrast the impact on economic growth of providing job search and relocation assistance to suitable unemployed workers in New Zealand with increasing immigration into the New Zealand economy.
In your answer, refer to the concepts of real GDP and productive capacity.
6
Economics 91224, 2016
ASSESSOR’S USE ONLY
7
Economics 91224, 2016
ASSESSOR’S USE ONLY
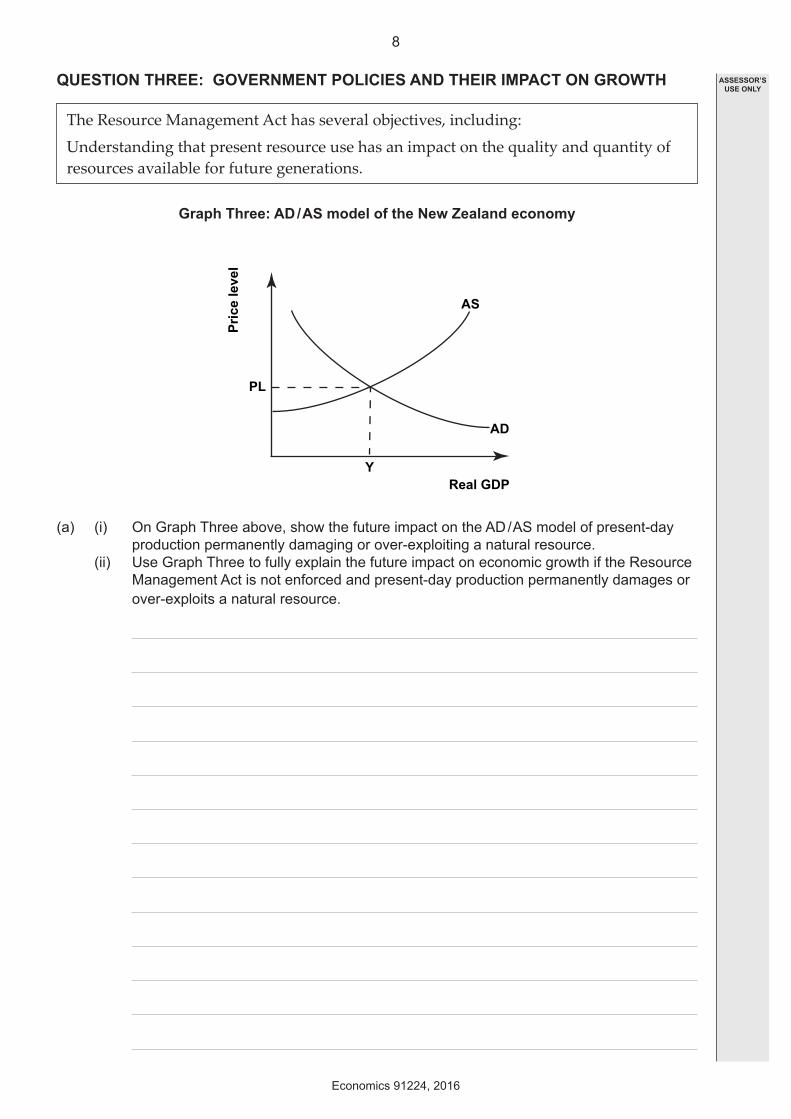
QUESTION THREE: GOVERNMENT POLICIES AND THEIR IMPACT ON GROWTH
The Resource Management Act has several objectives, including:
Understanding that present resource use has an impact on the quality and quantity of resources available for future generations.
Graph Three: AD / AS model of the New Zealand economyPr
ice
leve
l
Real GDP
AD
AS
PL
Y
(a) (i) On Graph Three above, show the future impact on the AD / AS model of present-day production permanently damaging or over-exploiting a natural resource.
(ii) Use Graph Three to fully explain the future impact on economic growth if the Resource Management Act is not enforced and present-day production permanently damages or over-exploits a natural resource.
8
Economics 91224, 2016
ASSESSOR’S USE ONLY
The 1949 Forestry Act bans the export of swamp kauri logs unless they are made into finished timber products. Exporters have been getting round this with illegally exported logs being processed at their export destination, depriving this country of jobs and the financial benefit of adding value. By [Government’s] rigorously enforcing the Act and more closely observing the exporters, the swamp kauri could contribute far more to Northland. This would mean the creation of jobs in a genuine value-added processing industry, making bowls, vases, furniture, and other popular products.Source (adapted): http://www.nzherald.co.nz/business/news/article.cfm?c_id=3&objectid=11483596
(b) Compare and contrast the economic impact of enforcing the 1949 Forestry Act and its value-added policy on extracted kauri logs in the Northland community.
In your answer, fully explain:• the costs and benefits for workers in Northland• the costs and benefits for the Government.
More answer space is available on the next page.
9
Economics 91224, 2016
ASSESSOR’S USE ONLY
10
Economics 91224, 2016
ASSESSOR’S USE ONLY
11
Economics 91224, 2016
ASSESSOR’S USE ONLY
QUESTION NUMBER
Extra space if required.Write the question number(s) if applicable.

91
22
4