Embed Size (px)
Citation preview
-4
LEVEL II SCOUR ANALYSIS FORBRIDGE 29 (PUTNTH00210029) onTOWN HIGHWAY 21, crossingEAST PUTNEY BROOK,PUTNEY, VERMONT
U.S. Geological SurveyOpen-File Report 97-406
Prepared in cooperation with
VERMONT AGENCY OF TRANSPORTATION
and
FEDERAL HIGHWAY ADMINISTRATION

-3
LEVEL II SCOUR ANALYSIS FORBRIDGE 29 (PUTNTH00210029) onTOWN HIGHWAY 21, crossingEAST PUTNEY BROOK,
PUTNEY, VERMONT
By ERICK M. BOEHMLER and MICHAEL A. IVANOFF
U.S. Geological SurveyOpen-File Report 97-406
Prepared in cooperation with
VERMONT AGENCY OF TRANSPORTATION
and
FEDERAL HIGHWAY ADMINISTRATION
Pembroke, New Hampshire
1997
U.S. DEPARTMENT OF THE INTERIOR
BRUCE BABBITT, Secretary
U.S. GEOLOGICAL SURVEYGordon P. Eaton, Director
For additional information Copies of this report may bewrite to: purchased from:
District Chief U.S. Geological SurveyU.S. Geological Survey Branch of Information Services361 Commerce Way Open-File Reports UnitPembroke, NH 03275-3718 Box 25286
Denver, CO 80225-0286

-1
CONTENTSIntroduction and Summary of Results ............................................................................................................... 1
Level II summary ............................................................................................................................................... 7Description of Bridge ................................................................................................................................... 7Description of the Geomorphic Setting........................................................................................................ 8Description of the Channel........................................................................................................................... 8Hydrology..................................................................................................................................................... 9 Calculated Discharges .......................................................................................................................... 9Description of the Water-Surface Profile Model (WSPRO) Analysis ......................................................... 10 Cross-Sections Used in WSPRO Analysis............................................................................................ 10 Data and Assumptions Used in WSPRO Model ................................................................................... 11Bridge Hydraulics Summary........................................................................................................................ 12Scour Analysis Summary ............................................................................................................................. 13 Special Conditions or Assumptions Made in Scour Analysis............................................................... 13 Scour Results......................................................................................................................................... 14Riprap Sizing................................................................................................................................................ 14
References .......................................................................................................................................................... 18
Appendixes:
A. WSPRO input file.................................................................................................................................... 19
B. WSPRO output file .................................................................................................................................. 22
C. Bed-material particle-size distribution .................................................................................................... 29
D. Historical data form................................................................................................................................. 31
E. Level I data form...................................................................................................................................... 37
F. Scour computations.................................................................................................................................. 47
FIGURES
1. Map showing location of study area on USGS 1:25,000 scale map ............................................................. 3 2. Map showing location of study area on Vermont Agency of Transportation town
highway map ................................................................................................................................... 4 3. Structure PUTNTH00210029 viewed from upstream (August 19, 1996) .................................................... 5 4. Downstream channel viewed from structure PUTNTH00210029 (August 19, 1996). ................................ 5 5. Upstream channel viewed from structure PUTNTH00210029 (August 19, 1996). ..................................... 6 6. Structure PUTNTH00210029 viewed from downstream (August 19, 1996). .............................................. 6 7. Water-surface profiles for the 100- and 500-year discharges at structure
PUTNTH00210029 on Town Highway 21, crossing East Putney Brook, Putney, Vermont.............................................................................................................................. 15
8. Scour elevations for the 100- and 500-year discharges at structure PUTNTH00210029 on Town Highway 21, crossing East Putney Brook, Putney, Vermont.............................................................................................................................. 16
TABLES
1. Remaining footing/pile depth at abutments for the 100-year discharge at structurePUTNTH00210029 on Town Highway 21, crossing East Putney Brook,Putney, Vermont ................................................................................................................................. 17
2. Remaining footing/pile depth at abutments for the 500-year discharge at structure PUTNTH00210029 on Town Highway 21, crossing East Putney Brook,Putney, Vermont ................................................................................................................................. 17
iii

0iv
CONVERSION FACTORS, ABBREVIATIONS, AND VERTICAL DATUM
Multiply By To obtain
Length
inch (in.) 25.4 millimeter (mm) foot (ft) 0.3048 meter (m) mile (mi) 1.609 kilometer (km)
Slope
foot per mile (ft/mi) 0.1894 meter per kilometer (m/km)Area
square mile (mi2) 2.590 square kilometer (km2) Volume
cubic foot (ft3) 0.02832 cubic meter (m3)Velocity and Flow
foot per second (ft/s) 0.3048 meter per second (m/s)cubic foot per second (ft3/s) 0.02832 cubic meter per second (m3/s)cubic foot per second per 0.01093 cubic meter per square mile second per square [(ft3/s)/mi2] kilometer [(m3/s)/km2]
OTHER ABBREVIATIONS
BF bank full LWW left wingwallcfs cubic feet per second MC main channelD50 median diameter of bed material RAB right abutmentDS downstream RABUT face of right abutmentelev. elevation RB right bankf/p flood plain ROB right overbankft2 square feet RWW right wingwallft/ft feet per foot TH town highwayJCT junction UB under bridgeLAB left abutment US upstreamLABUT face of left abutment USGS United States Geological SurveyLB left bank VTAOT Vermont Agency of TransportationLOB left overbank WSPRO water-surface profile model
In this report, the words “right” and “left” refer to directions that would be reported by an observer facing downstream.
Sea level: In this report, “sea level” refers to the National Geodetic Vertical Datum of 1929-- a geodetic datum derived from a general adjustment of the first-order level nets of the United States and Canada, formerly called Sea Level Datum of 1929.
In the appendices, the above abbreviations may be combined. For example, USLB would represent upstream left bank.

LEVEL II SCOUR ANALYSIS FOR BRIDGE 29 (PUTNTH00210029) ON TOWN HIGHWAY 21,
CROSSING EAST PUTNEY BROOK,PUTNEY, VERMONT
By Erick M. Boehmler and Michael A. Ivanoff
INTRODUCTION AND SUMMARY OF RESULTS
This report provides the results of a detailed Level II analysis of scour potential at structure PUTNTH00210029 on Town Highway 21 crossing East Putney Brook, Putney, Vermont (figures 1–8). A Level II study is a basic engineering analysis of the site, including a quantitative analysis of stream stability and scour (U.S. Department of Transportation, 1993). Results of a Level I scour investigation also are included in Appendix E of this report. A Level I investigation provides a qualitative geomorphic characterization of the study site. Information on the bridge, gleaned from Vermont Agency of Transportation (VTAOT) files, was compiled prior to conducting Level I and Level II analyses and is found in Appendix D.
The site is in the New England Upland section of the New England physiographic province in southeastern Vermont. The 10.3-mi2 drainage area is in a predominantly rural and forested basin. In the vicinity of the study site, the surface cover consists of pasture and forest.
In the study area, East Putney Brook has an incised, sinuous channel with a slope of approximately 0.009 ft/ft, an average channel top width of 33 ft and an average bank height (channel depth) of 3 ft. The channel bed material is cobbles predominantly with a median grain size (D50) of 80.7 mm (0.265 ft). The geomorphic assessment at the time of the Level I and Level II site visit on August 19, 1996, indicated that the reach was stable.
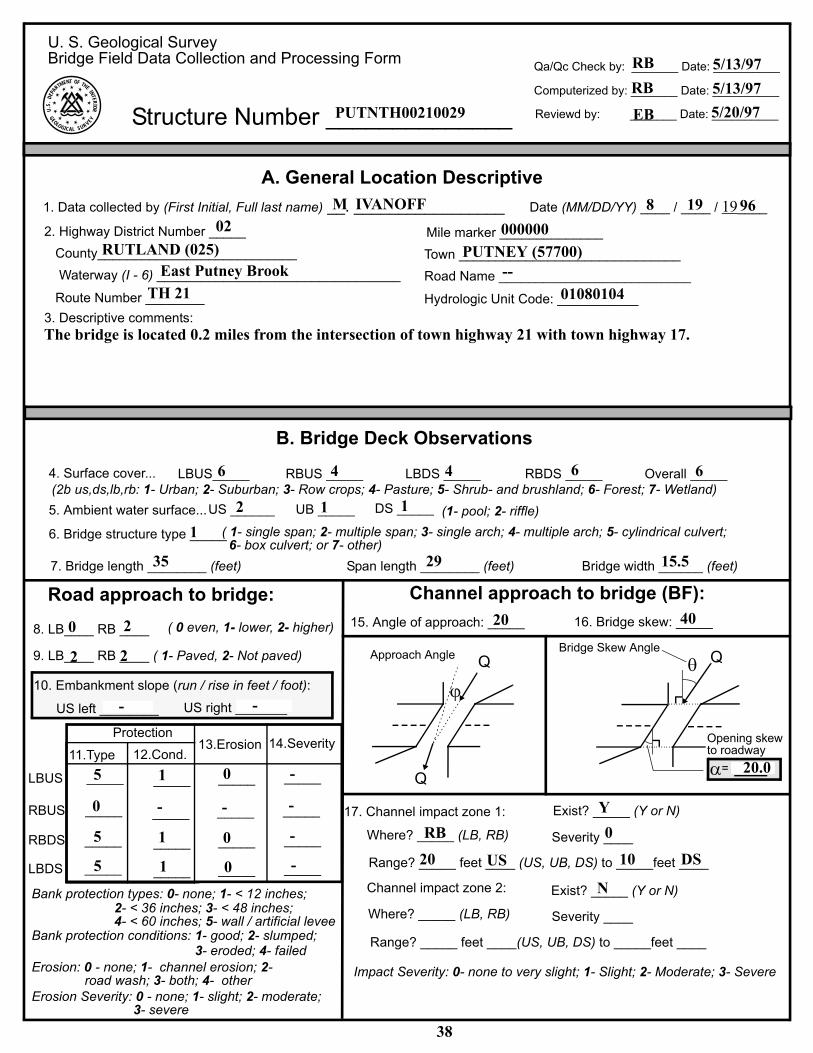
The Town Highway 21 crossing of East Putney Brook is a 35-ft-long, one-lane bridge consisting of one 29-foot steel-beam span (Vermont Agency of Transportation, written communication, March 30, 1995). The bridge is supported by vertical, concrete abutments with wingwalls. The channel is skewed approximately 40 degrees to the opening. Historical records show an opening-skew-to-roadway of 10 degrees but 20 degrees was computed using field survey data and used in this study.
The scour protection measures at the site were type-2 stone fill (less than 36 inches diameter) on each abutment wall, the upstream right wingwall and the upstream right bank, and type-3 stone fill (less than 48 inches diameter) on the left bank upstream, the upstream left wingwall, and the downstream right bank. Additional details describing conditions at the site are included in the Level II Summary and Appendices D and E.
1
Scour depths and recommended rock rip-rap sizes were computed using the general guidelines described in Hydraulic Engineering Circular 18 (Richardson and others, 1995). Total scour at a highway crossing is comprised of three components: 1) long-term streambed degradation; 2) contraction scour (due to accelerated flow caused by a reduction in flow area at a bridge) and; 3) local scour (caused by accelerated flow around piers and abutments). Total scour is the sum of the three components. Equations are available to compute depths for contraction and local scour and a summary of the results of these computations follows.
Contraction scour for all modelled flows ranged from 0.0 to 0.9 feet. The worst-case contraction scour occurred at the incipient-overtopping discharge, which was less than the 100-year discharge. Abutment scour ranged from 6.1 to 18.4 feet. The worst-case abutment scour occurred at the 500-year discharge for the right abutment and the incipient overtopping discharge for the left abutment. Additional information on scour depths and depths to armoring are included in the section titled “Scour Results”. Scoured-streambed elevations, based on the calculated scour depths, are presented in tables 1 and 2. A cross-section of the scour computed at the bridge is presented in figure 8. Scour depths were calculated assuming an infinite depth of erosive material and a homogeneous particle-size distribution.
It is generally accepted that the Froehlich equation (abutment scour) gives “excessively conservative estimates of scour depths” (Richardson and others, 1995, p. 47). Usually, computed scour depths are evaluated in combination with other information including (but not limited to) historical performance during flood events, the geomorphic stability assessment, existing scour protection measures, and the results of the hydraulic analyses. Therefore, scour depths adopted by VTAOT may differ from the computed values documented herein.
2
3
Figure 1. Location of study area on USGS 1:25,000 scale map.
Walpole, NH-VT, 1985; Keene, NH-VT, 1984; Townshend, VT, 1984; and Newfane,
VT, 1984. All scales are 1:25,000 and contour intervals are 6 meters.
NORTH

4
Figure 2. Location of study area on Vermont Agency of Transportation town highway map.

Figure 3. Structure PUTNTH00210029 viewed from upstream (August 19, 1996).
Figure 4. Downstream channel viewed from structure PUTNTH00210029 (August 19, 1996).
5

Figure 5. Upstream channel viewed from structure PUTNTH00210029 (August 19, 1996).
Figure 6. Structure PUTNTH00210029 viewed from downstream (August 19, 1996).
6

LEVEL II SUMMARY
Structure Number Stream
County
Bridge length
Alignment of bri
Abutment type
Stone fill on abut
Is bridge skewed
Debris accumul
Level I
Potential fo
PUTNTH00210029
7
Road
Description of Bridge
ft Bridge width
ght)
Embankme
ment?
to flood flow according t rvey?
ation on bridge at time of Level I or Level
D Percent blocked
r debris
East Putney Brook
District
Windham TH 21nt type
Angle
II site visit:
Percent blocked
2
35
15.5 29 ft Max span length ftCurve
dge to road (on curve or straiVertical, concrete
Sloping near vertical
Yes
8/19/96
Date of inspectionType-2 along each abutment wall, the upstream right bank, and the
Description of stone fillupstream right wingwall. Type-3 along the upstream left bank, upstream left wingwall, and thedownstream right bank.
Abutments and wingwalls are concrete.
Brief description of piers/abutments
Yes
40o Level I suNo
Is bridge located on a bend in channel? If so, describe (mild, moderate, severe)
ate of inspection 8/19/96
of channel horizontally 0
of channel vertically
0
8/19/96
0 0Moderate. There is significant vegetation growth on the immediate
Level IIbanks but banks are stable.
None evident on 8/19/96.
Describe any features near or at the bridge that may affect flow (include observation date).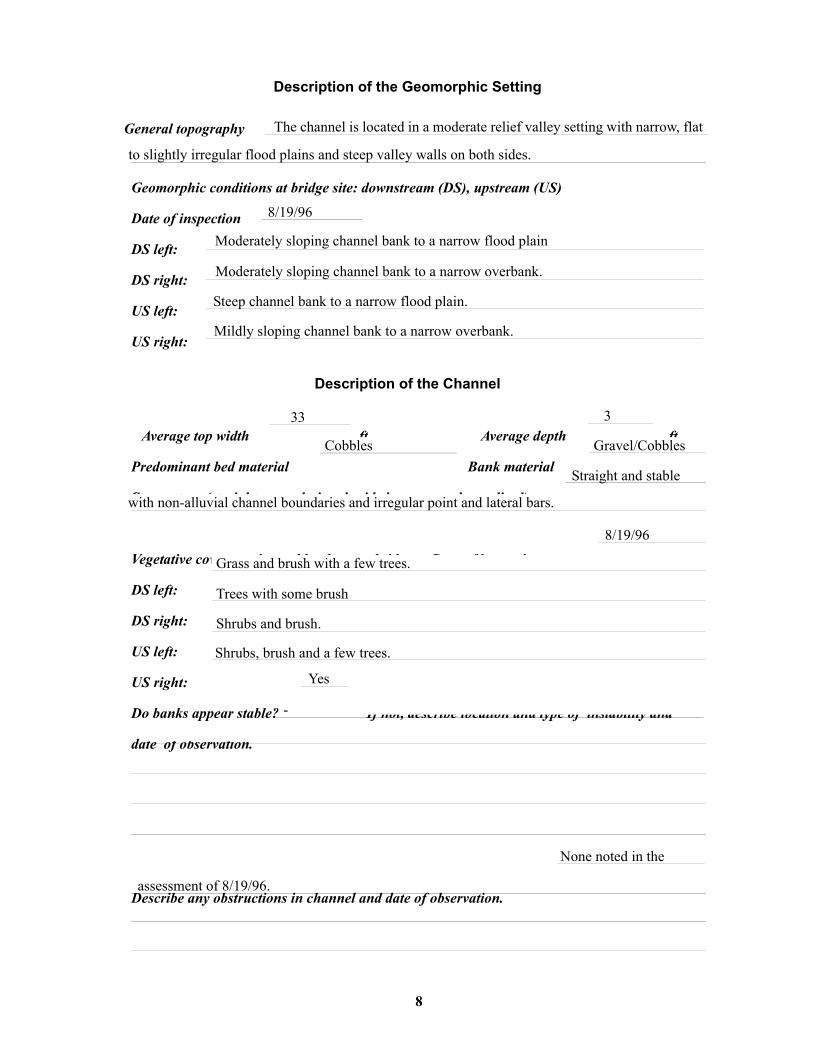
Description of the Geomorphic Setting
General topography
Geomorphic conditio
Date of insp
DS left:
DS right:
US left:
US right:
Average top width
Predominant bed ma
Vegetative c
DS left:
DS right:
US left:
US right:
The channel is located in a moderate relief valley setting with narrow, flat
to slightly irregular flood plains and steep valley walls on both sides.
wnstream (DS), upstream (US)
ns at bridge site: do8/19/96
ectionModerately sloping channel bank to a narrow flood plain
Moderately sloping channel bank to a narrow overbank.
Steep channel bank to a narrow flood plain.
Mildly sloping channel bank to a narrow overbank.
Description of the Channel
teri
33
Average depthal Bank material
8
3
ftCobbles
ftGravel/Cobbles
Straight and stable
Stream type (straight, meandering, braided, swampy, channelized) with non-alluvial channel boundaries and irregular point and lateral bars.
8/19/96
over on channel banks near bridge: Date of inspection Grass and brush with a few trees.
Trees with some brush
Shrubs and brush.
Shrubs, brush and a few trees.
Yes
? If not, describe location and type of instability and -
Do banks appear stabledate of observation.
None noted in the
Describe any obstructions in channel and date of observation. assessment of 8/19/96.
Hydrology
Drainage area i2
Percentage of dra
Is drainage a
Is there a USGS
Is there a lake/
Q
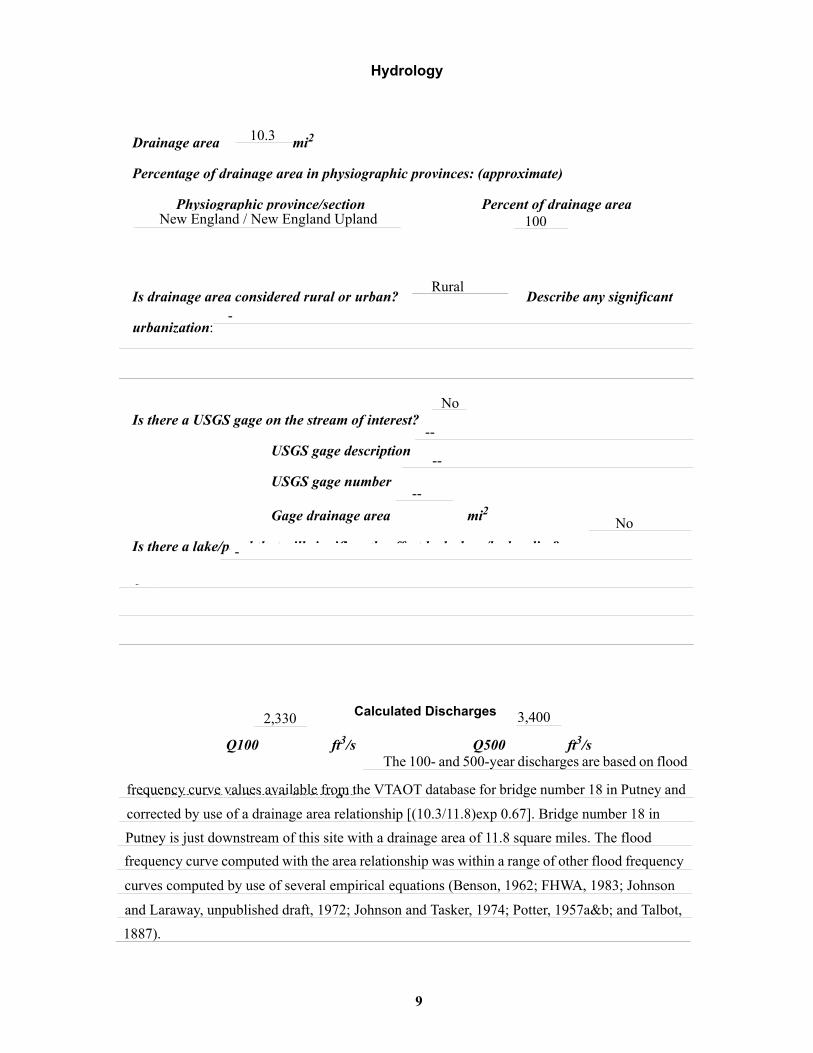
m10.3
inage area in physiographic provinces: (approximate)
Perc age area
Physiographic province/section New England / New England Uplandgage on the stream of interest
USGS gage description
USGS gage number
Gage drainage area mi2
Calculated Discharges
100 ft3/s
9
ent of drain100
Rural
rea considered rural or urban? Describe any significant-
urbanization:
No
?--
--
--No
pond that will significantly affect hydrology/hydraulics?-
If so, describe
2,330
3,400Q500 ft3/sThe 100- and 500-year discharges are based on flood
Method used to determine discharges frequency curve values available from the VTAOT database for bridge number 18 in Putney and
corrected by use of a drainage area relationship [(10.3/11.8)exp 0.67]. Bridge number 18 in
Putney is just downstream of this site with a drainage area of 11.8 square miles. The flood
frequency curve computed with the area relationship was within a range of other flood frequency
curves computed by use of several empirical equations (Benson, 1962; FHWA, 1983; Johnson
and Laraway, unpublished draft, 1972; Johnson and Tasker, 1974; Potter, 1957a&b; and Talbot,
1887).
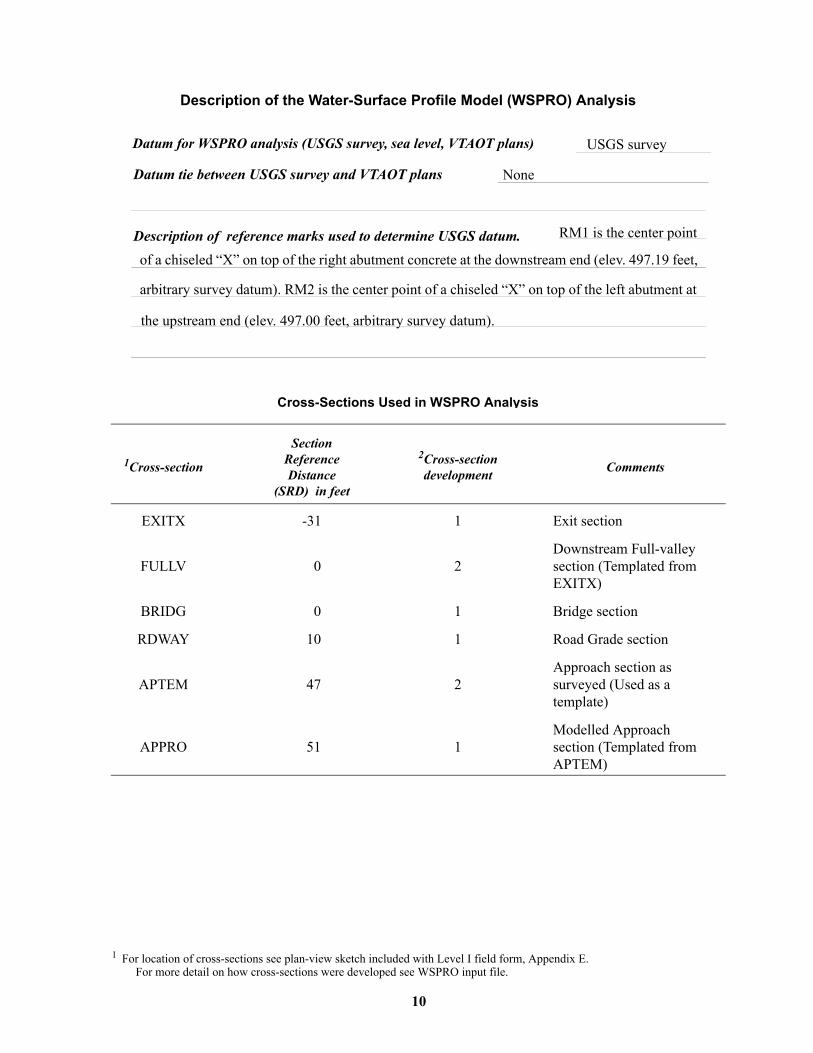
Description of the Water-Surface Profile Model (WSPRO) Analysis
Datum for WSPRO analysis (USGS survey, sea level, VTAOT plans)
Datum tie between USGS survey and VTAOT plans
Cross-Sections Used in WSPRO Analysis
1 For location of cross-sections see plan-view sketch included with Level I field form, Appendix For more detail on how cross-sections were developed see WSPRO input file.
10
1Cross-section
Section Reference Distance
(SRD) in feet
2Cross-section development
EXITX -31 1 Exit
FULLV 0 2DowsectEXI
BRIDG 0 1 Brid
RDWAY 10 1 Roa
APTEM 47 2Appsurvtem
APPRO 51 1ModsectAPT
USGS survey
None
RM1 is the center point
Description of reference marks used to determine USGS datum.of a chiseled “X” on top of the right abutment concrete at the downstream end (elev. 497.19 feet,
arbitrary survey datum). RM2 is the center point of a chiseled “X” on top of the left abutment at
the upstream end (elev. 497.00 feet, arbitrary survey datum).
E.
Comments
section
nstream Full-valley ion (Templated from TX)
ge section
d Grade section
roach section aseyed (Used as aplate)
elled Approachion (Templated from EM)

Data and Assumptions Used in WSPRO Model
11
Hydraulic analyses of the reach were done by use of the Federal Highway
Administration’s WSPRO step-backwater computer program (Shearman and others, 1986, and
Shearman, 1990). The analyses reported herein reflect conditions existing at the site at the time
of the study. Furthermore, in the development of the model it was necessary to assume no
accumulation of debris or ice at the site. Results of the hydraulic model are presented in the
Bridge Hydraulic Summary, Appendix B, and figure 7.
Channel roughness factors (Manning’s “n”) used in the hydraulic model were estimated
using field inspections at each cross section following the general guidelines described by
Arcement and Schneider (1989). Final adjustments to the values were made during the
modelling of the reach. Channel “n” values for the reach ranged from 0.040 to 0.045, and
overbank “n” values ranged from 0.050 to 0.065.
Normal depth at the exit section (EXITX) was assumed as the starting water surface.
This depth was computed by use of the slope-conveyance method outlined in the user’s manual
for WSPRO (Shearman, 1990). The slope used was 0.00926 ft/ft, which was estimated from the
topographic map downstream of the site (U.S. Geological Survey, 1985).
The surveyed approach section (APTEM) was moved along the approach channel slope
(0.0248 ft/ft) to establish the modelled approach section (APPRO), one bridge length upstream
of the upstream face as recommended by Shearman and others (1986). This location also
provides a consistent method for determining scour variables.
For the incipient-overtopping discharge, WSPRO assumes critical depth at the bridge
section. A supercritical model was developed for this discharge. After analyzing both the
supercritical and subcritical profiles, it can be determined that the water surface profile does
pass through critical depth within the bridge opening. Thus, the assumption of critical depth at
the bridge is a satisfactory solution.
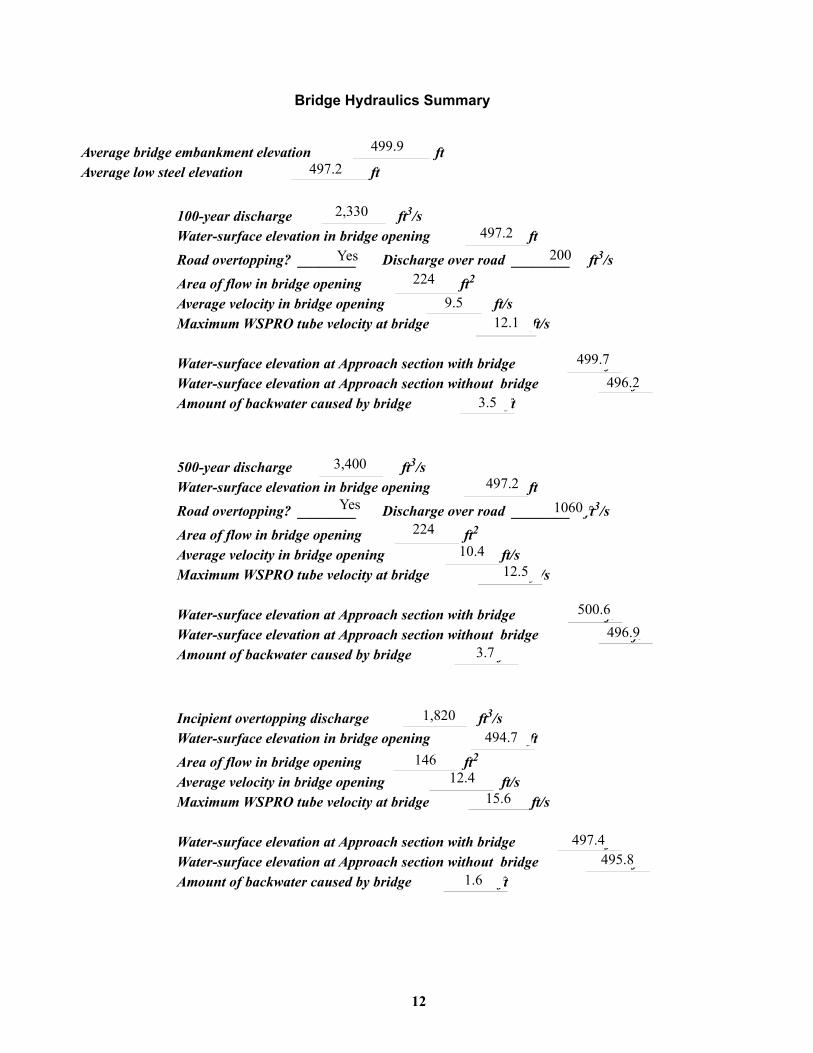
Bridge Hydraulics Summary
Average bridge embankment eleva ftAverage low steel elevation
100-year discharge Water-surface elevati
Road overtopping? _
Area of flow in bridge openAverage velocity in bridge oMaximum WSPRO tube vel Water-surface elevation at AWater-surface elevation at AAmount of backwater cause
500-year discharge Water-surface elevatio
Road overtopping? __
Area of flow in bridge openAverage velocity in bridge oMaximum WSPRO tube vel Water-surface elevation at AWater-surface elevation at AAmount of backwater cause
Incipient overtopping dischWater-surface elevation in b
Area of flow in bridge openAverage velocity in bridge oMaximum WSPRO tube vel Water-surface elevation at AWater-surface elevation at AAmount of backwater cause
499.9
ft
tion497.2
ft3/s
2,33012
ening
ing pening ocity at bridge
pproach section wipproach section wd by bridge
ft3/s ening
ing pening ocity at bridge pproach section wipproach section
d by bridge
arge ridge opening
ing pening ocity at bridge pproach section wipproach sectio
d by bridge
ft497.2
r road __ 3/s
on in bridge op
_______ DYes
2
th bridge g
r road __2
th bridge
3
th bridge dg
______ ft200
ischarge oveft224
9.5
ft/s ft/s12.1e
__
e
/s
e
ft499.7
ft496.2
ithout brid ft3.53,400
ft497.2
s
n in bridge op
______ DYes
____ ft3/1060 ischarge ovef224
t ft10.4 /sft/s12.5
ft500.6
ft496.9
without bridg ft3.7f1,820
t /s ft494.7f146
t2f12.4
t/s ft15.6ft497.4
ft495.8
n without bri ft1.6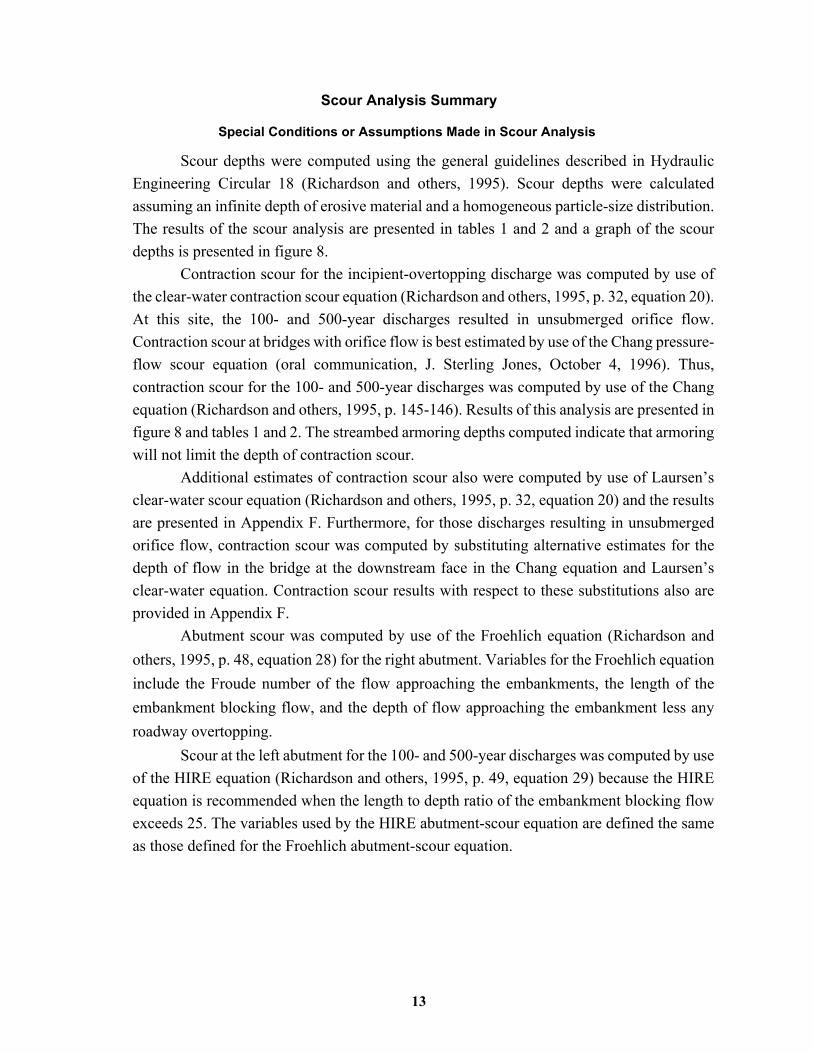
Scour Analysis Summary
Special Conditions or Assumptions Made in Scour Analysis
13
Scour depths were computed using the general guidelines described in Hydraulic
Engineering Circular 18 (Richardson and others, 1995). Scour depths were calculated
assuming an infinite depth of erosive material and a homogeneous particle-size distribution.
The results of the scour analysis are presented in tables 1 and 2 and a graph of the scour
depths is presented in figure 8.
Contraction scour for the incipient-overtopping discharge was computed by use of
the clear-water contraction scour equation (Richardson and others, 1995, p. 32, equation 20).
At this site, the 100- and 500-year discharges resulted in unsubmerged orifice flow.
Contraction scour at bridges with orifice flow is best estimated by use of the Chang pressure-
flow scour equation (oral communication, J. Sterling Jones, October 4, 1996). Thus,
contraction scour for the 100- and 500-year discharges was computed by use of the Chang
equation (Richardson and others, 1995, p. 145-146). Results of this analysis are presented in
figure 8 and tables 1 and 2. The streambed armoring depths computed indicate that armoring
will not limit the depth of contraction scour.
Additional estimates of contraction scour also were computed by use of Laursen’s
clear-water scour equation (Richardson and others, 1995, p. 32, equation 20) and the results
are presented in Appendix F. Furthermore, for those discharges resulting in unsubmerged
orifice flow, contraction scour was computed by substituting alternative estimates for the
depth of flow in the bridge at the downstream face in the Chang equation and Laursen’s
clear-water equation. Contraction scour results with respect to these substitutions also are
provided in Appendix F.
Abutment scour was computed by use of the Froehlich equation (Richardson and
others, 1995, p. 48, equation 28) for the right abutment. Variables for the Froehlich equation
include the Froude number of the flow approaching the embankments, the length of the
embankment blocking flow, and the depth of flow approaching the embankment less any
roadway overtopping.
Scour at the left abutment for the 100- and 500-year discharges was computed by use
of the HIRE equation (Richardson and others, 1995, p. 49, equation 29) because the HIRE
equation is recommended when the length to depth ratio of the embankment blocking flow
exceeds 25. The variables used by the HIRE abutment-scour equation are defined the same
as those defined for the Froehlich abutment-scour equation.
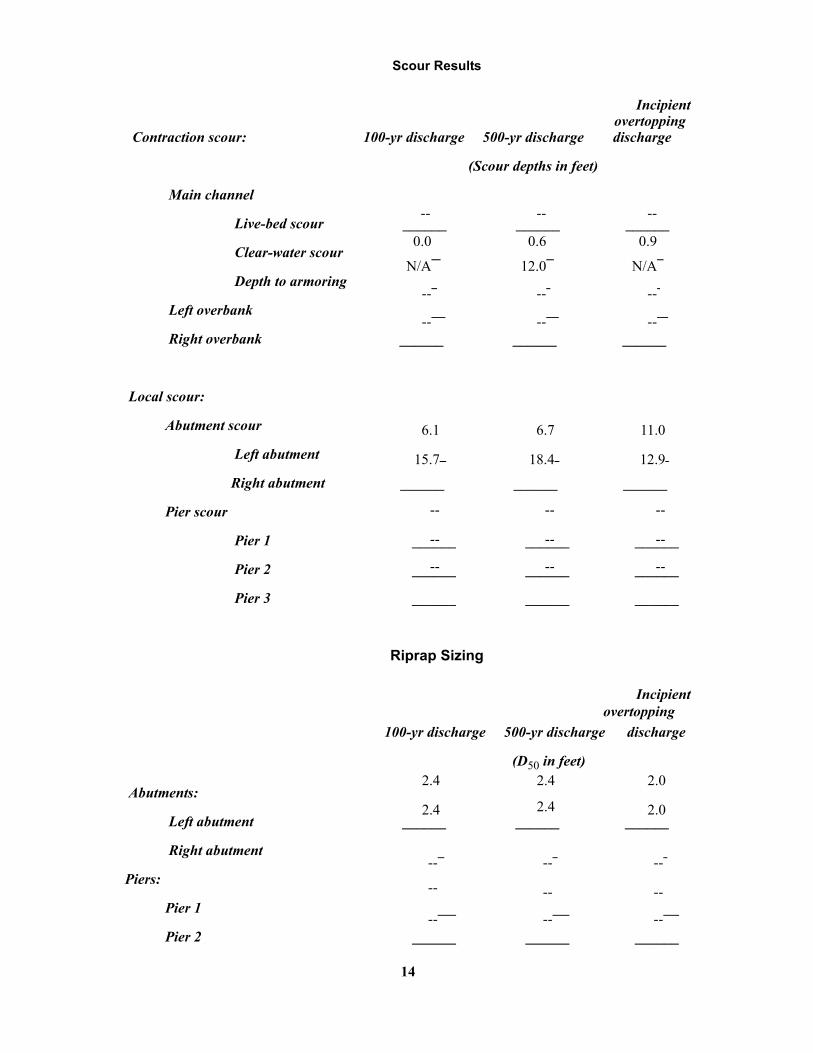
Scour Results
Incipient overtopping
Contraction scour: 100-yr discharge 500-yr discharge discharge
(Scour depths in feet)
Main channel
Live-bed scour
Clear-water scour
Depth to armoring
Left overbank
Right overbank
Local scour:
Abutment scour
Left abutment
Right abutment
Pier scour
Pier 1
Pier 2
Pier 3
Abutments:
Left abutment
Right abutment
Piers:
Pier 1
Pier 2
______--
14
______
______
______
Riprap Sizing
100-yr discharge
_
______
______--
______
______
______
500-yr discharg
et)
______
______
______--
______ 0.0
______ 0.6
______0.9
N/A
12.0 N/A ______--
______--
______--
______--
______--
______--
______6.1
6.7o
e
11.0
______ 15.7
______ 18.4 ______12.9______
--
-- --______--
______-- ______--______--
______-- ______--______
Incipient vertopping
discharge
2.4
(D50 in fe2.4
2.0______ 2.4
2.4______2.0
______ --
______ --
______--
--
-- -- _____--
______--
______--
______
15
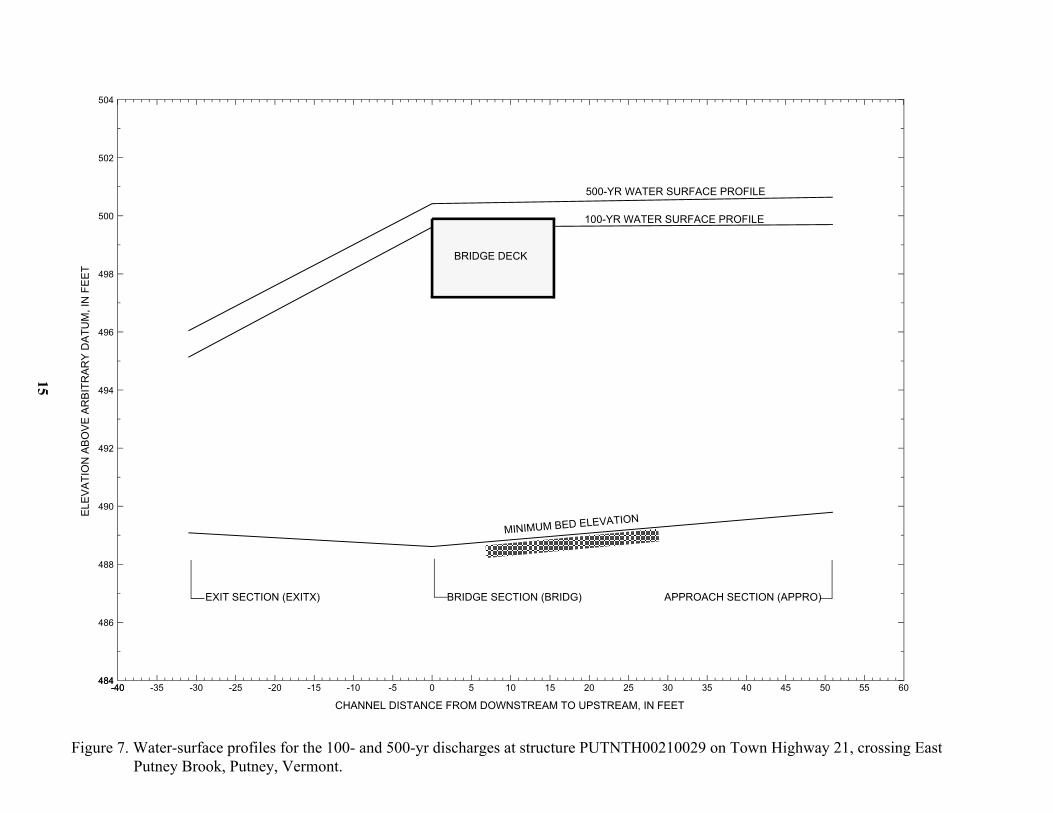
Figure 7. Water-surface profiles for the 100- and 500-yr discharges at structure PUTNTH00210029 on Town Highway 21, crossing East Putney Brook, Putney, Vermont.
ELE
VA
TIO
N A
BO
VE
AR
BIT
RA
RY
DA
TU
M,
IN F
EE
T
CHANNEL DISTANCE FROM DOWNSTREAM TO UPSTREAM, IN FEET
-40 60-40 -35 -30 -25 -20 -15 -10 -5 0 5 10 15 20 25 30 35 40 45 50 55484
504
484
486
488
490
492
494
496
498
500
502
MINIMUM BED ELEVATION
APPROACH SECTION (APPRO) BRIDGE SECTION (BRIDG)
500-YR WATER SURFACE PROFILE
100-YR WATER SURFACE PROFILE
BRIDGE DECK
EXIT SECTION (EXITX)
16
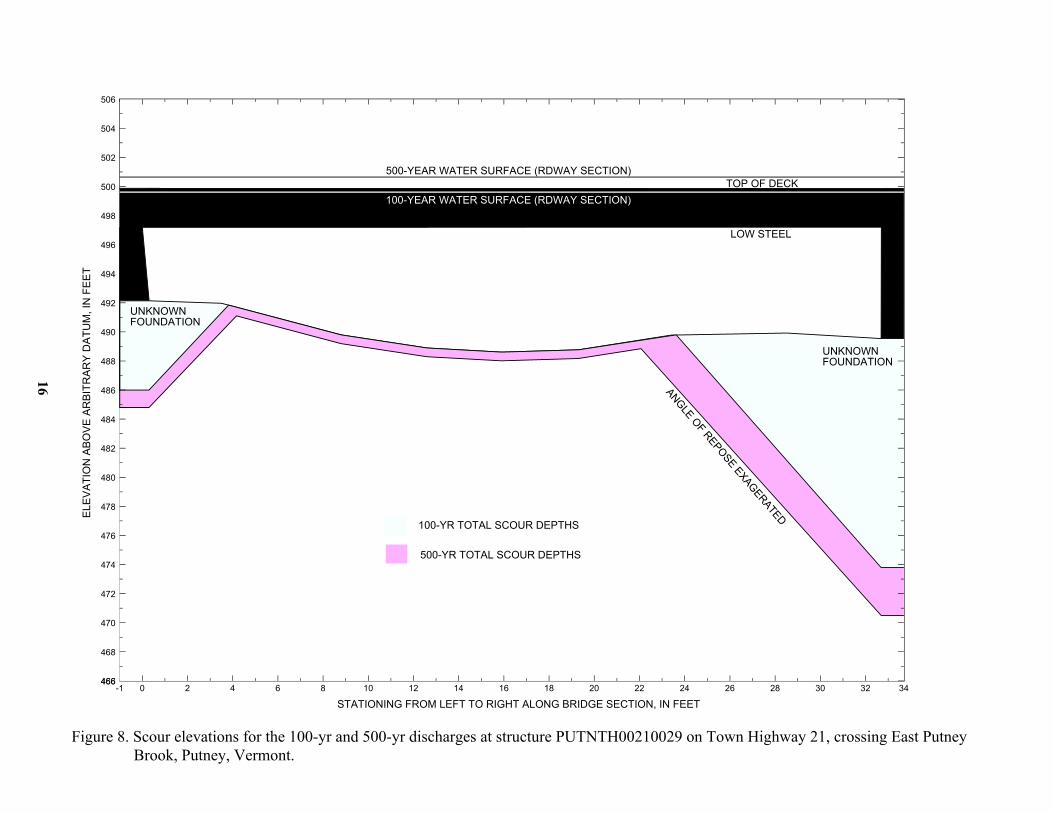
Figure 8. Scour elevations for the 100-yr and 500-yr discharges at structure PUTNTH00210029 on Town Highway 21, crossing East Putney Brook, Putney, Vermont.
ELE
VA
TIO
N A
BO
VE
AR
BIT
RA
RY
DA
TU
M, I
N F
EE
T
STATIONING FROM LEFT TO RIGHT ALONG BRIDGE SECTION, IN FEET
-1 340 2 4 6 8 10 12 14 16 18 20 22 24 26 28 30 32466
506
466
468
470
472
474
476
478
480
482
484
486
488
490
492
494
496
498
500
502
504
100-YR TOTAL SCOUR DEPTHS
500-YR TOTAL SCOUR DEPTHS
ANGLE O
F REPOSE EXAG
ERATED
UNKNOWNFOUNDATION
LOW STEEL
TOP OF DECK500-YEAR WATER SURFACE (RDWAY SECTION)
100-YEAR WATER SURFACE (RDWAY SECTION)
UNKNOWNFOUNDATION

17
Table 1. Remaining footing/pile depth at abutments for the 100-year discharge at structure PUTNTH00210029 on Town Highway 21, crossing East Putney Brook, Putney, Vermont.[VTAOT, Vermont Agency of Transportation; --, no data]
Description Station1
1.Measured along the face of the most constricting side of the bridge.
VTAOT minimum low-chord elevation
(feet)
Surveyed minimum low-chord elevation2
(feet)
2.Arbitrary datum for this study.
Bottom of footing
elevation2
(feet)
Channel elevation at abutment/
pier2
(feet)
Contraction scour depth
(feet)
Abutment scour depth (feet)
Pier scour depth (feet)
Depth of total scour
(feet)
Elevation of scour2
(feet)
Remaining footing/pile
depth(feet)
100-yr. discharge is 2,330 cubic-feet per second
Left abutment 0.0 -- 497.2 -- 492.1 0.0 6.1 -- 6.1 486.0 --
Right abutment 32.7 -- 497.2 -- 489.5 0.0 15.7 -- 15.7 473.8 --
Table 2. Remaining footing/pile depth at abutments for the 500-year discharge at structure PUTNTH00210029 on Town Highway 21, crossing East Putney Brook, Putney, Vermont.[VTAOT, Vermont Agency of Transportation; --, no data]
Description Station1
1.Measured along the face of the most constricting side of the bridge.
VTAOT minimum low-chord elevation
(feet)
Surveyed minimum low-chord elevation2
(feet)
2.Arbitrary datum for this study.
Bottom of footing
elevation2
(feet)
Channel elevation at abutment/
pier2
(feet)
Contraction scour depth
(feet)
Abutment scour depth (feet)
Pier scour depth (feet)
Depth of total scour
(feet)
Elevation of scour2
(feet)
Remaining footing/pile
depth(feet)
500-yr. discharge is 3,400 cubic-feet per second
Left abutment 0.0 -- 497.2 -- 492.1 0.6 6.7 -- 7.3 484.8 --
Right abutment 32.7 -- 497.2 -- 489.5 0.6 18.4 19.0 470.5 --
18
SELECTED REFERENCES
Arcement, G.J., Jr., and Schneider, V.R., 1989, Guide for selecting Manning’s roughness coefficients for natural channels and flood plains: U.S. Geological Survey Water-Supply Paper 2339, 38 p.
Barnes, H.H., Jr., 1967, Roughness characteristics of natural channels: U.S. Geological Survey Water-Supply Paper 1849, 213 p.
Benson, M. A., 1962, Factors Influencing the Occurrence of Floods in a Humid Region of Diverse Terrain: U.S. Geological Survey Water-Supply Paper 1580-B, 64 p.
Brown, S.A. and Clyde, E.S., 1989, Design of riprap revetment: Federal Highway Administration Hydraulic Engineering Circular No. 11, Publication FHWA-IP-89-016, 156 p.
Federal Highway Administration, 1983, Runoff estimates for small watersheds and development of sound design: Federal Highway Administration Report FHWA-RD-77-158.
Federal Highway Administration, 1993, Stream Stability and Scour at Highway Bridges: Participant Workbook: Federal Highway Administration Report FHWA-HI-91-011.
Froehlich, D.C., 1989, Local scour at bridge abutments in Ports, M.A., ed., Hydraulic Engineering--Proceedings of the 1989 National Conference on Hydraulic Engineering: New York, American Society of Civil Engineers, p. 13-18.
Hayes, D.C.,1993, Site selection and collection of bridge-scour data in Delaware, Maryland, and Virginia: U.S. Geological Survey Water-Resources Investigation Report 93-4017, 23 p.
Johnson, C.G. and Tasker, G.D.,1974, Progress report on flood magnitude and frequency of Vermont streams: U.S. Geological Survey Open-File Report 74-130, 37 p.
Lagasse, P.F., Schall, J.D., Johnson, F., Richardson, E.V., Chang, F., 1995, Stream Stability at Highway Structures: Federal Highway Administration Hydraulic Engineering Circular No. 20, Publication FHWA-IP-90-014, 144 p.
Laursen, E.M., 1960, Scour at bridge crossings: Journal of the Hydraulics Division, American Society of Civil Engineers, v. 86, no. HY2, p. 39-53.
Potter, W. D., 1957a, Peak rates of runoff in the Adirondack, White Mountains, and Maine woods area, Bureau of Public Roads
Potter, W. D., 1957b, Peak rates of runoff in the New England Hill and Lowland area, Bureau of Public Roads
Richardson, E.V. and Davis, S.R., 1995, Evaluating scour at bridges: Federal Highway Administration Hydraulic Engineering Circular No. 18, Publication FHWA-IP-90-017, 204 p.
Richardson, E.V., Simons, D.B., and Julien, P.Y., 1990, Highways in the river environment: Federal Highway Administration Publication FHWA-HI-90-016.
Ritter, D.F., 1984, Process Geomorphology: W.C. Brown Co., Debuque, Iowa, 603 p.
Shearman, J.O., 1990, User’s manual for WSPRO--a computer model for water surface profile computations: Federal Highway Administration Publication FHWA-IP-89-027, 187 p.
Shearman, J.O., Kirby, W.H., Schneider, V.R., and Flippo, H.N., 1986, Bridge waterways analysis model; research report: Federal Highway Administration Publication FHWA-RD-86-108, 112 p.
Talbot, A.N., 1887, The determination of water-way for bridges and culverts.
U.S. Department of Transportation, 1993, Stream stability and scour at highway bridges, Participant Workbook: Federal Highway Administration Publication FHWA HI-91-011.
U.S. Geological Survey, 1985, Walpole New Hampshire / Vermont 7.5 by 15 Minute Series quadrangle map: U.S. Geological Survey Topographic Maps, Aerial photographs, 19; Contour interval, 6 meters; Scale 1:25,000.
U.S. Geological Survey, 1984, Keene, New Hampshire / Vermont 7.5 by 15 Minute Series quadrangle map: U.S. Geological Survey Topographic Maps, Aerial photographs, 1984; Contour interval, 6 meters; Scale 1:25,000.
U.S. Geological Survey, 1984, Townshend, Vermont 7.5 by 15 Minute Series quadrangle map: U.S. Geological Survey Topographic Maps, Aerial photographs, 1977; Contour interval, 6 meters; Scale 1:25,000.
U.S. Geological Survey, 1984, Newfane, Vermont 7.5 by 15 Minute Series quadrangle map: U.S. Geological Survey Topographic Maps, Aerial photographs, 1977; Contour interval, 6 meters; Scale 1:25,000.
19
APPENDIX A:
WSPRO INPUT FILE

WSPRO INPUT FILE
T1 U.S. Geological Survey WSPRO Input File putn029.wsp T2 Hydraulic analysis for structure PUTNTH00210029 Date: 28-JAN-97 T3 Town Highway 21 over East Putney Brook, Putney, VT EMB *J1 * * 0.005J3 6 29 30 552 553 551 5 16 17 13 3 * 15 14 23 21 11 12 4 7 3*Q 2330.0 3400.0 1820.0SK 0.00926 0.00926 0.00926*XS EXITX -31*GR -229.3, 507.63 -187.4, 500.77 -168.0, 497.60 -54.6, 497.60GR -41.6, 495.79 -17.3, 493.26 -4.8, 492.33 0.0, 490.41GR 5.4, 489.77 8.6, 489.43 12.4, 489.08 15.7, 489.18GR 16.9, 489.77 22.1, 490.06 27.8, 492.16 75.2, 493.23GR 105.9, 505.83*N 0.050 0.040 0.060SA -4.8 27.8*XS FULLV 0 * * * 0.0000** SRD LSEL XSSKEWBR BRIDG 0 497.19 20.0GR 0.0, 497.19 0.3, 492.14 3.5, 491.97 8.8, 489.79GR 12.6, 488.89 15.9, 488.61 19.3, 488.77 23.4, 489.78GR 28.5, 489.92 32.7, 489.54 32.7, 497.20 0.0, 497.19** BRTYPE BRWDTH WWANGL WWWIDCD 1 21.9 * * 38.0 3.3N 0.040** SRD EMBWID IPAVEXR RDWAY 10 15.5 2GR -229.3, 507.47 -152.9, 500.92 -110.4, 499.25 -45.3, 498.66GR 0.0, 499.87 32.8, 499.86 80.6, 499.65 105.2, 500.48GR 156.9, 502.91* 269.4, 498.03 347.4, 502.97 686.3, 506.13**XT APTEM 47GR -210.1, 507.47 -133.8, 500.92 -123.2, 497.66GR -10.0, 497.33 -8.4, 494.31 0.0, 490.09GR 2.0, 489.69 8.2, 489.78 12.3, 489.89 15.7, 490.08GR 21.7, 491.19 40.0, 493.59 59.1, 494.90 105.7, 495.01GR 125.0, 506.95*AS APPRO 51 * * * 0.0248GTN 0.065 0.045 0.050SA -10.0 21.7*
20

WSPRO INPUT FILE (continued)
HP 1 BRIDG 497.19 1 497.19HP 2 BRIDG 497.19 * * 2126HP 2 RDWAY 499.61 * * 200HP 1 APPRO 499.70 1 499.70HP 2 APPRO 499.70 * * 2330*HP 1 BRIDG 497.20 1 497.20HP 2 BRIDG 497.20 * * 2336HP 2 RDWAY 500.42 * * 1056HP 1 APPRO 500.64 1 500.64HP 2 APPRO 500.64 * * 3400*HP 1 BRIDG 494.65 1 494.65HP 2 BRIDG 494.65 * * 1820HP 1 APPRO 497.39 1 497.39HP 2 APPRO 497.39 * * 1820*EXER
21

22
APPENDIX B:
WSPRO OUTPUT FILE

WSPRO OUTPUT FILE
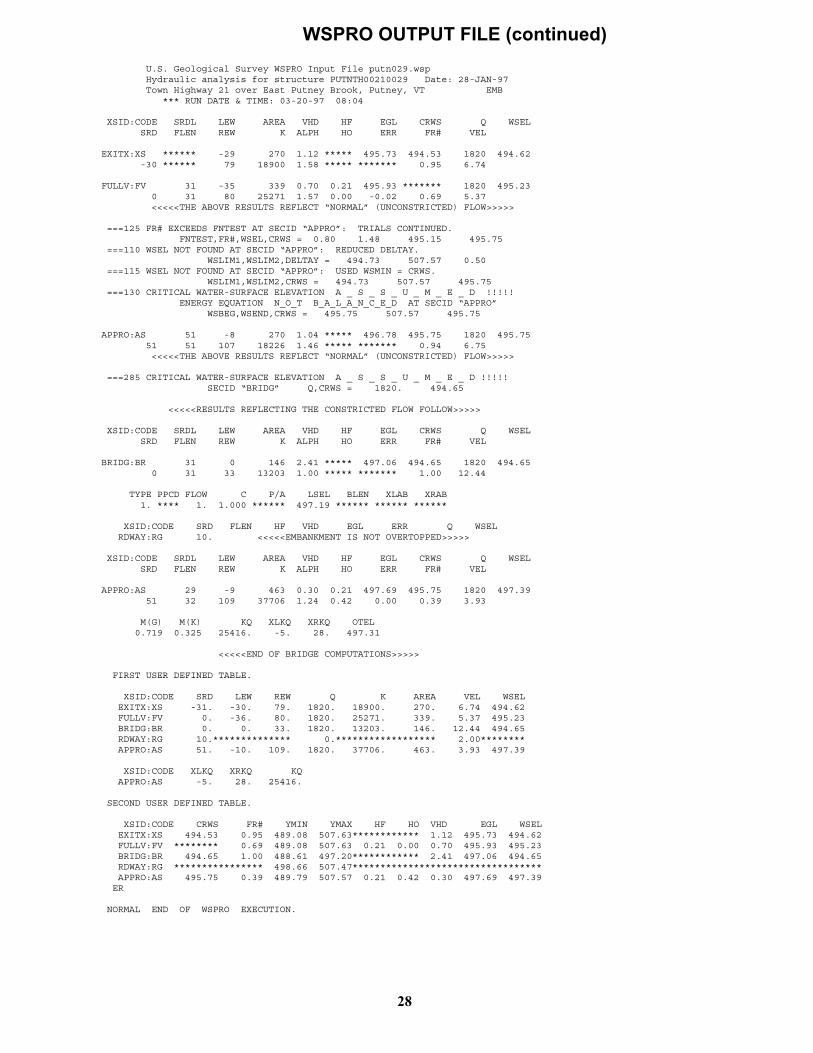
U.S. Geological Survey WSPRO Input File putn029.wsp Hydraulic analysis for structure PUTNTH00210029 Date: 28-JAN-97 Town Highway 21 over East Putney Brook, Putney, VT EMB *** RUN DATE & TIME: 03-20-97 08:04
CROSS-SECTION PROPERTIES: ISEQ = 3; SECID = BRIDG; SRD = 0.
WSEL SA# AREA K TOPW WETP ALPH LEW REW QCR 1 224 24742 31 44 3433 497.19 224 24742 31 44 1.00 0 33 3433
VELOCITY DISTRIBUTION: ISEQ = 3; SECID = BRIDG; SRD = 0.
WSEL LEW REW AREA K Q VEL 497.19 0.0 32.7 224.1 24742. 2126. 9.49
X STA. 0.0 4.3 6.6 8.4 9.9 11.3 A(I) 20.0 13.5 11.5 10.4 10.0 V(I) 5.32 7.85 9.22 10.24 10.62
X STA. 11.3 12.5 13.7 14.8 15.9 17.0 A(I) 9.6 9.1 9.1 8.8 8.8 V(I) 11.05 11.70 11.69 12.11 12.09
X STA. 17.0 18.1 19.3 20.5 21.7 23.1 A(I) 9.0 8.9 9.2 9.3 9.9 V(I) 11.82 11.89 11.58 11.42 10.79
X STA. 23.1 24.5 26.0 27.7 29.6 32.7 A(I) 10.2 10.5 11.5 13.2 21.6 V(I) 10.41 10.14 9.25 8.06 4.92
VELOCITY DISTRIBUTION: ISEQ = 4; SECID = RDWAY; SRD = 10.
WSEL LEW REW AREA K Q VEL 499.61 -119.6 -9.7 61.2 1234. 200. 3.27
X STA. -119.6 -102.2 -94.2 -87.8 -82.5 -77.6 A(I) 4.9 3.8 3.4 3.1 3.1 V(I) 2.04 2.65 2.93 3.19 3.24
X STA. -77.6 -73.4 -69.6 -65.9 -62.6 -59.4 A(I) 2.9 2.7 2.7 2.6 2.5 V(I) 3.47 3.69 3.69 3.85 3.95
X STA. -59.4 -56.5 -53.6 -50.8 -48.1 -45.5 A(I) 2.5 2.5 2.4 2.5 2.5 V(I) 4.02 4.02 4.08 4.07 3.99
X STA. -45.5 -42.7 -39.4 -35.3 -29.5 -9.7 A(I) 2.5 2.7 3.1 3.5 5.2 V(I) 3.97 3.64 3.26 2.89 1.91
CROSS-SECTION PROPERTIES: ISEQ = 5; SECID = APPRO; SRD = 51.
WSEL SA# AREA K TOPW WETP ALPH LEW REW QCR 1 245 9018 120 120 1984 2 275 36291 32 35 4605 3 468 40944 91 93 6004 499.70 988 86253 243 247 1.45 -129 113 9377
VELOCITY DISTRIBUTION: ISEQ = 5; SECID = APPRO; SRD = 51.
WSEL LEW REW AREA K Q VEL 499.70 -129.5 113.1 987.6 86253. 2330. 2.36
X STA. -129.5 -66.5 -15.2 -2.5 1.2 4.4 A(I) 120.8 111.8 57.8 34.2 30.8 V(I) 0.96 1.04 2.01 3.40 3.78
X STA. 4.4 7.4 10.4 13.4 16.5 19.8 A(I) 29.8 29.5 29.3 29.6 29.9 V(I) 3.92 3.95 3.97 3.93 3.89
X STA. 19.8 24.0 29.0 34.8 42.1 50.5 A(I) 34.8 38.9 41.4 45.6 46.8 V(I) 3.35 2.99 2.81 2.55 2.49
X STA. 50.5 61.2 72.3 83.8 95.3 113.1 A(I) 52.7 51.8 53.5 53.2 65.1 V(I) 2.21 2.25 2.18 2.19 1.79
23

WSPRO OUTPUT FILE (continued)
U.S. Geological Survey WSPRO Input File putn029.wsp Hydraulic analysis for structure PUTNTH00210029 Date: 28-JAN-97 Town Highway 21 over East Putney Brook, Putney, VT EMB *** RUN DATE & TIME: 03-20-97 08:04
CROSS-SECTION PROPERTIES: ISEQ = 3; SECID = BRIDG; SRD = 0.
WSEL SA# AREA K TOPW WETP ALPH LEW REW QCR 1 224 17388 0 75 0 497.20 224 17388 0 75 1.00 0 33 0
VELOCITY DISTRIBUTION: ISEQ = 3; SECID = BRIDG; SRD = 0.
WSEL LEW REW AREA K Q VEL 497.20 0.0 32.7 224.2 17388. 2336. 10.42
X STA. 0.0 3.9 6.3 8.2 9.7 11.1 A(I) 18.2 13.2 11.9 10.9 10.3 V(I) 6.42 8.82 9.78 10.76 11.34
X STA. 11.1 12.5 13.7 14.9 16.1 17.2 A(I) 10.2 9.6 9.6 9.3 9.3 V(I) 11.48 12.13 12.11 12.54 12.54
X STA. 17.2 18.4 19.6 20.9 22.2 23.7 A(I) 9.5 9.4 9.6 9.9 10.3 V(I) 12.30 12.39 12.17 11.79 11.34
X STA. 23.7 25.1 26.7 28.3 30.0 32.7 A(I) 10.3 10.7 11.3 11.7 18.8 V(I) 11.35 10.91 10.33 9.96 6.21
VELOCITY DISTRIBUTION: ISEQ = 4; SECID = RDWAY; SRD = 10.
WSEL LEW REW AREA K Q VEL 500.42 -140.2 103.4 223.9 6659. 1056. 4.72
X STA. -140.2 -111.1 -101.3 -93.2 -85.9 -79.2 A(I) 16.6 11.8 10.5 9.9 9.5 V(I) 3.18 4.48 5.02 5.31 5.54
X STA. -79.2 -72.9 -67.2 -61.7 -56.5 -51.6 A(I) 9.3 8.8 8.7 8.4 8.4 V(I) 5.70 5.98 6.07 6.29 6.31
X STA. -51.6 -46.8 -42.1 -36.8 -30.6 -22.6 A(I) 8.2 8.2 8.5 9.0 10.0 V(I) 6.47 6.46 6.20 5.84 5.30
X STA. -22.6 -11.3 9.7 35.6 64.7 103.4 A(I) 11.4 13.3 14.4 18.5 20.5 V(I) 4.65 3.96 3.66 2.86 2.58
CROSS-SECTION PROPERTIES: ISEQ = 5; SECID = APPRO; SRD = 51.
WSEL SA# AREA K TOPW WETP ALPH LEW REW QCR 1 358 16751 123 123 3476 2 305 43070 32 35 5372 3 554 53664 93 95 7684 500.64 1218 113485 247 252 1.42 -132 115 12880
VELOCITY DISTRIBUTION: ISEQ = 5; SECID = APPRO; SRD = 51.
WSEL LEW REW AREA K Q VEL 500.64 -132.6 114.6 1217.8 113485. 3400. 2.79
X STA. -132.6 -83.9 -45.1 -8.2 -1.7 2.2 A(I) 129.1 118.3 119.4 51.7 40.5 V(I) 1.32 1.44 1.42 3.29 4.20
X STA. 2.2 5.6 9.0 12.4 15.8 19.5 A(I) 37.4 36.3 36.1 36.6 37.3 V(I) 4.54 4.69 4.71 4.65 4.56
X STA. 19.5 24.0 29.4 35.7 43.3 52.3 A(I) 41.9 46.9 50.1 53.8 57.5 V(I) 4.06 3.63 3.39 3.16 2.96
X STA. 52.3 62.7 73.8 84.7 96.1 114.6 A(I) 60.6 61.9 61.2 63.2 78.1 V(I) 2.80 2.75 2.78 2.69 2.18
24
WSPRO OUTPUT FILE (continued)
U.S. Geological Survey WSPRO Input File putn029.wsp Hydraulic analysis for structure PUTNTH00210029 Date: 28-JAN-97 Town Highway 21 over East Putney Brook, Putney, VT EMB *** RUN DATE & TIME: 03-20-97 08:04
CROSS-SECTION PROPERTIES: ISEQ = 3; SECID = BRIDG; SRD = 0.
WSEL SA# AREA K TOPW WETP ALPH LEW REW QCR 1 146 13182 31 39 1813 494.65 146 13182 31 39 1.00 0 33 1813
VELOCITY DISTRIBUTION: ISEQ = 3; SECID = BRIDG; SRD = 0.
WSEL LEW REW AREA K Q VEL 494.65 0.2 32.7 146.2 13182. 1820. 12.45
X STA. 0.2 5.2 7.6 9.3 10.8 12.0 A(I) 12.7 8.7 7.9 6.9 6.6 V(I) 7.18 10.45 11.58 13.15 13.80
X STA. 12.0 13.2 14.3 15.4 16.4 17.5 A(I) 6.3 6.0 6.1 5.9 5.8 V(I) 14.50 15.09 15.01 15.53 15.62
X STA. 17.5 18.5 19.6 20.8 22.0 23.4 A(I) 6.0 5.9 6.2 6.3 6.6 V(I) 15.25 15.40 14.75 14.54 13.82
X STA. 23.4 24.9 26.4 28.1 29.9 32.7 A(I) 6.9 7.0 7.4 8.1 13.1 V(I) 13.22 13.05 12.22 11.26 6.94
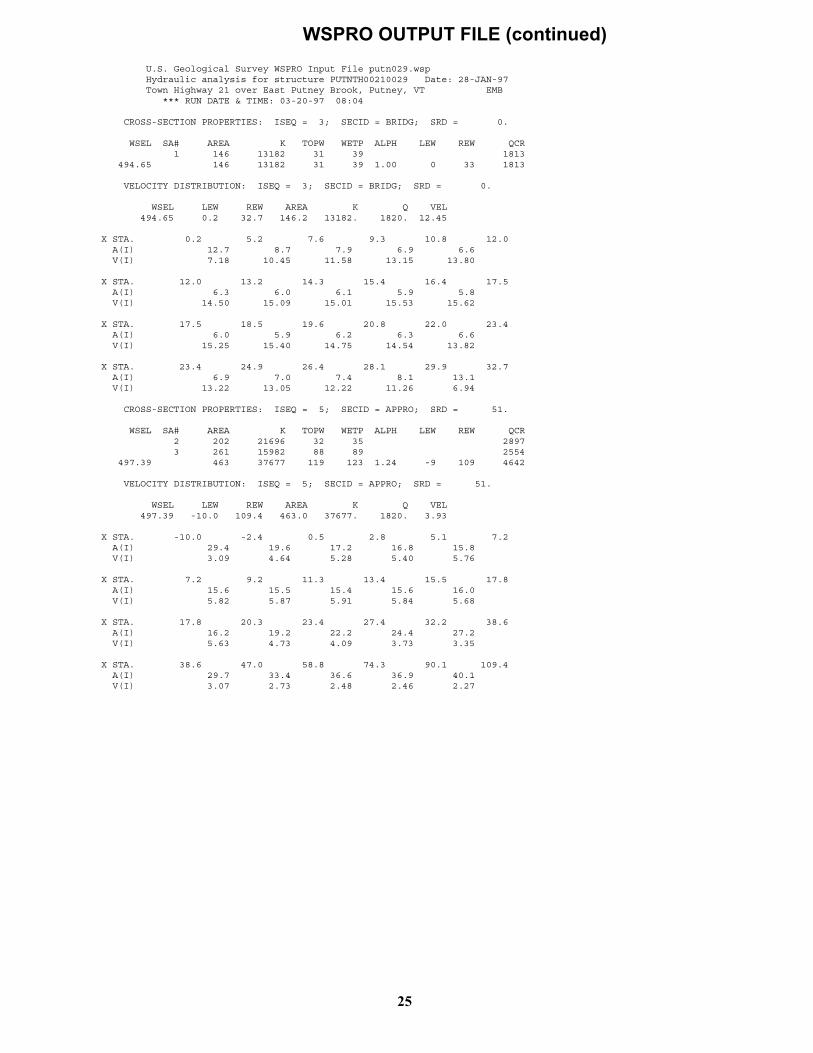
CROSS-SECTION PROPERTIES: ISEQ = 5; SECID = APPRO; SRD = 51.
WSEL SA# AREA K TOPW WETP ALPH LEW REW QCR 2 202 21696 32 35 2897 3 261 15982 88 89 2554 497.39 463 37677 119 123 1.24 -9 109 4642
VELOCITY DISTRIBUTION: ISEQ = 5; SECID = APPRO; SRD = 51.
WSEL LEW REW AREA K Q VEL 497.39 -10.0 109.4 463.0 37677. 1820. 3.93
X STA. -10.0 -2.4 0.5 2.8 5.1 7.2 A(I) 29.4 19.6 17.2 16.8 15.8 V(I) 3.09 4.64 5.28 5.40 5.76
X STA. 7.2 9.2 11.3 13.4 15.5 17.8 A(I) 15.6 15.5 15.4 15.6 16.0 V(I) 5.82 5.87 5.91 5.84 5.68
X STA. 17.8 20.3 23.4 27.4 32.2 38.6 A(I) 16.2 19.2 22.2 24.4 27.2 V(I) 5.63 4.73 4.09 3.73 3.35
X STA. 38.6 47.0 58.8 74.3 90.1 109.4 A(I) 29.7 33.4 36.6 36.9 40.1 V(I) 3.07 2.73 2.48 2.46 2.27
25

WSPRO OUTPUT FILE (continued)
U.S. Geological Survey WSPRO Input File putn029.wsp Hydraulic analysis for structure PUTNTH00210029 Date: 28-JAN-97 Town Highway 21 over East Putney Brook, Putney, VT EMB *** RUN DATE & TIME: 03-20-97 08:04
XSID:CODE SRDL LEW AREA VHD HF EGL CRWS Q WSEL SRD FLEN REW K ALPH HO ERR FR# VEL
EXITX:XS ****** -34 328 1.23 ***** 496.37 495.01 2330 495.13 -30 ****** 80 24204 1.57 ***** ******* 0.93 7.10
FULLV:FV 31 -40 403 0.81 0.22 496.57 ******* 2330 495.76 0 31 81 31602 1.56 0.00 -0.02 0.70 5.79 <<<<<THE ABOVE RESULTS REFLECT “NORMAL” (UNCONSTRICTED) FLOW>>>>>
===125 FR# EXCEEDS FNTEST AT SECID “APPRO”: TRIALS CONTINUED. FNTEST,FR#,WSEL,CRWS = 0.80 1.14 495.84 496.16 ===110 WSEL NOT FOUND AT SECID “APPRO”: REDUCED DELTAY. WSLIM1,WSLIM2,DELTAY = 495.26 507.57 0.50 ===115 WSEL NOT FOUND AT SECID “APPRO”: USED WSMIN = CRWS. WSLIM1,WSLIM2,CRWS = 495.26 507.57 496.16 ===130 CRITICAL WATER-SURFACE ELEVATION A _ S _ S _ U _ M _ E _ D !!!!! ENERGY EQUATION N_O_T B_A_L_A_N_C_E_D AT SECID “APPRO” WSBEG,WSEND,CRWS = 496.16 507.57 496.16
APPRO:AS 51 -8 318 1.17 ***** 497.33 496.16 2330 496.16 51 51 107 22417 1.40 ***** ******* 0.93 7.34 <<<<<THE ABOVE RESULTS REFLECT “NORMAL” (UNCONSTRICTED) FLOW>>>>>
===215 FLOW CLASS 1 SOLUTION INDICATES POSSIBLE ROAD OVERFLOW. WS1,WSSD,WS3,RGMIN = 498.71 0.00 495.52 498.66 ===260 ATTEMPTING FLOW CLASS 4 SOLUTION. ===240 NO DISCHARGE BALANCE IN 15 ITERATIONS. WS,QBO,QRD = 501.58 0. 2330. ===280 REJECTED FLOW CLASS 4 SOLUTION. ===245 ATTEMPTING FLOW CLASS 2 (5) SOLUTION.
<<<<<RESULTS REFLECTING THE CONSTRICTED FLOW FOLLOW>>>>>
XSID:CODE SRDL LEW AREA VHD HF EGL CRWS Q WSEL SRD FLEN REW K ALPH HO ERR FR# VEL
BRIDG:BR 31 0 224 1.40 ***** 498.59 495.18 2126 497.19 0 ****** 33 24742 1.00 ***** ******* 0.62 9.49
TYPE PPCD FLOW C P/A LSEL BLEN XLAB XRAB 1. **** 5. 0.483 0.000 497.19 ****** ****** ******
XSID:CODE SRD FLEN HF VHD EGL ERR Q WSEL RDWAY:RG 10. 36. 0.03 0.13 499.80 0.00 200. 499.61
Q WLEN LEW REW DMAX DAVG VMAX VAVG HAVG CAVG LT: 200. 110. -120. -10. 1.0 0.6 3.6 3.3 0.7 2.8 RT: 0. 7. 74. 81. 0.0 0.0 1.8 19.1 0.2 2.6
XSID:CODE SRDL LEW AREA VHD HF EGL CRWS Q WSEL SRD FLEN REW K ALPH HO ERR FR# VEL
APPRO:AS 29 -129 989 0.13 0.07 499.83 496.16 2330 499.70 51 32 113 86352 1.45 0.00 0.00 0.25 2.36
M(G) M(K) KQ XLKQ XRKQ OTEL ****** ****** ******** ****** ****** ******** <<<<<END OF BRIDGE COMPUTATIONS>>>>>
FIRST USER DEFINED TABLE.
XSID:CODE SRD LEW REW Q K AREA VEL WSEL EXITX:XS -31. -35. 80. 2330. 24204. 328. 7.10 495.13 FULLV:FV 0. -41. 81. 2330. 31602. 403. 5.79 495.76 BRIDG:BR 0. 0. 33. 2126. 24742. 224. 9.49 497.19 RDWAY:RG 10.******* 200. 200.********* 0. 2.00 499.61 APPRO:AS 51. -130. 113. 2330. 86352. 989. 2.36 499.70
XSID:CODE XLKQ XRKQ KQ APPRO:AS ***********************
SECOND USER DEFINED TABLE.
XSID:CODE CRWS FR# YMIN YMAX HF HO VHD EGL WSEL EXITX:XS 495.01 0.93 489.08 507.63************ 1.23 496.37 495.13 FULLV:FV ******** 0.70 489.08 507.63 0.22 0.00 0.81 496.57 495.76 BRIDG:BR 495.18 0.62 488.61 497.20************ 1.40 498.59 497.19 RDWAY:RG **************** 498.66 507.47 0.03****** 0.13 499.80 499.61 APPRO:AS 496.16 0.25 489.79 507.57 0.07 0.00 0.13 499.83 499.70
26
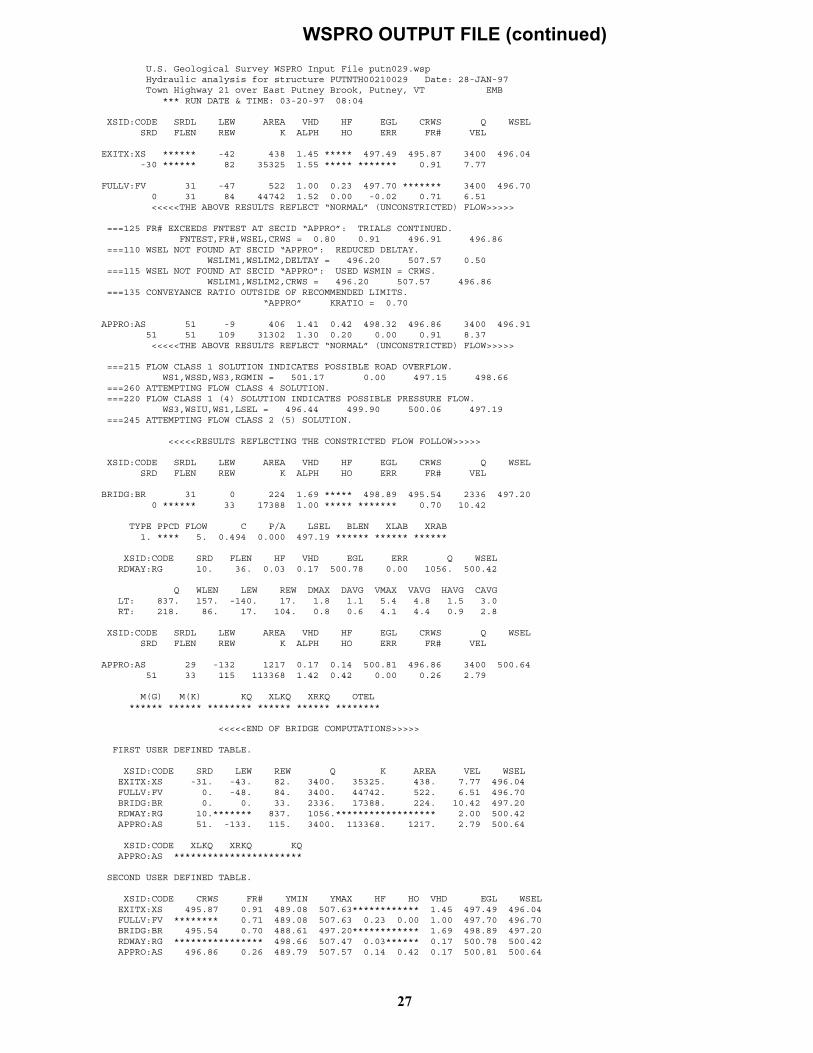
WSPRO OUTPUT FILE (continued)
U.S. Geological Survey WSPRO Input File putn029.wsp Hydraulic analysis for structure PUTNTH00210029 Date: 28-JAN-97 Town Highway 21 over East Putney Brook, Putney, VT EMB *** RUN DATE & TIME: 03-20-97 08:04
XSID:CODE SRDL LEW AREA VHD HF EGL CRWS Q WSEL SRD FLEN REW K ALPH HO ERR FR# VEL
EXITX:XS ****** -42 438 1.45 ***** 497.49 495.87 3400 496.04 -30 ****** 82 35325 1.55 ***** ******* 0.91 7.77
FULLV:FV 31 -47 522 1.00 0.23 497.70 ******* 3400 496.70 0 31 84 44742 1.52 0.00 -0.02 0.71 6.51 <<<<<THE ABOVE RESULTS REFLECT “NORMAL” (UNCONSTRICTED) FLOW>>>>>
===125 FR# EXCEEDS FNTEST AT SECID “APPRO”: TRIALS CONTINUED. FNTEST,FR#,WSEL,CRWS = 0.80 0.91 496.91 496.86 ===110 WSEL NOT FOUND AT SECID “APPRO”: REDUCED DELTAY. WSLIM1,WSLIM2,DELTAY = 496.20 507.57 0.50 ===115 WSEL NOT FOUND AT SECID “APPRO”: USED WSMIN = CRWS. WSLIM1,WSLIM2,CRWS = 496.20 507.57 496.86 ===135 CONVEYANCE RATIO OUTSIDE OF RECOMMENDED LIMITS. “APPRO” KRATIO = 0.70
APPRO:AS 51 -9 406 1.41 0.42 498.32 496.86 3400 496.91 51 51 109 31302 1.30 0.20 0.00 0.91 8.37 <<<<<THE ABOVE RESULTS REFLECT “NORMAL” (UNCONSTRICTED) FLOW>>>>>
===215 FLOW CLASS 1 SOLUTION INDICATES POSSIBLE ROAD OVERFLOW. WS1,WSSD,WS3,RGMIN = 501.17 0.00 497.15 498.66 ===260 ATTEMPTING FLOW CLASS 4 SOLUTION. ===220 FLOW CLASS 1 (4) SOLUTION INDICATES POSSIBLE PRESSURE FLOW. WS3,WSIU,WS1,LSEL = 496.44 499.90 500.06 497.19 ===245 ATTEMPTING FLOW CLASS 2 (5) SOLUTION.
<<<<<RESULTS REFLECTING THE CONSTRICTED FLOW FOLLOW>>>>>
XSID:CODE SRDL LEW AREA VHD HF EGL CRWS Q WSEL SRD FLEN REW K ALPH HO ERR FR# VEL
BRIDG:BR 31 0 224 1.69 ***** 498.89 495.54 2336 497.20 0 ****** 33 17388 1.00 ***** ******* 0.70 10.42
TYPE PPCD FLOW C P/A LSEL BLEN XLAB XRAB 1. **** 5. 0.494 0.000 497.19 ****** ****** ******
XSID:CODE SRD FLEN HF VHD EGL ERR Q WSEL RDWAY:RG 10. 36. 0.03 0.17 500.78 0.00 1056. 500.42
Q WLEN LEW REW DMAX DAVG VMAX VAVG HAVG CAVG LT: 837. 157. -140. 17. 1.8 1.1 5.4 4.8 1.5 3.0 RT: 218. 86. 17. 104. 0.8 0.6 4.1 4.4 0.9 2.8
XSID:CODE SRDL LEW AREA VHD HF EGL CRWS Q WSEL SRD FLEN REW K ALPH HO ERR FR# VEL
APPRO:AS 29 -132 1217 0.17 0.14 500.81 496.86 3400 500.64 51 33 115 113368 1.42 0.42 0.00 0.26 2.79
M(G) M(K) KQ XLKQ XRKQ OTEL ****** ****** ******** ****** ****** ********
<<<<<END OF BRIDGE COMPUTATIONS>>>>>
FIRST USER DEFINED TABLE.
XSID:CODE SRD LEW REW Q K AREA VEL WSEL EXITX:XS -31. -43. 82. 3400. 35325. 438. 7.77 496.04 FULLV:FV 0. -48. 84. 3400. 44742. 522. 6.51 496.70 BRIDG:BR 0. 0. 33. 2336. 17388. 224. 10.42 497.20 RDWAY:RG 10.******* 837. 1056.****************** 2.00 500.42 APPRO:AS 51. -133. 115. 3400. 113368. 1217. 2.79 500.64
XSID:CODE XLKQ XRKQ KQ APPRO:AS ***********************
SECOND USER DEFINED TABLE.
XSID:CODE CRWS FR# YMIN YMAX HF HO VHD EGL WSEL EXITX:XS 495.87 0.91 489.08 507.63************ 1.45 497.49 496.04 FULLV:FV ******** 0.71 489.08 507.63 0.23 0.00 1.00 497.70 496.70 BRIDG:BR 495.54 0.70 488.61 497.20************ 1.69 498.89 497.20 RDWAY:RG **************** 498.66 507.47 0.03****** 0.17 500.78 500.42 APPRO:AS 496.86 0.26 489.79 507.57 0.14 0.42 0.17 500.81 500.64
27
WSPRO OUTPUT FILE (continued)
U.S. Geological Survey WSPRO Input File putn029.wsp Hydraulic analysis for structure PUTNTH00210029 Date: 28-JAN-97 Town Highway 21 over East Putney Brook, Putney, VT EMB *** RUN DATE & TIME: 03-20-97 08:04
XSID:CODE SRDL LEW AREA VHD HF EGL CRWS Q WSEL SRD FLEN REW K ALPH HO ERR FR# VEL
EXITX:XS ****** -29 270 1.12 ***** 495.73 494.53 1820 494.62 -30 ****** 79 18900 1.58 ***** ******* 0.95 6.74
FULLV:FV 31 -35 339 0.70 0.21 495.93 ******* 1820 495.23 0 31 80 25271 1.57 0.00 -0.02 0.69 5.37 <<<<<THE ABOVE RESULTS REFLECT “NORMAL” (UNCONSTRICTED) FLOW>>>>>
===125 FR# EXCEEDS FNTEST AT SECID “APPRO”: TRIALS CONTINUED. FNTEST,FR#,WSEL,CRWS = 0.80 1.48 495.15 495.75 ===110 WSEL NOT FOUND AT SECID “APPRO”: REDUCED DELTAY. WSLIM1,WSLIM2,DELTAY = 494.73 507.57 0.50 ===115 WSEL NOT FOUND AT SECID “APPRO”: USED WSMIN = CRWS. WSLIM1,WSLIM2,CRWS = 494.73 507.57 495.75 ===130 CRITICAL WATER-SURFACE ELEVATION A _ S _ S _ U _ M _ E _ D !!!!! ENERGY EQUATION N_O_T B_A_L_A_N_C_E_D AT SECID “APPRO” WSBEG,WSEND,CRWS = 495.75 507.57 495.75
APPRO:AS 51 -8 270 1.04 ***** 496.78 495.75 1820 495.75 51 51 107 18226 1.46 ***** ******* 0.94 6.75 <<<<<THE ABOVE RESULTS REFLECT “NORMAL” (UNCONSTRICTED) FLOW>>>>>
===285 CRITICAL WATER-SURFACE ELEVATION A _ S _ S _ U _ M _ E _ D !!!!! SECID “BRIDG” Q,CRWS = 1820. 494.65
<<<<<RESULTS REFLECTING THE CONSTRICTED FLOW FOLLOW>>>>>
XSID:CODE SRDL LEW AREA VHD HF EGL CRWS Q WSEL SRD FLEN REW K ALPH HO ERR FR# VEL
BRIDG:BR 31 0 146 2.41 ***** 497.06 494.65 1820 494.65 0 31 33 13203 1.00 ***** ******* 1.00 12.44
TYPE PPCD FLOW C P/A LSEL BLEN XLAB XRAB 1. **** 1. 1.000 ****** 497.19 ****** ****** ******
XSID:CODE SRD FLEN HF VHD EGL ERR Q WSEL RDWAY:RG 10. <<<<<EMBANKMENT IS NOT OVERTOPPED>>>>>
XSID:CODE SRDL LEW AREA VHD HF EGL CRWS Q WSEL SRD FLEN REW K ALPH HO ERR FR# VEL
APPRO:AS 29 -9 463 0.30 0.21 497.69 495.75 1820 497.39 51 32 109 37706 1.24 0.42 0.00 0.39 3.93
M(G) M(K) KQ XLKQ XRKQ OTEL 0.719 0.325 25416. -5. 28. 497.31
<<<<<END OF BRIDGE COMPUTATIONS>>>>>
FIRST USER DEFINED TABLE.
XSID:CODE SRD LEW REW Q K AREA VEL WSEL EXITX:XS -31. -30. 79. 1820. 18900. 270. 6.74 494.62 FULLV:FV 0. -36. 80. 1820. 25271. 339. 5.37 495.23 BRIDG:BR 0. 0. 33. 1820. 13203. 146. 12.44 494.65 RDWAY:RG 10.************** 0.****************** 2.00******** APPRO:AS 51. -10. 109. 1820. 37706. 463. 3.93 497.39
XSID:CODE XLKQ XRKQ KQ APPRO:AS -5. 28. 25416.
SECOND USER DEFINED TABLE.
XSID:CODE CRWS FR# YMIN YMAX HF HO VHD EGL WSEL EXITX:XS 494.53 0.95 489.08 507.63************ 1.12 495.73 494.62 FULLV:FV ******** 0.69 489.08 507.63 0.21 0.00 0.70 495.93 495.23 BRIDG:BR 494.65 1.00 488.61 497.20************ 2.41 497.06 494.65 RDWAY:RG **************** 498.66 507.47********************************** APPRO:AS 495.75 0.39 489.79 507.57 0.21 0.42 0.30 497.69 497.39 ER
NORMAL END OF WSPRO EXECUTION.
28
29
APPENDIX C:
BED-MATERIAL PARTICLE-SIZE DISTRIBUTION
30
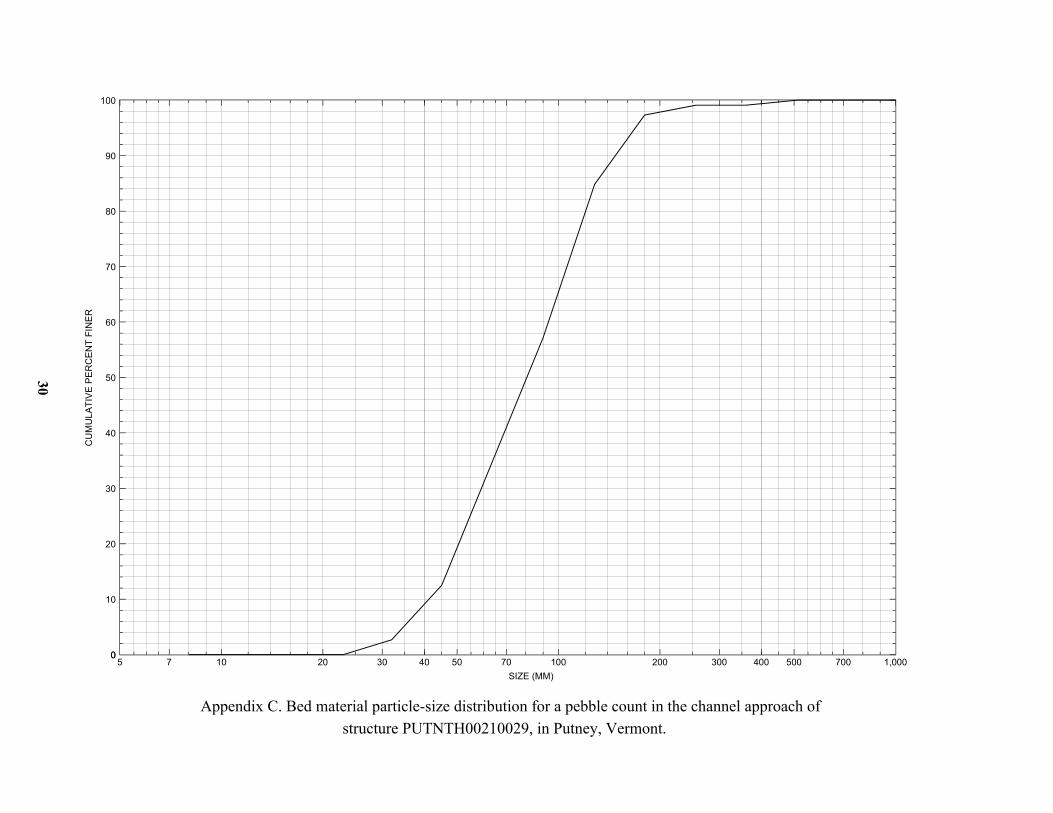
Appendix C. Bed material particle-size distribution for a pebble count in the channel approach of
structure PUTNTH00210029, in Putney, Vermont.
CU
MU
LA
TIV
E P
ER
CE
NT
FIN
ER
SIZE (MM)
0
100
0
10
20
30
40
50
60
70
80
90
5 1,0007 10 20 30 40 50 70 100 200 300 400 500 700

31
APPENDIX D:
HISTORICAL DATA FORM
FHWA Structure Number (I - 8)
Topographic Map
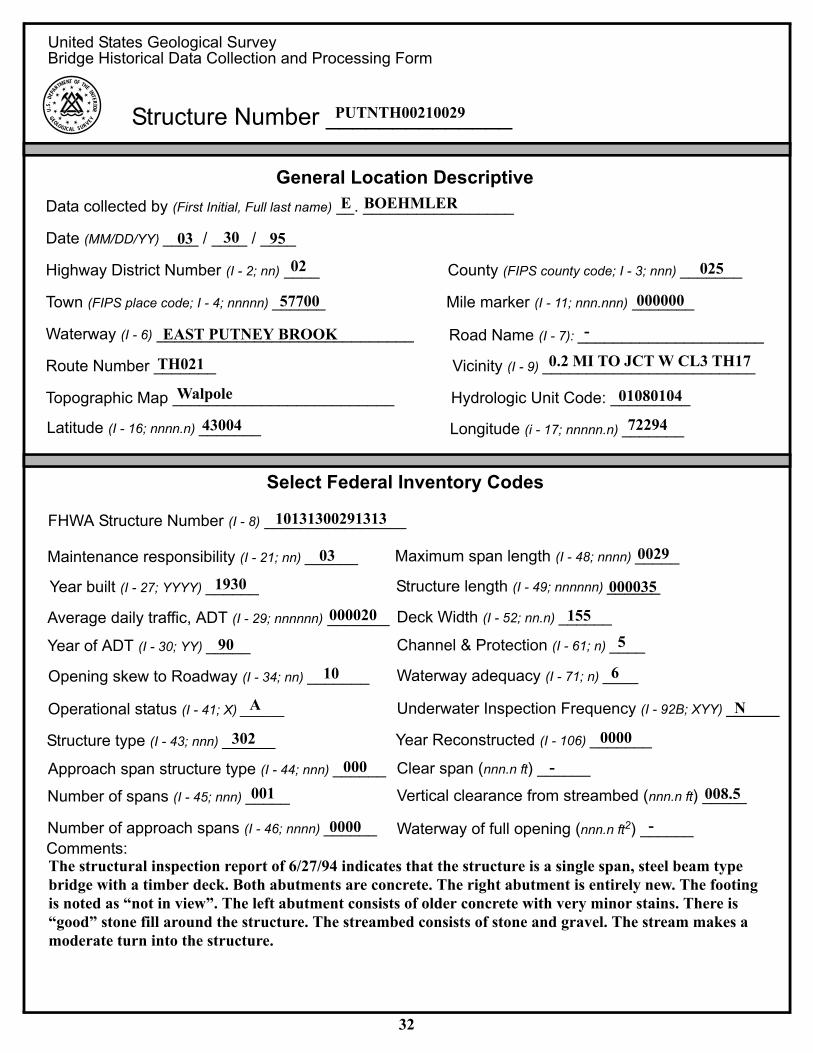
United States Geological SurveyBridge Historical Data Collection and Processing Form
Gener
Data collected by (First Initial, Full last name
Date (MM/DD/YY) _
Highway District Number (I - 2; nn)
Town (FIPS place code; I - 4; nnnnn)
Waterway (I - 6)
Route Number
Latitude (I - 16; nnnn.n
Select
Maintenance responsibility (I - 21; nn) _
Year built (I - 27; YYYY)
Average daily traffic, ADT (I - 29; nnnnnn
Year of ADT (I - 30; YY) _
Opening skew to Roadway (I - 34; nn) _
Operational status (I - 41; X) _
Structure type (I - 43; nnn)
Approach span structure type (I - 44; nnn
Number of spans (I - 45; nnn)
Number of approach spans (I - 46; nnnn)
U.S
.DE
PA
RTM N OF H
I
G LC SUV
YET T E
NTERORI
E
OA RI
OL
GE Structure Number
______________PUTNTH00210029al Location Descriptive
)
F
)
__. _E B
ed
________________OEHMLER
___ /03
____ /30 ____95County (FIPS county code; I - 3; nnn) _
____02Vicinity (I - 9)
Road Name (I - 7):
Hydrologic Unit Code:
Longitude (i - 17; nnnnn.n)
eral Inventory Codes
Mile marker (I - 11; nnn.nnn)
_
Maximum span length (I - 48; nnnn
Structure length (I - 49; nnnnnn
Deck Width (I - 52; nn.n)
Channel & Protection (I - 61; n)
Waterway adequacy (I - 71; n)
Underwater Inspection Frequency (I - 92B;
Year Reconstructed (I - 106)
Clear span (nnn.n ft) _
Vertical clearance from streambed (nnn.n f
Waterway of full opening (nnn.n ft2)
32
______025
______57700
_______000000_____________________________EAST PUTNEY BROOK
_____________________-_______TH021
________________________0.2 MI TO JCT W CL3 TH17_________________________Walpole
_________01080104) _______43004
_______72294________________10131300291313
_____03
______1930
) _______000020
____90
_____10
XYY)
_____A______302
______000
t)
_____001______0000
) _____0029
) ______000035
______155
____5
____6
______N
_______0000
_____-
_____008.5
______-
Comments:The structural inspection report of 6/27/94 indicates that the structure is a single span, steel beam type bridge with a timber deck. Both abutments are concrete. The right abutment is entirely new. The footing is noted as “not in view”. The left abutment consists of older concrete with very minor stains. There is “good” stone fill around the structure. The streambed consists of stone and gravel. The stream makes a moderate turn into the structure.

ge Hydrologic DataIs there hydrologic 2
Terrain character:
Stream character & type
Streambed material:
Discharge Data (cfs): Q2.33
Q50 _
Record flood date (MM / DD
Estimated Discharge (cfs):
Ice conditions (Heavy, Moderate, Light
The stage increases to maximum h
The stream response is (Flashy, Not
Watershed storage area (in perc
The watershed storage area is:
Descrstage:
Water Surface Elevation Estimates
Peak discharge frequency
Water surface elevation (ft))
Velocity (ft / sec)
Long term stream bed changes:
Is the roadway over w t
Relief Elevation (ft):
Are there other structures
Upstream dist
Highway No. :
Clear span (ft): Clear Heig
Brid ____ iN
_____ Q10 __ ____ Q25 _
__ Q100 _ ____ Q500
urfac n (ft):
t Q ft/s): _
) Debris (Heavy, Moderate
ighwat , Not rapidly):
flashy):
(1-mainly at the headwaters; 2- uniformly distributed; 3-imm
for Existing Structure:
Q Q Q Q Q
he Q100? (Yes, No, Unknown): _ Fr
Discharge over roadway at Q100 (ft3/ sec):
Yes, No, Unkno
____ Town:
ht (ft): Full Waterway (ft2):
Structure No. : tructure T
type ctrl-n o
oi the site)
33
_______-
data available? f No, type ctrl-n h VTAOT Drainage area (mi ):_________________________________________________________________-
: -
_______________________________________________________________-
_____
________- ________- ________-_____
________- ________- ________-___ / -
___ /___
___
_______- / YY):________-
Water s____ (-
e elevatio_______-
_ Velocity a: __________-
____________- , Light):_______________-
er elevation (Rapidly_______________-
ibe any significant site conditions upstream or downstream that may influence the stream’s-
: ___%-
ediatly upstream
ent)
___ -
2.33 10 25 50 100
- - - - -
- - - - -
-
____U
_______- topped belo_________-
equency:________-
____U
nearby? (_______-
wn):___________________If No or Unknown,
-
______s-
ance (miles):________________-
______ S- _____________________Year Built:-
______-
______- _______ype:-
Downstream d _____ Town
Highway No. :
Clear span (ft): Clea
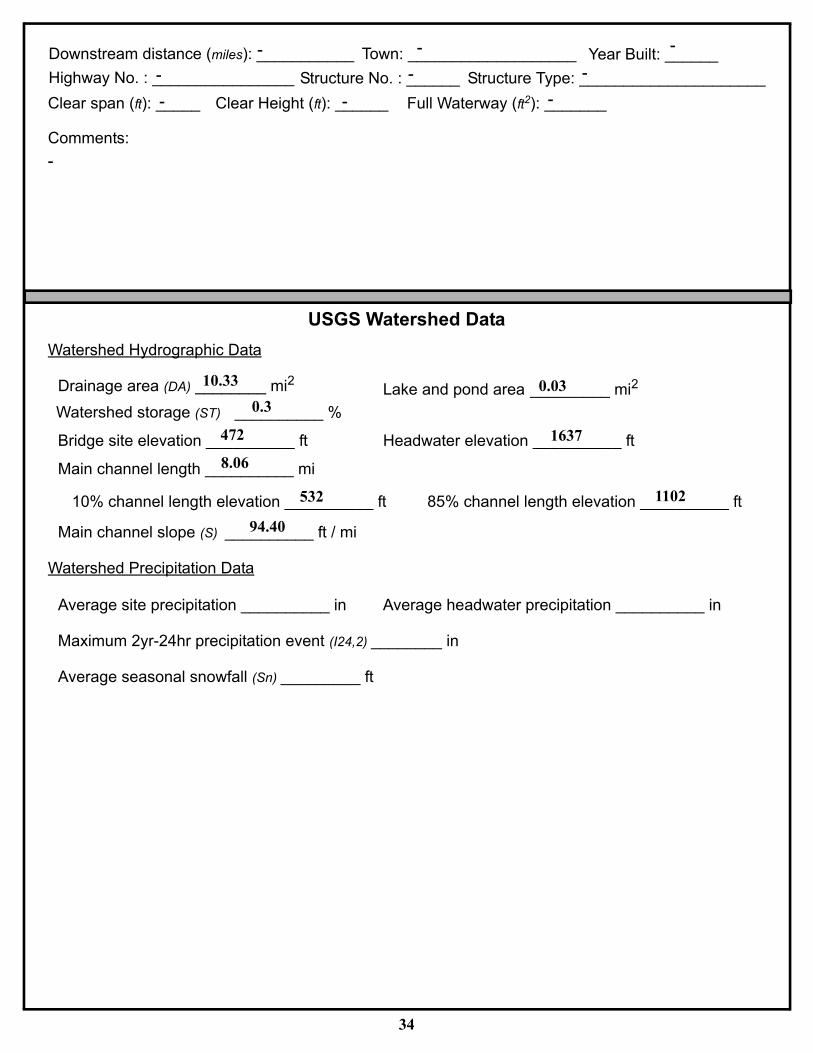
Drainage area (DA)
Watershed storage (ST
Main channel slope (S) __
Bridge site elevation _
Main channel length _
10% channel length elev
Watershed Precipitation Dat
Average site precipitation _
Maximum 2yr-24hr precipit
Average seasonal snowfall
Watershed Hydrographic Da
: ______-
r Height (ft):
Struc
USGS Wate
2
%
t / mi
ft Hea
mi
ation _ ft
a
in Ave
ation event (I24,2)
(Sn) _ t
ta
Lak
3
___________________-
Full Waterway (ft2):
Structure T
rshed Data
dwater elevation _ ft
85% channel length elevation _
rage headwater precipitation _
n
e and pond area mi2
4
______-
istance (miles)
________________-
:: ______-
_____________________Year Built:-
_____-
______ture No.
-
_______ype:-
Comments:
-
________ m10.33
_________ 0.03 i_________0.3
) __________472
_________1637_________8.06
ft
_________532 _________1102________ f94.40
in
_________ _________________ i
________ f
Reference Point (MS
Is boring information
Foundation Material
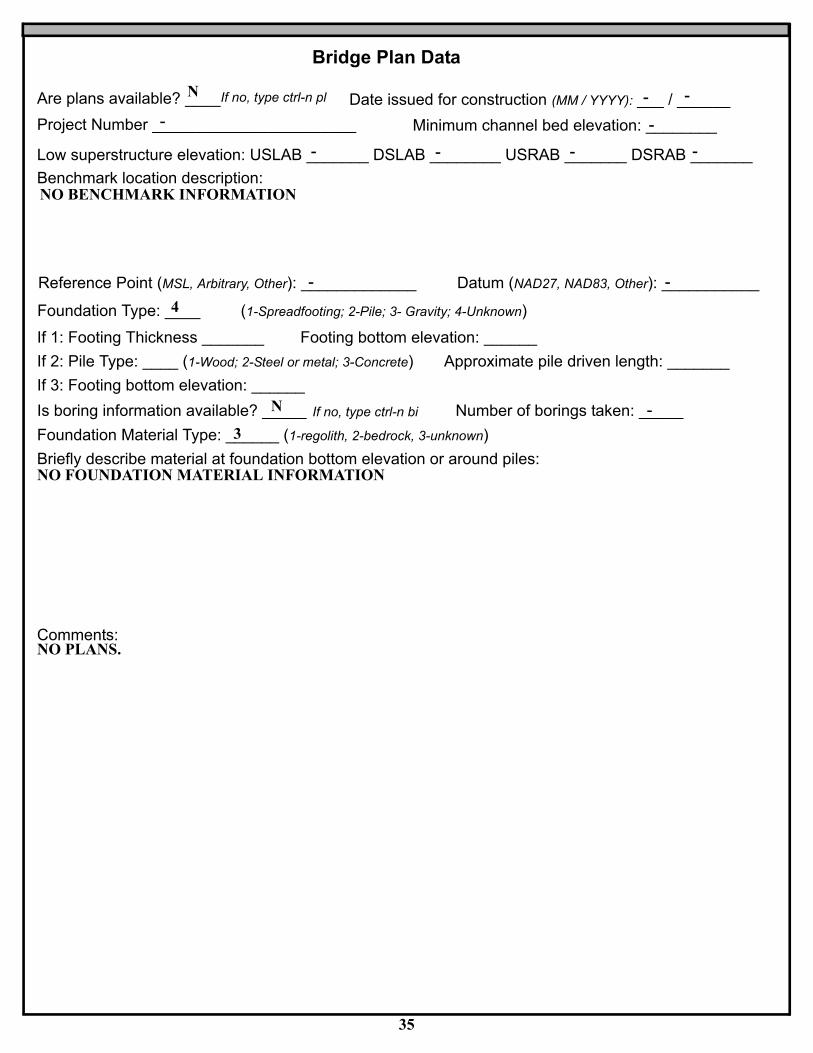
Bridge Plan Data
Are plans availa te issued for construction (MM / YYYY):
Low superstructure
Foundation Type:
If 1: Footing Thickne
If 2: Pile Type:
If 3: Footing bottom
no, type ctrl-n pl
Project Number
____IfN
L, Arbitrary, Other): Datum (NAD27, NAD83, Oth
available?
Type: _ (1-regolith, 2-bedrock, 3-unknown)
Number of borings taken:
elevation: USLAB SLAB USRAB
Minimum channel bed elevation
(1-Spreadfooting; 2-Pile; 3- Gravity; 4-Unknown)
ss _ Footing bottom elevation
(1-Wood; 2 tal; 3-Concrete) Approximate pile driven len
elevation:
If no, type ctrl-n bi
35
___ / -
er):
SRA
:
gth:
______-
ble? Da_______________________-
________-B
_______ D- ________- _______ D- _______-Benchmark location description:NO BENCHMARK INFORMATION
_____________-
___________-____ 4
______
: _______
____ ______ -Steel or me______
_____N
_____-_____3
Briefly describe material at foundation bottom elevation or around piles:NO FOUNDATION MATERIAL INFORMATION
Comments:NO PLANS.
ross-sectional DataIs cross-sectional data available?
Source (FEMA, VTAOT, Other)?
Comments:
Station
Feature
Low cord
elevation
Bed
elevation
Low cord to
bed length
Station
Feature
Low cordelevationBedelevationLow cord tobed length
Source (FEMA, VTAOT, Other)? _Comments:
Station
Feature
elevation
elevation
bed length
Low cord
Bed
Low cord to
Low cord
Bed
Low cord to
Station
Feature
elevation
elevation
bed length
If no, type ctrl-n xs
C _____N
_________-
NO CROSS SECTION INFORMATION
-
-
-
-
-
-
-
-
-
-
-
-
-
-
-
-
-
-
-
-
-
-
-
-
-
36
-
-
-
-
-
-
-
-
-
-
-
-
-
-
-
-
-
-
-
-
-
-
-
-
-
-
-
-
-
-
-
-
-
-
-
-
-
-
-
-
-
-
-
-
-
-
-
-
-
-
-
-
-
-
-
-
-
-
-
-
-
-
-
-
-
-
-
-
-
-
-
-
-
-
-
-
-
-
-
-
-
-
-
-
-
________-
NO CROSS SECTION INFORMATION
-
-
-
-
-
-
-
-
-
-
-
-
-
-
-
-
-
-
-
-
-
-
-
-
-
-
-
-
-
-
-
-
-
-
-
-
-
-
-
-
-
-
-
-
-
-
-
-
-
-
-
-
-
-
-
-
-
-
-
-
-
-
-
-
-
-
-
-
-
-
-
-
-
-
-
-
-
-
-
-
-
-
-
-
-
-
-
-
-
-
-
-
-
-
-
-
-
-
-
-
-
-
-
-
-
-
-
-
-
-

37
APPENDIX E:
LEVEL I DATA FORM
U.S
.DE
PA
RTM N OF H
I
G LC SUV
YET T E
NTERORI
E
OA RI
OL
GE
UB
US lef
U. S. Geological SurveyBridge Field Data Collection and Processing Form
Structure Number
A. Gene
1. Data collected by (First In ll last name)
2. Highw
Count
Waterway (I -
Route Numbe
B. Bri
4. Surface cover... LBUS RBUS(2b us,ds,lb,rb: 1- Urban; 2- S ; 3- Ro
5. Ambient water surfa US
6. Bridge structure typ - single span; 2- box culvert; o
7. Bridge length feet)
Road approach to bridge:
8. LB B ( 0 even, 1- lower, 2- highe
LBUS
RBUS
RBDS
LBDS
14.Severi
Erosion: 0 - none; 1- channel erosion; 2-
Erosion Severity: 0 - none; 1- slight; 2- moderate;
9. LB B 1- Paved, 2- Not paved)
US righ
10. Emban (run / rise :
Qa/Qc Check by ate
Computerized by ate
Reviewd by: ate
13.Erosion Protection
11 12
road wash; 3- both; 4- other
3- severe
Bank protection types: 0- none; 1- < 12 inches;2- < 36 inches; 3- < 48 inches;4- < 60 inches; 5- wall / artificial leve
Bank protection conditions: 1- good; 2- slumped;3- eroded; 4- failed
______________PUTNTH00210029
ral Location Descriptive
/YY) 1
__. _M Idg
- mr 7-
r)
ty
e
________________VANOFF
Town
Road Name
Hydrologic Unit Code
Mile
e Deck Observations
LBDS RBDS 4- P - Shrub- and brushland; 6- Fores
DS 1- pool; 2- riffle)
ultiple span; 3- single arch; 4- multiple arch; 5- cy other)
Span length feet)
Channel approach to brid
15. Angle of approach:
17. Channe zone 1: Exist?
Where? LB, RB)
Range ee US, UB, DS) to
Channel impact zone 2: Exist?
Where? LB, RB)
Range? ee S, UB, DS) to
16. Bridge
Q
Q
Approach AngleBridge Skew A
Severity
Severity
Impact Severity: 0- none to very slight; 1- Slight;
38
Bridge wi
____ /8
Overat; 7- W
lindrica
ge (B
or N)
e
or N)
e
skew
ngle
2- Mod
dth
____ / 19
letland)
l culvert;
F):
Q
Ope
erate; 3-
fee
to
9____96
itial, Fu_____02
Date (MM/DDr ______________000000
ay District Numbery___________________________RUTLAND (025)
______________________________marke
PUTNEY (57700)
_________________________________East Putney Brook
__________________________-- 6)r ________TH 21
: ___________010801043. Descriptive comments:The bridge is located 0.2 miles from the intersection of town highway 21 with town highway 17.
_____6
_____4 _____4 _____6 l _____6 uburban______2
_____w crops;1
asture; 5
_____ (1
ce...e _____( 16
1
t)
________ (35 ________ (29 ______ (15.5____ R0
____2____ R2
____ (2ning skew
.Type
_____5
.Cond._____1
_____0 _____-_____0
_____- _____- _____-_____5
_____1 _____0 _____-_____5
_____1 _____0 _____-_____20
: _____40_____ (Y
l impact_____ (RB
Y
____0
? _____ f20
t ____ (US _____fe10 t ____DS_____ (N
_____ (
Y
____
_____ f
t ____(U _____fe t ____t ________
kment slope
-
t _______in feet / foot)
-
=
roadway
20.0
: _______ DRB
: __________5/13/97: _______ DRB
: __________5/13/97_______ DEB
: __________5/20/97Severe

C. Upstream Channel Assessment
21. Bank height (BF) 22. Bank angle (BF) 26. % Veg. cover (BF) 27. Bank material (BF) 28. Bank erosion (BF)
18. Bridge Type
1a- Vertical abutments with wingwalls
1b- Vertical abutments without wingwalls
2- Vertical abutments and wingwalls, sloping embankmentWingwalls perpendicular to abut. face
3- Spill through abutments
4- Sloping embankment, vertical wingwalls and abutmentsWingwall angle less than 90
1b without wingwalls1a with wingwalls
2
3
4
19. Bridge Deck Comments (surface cover variations, measured bridge and span lengths, bridge type variations,
_______
20. SRD
33.5
Bed and
Bank Ero
23. Bank w
30 .Bank p
Bank pro
Bank pro
SRD - Se
LB RB
_____
LB
_____ _____ _ 7.0
bank Material: 0- organics; 1-
sion: 0- not evident; 1- light flu
idth 24. Cha
4- cobble, 64 -
rotection type: LB
tection types: 0- absent; 1- < 1
tection conditions: 1- good; 2-
ction ref. dist. to US face
RB
____ 1.0
nnel width 25. Thalweg dept 29. Bed Materia
_____ 35.0% Vegesilt / clay,
vial; 2- m256mm; 5
RB
2 inches;
slumped;
_____ 10.0
tation (Veg) cover: 1- 0 to 25%; 2- 26 < 1/16mm; 2- sand, 1/16 - 2mm; 3- g
oderate fluvial; 3- heavy fluvial / mas- boulder, > 256mm; 6- bedrock; 7- m
31. Bank protection c
2- < 36 inches; 3- < 48 inches; 4- < 6
3- eroded; 4- failed
39
h _____ 31.5
: ______1a
approach overflow width, etc.)
In addition to the pasture on the left overbank downstream there is a house, a barn, and a garden.The bridge dimensions on the previous page are historical values from the VTAOT database. The fieldmeasured bridge length was 36 feet, span length was 32 feet, and the deck width was 16.0 feet.The downstream wingwalls are laid-up stone walls parallel to the road.
LB
_____3
RB_____1
LB_____435
to 50ravel
s wasanm
ondit
0 inc
RB
_____34
%; 3- 51 to 7, 2 - 64mm;
tingade
ion: LB
hes; 5- wall
LB
_____1
5%; 4- 76 to
RB
/ artificial lev
RB
_____1
l _____43
_____3
_____2 _____2 _____1100%
ee
32. Comments (bank material variation, minor inflows, protection extent, etc.):The left bank protection extends 20 feet upstream of the end of the wingwall along the roadway embankment. The right bank protection extends 25 feet upstream of the bridge. There is a small stone pile dam 250 feet upstream.

47. Scour dimensions: Length idth epth
46. Mid-scour distance
49. Are there major c ces? o ctrl-n mc) 50. Ho
51. Confluence 1: Distance 52. Enters o B or RB) 53. Typ 1- perennial; 2- ephemeral)
Confluence 2: Distance Enters on LB or RB) Type ( 1- perennial; 2- ephemeral)
Bridge Channel Assessment
56. Height (BF)LB RB
57 Angle (BF) 61. Material (BF) 62. Erosion (BF)LB RB LB RB LB RB
55. Channel restraint (BF)? LB 1- natural bank; 2- abutment; 3- artificial levee)
45. Is channel scour present? Y or if N type ctrl-n cs)
Position LB to RB
39. Is a cut-bank t? Y or if N type ctrl-n 40. Whe )
41. Mid-bank dist 42. Cut bank extent e S, UB) t e S, UB, DS)
43. Bank damage ( 1- eroded and/or creep; 2- slip failure; 3- block failure)
33.Point/Side b en Y or N c 35. Mi th:4. Mid-bar distance
36. Point ba ee S, UB) to e S, UB, DS) positioned LB to RB
37. Material:
__________ _____ 15.5
58. Bank width (BF
Bed and bank Mate
Bank Erosion: 0- no
_____ _____ 0.5
. Channel width (Amb . Thalweg depth (Amb 63. Bed Materia
) _____ 59 -rial: 0- organics; 1- silt / clay, < 1/
t evident; 1- light fluvial; 2- mode
5- boulder, > 256mm; 6- bed
) _____ 60 -
16mm; 2- sand, 1/16 - 2mm; 3- gra
rate fluvial; 3- heavy fluvial / mass
rock; 7- manmade
40
) _____ 90.0
_____ (Y
ve
wa
: ______100
l, 2 - 64mm; 4- cobble, 64 -
sting
______10
ar pres: ______ f72t?t ____ (UUS
. if N type
______ fe135
trl-n pb)3t ____ (UUS
____ %0 d-bar wid_____ %30
r extent_____4
38. Point or side bar comments (Circle Point or Side; Note additional bars, material variation, status, etc.):This is a side bar composed primarily of cobbles with a few boulders and nearly 100 percent of the bar area is covered by grass. There is an additional side bar from 180 to 247 feet upstream with a mid-bar distance of 240 feet. The width at mid-bar was 11 feet positioned 80% LB to 100% RB. This side bar is composed of gravel and cobbles._____ (Y
_____ (LB presen: _____190cb)
: _____ fe155
t ____ (UUS re?o _____ fe245
LB or RBt ____ (UUS
ance: _____ 1
44. Cut bank comments (eg. additional cut banks, protection condition, etc.):-_____ (N
: _____-______ W-
______ D- : _____- ____ %- _____ %- 48. Scour comments (eg. additional scour areas, local scouring process, etc.):NO CHANNEL SCOUR_____ (YN
_____- onfluen _____-r if N type
n _____ (L-
w many?e _____ (-
_____-
_____ (- _____ - 54. Confluence comments (eg. confluence name):NO MAJOR CONFLUENCESD. Under _____ RB _____ (2
_____2
_____7 _____7 _____0l ______0
256mm;
64. Comments (bank material variation, minor inflows, protection extent, etc.):435-
73. Toe
82. Bank / Bridge Protection:
USLWW USRWW RABUT LB RB DSLWW DSRWW
Type
Condition
Location
80. Wingwalls:
Exist? Material?
USLWW
USRWW
DSLWW
DSRWW
Wingwall materials: 1- Concrete; 2- Stone masonry or drywall; 3- steel or metal;
Angle?
Q
USRWW
DSRWW
Length?Wingwall
Wingwallangle
Pushed: LB or RB Toe Location (Loc.): 0- even, 1- set back, 2- protrudesScour cond.: 0- not evident; 1- evident (comment); 2- footing exposed; 3-undermined footing; 4- piling expos
Abutments 71. Attack 72. Slope 74. Scour
LABUT
RABUT
(BF) (Qmax) loc. (BF)77. Material 78. Length
Materials: 1- Concrete; 2- Stone masonry or drywall; 3- steel or metal; 4- wood
Extent
Scour
Bank / Bridge protection types: 0- absent; 1- < 12 inches; 2- < 36 inches; 3- < 48 inches; 4- < 60 inches;
Bank / Bridge protection conditions: 1- good; 2- slumped; 3- eroded; 4- failed5- wall / artificial levee
Protection extent: 1- entire base length; 2- US end; 3- DS end; 4- other
75. Scour Exposure
Scour
Condition
81.
41
5- settled; 6- failed
depth depth76.
lengthExposure
4- wood
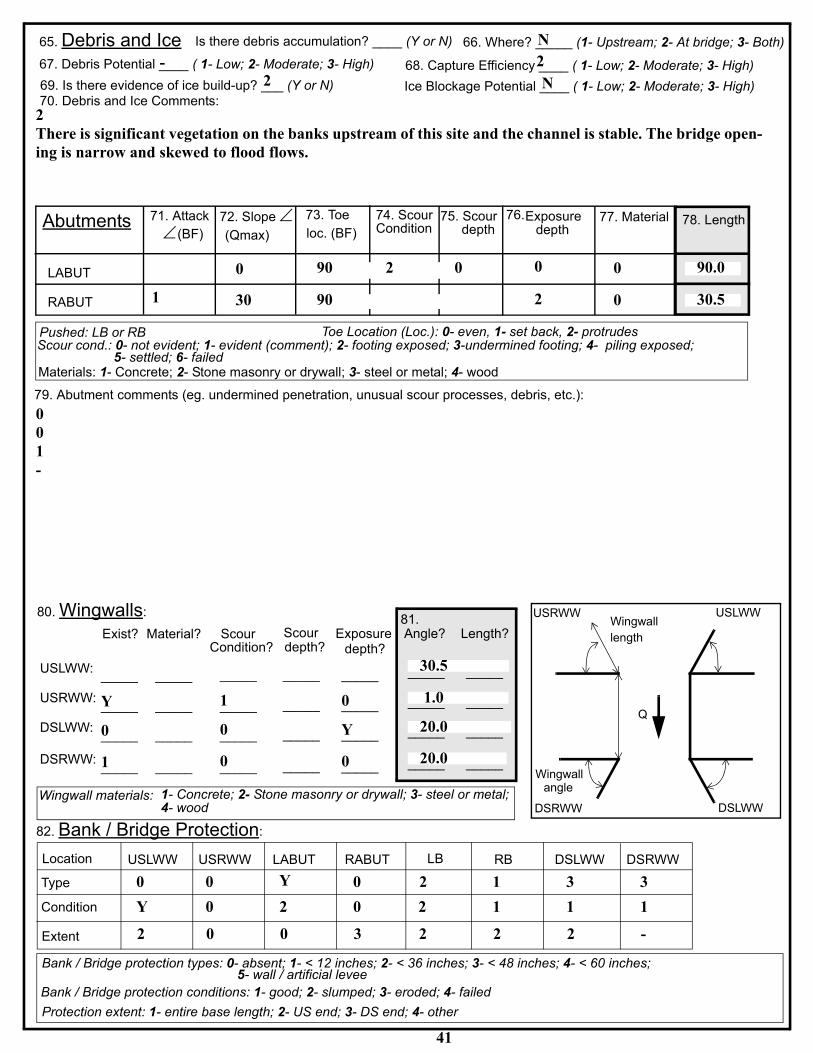
65. Debris and Is there debris accumulation? or N)
69. Is there evidence of ice build-up? or N)
66. Where 1- Upstream; 2- At bridge; 3- Both)
Ice Blockage Potentia 1- Low; 2- Moderate; 3- High)
67. Debris Potentia 1- Low; 2 rate; 3- High) 68. Capture Efficienc 1- Low; 2- Moderate; 3- High)
90.0
30.5
USLWW
ed;
_____ _____ 30.5
_____ _____ 1.0
_____ _____ 20.0
_____ _____ 20.0
____ (Y
_____ (N Icel ____ (-?
y ____ (2
___ (Y
- Mode2
l ____ (N70. Debris and Ice Comments:2There is significant vegetation on the banks upstream of this site and the channel is stable. The bridge open-ing is narrow and skewed to flood flows.
0
90 2 0 0 01
30 90 2 079. Abutment comments (eg. undermined penetration, unusual scour processes, debris, etc.):
001-
_____ _____:
_____ _____depth?Condition?
_____
depth?
_____ _____: Y
_____ _____1 _____0_____ _____: 0
_____ _____0 _____Y_____ _____: 1
_____ _____0 _____0DSLWW
0
Y
2
0
0
0
LABUT
Y
2
0
0
0
3
2
2
2
1
1
2
3
1
2
3
1
-
86. Locati
87. Type
88. Materi
89. Shape
90. Incline
91. Attack
92. Pushe
93. Length
94. # of pi
95. Cross-
96. Scour
97. Scour
Level 1 P
Piers:
84. Are there piers? or if N type ctrl-n pr)
Pier 1
w1
Pier 2
Pier no. width (w) feet elevation (e) feet
Pier 3
Pier 4
e@w1 e@w3
85.
98. Expos
w1
on (BF)
al
d?
(BF)
d
(feet)
les
members
Condition
depth
ier Descr.
ure depth
180.0
w2
5.5
e@w2
75.0
w34.5
0.0-
0.0 - - - -w3w2
- - - - - --
- - - - -LFP, LTB, LB, MCL, MCM, MCR, RB, RTB, RFP
1- Solid pier, 2- column, 3- bent
1- Wood; 2- concrete; 3- metal; 4- stone
1- Round; 2- Square; 3- Pointed
Y- yes; N- no
LB or RB
-
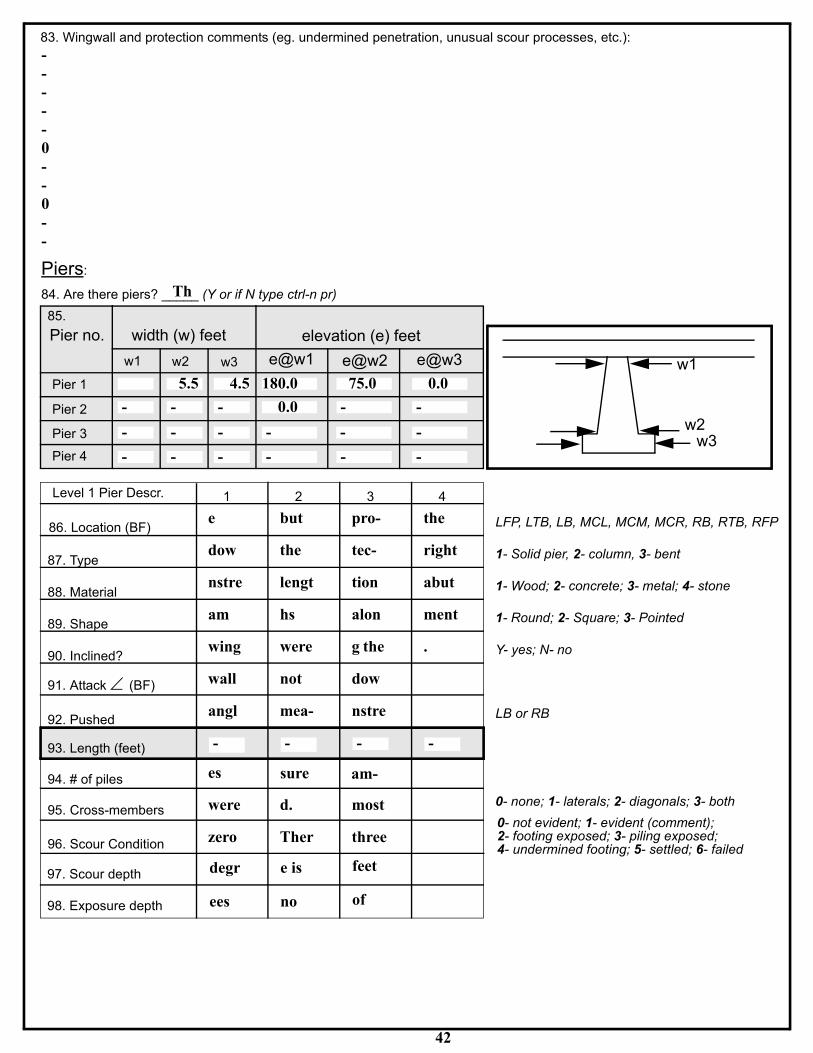
- - -83. Wingwall and protection comments (eg. undermined penetration, unusual scour processes, etc.):-----0--0--
_____ (YTh
1
e
dow
nstre
am
wing
wall
angl
es
0- none; 1- laterals; 2- diagonals; 3- both
were 0- not evident; 1- evident (comment);4- undermined footing; 5- settled; 6- failed 2- footing exposed; 3- piling exposed;
zerodegr
ees
2
but
the
lengt
hs
were
not
mea-
sure
d.
Ther
e is
no
3
pro-
tec-
tion
alon
g the
dow
nstre
am-
most
three
feet
of
4
the
right
abut
ment
.
42
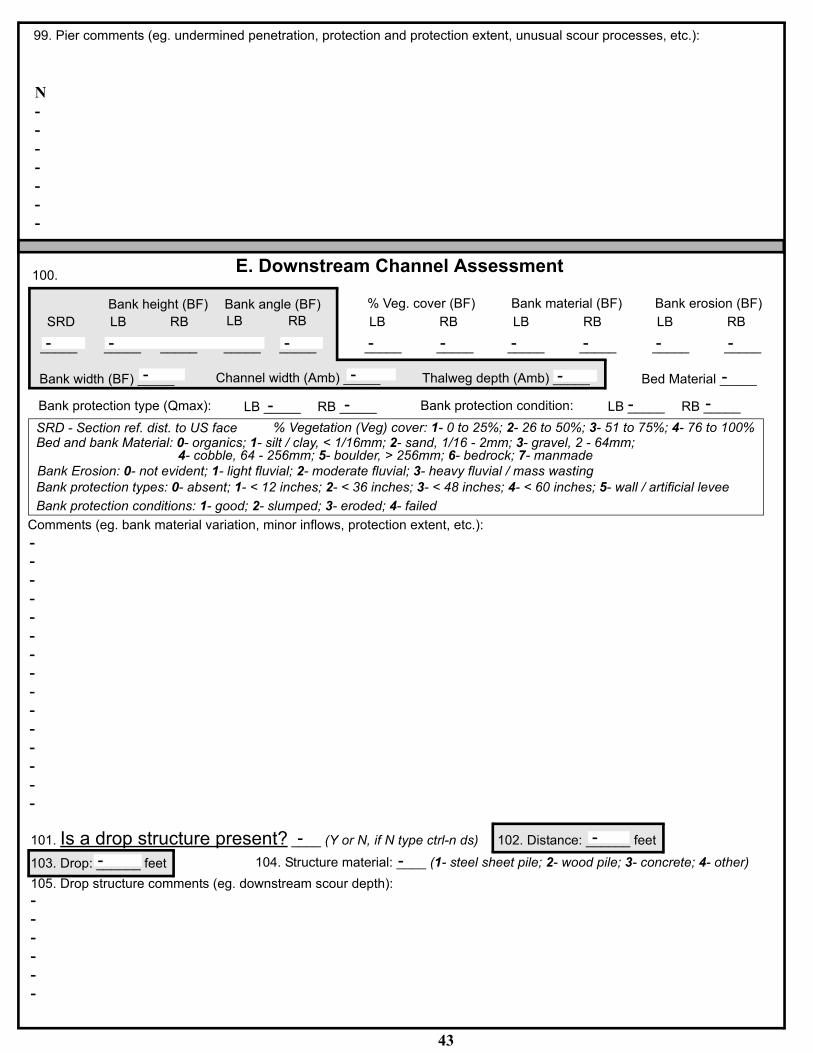
E. Downstream Channel Assessment
Bank height (BF) Bank angle (BF) % Veg. cover (BF) Bank material (BF) Bank erosion (BF)LB RB
100.
_____
SRD
-
Bank wid
Bank prot
Bed and b
Bank ErosBank prote
Bank prote
SRD - Sec
101. Is a103. Dro
LB RB
_____ _____ _____ -
th (BF Channel
ection type (Qmax): LB
ank Material: 0- organics; 1- s
ion: 0- not evident; 1- light flu 4- cobble, 64 - 2
ction types: 0- absent; 1- < 12
ction conditions: 1- good; 2- s
tion ref. dist. to US face
ucture presen10et
_____ -
width (Amb Thalweg depth (Amb Bed Materia
) _____ -RB
% Vegetatiilt / clay, < 1
vial; 2- mod56mm; 5- b
inches; 2-
lumped; 3-
t? Y
4. Structure
) _____ -
Bank protection cond
43
on (Veg) cover: 1- 0 to 25%; 2- 26 t/16mm; 2- sand, 1/16 - 2mm; 3- gr
erate fluvial; 3- heavy fluvial / massoulder, > 256mm; 6- bedrock; 7- m
< 36 inches; 3- < 48 inches; 4- < 6
eroded; 4- failed
or N, if N rl-n ds) 102. Dis
materia 1- steel sheet pile;
) _____ -
ition: LB RB
o 50%; 3- 51 to 75%; 4- 76 to 100%avel, 2 - 64mm;
wastinganmade
0 inches; 5- wall / artificial levee
tance et
2- wo
: ______ fe -
od pile; 3- concrete; 4- other)
drop strp: ______ fe -
99. Pier comments (eg. undermined penetration, protection and protection extent, unusual scour processes, etc.):
N-------
LB
_____-
RB_____-
LB_____-
RB_____-
LB_____-
RB_____-
l _____-
_____-
_____- _____- _____-Comments (eg. bank material variation, minor inflows, protection extent, etc.):---------------
____ (-
type ctl: ____ (-
105. Drop structure comments (eg. downstream scour depth):------
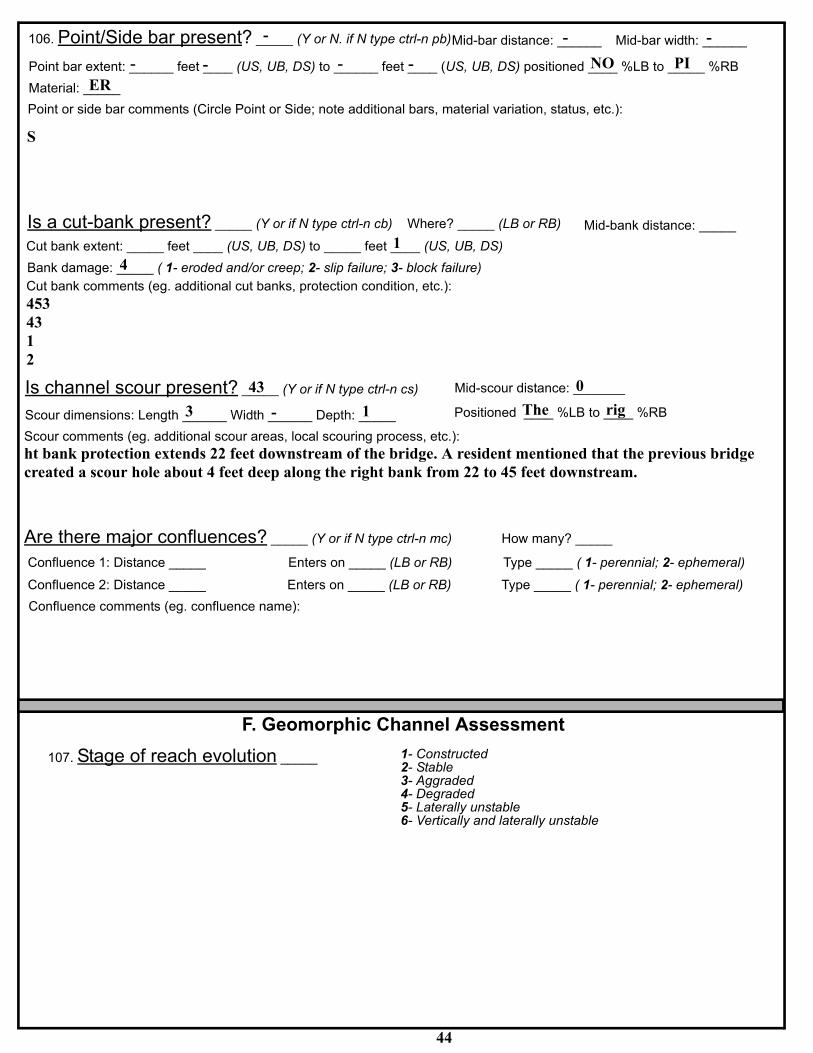
Scour dimensions: Length id
Is channel scour p
Are there major c cesConfluence 1: Distance
Confluence 2: Distance
106. Point/Side bar present? Y or N. if N type ctrl-n pb) Mid-bar widthMid-bar distance:
Point ba ee S
Point or side bar comments (Circle Poi
Material:
Is a cut-banCut bank exte e S,
Bank damage ( 1- eroded and/
F.
107. Stage of reach evolut
_____ (-
th epth
Mid-scourY or if N typ s)
Positioned
? Y or ctrl-n mc) How
Enters o LB or RB) Typ
Enters o LB or RB) Typ
44
, UB, DS) to e S, UB, DS) posit
nt or Side; note additional bars, material variation, s
Y or if N t c re? LB or RB
UB, DS) t e S, UB, DS)
or creep; 2- slip failure; 3- block failure)
Geomorphic Channel Assessmen
ion _ 1- Constructed2- Stable3- Aggraded4- Degraded5- Laterally unstable6- Vertically and laterally u
______-
LB to RB
1- perennial; 2- eph
1- perennial; 2- eph
ioned LB to
tatus, etc.):
) Mid-bank distance
t
nstable
: ______-
RB
: ______ f- t ____ (U- ______ fe- t ____ (U- ____ %NO _____ %PI r extent_____ER
S
_____ (
_____ ( : _____ k preset: _____ fent?
t ____ (U
ype ctrl-n
o _____ fe
b) Whe
t ____ (U1
n: _____ 4
Cut bank comments (eg. additional cut banks, protection condition, etc.):4534312_____ (43
: _______0______ W
resent?3
______ D- : _____e ctrl-n c
1
distance
____ %The
____ %rigScour comments (eg. additional scour areas, local scouring process, etc.):ht bank protection extends 22 feet downstream of the bridge. A resident mentioned that the previous bridge created a scour hole about 4 feet deep along the right bank from 22 to 45 feet downstream.
_____ (
_____emeral)
onfluen _____
if N type
_____ (
many?
e _____ (
emeral)
_____n
n _____ (
e _____ (Confluence comments (eg. confluence name):
____

108. Evolution comments (Channel evolution not considering bridge effects; See HEC-20, Figure 1 for geomorphic
descriptors):N-NO DROP STRUCTUREY3285DS
45

109. G. Plan View Sketch
46
point bar
cut-bank
scour hole ambient channelrip rap or
debris stone wall
other wallflow
cross-section
pb
cb
Q
stone fill
38
-
47
APPENDIX F:
SCOUR COMPUTATIONS
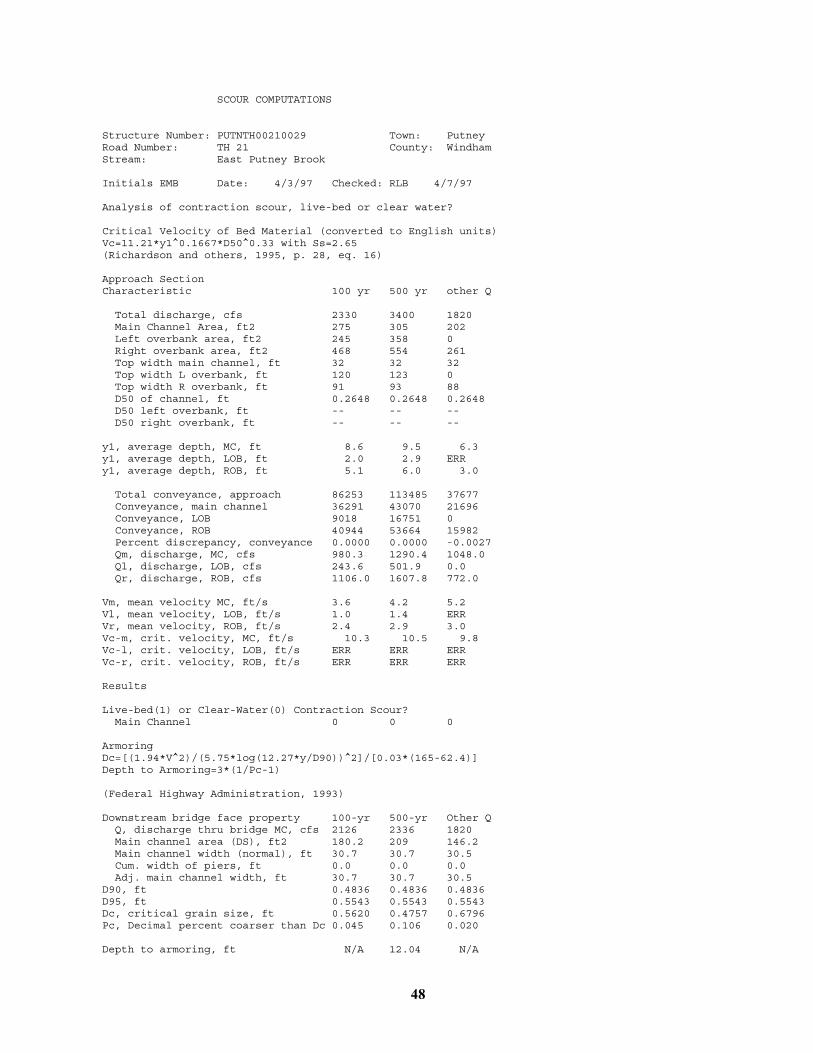
SCOUR COMPUTATIONS Structure Number: PUTNTH00210029 Town: Putney Road Number: TH 21 County: Windham Stream: East Putney Brook Initials EMB Date: 4/3/97 Checked: RLB 4/7/97 Analysis of contraction scour, live-bed or clear water? Critical Velocity of Bed Material (converted to English units) Vc=11.21*y1^0.1667*D50^0.33 with Ss=2.65 (Richardson and others, 1995, p. 28, eq. 16) Approach Section Characteristic 100 yr 500 yr other Q Total discharge, cfs 2330 3400 1820 Main Channel Area, ft2 275 305 202 Left overbank area, ft2 245 358 0 Right overbank area, ft2 468 554 261 Top width main channel, ft 32 32 32 Top width L overbank, ft 120 123 0 Top width R overbank, ft 91 93 88 D50 of channel, ft 0.2648 0.2648 0.2648 D50 left overbank, ft -- -- -- D50 right overbank, ft -- -- -- y1, average depth, MC, ft 8.6 9.5 6.3 y1, average depth, LOB, ft 2.0 2.9 ERR y1, average depth, ROB, ft 5.1 6.0 3.0 Total conveyance, approach 86253 113485 37677 Conveyance, main channel 36291 43070 21696 Conveyance, LOB 9018 16751 0 Conveyance, ROB 40944 53664 15982 Percent discrepancy, conveyance 0.0000 0.0000 -0.0027 Qm, discharge, MC, cfs 980.3 1290.4 1048.0 Ql, discharge, LOB, cfs 243.6 501.9 0.0 Qr, discharge, ROB, cfs 1106.0 1607.8 772.0 Vm, mean velocity MC, ft/s 3.6 4.2 5.2 Vl, mean velocity, LOB, ft/s 1.0 1.4 ERR Vr, mean velocity, ROB, ft/s 2.4 2.9 3.0 Vc-m, crit. velocity, MC, ft/s 10.3 10.5 9.8 Vc-l, crit. velocity, LOB, ft/s ERR ERR ERR Vc-r, crit. velocity, ROB, ft/s ERR ERR ERR Results Live-bed(1) or Clear-Water(0) Contraction Scour? Main Channel 0 0 0
Armoring Dc=[(1.94*V^2)/(5.75*log(12.27*y/D90))^2]/[0.03*(165-62.4)] Depth to Armoring=3*(1/Pc-1)
(Federal Highway Administration, 1993) Downstream bridge face property 100-yr 500-yr Other Q Q, discharge thru bridge MC, cfs 2126 2336 1820 Main channel area (DS), ft2 180.2 209 146.2 Main channel width (normal), ft 30.7 30.7 30.5 Cum. width of piers, ft 0.0 0.0 0.0 Adj. main channel width, ft 30.7 30.7 30.5 D90, ft 0.4836 0.4836 0.4836 D95, ft 0.5543 0.5543 0.5543 Dc, critical grain size, ft 0.5620 0.4757 0.6796 Pc, Decimal percent coarser than Dc 0.045 0.106 0.020 Depth to armoring, ft N/A 12.04 N/A
48

Clear Water Contraction Scour in MAIN CHANNEL y2 = (Q2^2/(131*Dm^(2/3)*W2^2))^(3/7) Converted to English Units ys=y2-y_bridge (Richardson and others, 1995, p. 32, eq. 20, 20a) Bridge Section Q100 Q500 Other Q (Q) total discharge, cfs 2330 3400 1820 (Q) discharge thru bridge, cfs 2126 2336 1820 Main channel conveyance 24742 17388 13182 Total conveyance 24742 17388 13182 Q2, bridge MC discharge,cfs 2126 2336 1820 Main channel area, ft2 224 224 146 Main channel width (normal), ft 30.7 30.7 30.5 Cum. width of piers in MC, ft 0.0 0.0 0.0 W, adjusted width, ft 30.7 30.7 30.5 y_bridge (avg. depth at br.), ft 7.30 7.30 4.79 Dm, median (1.25*D50), ft 0.331 0.331 0.331 y2, depth in contraction,ft 6.42 6.96 5.65 ys, scour depth (y2-ybridge), ft -0.88 -0.35 0.85 Pressure Flow Scour (contraction scour for orifice flow conditions) Chang pressure flow equation Hb+Ys=Cq*qbr/Vc Cq=1/Cf*Cc Cf=1.5*Fr^0.43 (<=1) Cc=SQRT[0.10(Hb/(ya-w)-0.56)]+0.79 (<=1) Umbrell pressure flow equation (Hb+Ys)/ya=1.1021*[(1-w/ya)*(Va/Vc)]^0.6031 (Richardson and other, 1995, p. 144-146) Q100 Q500 OtherQ Q, total, cfs 2330 3400 1820 Q, thru bridge MC, cfs 2126 2336 1820 Vc, critical velocity, ft/s 10.30 10.48 9.79 Va, velocity MC approach, ft/s 3.56 4.23 5.19 Main channel width (normal), ft 30.7 30.7 30.5 Cum. width of piers in MC, ft 0.0 0.0 0.0 W, adjusted width, ft 30.7 30.7 30.5 qbr, unit discharge, ft2/s 69.3 76.1 59.7 Area of full opening, ft2 224.1 224.2 146.2 Hb, depth of full opening, ft 7.30 7.30 4.79 Fr, Froude number, bridge MC 0.62 0.7 0 Cf, Fr correction factor (<=1.0) 1.00 1.00 0.00 **Area at downstream face, ft2 180.2 209 N/A **Hb, depth at downstream face, ft 5.87 6.81 N/A **Fr, Froude number at DS face 0.86 0.75 ERR **Cf, for downstream face (<=1.0) 1.00 1.00 N/A Elevation of Low Steel, ft 497.19 497.19 497.19 Elevation of Bed, ft 489.89 489.89 492.40 Elevation of Approach, ft 499.7 500.64 0 Friction loss, approach, ft 0.07 0.14 0 Elevation of WS immediately US, ft 499.63 500.50 0.00 ya, depth immediately US, ft 9.74 10.61 -492.40 Mean elevation of deck, ft 499.87 499.87 499.87 w, depth of overflow, ft (>=0) 0.00 0.63 0.00 Cc, vert contrac correction (<=1.0) 0.93 0.92 ERR **Cc, for downstream face (<=1.0) 0.855314 0.900429 ERR Ys, scour w/Chang equation, ft -0.05 0.58 N/A Ys, scour w/Umbrell equation, ft -1.64 -0.78 N/A **=for UNsubmerged orifice flow only. **Ys, scour w/Chang equation, ft 1.99 1.25 N/A **Ys, scour w/Umbrell equation, ft -0.21 -0.29 ERR In UNsubmerged orifice flow, an adjusted scour depth using the Laursen equation results and the estimated downstream bridge face properties can also be computed (ys=y2-ybridgeDS) y2, from Laursen’s equation, ft 6.42 6.96 5.65 WSEL at downstream face, ft 495.76 496.70 -- Depth at downstream face, ft 5.87 6.81 ERR Ys, depth of scour (Laursen), ft 0.55 0.14 N/A
49
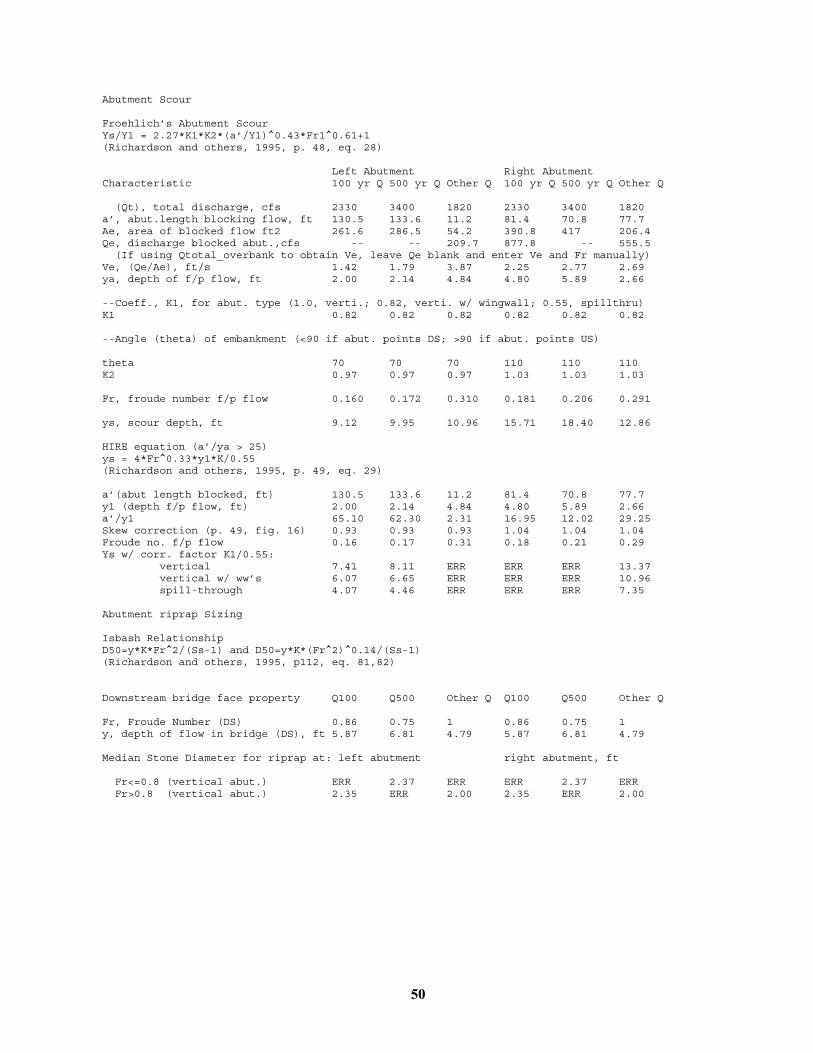
Abutment Scour Froehlich’s Abutment Scour Ys/Y1 = 2.27*K1*K2*(a’/Y1)^0.43*Fr1^0.61+1 (Richardson and others, 1995, p. 48, eq. 28) Left Abutment Right Abutment Characteristic 100 yr Q 500 yr Q Other Q 100 yr Q 500 yr Q Other Q (Qt), total discharge, cfs 2330 3400 1820 2330 3400 1820 a’, abut.length blocking flow, ft 130.5 133.6 11.2 81.4 70.8 77.7 Ae, area of blocked flow ft2 261.6 286.5 54.2 390.8 417 206.4 Qe, discharge blocked abut.,cfs -- -- 209.7 877.8 -- 555.5 (If using Qtotal_overbank to obtain Ve, leave Qe blank and enter Ve and Fr manually) Ve, (Qe/Ae), ft/s 1.42 1.79 3.87 2.25 2.77 2.69 ya, depth of f/p flow, ft 2.00 2.14 4.84 4.80 5.89 2.66 --Coeff., K1, for abut. type (1.0, verti.; 0.82, verti. w/ wingwall; 0.55, spillthru) K1 0.82 0.82 0.82 0.82 0.82 0.82 --Angle (theta) of embankment (<90 if abut. points DS; >90 if abut. points US)
theta 70 70 70 110 110 110 K2 0.97 0.97 0.97 1.03 1.03 1.03 Fr, froude number f/p flow 0.160 0.172 0.310 0.181 0.206 0.291 ys, scour depth, ft 9.12 9.95 10.96 15.71 18.40 12.86 HIRE equation (a’/ya > 25) ys = 4*Fr^0.33*y1*K/0.55 (Richardson and others, 1995, p. 49, eq. 29) a’(abut length blocked, ft) 130.5 133.6 11.2 81.4 70.8 77.7 y1 (depth f/p flow, ft) 2.00 2.14 4.84 4.80 5.89 2.66 a’/y1 65.10 62.30 2.31 16.95 12.02 29.25 Skew correction (p. 49, fig. 16) 0.93 0.93 0.93 1.04 1.04 1.04 Froude no. f/p flow 0.16 0.17 0.31 0.18 0.21 0.29 Ys w/ corr. factor K1/0.55: vertical 7.41 8.11 ERR ERR ERR 13.37 vertical w/ ww’s 6.07 6.65 ERR ERR ERR 10.96 spill-through 4.07 4.46 ERR ERR ERR 7.35 Abutment riprap Sizing Isbash Relationship D50=y*K*Fr^2/(Ss-1) and D50=y*K*(Fr^2)^0.14/(Ss-1) (Richardson and others, 1995, p112, eq. 81,82) Downstream bridge face property Q100 Q500 Other Q Q100 Q500 Other Q Fr, Froude Number (DS) 0.86 0.75 1 0.86 0.75 1 y, depth of flow in bridge (DS), ft 5.87 6.81 4.79 5.87 6.81 4.79 Median Stone Diameter for riprap at: left abutment right abutment, ft Fr<=0.8 (vertical abut.) ERR 2.37 ERR ERR 2.37 ERR Fr>0.8 (vertical abut.) 2.35 ERR 2.00 2.35 ERR 2.00
50