Embed Size (px)
Citation preview

WWW.CCSA.CA | WWW.CCLAT.CA
Gerald Thomas Senior Research and Policy Analyst Canadian Centre on Substance Abuse
Levels and Patterns of Alcohol Use in Canada
Alcohol Price Policy Series, Report 1 of 3
November 2012

This document was published by the Canadian Centre on Substance Abuse (CCSA).
CCSA activities and products are made possible through a financial contribution from Health Canada. The views of CCSA do not necessarily represent the views of the Government of Canada.
Suggested citation: Thomas, G. (2012). Levels and patterns of alcohol use in Canada. (Alcohol Price Policy Series: Report 1) Ottawa, ON: Canadian Centre on Substance Abuse.
© Canadian Centre on Substance Abuse 2012.
CCSA, 75 Albert St., Suite 500 Ottawa, ON K1P 5E7 Tel.: 613-235-4048 Email: [email protected]
This document can also be downloaded as a PDF at www.ccsa.ca. Ce document est également disponible en français sous le titre :
Niveaux et profils de consommation d’alcool au Canada
ISBN 978-1-927467-25-1
Alcohol Price Policy Series Levels and Patterns of Alcohol Use in Canada (Report 1) Analysis of Beverage Alcohol Sales in Canada (Report 2) Price Policies to Reduce Alcohol-Related Harm in Canada (Report 3) Alcohol Price Policy Series: Reducing Harm to Canadians (Policy Brief)

Levels and Patterns of Alcohol Use in Canada
© Canadian Centre on Substance Abuse 2012
Table of Contents
About the Alcohol Price Policy Series ........................................................................ 1
Executive Summary ...................................................................................................... 2
Introduction ............................................................................................................. 4 1.
Findings ................................................................................................................... 4 2.2.1 Long-term trends in prevalence of alcohol consumption ....................................................... 4
2.2 Long-term trends in levels of alcohol consumption ................................................................ 5
2.3 Usual frequency and quantity of alcohol consumption .......................................................... 6
2.4 Concentration of alcohol consumption .................................................................................... 7
2.5 Levels and trends of risky alcohol consumption ..................................................................... 7 2.6 Distribution of alcohol-related risk .......................................................................................... 10
2.7 Patterns of risky alcohol use among young adults ages 18/19–24 and post-secondary students.................................................................................................................. 13
2.8 Regional trends in alcohol consumption ................................................................................ 14
Summary of Findings ........................................................................................... 16 3.
Implications for Action ......................................................................................... 17 4.
Conclusion ............................................................................................................ 19 5.
References ................................................................................................................... 20
Appendix A: Conversion factors for female drinkers from 5+ drinks/occasion to 4+ drinks/occasion ....................................................... 23
Appendix B: Provincial comparisons of per capita alcohol consumption ............. 24
Appendix C: Evidence for the prevention paradox in Canada ................................ 25

Levels and Patterns of Alcohol Use in Canada
© Canadian Centre on Substance Abuse 2012 Page 1
About the Alcohol Price Policy Series
This series of three reports provides context and evidence to support the implementation of the price policy recommendations contained in the National Alcohol Strategy (NAS). It is most relevant for analysts and decision makers, both inside and outside government, with interest in the topic of alcohol pricing policy:
• The first report presents a summary of data on the levels and patterns of alcohol use in Canada, focusing on trends in risky drinking from 2003 to 2010.
• The second report discusses the economic and governmental context of retail alcohol sales by providing, among other things, a comparison of the direct revenue and costs of alcohol at the provincial/territorial level with the latest available data (2002–03).
• The third report summarizes the evidence on the effectiveness of price policies for reducing alcohol consumption and alcohol-related harm and costs, and presents information on alcohol pricing policies from six provinces.

Levels and Patterns of Alcohol Use in Canada
© Canadian Centre on Substance Abuse 2012 Page 2
Executive Summary
With the release of Canada Low-Risk Alcohol Drinking Guidelines in 2011, the first such national guidelines, it is useful to examine levels and patterns of alcohol use across the population to inform efforts to further reduce alcohol-related harm and costs.
This report examines alcohol consumption in Canada from a health and safety perspective, focusing on population-level data on risky alcohol consumption (defined as more than four drinks per occasion for males and more than three drinks per occasion for women). The report includes the following key findings:
• Except for the 2010–11 reporting period, average per capita alcohol consumption increased gradually over the last decade. Current annual national consumption is equivalent to 470 standard servings of beer, wine or spirits or approximately nine standard drinks a week for every person age 15 years and older in Canada.
• Based on self-reports, the 20% heaviest drinkers in Canada consumed an estimated 70% of the alcohol sold in 2004 (Figure 2).
• An estimated 20% of all female drinkers and 30% of all male drinkers report engaging in risky alcohol consumption on at least a monthly basis. There was a significant (p > 0.05) increase in monthly or more frequent risky drinking for females between 2003 and 2010 (Figure 3).
• Risky alcohol consumption is relatively common among underage drinkers, with approximately 30% of past-year drinking underage Canadians engaging in risky alcohol consumption at least monthly in 2010 (Figures 4a, 4b).
• Risky alcohol consumption peaks in young adulthood (ages 18/19–24 years), with more than 50% of past-year drinking males and approximately 45% of females in this age group consuming above recommended daily levels monthly or more often. Risky drinking declines after age 25, but does so more quickly for females than for males (Figures 4a, 4b).
• To use data collected from the Canadian Community Health Survey and to better reflect the true nature of alcohol-related risk, it is proposed that drinkers be identified by the following typology: no risk (no alcohol use in past year); low risk (no risky alcohol use in the past year); moderate risk (less than weekly risky drinking in the past year); and high risk (weekly or more often risky drinking in the past year).
• Using these proposed definitions of risk (i.e., no instance of consuming more than four drinks per occasion for men and more than three drinks per occasion for women in the past year), for females, there were more low-risk drinkers than moderate-risk drinkers in 2009–2010. For males, there were more moderate-risk drinkers than low-risk drinkers (Figure 5).
• For females, moderate- and high-risk alcohol consumption are more common than low-risk alcohol consumption from age 15 to age 34. For males, moderate- and high-risk alcohol consumption are more common than low-risk alcohol consumption from age 15 to age 54 (Figures 6a, 6b).
• Rates of risky and harmful consumption among young adults, both in and out of post-secondary schools, are substantially higher than for adults age 25 and older (Table 2).

Levels and Patterns of Alcohol Use in Canada
© Canadian Centre on Substance Abuse 2012 Page 3
• Sales of alcohol in the Yukon, the Northwest Territories, Nunavut, British Columbia, Alberta and Newfoundland and Labrador were significant (p > 0.05) higher than the national average between 1998–99 and 2009–10 (Figure 7, Appendix B).
While risky alcohol consumption is more common in certain segments of the population than others (e.g., underage youth, young adults, males up to age 54), risky drinking is increasing in others (e.g., underage females, males and females ages 24–34 and 45–64). This means consumption across most age groups is relevant to consider in efforts to reduce alcohol-related harm and costs in Canada.
The information presented in this paper suggests that while a majority of the population (60% of past-year drinking males and 76% of females) usually consumes alcohol in low-risk patterns, a substantial proportion of Canadians (25.5% of past-year drinkers) drink above the recommended levels at least occasionally (i.e., monthly or more often). Research from around the world indicates that a significant proportion of alcohol-related harm and costs are associated with the large number of moderate-risk drinkers who occasionally drink above the recommended levels. This is the “prevention paradox,” which states that a large number of people exposed to moderate risk can create more cases of harm than a small number exposed to higher risk. This is the case for Canada, which has an estimated 8.7 million moderate-risk consumers and approximately 1.8 million high-risk consumers, a nearly five-to-one ratio. Although alcohol-related risk is substantially lower for moderate-risk consumers than it is for high-risk consumers, the fact that there are almost five times as many moderate-risk consumers means they account for a large proportion of alcohol-related harm and costs.
Finally, because the majority of alcohol sold in Canada is consumed by just 20% of the heaviest drinkers, reductions in overall consumption will likely result if occasional and regular risky drinking are successfully reduced across the population.
These findings suggest that addressing alcohol-related harm in Canada will involve both reducing at-risk alcohol consumption among the large number of moderate-risk consumers as well as addressing high-risk alcohol consumption among the smaller number of consumers who regularly drink in risky ways. A combination of population-level and targeted approaches will be necessary.
Several decades of international research shows that increasing or maintaining the overall price of alcohol through interventions such as excise taxes and indexing prices to inflation can reduce overall consumption. More recent research and practice now suggest it is possible to encourage safer alcohol use by implementing targeted policies that focus directly on risky alcohol consumption. Chief among these are pricing on alcohol content (i.e., volumetric pricing) to encourage the production and consumption of lower strength alcohol products and implementing minimum prices to remove inexpensive sources of alcohol often favoured by young adults and other high-risk drinkers.
Levels and Patterns of Alcohol Use in Canada
© Canadian Centre on Substance Abuse 2012
Page 4
Introduction 1.
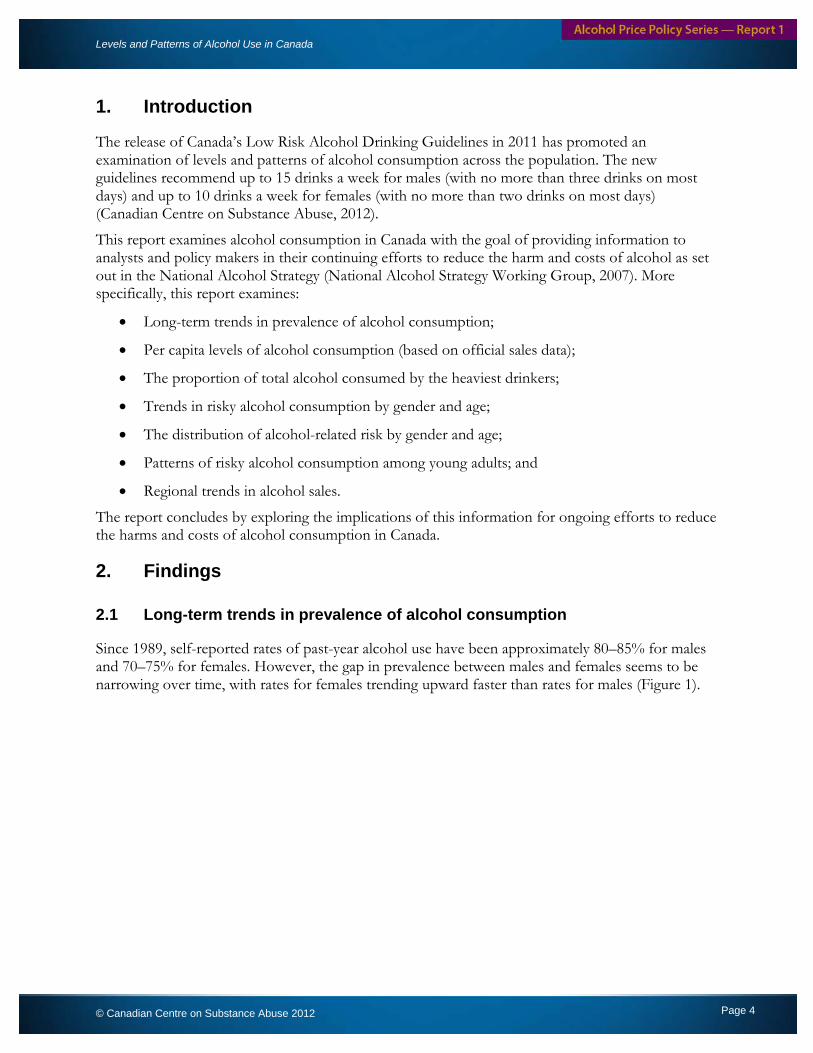
The release of Canada’s Low Risk Alcohol Drinking Guidelines in 2011 has promoted an examination of levels and patterns of alcohol consumption across the population. The new guidelines recommend up to 15 drinks a week for males (with no more than three drinks on most days) and up to 10 drinks a week for females (with no more than two drinks on most days) (Canadian Centre on Substance Abuse, 2012).
This report examines alcohol consumption in Canada with the goal of providing information to analysts and policy makers in their continuing efforts to reduce the harm and costs of alcohol as set out in the National Alcohol Strategy (National Alcohol Strategy Working Group, 2007). More specifically, this report examines:
• Long-term trends in prevalence of alcohol consumption;
• Per capita levels of alcohol consumption (based on official sales data);
• The proportion of total alcohol consumed by the heaviest drinkers;
• Trends in risky alcohol consumption by gender and age;
• The distribution of alcohol-related risk by gender and age;
• Patterns of risky alcohol consumption among young adults; and
• Regional trends in alcohol sales.
The report concludes by exploring the implications of this information for ongoing efforts to reduce the harms and costs of alcohol consumption in Canada.
Findings 2.
2.1 Long-term trends in prevalence of alcohol consumption
Since 1989, self-reported rates of past-year alcohol use have been approximately 80–85% for males and 70–75% for females. However, the gap in prevalence between males and females seems to be narrowing over time, with rates for females trending upward faster than rates for males (Figure 1).

Levels and Patterns of Alcohol Use in Canada
© Canadian Centre on Substance Abuse 2012
Page 5
Figure 1: Long-term trends in prevalence of past-year alcohol use, general population age 15+, Canada
Sources: Statistics Canada: National Alcohol and Drug Survey (1989), Canadian Alcohol and Drug Survey (1994), Canadian Community Health Survey (2003, 2005, 2007–08, 2009–10); Canadian Centre on Substance Abuse: Canadian Addiction Survey (2004).
From these data it is clear that the vast majority of Canadians consume alcohol. In 2010, just over 91% of males and 87% of females age 15 or older reported consuming alcohol at least once in their lifetime. Further, 80% of males and 74% of females reported consuming alcohol in the past year, with 69% of males and 58% of females reported consuming at least once in the past month (Health Canada, 2012a).
2.2 Long-term trends in levels of alcohol consumption
Based on official Statistics Canada sales records, national alcohol consumption has varied from a high of approximately 11.5 litres of ethyl alcohol1 for every person age 15 and older in 1978–79 to a low of 7.2 litres in 1996–97. More recently, per capita national consumption increased to 8.2 litres in 2007–08 and remained at that level through 2009–10.
In the last reporting period (2010–11), per capita consumption declined for the first time since the mid-1990s to 8.0 litres of pure ethanol. This is equivalent to about 470 standard servings of beer, wine or spirits for every person age 15 years and older in Canada per year (Statistics Canada, 2012).
1 Because different beverages contain various concentrations of alcohol, the convention is to use litres of ethyl alcohol (pure alcohol) to measure average alcohol consumption at the population level.
50.0
55.0
60.0
65.0
70.0
75.0
80.0
85.0
90.0
per c
ent
Women Men

Levels and Patterns of Alcohol Use in Canada
© Canadian Centre on Substance Abuse 2012
Page 6
2.3 Usual frequency and quantity of alcohol consumption
As part of Health Canada’s annual Canadian Alcohol and Drug Use Monitoring Survey2, respondents who drank in the past year were asked about their “usual” frequency (Table 1a) and quantity (Table 1b) of alcohol consumption. These data indicate the majority (54%) of male consumers normally drink alcohol at least weekly.3 Consuming alcohol once a week or more often in the past year is also common among females: an estimated 40% of female drinkers reported consuming alcohol at this frequency in 2010.
In terms of usual quantity consumed, the majority of drinkers (60% of males, 76% of females) reported usually having one or two drinks per occasion, suggesting that most Canadians typically consume at low-risk levels. However, 15% of males and 7% of females reported consuming five or more drinks as their typical drinking quantity. This level of consumption is associated with a significant increase in the risk of alcohol-related harm (Butt, Beirness, Gliksman, Paradis & Stockwell, 2011). Table 1a: Frequency of alcohol consumption, past year drinkers, general population age 15+, Canada, 2010
Frequency % of past-year drinkers Male Female
Less than once a month 16.8 26.7 1–3 times a month 28.9 33.0 1–3 times a week 39.1 32.2 4+ times a week 15.2 8.1
Source: Health Canada, 2012a.
Table 1b: Usual quantity of alcohol consumed, past year drinkers, general population age 15+, Canada, 2010
Usual quantity (standard drinks)
% of past-year drinkers Male Female
1–2 drinks 60.1 76.4 3–4 drinks 24.5 16.5 5+ drinks 15.4 7.1
Source: Health Canada, 2012a.
2 The Canadian Alcohol and Drug Use Monitoring Survey is an ongoing general population survey of alcohol and illicit drug use among Canadians aged 15 years and older. It is based on a two-stage (telephone household, respondent) random sample stratified by province (the three territories are not included). The results for 2010 are based on telephone interviews with 13,615 respondents that occurred between February and December 2010, which represent 25,957,435 Canadian residents age 15 years and older. The response rate for 2010 was 42.8%.
3 It is important to note that the proportions listed in Tables 1a and 1b are self-reported quantity and frequency data that, because of a variety of factors, systematically underestimate alcohol consumption when compared to official government sales data. Analysis of these types of survey data suggest they account for only 30–40% of documented alcohol sales (Stockwell, Zhao & Thomas, 2009). With 60–70% of official sales unaccounted, the self-reported levels and patterns of drinking derived from these data should be interpreted with caution. While the issue of under-reporting applies to all of the self-reported data included in this analysis, these data represent the only source of information on individual level consumption levels and patterns. Although these estimates of consumption should be interpreted with caution, they do provide reasonable assessments of trends in drinking over time because the methods used to collect the information are replicated year to year.

Levels and Patterns of Alcohol Use in Canada
© Canadian Centre on Substance Abuse 2012
Page 7
2.4 Concentration of alcohol consumption
Analyses of usual quantity and frequency data obtained from the 2004 Canadian Addiction Survey4 suggest that a small proportion of regular risky drinkers account for the majority of alcohol consumed. As shown in Figure 2, the 10% heaviest drinkers in Canada accounted for 53.3% of total alcohol consumption in 2004, while the 20% heaviest drinkers accounted for almost 72% of total consumption. This means the remaining 80% of the drinking population accounted for only 28% of all alcohol consumed (as measured by self-report). Thus, a large majority of the alcohol consumed in Canada appears to be concentrated among those who drink the heaviest. Figure 2: Cumulative percentage of drinking by annual volume of intake, general population age 15 +, Canada, 2004
Source: Stockwell, Zhao & Thomas, 2009.
2.5 Levels and trends of risky alcohol consumption
Consuming five or more drinks on a single occasion for males and four or more for females is commonly used as a measure of risky drinking because this level of consumption is associated with an increased risk of health and social harm. This definition of risky consumption now aligns with the upper daily limits of low-risk consumption set out in Canada’s Low Risk Alcohol Drinking Guidelines (Butt et al., 2010). Because of the reasons explained below, it is common in Canada to use consumption at this level once a month or more often in the past year to identify risky drinkers (Adlaf, Begin & Sawka, 2005; Health Canada, 2012a, 2012b).
Figure 3 depicts self-reported rates of monthly or more often risky consumption for males and females in Canada between 2003 and 2009–10 based on findings from the Canadian Community 4 The Canadian Addiction Survey was a two-stage (telephone household, respondent) random sample of Canadians adults stratified by 21 regional areas, conducted between December 2003 and April 2004. The full sample (13,909) was weighted to be representative of the population of Canadian adults (age 15+) residing in the 10 provinces (the territories were not included). The response rate for the CAS was 47%.
0%
10%
20%
30%
40%
50%
60%
70%
80%
90%
100%
cum
ulat
ive
per c
ent o
f con
sum
ptio
n 10th decile
9th decile
8th decile
7th decile
6th decile
5th decile
4th decile
3rd decile
2nd decile
1st decile
53.3%
71.6%

Levels and Patterns of Alcohol Use in Canada
© Canadian Centre on Substance Abuse 2012
Page 8
Health Survey.5 These data suggest that approximately 30% of past-year drinking males and an estimated 20% of past-year drinking females reported monthly or more often risky alcohol consumption.6 For males age 15 and older, self-reported rates of monthly risky alcohol consumption showed no statistically significant change between 2003 and 2009–10. However, females age 15 and older showed a statistically significant increase from 19.17% to 21.82% over the same time interval. Figure 3: Percentage reporting 5+ drinks/occasion for males once a month or more in past year, 4 + drinks/occasion for females among past year drinkers, general population age 15+, Canada, 2003 to 2009-10
Source: Statistics Canada, 2011a; further analysis from the author as described in footnote 7 and Appendix A.
As shown in Figures 4a and 4b, rates of monthly risky alcohol consumption are not uniform across all age groups: risky alcohol consumption on a monthly or more frequent basis peaks in young adulthood at more than 50% for males and approximately 45% for females. Trend data indicate that males age 25–34 and 45–64 reported significant (p > 0.05) increases in monthly or more often risky alcohol consumption between 2003 and 2009–10. Underage girls and females 25–34 and 45–64 also reported significant increases in monthly risky alcohol consumption over the same time frame.
5 The CCHS is ongoing annual cross-sectional survey that collects information from Canadians age 12 years and older about health status, health care use and health determinants. Sampling in the survey is stratified to provide reliable estimates at both the provincial and health region levels. Since 2007, the CCHS collects data from approximately 60,000 people annually and combines two years of data to maintain statistical power. The 2009–10 results are based on responses from 124,870 individuals, representing a response rate of 71.5%. The data were collected between January 2009 and December 2010.
6 The CCHS defines risky alcohol consumption as five or more drinks on a single occasion for both males and females. However, because of the fact that women process alcohol differently than men, it is now convention to use four or more drinks on a single occasion to define risky consumption for women. Data from four national surveys (CAS 2004; CADUMS 2008, 2009, 2010) were used to determine an average conversion factor between the 5+ drink and 4+ drink measures for females of 1.59. This conversion was applied to the CCHS data presented in Figures 3, 4a and 4b. These results indicate that lowering the threshold of risky drinking from 5+ drinks/occasion monthly or more often to 4+ drinks/occasion increases the estimated prevalence of risky drinking by an average of 59% for females age 15+. See Appendix A for details on how these conversion factors were generated.
0%5%
10%15%20%25%30%35%40%
Male (5+ drinks) Female (4+ drinks)

Levels and Patterns of Alcohol Use in Canada
© Canadian Centre on Substance Abuse 2012
Page 9
Figures 4a and 4b: Proportion of past year drinkers reporting monthly or more often risky alcohol consumption in past year, general population age 15+, Canada, 2003 to 2009–107
Source: Statistics Canada, 2011a; further analysis by author as described in footnote 7 and Appendix A.
Notes: Underage drinkers are respondents age 15–17 in Alberta, Manitoba and Quebec, and age 15–18 elsewhere in Canada. Young adult drinkers are respondents age 18–24 in Alberta, Manitoba and Quebec, and age 19–24 elsewhere in Canada. Data for females age 65+ is suppressed due to lack of precision in estimates.
7 The estimates for women in Figure 4b are converted to the 4+ drinks/occasion measure using age-specific conversion factors as follows: underage (1.53); age 18/19–24 (1.37); age 25–34 (1.50); age 35–44 (1.76); age 45–54 (1.72); and age 55–64 (1.93). The estimates indicate the proportion of underage female consumers age 15–17/18 reporting consuming four or more drinks on a single occasion at least monthly or more often was 53% higher than the proportion reporting five or more drinks on a single occasion, the proportion of female consumers ages 18/19–24 was 37% higher, etc.
0%
10%
20%
30%
40%
50%
60%
Male
Underage Young Adult Age 25-34 Age 35-44
Age 45-54 Age 55-64 Age 65+
0%
10%
20%
30%
40%
50%
60%Female 4+
Underage Young Adult Age 25-34
Age 35-44 Age 45-54 Age 55-64
Levels and Patterns of Alcohol Use in Canada
© Canadian Centre on Substance Abuse 2012
Page 10
2.6 Distribution of alcohol-related risk
Based on the data presented above, a substantial number of Canadians consume alcohol above recommended levels on at least an occasional basis (i.e., monthly or more often). The role of occasional risky consumers in the generation of alcohol-related harm is important to take into account because a large number of people exposed to moderate risk can account for more harm than a small number exposed to higher risk (Rose, Khaw & Marmot, 2008). This is known as the “prevention paradox,” which applies to alcohol where the large number of people who occasionally consume above recommended levels account for a majority of acute harm associated with alcohol (Weitzman & Nelson, 2004; Spurling & Vinson, 2005; Rossow & Romelsjö, 2006; Poikolainen, Paljärvi & Mäkelä, 2007; Kuendig, Hasselberg, Laflamme, Dappen & Gmel, 2008).8
Classifying people who consume alcohol based on risk is complex because alcohol-related harm results from the interplay of a variety of factors, including the amount of alcohol consumed; the physical, emotional and mental state of the drinker; and the physical and social environment where the consumption occurs. Further, in assessing levels of consumption across the population, the questions asked in population surveys create limitations for aggregating drinkers according to their alcohol consumption and risk. For example, the Canadian Community Health Survey asks respondents how often they consume more than five drinks on a single occasion with several discrete frequency responses to choose from: never, less than monthly, monthly, weekly, etc. This means it is only possible to differentiate consumers based upon the frequencies of risky consumption included in the survey. Based on these limitations, it is convention in the field to use five or more drinks per occasion for males (four or more drinks for females) once a month or more often in the past year to identify risky drinkers. However, this means drinkers can exceed the upper daily limits recommended in Canada’s Low_Risk Alcohol Drinking Guidelines up to 11 times a year before they become identified as risky drinkers.
To address this limitation in existing data, information presented in Figures 5, 6a and 6b use a lower threshold to identify moderate risk drinkers as those who consume above the upper daily limits recommended in Canada’s Low-Risk Alcohol Drinking Guidelines at least once in the past year. This is because any instance of exceeding the guidelines is potentially risky (Butt et al., 2010). In the following charts, the proposed categories are: low-risk consumers (those who never consume five or more drinks per occasion); moderate-risk consumers (those who consume five or more drinks anywhere from once in the past year to up to three times a month); and high-risk consumers (those who drink at this level weekly or more often).9 While this classification of drinkers is still somewhat
8 Research from several countries indicates that people who drink at risky levels infrequently are more likely to experience an acute alcohol-related injury per heavy drinking occasion than drinkers who engage in risky consumption more regularly. This is likely because of a number of factors, including the fact that heavy drinkers develop tolerance to high doses of alcohol and often have protective strategies in place that protect them from experiencing acute harms when intoxicated (Cherpitel, Ye & Bond, 2004; Gmel, Bissery, Gammeter, Givel, Calmes, Yertsin & Daeppen, 2006).
9 The data in Figures 5 and 6a use the 5+ drinks/occasion measure for both males and females because that is how it is collected by Statistics Canada. The rate shown for women would be substantially higher if the 4+ drinks/occasion measure were used. See Appendix A.
Levels and Patterns of Alcohol Use in Canada
© Canadian Centre on Substance Abuse 2012
Page 11
inexact,10 it does provide a more useful breakdown of consumption that better approximates the true nature of alcohol-related risk (i.e., the prevention paradox). However, questions regarding alcohol use in national surveys should be modified to better reflect the Low-Risk Alcohol Drinking Guidelines. More research is needed to determine the actual risks associated with different levels of alcohol consumption so drinkers can be categorized based on an accurate assessment of risk.11
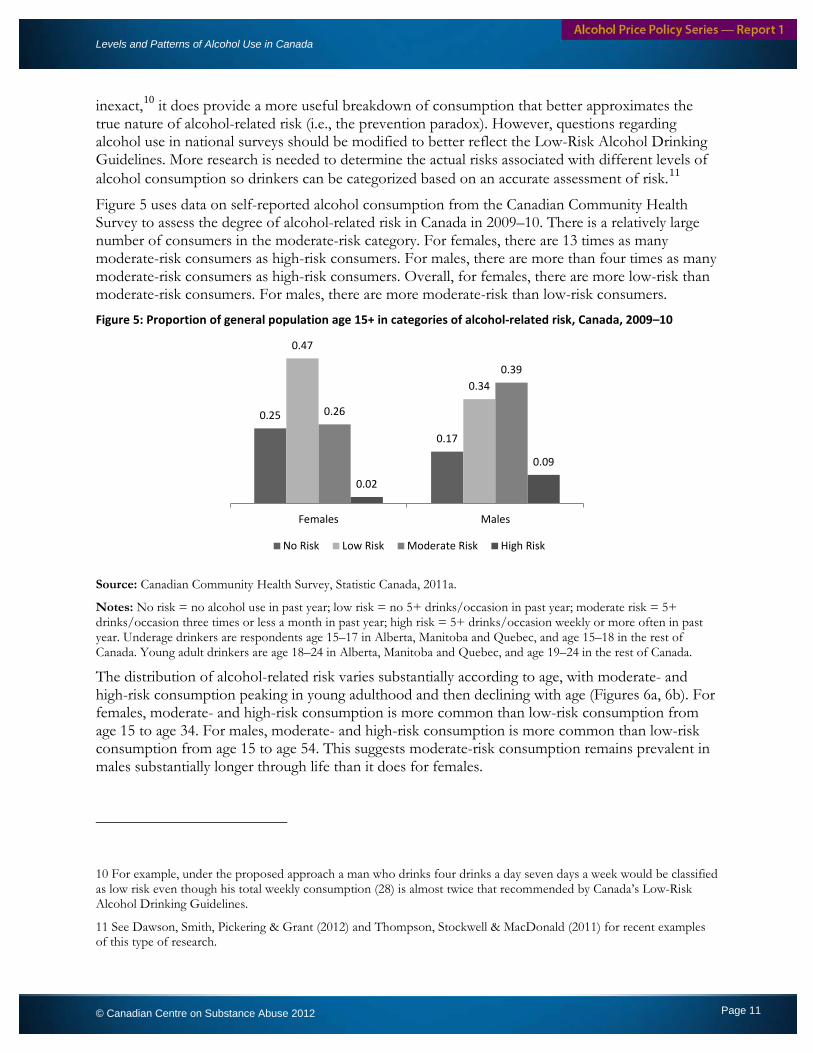
Figure 5 uses data on self-reported alcohol consumption from the Canadian Community Health Survey to assess the degree of alcohol-related risk in Canada in 2009–10. There is a relatively large number of consumers in the moderate-risk category. For females, there are 13 times as many moderate-risk consumers as high-risk consumers. For males, there are more than four times as many moderate-risk consumers as high-risk consumers. Overall, for females, there are more low-risk than moderate-risk consumers. For males, there are more moderate-risk than low-risk consumers. Figure 5: Proportion of general population age 15+ in categories of alcohol-related risk, Canada, 2009–10
Source: Canadian Community Health Survey, Statistic Canada, 2011a.
Notes: No risk = no alcohol use in past year; low risk = no 5+ drinks/occasion in past year; moderate risk = 5+ drinks/occasion three times or less a month in past year; high risk = 5+ drinks/occasion weekly or more often in past year. Underage drinkers are respondents age 15–17 in Alberta, Manitoba and Quebec, and age 15–18 in the rest of Canada. Young adult drinkers are age 18–24 in Alberta, Manitoba and Quebec, and age 19–24 in the rest of Canada.
The distribution of alcohol-related risk varies substantially according to age, with moderate- and high-risk consumption peaking in young adulthood and then declining with age (Figures 6a, 6b). For females, moderate- and high-risk consumption is more common than low-risk consumption from age 15 to age 34. For males, moderate- and high-risk consumption is more common than low-risk consumption from age 15 to age 54. This suggests moderate-risk consumption remains prevalent in males substantially longer through life than it does for females.
10 For example, under the proposed approach a man who drinks four drinks a day seven days a week would be classified as low risk even though his total weekly consumption (28) is almost twice that recommended by Canada’s Low-Risk Alcohol Drinking Guidelines.
11 See Dawson, Smith, Pickering & Grant (2012) and Thompson, Stockwell & MacDonald (2011) for recent examples of this type of research.
0.25
0.17
0.47
0.34
0.26
0.39
0.02
0.09
Females Males
No Risk Low Risk Moderate Risk High Risk

Levels and Patterns of Alcohol Use in Canada
© Canadian Centre on Substance Abuse 2012
Page 12
Figures 6a and 6b: Proportion of general population age 15+ in proposed categories of alcohol-related risk, Canada, 2009–1012
Source: Canadian Community Health Survey, Statistics Canada 2011a.
Notes: No risk = no alcohol use in past year; low risk = no 5+ drinks/occasion in past year; moderate risk = 5+ drinks/occasion three times or less a month in past year; high risk = 5+ drinks/occasion weekly or more often in past year. Underage drinkers are respondents age 15–17 in Alberta, Manitoba and Quebec, and age 15–18 in the rest of Canada. Young adult drinkers are respondents age 18–24 in Alberta, Manitoba and Quebec, and age 19–24 in the rest of Canada.
12 Figure 6a is based on 5+ drinks/occasion as the measure of risky drinking for females because this is how the data is collected by Statistics Canada. Based on the analysis presented in Appendix A, the estimated rates of risky alcohol consumption would be substantially higher for females if the 4+ drinks/occasion measure were used instead.
0.39
0.14 0.21 0.21 0.20
0.25 0.37
0.30 0.25
0.34
0.48 0.53 0.61 0.59
0.28
0.53 0.42
0.28 0.26 0.14
0.04 0.02 0.08
0.02 0.03 0.02 0.01 0.004
Underage Young adult Ages 25-34 Ages 35-44 Ages 45-54 Ages 55-64 Ages 65+
Females
No Risk Low Risk Moderate Risk High Risk
0.39
0.11 0.12 0.14 0.14 0.17 0.24 0.21
0.14 0.22
0.30 0.37
0.45 0.58
0.34
0.55 0.54 0.44 0.40
0.32
0.16 0.06
0.19 0.12 0.11 0.09 0.06 0.03
Underage Young adult Ages 25-34 Ages 35-44 Ages 45-54 Ages 55-64 Ages 65+
Males
No Risk Low Risk Moderate Risk High Risk

Levels and Patterns of Alcohol Use in Canada
© Canadian Centre on Substance Abuse 2012 Page 13
2.7 Patterns of risky alcohol use among young adults ages 18/19–24 and post-secondary students
In 2004, researchers undertook two major national surveys: one to assess patterns of alcohol and drug use among the general population, the other to assess alcohol and drug use among undergraduate university and college students in Canada (Adlaf, Begin & Sawka, 2005; Adlaf, Demers & Gliksman, 2005).13 Table 2 compares the results from identical questions asked in both of these surveys. These data suggest that weekly or more often risky alcohol consumption, hazardous consumption and harmful consumption (defined in the table) are all much more common among young adults, both in and out of university, than the general population age 25 years and older. Also, weekly or more often risky consumption and hazardous consumption are both more common among young adult males than young adult females. However, harmful alcohol consumption by undergraduate females is commensurate with that of undergraduate males as measured by the Alcohol Use Disorder Identification Test (AUDIT).14 Table 2: Patterns of risky alcohol use, undergraduate students, general population age 18/19–24 and general population age 25+, Canada, 200415
Measure
Undergraduate students (Canadian Campus
Survey)
General population age 18/19–24 (Canadian
Addiction Survey)
General population age 25+ (Canadian Addiction Survey)
Male Female Male Female Male Female 5+ drinks on a single occasion at least weekly (4+ for females) 20.6% 12.5% 15.7% 10.3% 6.0% 1.5%
Hazardous consumption (AUDIT 8+) 37.6% 27.5% 36.8% 24.5% 16.5% 4.0%
Harmful consumption (reporting at least one harmful consequence from the AUDIT)
45.9% 42.4% 44.0% 35.7% 19.3% 9.2%
Sources: Adlaf, Begin & Sawka, 2005; Adlaf, Demers & Gliksman, 2005.
13 Technical details on the Canadian Addiction Survey are provided in footnote 4. The Canadian Campus Survey was a random sample of 6,282 full-time university undergraduates (41% of eligible students) from 40 universities who completed questionnaires by mail (56%) or online (44%) during March and April 2004. Sixty-four universities, with an enrolment of about 642,000 Canadian undergraduates, met the criteria for inclusion in the study. Of the 64 universities (69 campuses) that met the eligibility criteria, 40 (45 campuses) agreed to participate, representing a completion rate of 63% of universities and 65% of campuses. 14 The World Health Organization’s Alcohol Use Disorders Identification Test (AUDIT) is a reliable and simple screening tool that is sensitive to early detection of risky and problematic (hazardous and harmful) drinking. It has three questions on alcohol consumption, three questions on drinking behaviour and dependence, and four questions on the consequences or problems related to drinking. Scores of eight or higher on the AUDIT indicate hazardous drinking.
15 These numbers report the same measures for different populations from different surveys for comparisons purposes. Therefore, they do not add to 100% within rows or columns.

Levels and Patterns of Alcohol Use in Canada
© Canadian Centre on Substance Abuse 2012 Page 14
2.8 Regional trends in alcohol consumption
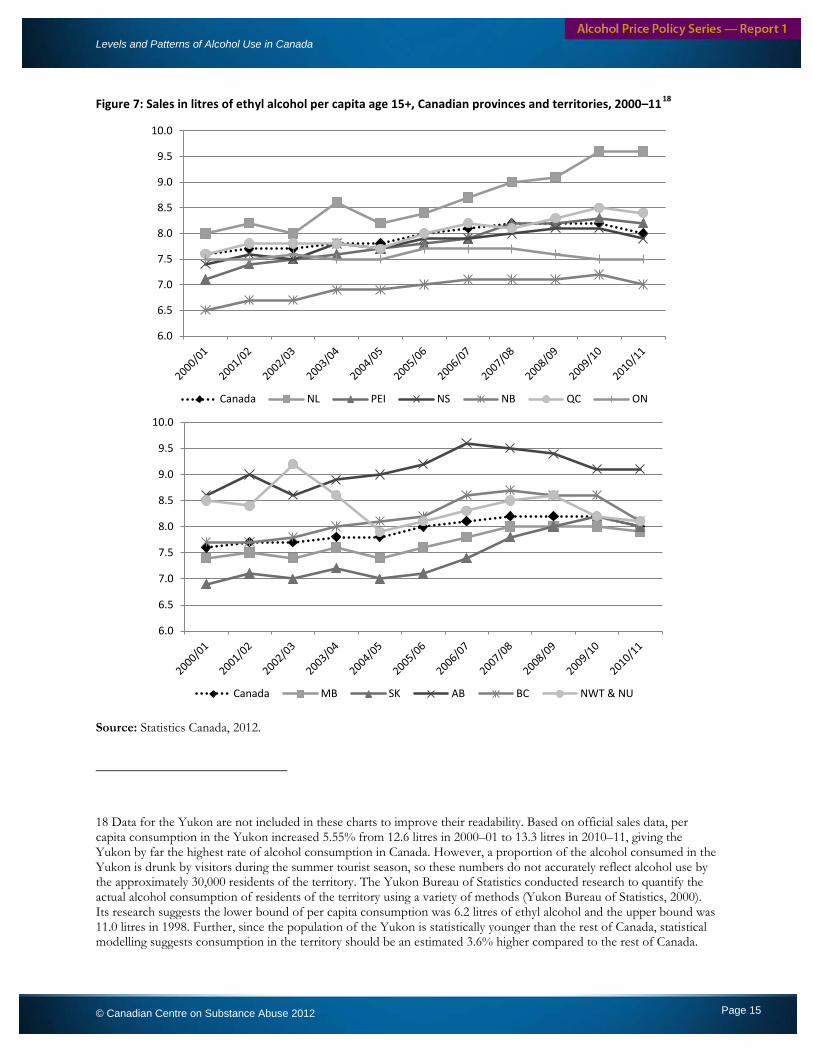
While the average national alcohol consumption per capita age 15 years and older is 470 standard drinks per year, there is substantial variation in levels of drinking across the provinces and territories (Figure 7). This variation results from a number of factors, including drinking styles and preferences (e.g., beer consumption is more common in the west while wine consumption is more common in Quebec), government policies affecting the availability of alcohol (including pricing policies), other economic factors such as disposable income, and cultural and historical influences. The variation in consumption across the jurisdictions is important to consider because it informs efforts to tailor alcohol policies to the specific cultural, political and, in the case of price policies, economic context of each jurisdiction. As will be shown in the third paper in this series, alcohol pricing and retailing regimes are different in every jurisdiction, which means the pricing recommendations in the National Alcohol Strategy will need to be tailored to fit these specific contexts.
Statistical analyses of official sales data16 from 1998–99 to 2009–10 reveal that alcohol sales in the Yukon, the Northwest Territories, Nunavut, British Columbia, Alberta, and Newfoundland and Labrador were significantly (p > 0.05) higher than the average for all of Canada. Alcohol sales were significantly below the national average in PEI, New Brunswick, Ontario, Manitoba and Saskatchewan, and sales were not significantly different from the national average in Quebec and Nova Scotia (Figure 7).17
16 The methods used by Statistics Canada to monitor alcohol consumption systematically underestimate actual consumption due to several factors. First, they do not include alcohol produced and consumed from U-vin and U-brew facilities, which currently operate in the Yukon, British Columbia, Ontario, Quebec and PEI. Second, the conversion factors used to estimate consumption in litres of absolute alcohol systematically underestimate the average alcohol content of some products. Data analyzed for 2002–05 in British Columbia showed that the typical alcoholic strength of wine and coolers was higher than assumed by Statistics Canada (12.2% versus 11.5% for wine and 6.7% versus 5% for coolers). For an estimate of alcohol consumption in British Columbia using more accurate methods, see the BC Alcohol and Other Drugs Monitoring website: http://carbc.ca/tabid/541/Default.aspx.
17 See Appendix B for details on the statistical comparison of trends in sales in the jurisdictions.
Levels and Patterns of Alcohol Use in Canada
© Canadian Centre on Substance Abuse 2012 Page 15
Figure 7: Sales in litres of ethyl alcohol per capita age 15+, Canadian provinces and territories, 2000–1118
Source: Statistics Canada, 2012.
18 Data for the Yukon are not included in these charts to improve their readability. Based on official sales data, per capita consumption in the Yukon increased 5.55% from 12.6 litres in 2000–01 to 13.3 litres in 2010–11, giving the Yukon by far the highest rate of alcohol consumption in Canada. However, a proportion of the alcohol consumed in the Yukon is drunk by visitors during the summer tourist season, so these numbers do not accurately reflect alcohol use by the approximately 30,000 residents of the territory. The Yukon Bureau of Statistics conducted research to quantify the actual alcohol consumption of residents of the territory using a variety of methods (Yukon Bureau of Statistics, 2000). Its research suggests the lower bound of per capita consumption was 6.2 litres of ethyl alcohol and the upper bound was 11.0 litres in 1998. Further, since the population of the Yukon is statistically younger than the rest of Canada, statistical modelling suggests consumption in the territory should be an estimated 3.6% higher compared to the rest of Canada.
6.0
6.5
7.0
7.5
8.0
8.5
9.0
9.5
10.0
Canada NL PEI NS NB QC ON
6.0
6.5
7.0
7.5
8.0
8.5
9.0
9.5
10.0
Canada MB SK AB BC NWT & NU

Levels and Patterns of Alcohol Use in Canada
© Canadian Centre on Substance Abuse 2012 Page 16
As shown in Table 3, alcohol sales increased in all but two jurisdictions over the last decade, with the greatest increases occuring in Newfoundland and Labrador (+20.0%), Saskatchewan (+15.9%), PEI (+15.5%) and Quebec (+10.5%). The smallest increases were experienced by the Northwest Territories and Nunavut (-4.7%) and Ontario (±0.0%). Table 3: Percentage increase in per capita alcohol sales, Canadian provinces and territories, 2000–01 to 2010–11
Province or territory
Percentage change (2000–01 to 2010–11)
NL 20.0 SK 15.9 PEI 15.5 QC 10.5 NB 7.7 NS 6.8 MB 6.8 AB 5.8 YT 5.6 Canada 5.3 BC 5.2 ON 0.0 NWT & NU -4.7
Source: Statistics Canada, 2012.
Summary of Findings 3.
While the majority of Canadians consume within the maximum daily limits set out in the Canada’s Low-Risk Alcohol Drinking Guidelines, a sizeable minority occasionally consume alcohol in ways that increase the risk of harm: in 2009–10, an estimated 25.5% of past-year drinkers (30.5% males, 20.4% females19) consumed above the recommended upper daily levels at least once a month or more in the past year (Statistic Canada, 2011a). Based on this measure, approximately five million Canadians drink at levels that elevate their risk of harm monthly or more often.
Looking more closely at the population of risky drinkers in Canada, it is apparent that this behaviour is most common among young adults ages 18/19–24, with more than 50% of males and approximately 45% of females in this age group consuming above the recommended daily levels once a month or more frequently in the past year (Figures 4a, 4b). The available data also suggest that attendance at a post-secondary institution increases alcohol use and risk in the young adult age group, especially among women (Table 2).20
19 The percentage for women is based on the 4+drinks/occasion measure set out in Appendix A.
20 The Centre of Addiction Research of British Columbia (CARBC) has a website devoted to helping campuses deal with risky alcohol and drug use among students: http://www.carbc.ca/HelpingCampuses.aspx.
Levels and Patterns of Alcohol Use in Canada
© Canadian Centre on Substance Abuse 2012 Page 17
Monthly or more frequent risky alcohol consumption is also relatively common (approximately 30% or higher of past-year drinkers) among underage males and females as well as males ages 25–54. Further, underage girls as well as men and women ages 25–34 and 45–64 reported significant increases in monthly risky alcohol consumption between 2003 and 2009–10 (Figures 4a, 4b). These data suggest efforts to reduce alcohol-related harm and costs are relevant to most age groupings because they engage in risky drinking at least occasionally, have relatively high rates of risky use (i.e., underage girls and boys, young adult males and females, males up to age 54), or have experienced increases in risky alcohol consumption in recent years (males and females ages 25–34 and 45–64).
By comparison, if any instance of exceeding the upper daily limits of alcohol consumption in the past year is used to identify risky drinking, an estimated 41% of current drinkers (approximately 8.7 million Canadians) are classified as moderate-risk in 2010. Estimates of high-risk drinkers (i.e., those that consume above recommended daily levels weekly or more often) stood at 8.5% of current drinkers (1.8 million consumers) in 2010 (Table 4). Based on the method of assessing risk proposed in this report, at least half of all drinkers are legitimate targets for efforts to reduce risky alcohol use in Canada.
The overall distribution of alcohol-related risk is also important to consider in efforts to reduce alcohol-related harm because of the prevention paradox, which suggests that a large number of people exposed to moderate risk can account for more harm than a small number exposed to higher risk. The prevention paradox applies to alcoholic beverages because a substantial proportion of alcohol-related harm comes not from high-risk drinkers but from the larger number of moderate-risk consumers who only occasionally drink above recommended levels (Rossow & Romelsjo, 2006). Data from the Canadian Community Health Survey verify that the number of moderate-risk consumers greatly exceeds the number of high-risk consumers in Canada (Figures 5, 6a, 6b).21
The concentration of alcohol consumption is another important factor to consider when attempting to address the harms and costs of alcohol. Self-report data from the 2004 Canadian Addiction Survey reveal that the top 20% of drinkers accounted for 72% of alcohol consumption (Stockwell, Zhao & Thomas, 2009). These data highlight the fact that a large proportion of sales and revenue from alcohol are accounted for by those who drink above levels recommended to reduce risk (Stockwell, Sturge & MacDonald, 2005; Figure 2). They also suggests overall consumption will likely decline if risky drinking is substantially reduced across the population, unless a large number of very light drinkers increase their consumption to compensate.
Implications for Action 4.
The information presented in this report suggests that efforts to address risky alcohol use in Canada will necessarily involve reducing both occasional risky consumption among moderate-risk drinkers as well as regular risky consumption among high-risk users. This means a combination of population-level and targeted approaches will be required to effectively reduce alcohol-related harm and costs in Canada.
The need for multiple reinforcing approaches to address risky alcohol use is evident in the National Alcohol Strategy’s 41 recommendations where educational and enforcement initiatives exist
21 Appendix C presents preliminary evidence on the prevention paradox in Canada.

Levels and Patterns of Alcohol Use in Canada
© Canadian Centre on Substance Abuse 2012 Page 18
alongside recommendations involving alcohol pricing. Several decades of international research show that increasing or maintaining the overall price of alcohol through interventions such as excise taxes and indexing prices to inflation are among the most effective ways of reducing alcohol consumption across the population (Wagenaar, Salois & Komro, 2009). However, emerging research and practice now suggest it is possible to encourage safer alcohol use by also implementing targeted price policies that focus more directly on risky consumption (Meier, Purshouse & Brennan, 2009; Babor, Caetano, Casswell, Edwards, Giesbrecht, Graham, et al., 2010; Purshouse, Meier, Brennan, Taylor & Rafia, 2010; Thomas, 2012). Chief among these more targeted policies are pricing on alcohol content (i.e., volumetric pricing) to create price incentives for the production and consumption of beverages with lower alcohol content, and implementing minimum prices to remove inexpensive sources of alcohol often favoured by high-risk drinkers such as young adults who consume alcohol in heavy frequent patterns.
Table 4 depicts a comparison of approaches for characterizing alcohol-related risk in Canada. Under the conventional approach, which catagorizes drinkers based on those who drink in risky ways monthly or more often, 77% of current drinkers (16.6 million Canadians) were low-risk consumers and 23% (4.8 million) were high-risk drinkers in 2009–10. Under the second approach, which uses any instance of exceeding the daily upper consumption limits in Canada’s Low-Risk Alcohol Drinking Guidelines, 51% of current drinkers (10.9 million ) were low-risk drinkers, 41% (8.7 million) were moderate-risk drinkers and 8.5% were high-risk drinkers. The second approach presents a more accurate picture of risky drinking in Canada through the identification of the large number of moderate-risk drinkers who, along with the much smaller number of high-risk users, contribute substantially to overall harm and costs from alcohol.
The last column in Table 4 aligns the price policies recommended in the National Alcohol Strategy (i.e., indexation, volumetric pricing and minimum pricing) with the categories of drinkers for whom they are most likely to affect. Specifically, promoting Canada’s Low-Risk Alcohol Drinking Guidelines and indexing alcohol prices to inflation will promote safer alcohol use among low- and moderate-risk consumers. Indexation and pricing on alcohol content will be effective for assisting moderate-risk consumers to reduce consumption to lower-risk levels. Finally, minimum pricing, the most targeted of all, will promote safer alcohol use among high-risk consumers.

Levels and Patterns of Alcohol Use in Canada
© Canadian Centre on Substance Abuse 2012 Page 19
Table 4: Comparison of approaches for characterizing alcohol-related risk, Canada, 2009–10
Approach Definition of risky consumption
Rate among past-year drinkers
(2009–10)
Estimated population (2009–10)
Recommended response
Conventional approach
Low-risk drinking 5+ drinks/ occasion less than monthly
in past year 77.30% 16,589,042
High-risk drinking 5+ drinks/ occasion
monthly or more often in past year
22.70% 4,871,556
Proposed approach
Low-risk drinking No 5+ drinking
occasions in past year
50.95% 10,934,175
Promoting uptake of low-risk drinking
guidelines; indexing prices to inflation
Moderate-risk drinking
At least one 5+ drinking occasion
to less than weekly in past year
40.53% 8,697,980 Indexing prices to
inflation; pricing on alcohol content
High-risk drinking
5+ drinking occasions weekly or more often in
past year
8.52% 1,828,443 Pricing on alcohol content; minimum
prices
Source: Statistics Canada, 2011a.
Note: The 5+ drinks/occasion measure is used for both males and females because that is the way the data is collected by Statistics Canada. The rates for low-risk consumption would be substantially lower if the 4+ drink measure were used for females while the rates for moderate- and high-risk consumption would be higher. See Appendix B for more detail about the effects of lowering the threshold for women from 5+ drinks to 4+ drinks.
Conclusion 5.
While promoting awareness about Canada’s Low-Risk Alcohol Drinking Guidelines can help reduce risky alcohol consumption among certain aspects of the population, education and persuasion approaches alone will not be enough to create a culture of moderation in Canada (Babor et al., 2010). The National Alcohol Strategy includes three recommendations related to alcohol pricing to help reduce the harm and costs of alcohol: indexation, volumetric pricing and minimum pricing.
The next report in this series looks at the governmental and economic context of beverage alcohol sales in Canada by presenting, among other things, a comparison of the direct revenue and direct costs from alcohol at the provincial and territorial level. The last paper in this series summarizes the evidence on the effectiveness of pricing policies for controlling alcohol consumption, reviews research findings from several disiplines that are pointing toward volumetric and minimum pricing as promising targeted practices for addressing risky alcohol consumption, and presents detailed information on how these three alcohol pricing policies have been implemented in six provinces.

Levels and Patterns of Alcohol Use in Canada
© Canadian Centre on Substance Abuse 2012 Page 20
References
Adlaf, E., Begin, P., & Sawka, E. (Eds.). (2005). Canadian Addiction Survey (CAS): A national survey of Canadians’ use of alcohol and other drugs: Prevalence of use and related harms: Detailed report. Ottawa: Canadian Centre on Substance Abuse. Retrieved July 28, 2008, from http://www.ccsa.ca/2005%20CCSA%20Documents/ccsa-004028-2005.pdf.
Adlaf, E., Demers, A., & Gliksman, L. (Eds.) (2005). Canadian Campus Survey, 2004. Toronto: Centre for Addiction and Mental Health. Retrieved September 16, 2008 from http://www.camh.ca/en/research/research_areas/community_and_population_health/Documents/CCS_2004_report.pdf.
Astudillo, M., Kuntsche, S., Graham, K., & Gmel, G. (2010). The influence of drinking patterns, at individual and aggregate levels, on alcohol-related negative consequences. European Addiction Research, 16(3), 115–123.
Babor, T., Caetano, R., Casswell, S., Edwards, G., Giesbrecht, N., Graham, K., et al. (2010). Alcohol: No ordinary commodity: Research and public policy (2nd ed.). New York: Oxford University Press.
Butt, P., Beirness, D., Gliksman, L., Paradis, C., & Stockwell, T. (2010). Alcohol and health in Canada: A summary of evidence and guidelines for low-risk drinking. Ottawa: Canadian Centre on Substance Abuse.
Canadian Centre on Substance Abuse. (2012). Canada’s low-risk alcohol drinking guidelines. Retrieved March 6, 2012, from http://www.ccsa.ca/eng/priorities/alcohol/canada-low-risk-alcohol-drinking-guidelines/pages/default.aspx.
Centre for Addictions Research of BC. (2012). BC Alcohol and Other Drug Monitoring Project. Project website: http://carbc.ca/Default.aspx?tabid=402.
Cherpitel, C., Ye, Y., & Bond, J. (2004). Alcohol and injury: Multi-level analysis from the emergency room collaborative alcohol analysis project (ERCAAP). Alcohol and Alcoholism, 39(6), 552–558.
Dawson, D., Smith, S., Pickering, R., & Grant, B. (2012). An empirical approach to evaluating the validity of alternative low-risk drinking guidelines. Drug and Alcohol Review, 31(2), 141–150.
Gmel, G., Bissery, A., Gammeter, R., Givel, J., Calmes, J., Yersin, B., & Daeppen, J. (2006). Alcohol-attributable injuries in admissions to a Swiss emergency room: An analysis of the link between volume of drinking, drinking patterns and pre-attendance drinking. Alcoholism: Clinical and Experimental Research, 30(3), 501–509.
Health Canada. (2012a). Canadian Alcohol and Drug Use Monitoring Survey: Summary results for 2010. Retrieved March 6, 2012, from http://www.hc-sc.gc.ca/hc-ps/drugs-drogues/stat/_2010/summary-sommaire-eng.php.
Health Canada. (2012b). Canadian Alcohol and Drug Use Monitoring Survey: Summary results for 2009. Retrieved March 6, 2012, from http://www.hc-sc.gc.ca/hc-ps/drugs-drogues/stat/_2009/summary-sommaire-eng.php.
Health Canada. (2009). Canadian Alcohol and Drug Use Monitoring Survey: Summary results for 2008. Retrieved September 11 2009 from http://www.hc-sc.gc.ca/hc-ps/drugs-drogues/stat/_2008/summary-sommaire-eng.php.

Levels and Patterns of Alcohol Use in Canada
© Canadian Centre on Substance Abuse 2012 Page 21
Kuendig, H., Hasselberg, M., Laflamme, L., Daeppen, J., & Gmel, G. (2008). Acute alcohol consumption and injury: Risk associations and attributable fractions for different injury mechanisms. Journal of Studies on Alcohol and Drugs, 69(2), 218–226.
Meier, P., Purshouse, R., & Brennan, A. (2009). Policy options for alcohol price regulation: The importance of modelling population heterogeneity. Addiction, 105(3), 383–393.
National Alcohol Strategy Working Group. (2007). Toward a culture of moderation: Recommendations for a national alcohol strategy. Retrieved June 23, 2008, from http://www.nationalframework-cadrenational.ca/uploads/files/FINAL_NAS_EN_April3_07.pdf.
Poikolainen, K., Paljärvi, T., & Mäkelä, P. (2007). Alcohol and the prevention paradox: Serious harms and drinking patterns. Addiction, 102(4), 571–578.
Purshouse, R., Meier, P., Brennan, A., Taylor, K., & Rafia, R. (2010). Estimated effect of alcohol pricing policies on health and health economic outcomes in England: An epidemiological model. Lancet, 375(9723), 1355–1364.
Rehm, J., Baliunas, D., Brochu, S., Fischer, B., Gnam, W., Patra, J., Popova, S., Sarnocinska-Hart, A., & Taylor, B., in collaboration with Adlaf, E., Recel, M., & Single, E. (2006). The costs of substance abuse in Canada 2002. Ottawa: Canadian Centre on Substance Abuse.
Rose, G., Khaw, K., & Marmot, G. (2008). Rose’s strategy of preventative medicine. Oxford, UK: Oxford University Press.
Rossow, I,. & Romelsjö, A. (2008). The extent of the ‘prevention paradox’ in alcohol problems as a function of population drinking patterns. Addiction, 101(1), 84–90.
Spurling, M., & Vinson, D. (2005). Alcohol-related injuries: Evidence for the prevention paradox. Annals of Family Medicine, 3(1), 47–52.
Statistics Canada. (2012). Table 183-0019: Volume of sales of alcoholic beverages in litres of absolute alcohol and per capita 15 years and over, fiscal years ended March 31, annual. Retrieved March 5, 2012, from http://www5.statcan.gc.ca/cansim/a26?lang=eng&retrLang=eng&id=1830019&paSer=&pattern=&stByVal=2&p1=-1&p2=-1&tabMode=dataTable&csid=.
Statistics Canada. (2011a). Canadian Community Health Survey. Custom tables on alcohol use from 2003 to 2009–10 purchased from Statistics Canada and on file with author.
Statistics Canada. (2011b). The Daily: The control and sale of alcoholic beverages, fiscal year ending March 31, 2010. Retrieved September 16, 2011, from http://www.statcan.gc.ca/daily-quotidien/110420/dq110420a-eng.htm.
Statistics Canada. (2010). The Daily: The control and sale of alcoholic beverages, fiscal year ending March 31, 2009. Retrieved September 16, 2011, from http://www.statcan.gc.ca/daily-quotidien/100420/dq100420a-eng.htm.
Statistics Canada. (2009). The Daily: The control and sale of alcoholic beverages, fiscal year ending March 31, 2008. Retrieved September 16, 2009, from http://www.statcan.gc.ca/daily-quotidien/090420/t090420b2-eng.htm.
Statistics Canada. (2008 and previous annual reports). The control and sale of alcoholic beverages in Canada. Ottawa: Statistics Canada. Annual reports since 1997. Retrieved September 11, 2009, from http://www5.statcan.gc.ca/bsolc/olc-cel/olc-cel?catno=63-202-X&chropg=1&lang=eng.
Levels and Patterns of Alcohol Use in Canada
© Canadian Centre on Substance Abuse 2012 Page 22
Stockwell, T., Zhao, J., & Thomas, G. (2009). Should alcohol policies aim to reduce total alcohol consumption? New analyses of Canadian drinking patterns. Addiction Research and Theory, 17(2), 135–151.
Stockwell, T., Sturge, J., & Macdonald, S. (2005). Bulletin 1: Patterns of risky alcohol use in British Columbia: Results from the Canadian Addiction Survey (2004). Victoria, BC: Centre for Addictions Research of British Columbia. Retrieved January 10, 2011, from http://carbc.ca/Portals/0/PropertyAgent/558/Files/20/CARBCBulletin1.pdf.
Thomas, G. (2012). Saskatchewan’s alcohol price policies reduce consumption. CCSA Action News. Ottawa: Canadian Centre on Substance Abuse.
Thompson, K., Stockwell, T., & MacDonald, S. (2012). Is there a “low risk” drinking level for youth? The risk of acute harm as a function of quantity and frequency of drinking. Drug and Alcohol Review, 31(2), 184–193.
Wagenaar, A., Salois, M., & Komro, K. (2009). Effects of beverage alcohol price and tax levels on drinking: A meta-analysis of 1003 estimates from 112 studies. Addiction, 104(2), 179–190.
Weitzman, E., & Nelson, F. (2004). College binge drinking and the ‘prevention paradox’: Implications for prevention and harm reduction. Journal of Drug Education, 34(3) 247–266.
Yukon Bureau of Statistics. (2000). Alcohol sales in the Yukon. RetrievedSeptember 7, 2010, from http://www.eco.gov.yk.ca/pdf/alcohol.pdf.

Levels and Patterns of Alcohol Use in Canada
© Canadian Centre on Substance Abuse 2012 Page 23
Appendix A: Conversion Factors for Female Drinkers from 5+ Drinks/Occasion to 4+ Drinks/Occasion
Data from four national surveys were used to compare the percentage of current (past year) drinking females who said they drank four or more drinks per occasion once a month or more often in the past year and those who said they drank five or more drinks per occasion to assess the potential effect on estimates of prevalence of risky drinking of females. Results are depicted in Table A1 below: Table A1. Comparison of percentage of past year drinking females reporting 4+ drinks/occasion and those reporting 5+ drinks/occasion once a month or more often in past year, Canada, 2004, 2008, 2009, 2010
Age CADUMS 2010 CADUMS 2009 CADUMS 2008 CAS 2004 Average %
Diff 4+ 5+ % Diff 4+ 5+ % Diff 4+ 5+ % Diff 4+ 5+ % Diff
Underage 29.3 (±7.2)
17.3 (±6.3) 69.36 24.0
(±12.3) 12.5
(±6.9) 92.00 30.0 (±11.6)
24.5 (±11.6) 22.45 21.1
(±6.9) 16.4
(±6.3) 28.66 53.12
Young Adult
37.1 (±5.0)
23.0 (±4.0) 61.30 41.6
(±9.8) 34.0
(±9.6) 22.35 43.7 (±8.9)
29.3 (±7.8) 49.15 46.4
(±6.8) 40.7
(±6.7) 14.00 36.70
25–34 22.6 (±6.0)
13.4 (±3.1) 68.66 19.4
(±6.2) 14.1
(±5.5) 37.59 22.7 (±4.6)
14.4 (±3.7) 57.64 21.3
(±4.1) 15.8
(±3.7) 34.81 49.67
35–44 19.2 (±4.5)
8.4 (±3.4) 128.57 18.1
(±4.1) 12.0
(±3.5) 50.83 14.9 (±3.5)
7.8 (±2.6) 91.03 17.6
(±3.4) 13.1
(±3.1) 34.35 76.20
45–54 19.9 (±4.3)
11.0 (±2.5) 80.91 11.4
(±3.2) 7.1
(±2.6) 60.56 15.7 (±3.5)
7.9 (±2.6) 98.73 14.2
(±3.8) 9.7
(±3.3) 46.39 71.65
55–64 11.5 (±3.2)
5.8 (±0.9) 98.28 9.0
(±2.9) 6.1
(±2.5) 47.54 11.7 (±3.2)
4.7 (±2.1) 148.94 8.5
(±3.3) 4.8
(±2.7) 77.08 92.96
Females age 25+
16.3 (±2.0)
8.2 (±1.5) 98.78 12.9
(±1.8) 8.5
(±1.6) 51.76 14.6 (±1.6)
7.6 (±1.2) 92.11 14.1
(±1.7) 9.8
(±1.4) 43.88 71.63
Females age 15+
18.9 (±1.8)
10.1 (±1.4) 87.13 16.8
(±2.1) 11.6
(±1.8) 44.83 18.7 (±1.9)
11.0 (±1.6) 70.00 18.5
(±1.7) 14.0
(±1.5) 32.14 58.52
Note: All estimates (±95% CI) based on the weighted sample: 4+ and 5+ rates refer to proportion of sample in that age group reporting drinking 4+ or 5+ drinks per occasion at least monthly. † % difference = (rate 4+ - rate 5+) x 100 / rate 5+.
Sources: Micro-data files for the Canadian Alcohol and Drug Use Monitoring Survey, 2008, 2009, 2010; Canadian Addiction Survey, 2004. Analysis by the Centre for Addictions Research of BC.
Notes: Underage drinkers are respondents age 15–17 in Alberta, Manitoba and Quebec, and age 15–18 in the rest of Canada. Young adult drinkers are respondents age 18–24 in Alberta, Manitoba and Quebec, and age 19–24 in the rest of Canada. Results for females age 65+ were suppressed due to lack of precision in estimates.
Method: Sample consisted of females who drank at least once in the past year. Data elements used: (1) females who reported 4+ drinks/occasion monthly or more often in the past year based on the question, “how often in the past 12 months have you had 4 or more drinks on one occasion?” (alc5f or AHEAVYMN in CADUMS and alc5a or AHEAVYMN in 2004 CAS); and (2) females who reported 5+ drinks/occasion monthly or more often in the past year basd on the question, “how often in the past 12 months have you had five or more drinks on one occasion?” (alc5 or FIVEMN in CADUMS and 2004 CAS). All estimates were based on the weighted sample and were adjusted for design effects.

Levels and Patterns of Alcohol Use in Canada
© Canadian Centre on Substance Abuse 2012
Page 24
Appendix B: Provincial Comparisons of Per Capita Alcohol Consumption
Table B1. Differences in per capita pure alcohol consumption in litres between provinces/territories and the whole of Canada, 1998–99 to 2009–10
Province/territory Difference 95% CI P-T Test Yukon 4.97 4.81 5.13 *** Alberta 1.15 0.99 1.31 *** Newfoundland and Labrador 0.58 0.41 0.74 *** Northwest Territories and Nunavut 0.48 0.32 0.64 *** British Columbia 0.24 0.08 0.40 ** Quebec 0.02 -0.14 0.18 Nova Scotia -0.16 -0.32 0.00 Prince Edward Island -0.23 -0.39 -0.07 ** Ontario -0.24 -0.40 -0.08 ** Manitoba -0.30 -0.46 -0.14 *** Saskatchewan -0.58 -0.74 -0.42 *** New Brunswick -1.03 -1.19 -0.87 *** Canada 0.00 T test: *P < 0.05 **P < 0.01 ***P < 0.001.
Source: Statistics Canada at http://cansim2.statcan.gc.ca/cgi-win/cnsmcgi.pgm. Analysis by the Centre for Addictions Research of BC.
ANOVA analysis shows significantly higher alcohol consumption in the Yukon, the Northwest Territories, Nunavut, British Columbia, Alberta, and Newfoundland and Labrador than the national average. Analysis shows a significantly lower consumption in Prince Edward Island, New Brunswick, Ontario, Manitoba and Saskatchewan than the rest of the country.
Adult Canadians aged 15 years and older in the Yukon consumed, on average, 4.97 litres more alcohol than people in the rest of the country. People in Alberta, Newfoundland and Labrador, the Northwest Territories and Nunavut, and British Columbia consumed 1.15, 0.58, 0.48 and 0.24 litres more alcohol respectively than the national average.
Per capita alcohol consumption in Prince Edward Island, Ontario, Manitoba, Saskatchewan and New Brunswick was 0.23, 0.24, 0.30, 0.58 and 1.03 litres lower respectively than the national average. Per capita alcohol consumption was 0.02 litres higher in Quebec and 0.16 litres lower in Nova Scotia than the national average, but these differences were not statistically significant.

Levels and Patterns of Alcohol Use in Canada
© Canadian Centre on Substance Abuse 2012
Page 25
Appendix C: Evidence for the Prevention Paradox in Canada
It is possible to characterize the distribution of alcohol-related risk across the Canadian population by combining usual quantity and frequency data with information on self-reported harms from one’s own drinking in the past year.22 Table C1 depicts a typology of alcohol use derived from this approach using data from the 2009 Canadian Alcohol and Drug Use Monitoring Survey. Table C1. Distribution of alcohol-related risk, general population age 15+, Canada, 2009
Drinking status Risk category Usual drinking pattern
Estimated number of people (2009)
Adjusted odds ratio of reporting at least one
significant harm to self from one’s own drinking
in past year23 Non-current drinkers No risk No alcohol use in past
year 6,081,000 n/a
Light-infrequent drinkers
Low risk
Less than once a week, less than 5
drinks (4 for women) when alcohol is used
8,915,000 1.0 (reference group)
Light-frequent and heavy-infrequent drinkers
Moderate risk
Once a week or more often, less than 5
drinks (4 for women) when alcohol is used
Less than once a week, 5 drinks or
more (4 for women) when alcohol is used
8,961,000
2.64 (2.30 for light-frequent
and 4.87 for heavy-infrequent drinkers)
Heavy-frequent drinkers High risk
Once a week or more often, 5 drinks or
more (4 for women) when alcohol is used
1,623,000 11.59
Source: Canadian Alcohol and Drug Use Monitoring Survey, 2009.
From these data it appears there are about nine million moderate-risk drinkers who have an average relative risk of reporting at least one significant harm from alcohol from their own drinking in the past year of 2.64, and 1.6 million high-risk drinkers who have a relative risk of reporting a major harm of 11.59. To compare the total risk of alcohol-related harm among these two groups, simply multiple the number of drinkers in each category by their relative risk of harm:
22 Alcohol-related harms fall into eight domains in the Canadian Alcohol and Drug Use Monitoring Survey: physical health; friendship and social life; financial position; home life or marriage; work, studies or employment opportunities; legal problems; difficulty learning; and housing problems. The analyses presented in Table C1 are based on individuals reporting at least one harm to self from one’s own drinking in the past year in any of these domains.
23 This column conveys that drinkers in the light-frequent category were 2.3 times as likely to report at least one significant harm to self from one’s own drinking in the past year than light-infrequent drinkers (the reference group). Heavy-infrequent drinkers were nearly five times as likely and heavy-frequent drinkers were almost 12 times as likely to report harm than the reference group.

Levels and Patterns of Alcohol Use in Canada
© Canadian Centre on Substance Abuse 2012
Page 26
Moderate risk: 8.96 x 2.64 = 23.6 High risk: 1.62 x 11.59 = 18.8
These data indicate that light-frequent and heavy-infrequent drinkers (here labelled moderate-risk drinkers) account for approximately 56% of the self-reported harm from alcohol. This provides preliminary validation that the prevention paradox applies to beverage alcohol in Canada, as has been found in other countries and populations with similar distributions of alcohol-related risk (Weitzman & Nelson, 2004; Spurling & Vinson, 2005; Rossow & Romelsjö, 2006; Poikolainen, Paljärvi & Mäkelä, 2007; Kuendig, Hasselberg, Laflamme, Dappen & Gmel, 2008).


![Cirrhosis MEN NOT WOMENrcdhu.com/.../CCSA-Chronic-Illness...Infographic.pdfTitle: Chronic Illness and Alcohol [Infographic] Author: Canadian Centre on Substance Abuse Subject: Information](https://img.pdfslide.net/doc/110x75/5f6a9cff6a68e134816a650a/cirrhosis-men-not-title-chronic-illness-and-alcohol-infographic-author-canadian.jpg)