Embed Size (px)
Citation preview
© Windfall Geotek Inc • All Rights Reserved
CSE
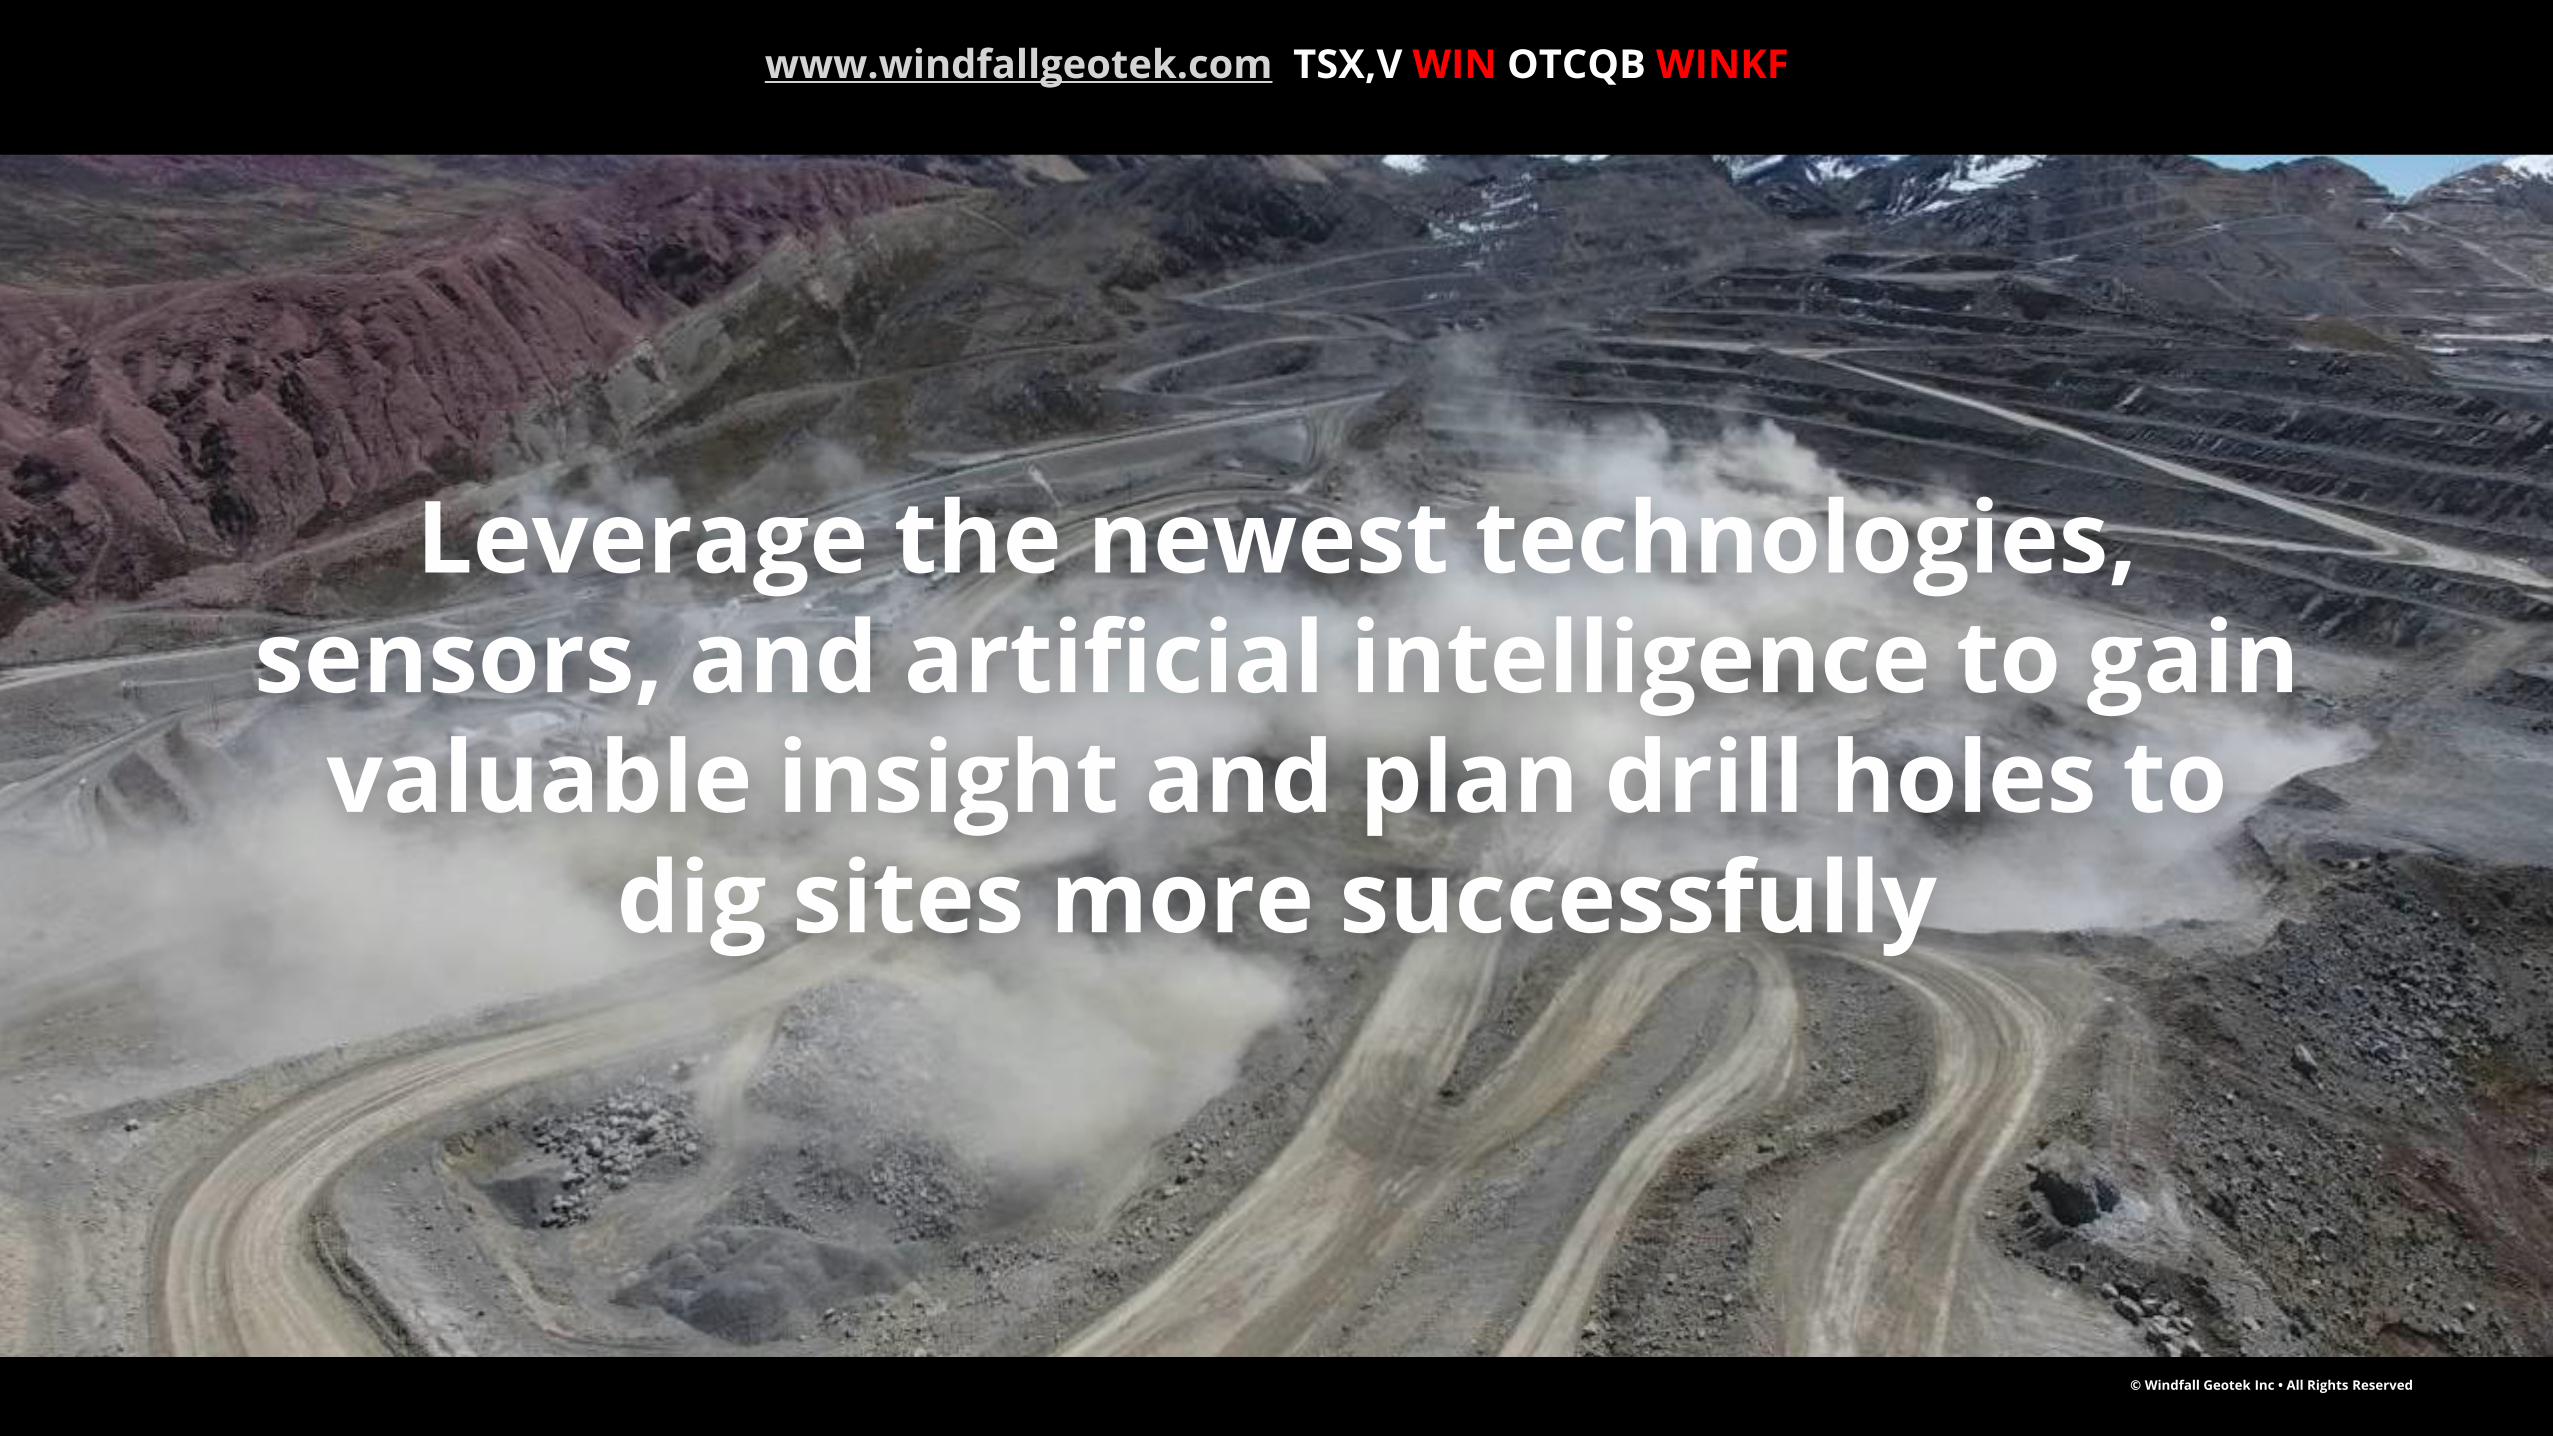
Leverage the newest technologies, sensors, and artificial intelligence to gain
valuable insight and plan drill holes to dig sites more successfully
www.windfallgeotek.com TSX,V WIN OTCQB WINKF
© Windfall Geotek Inc • All Rights Reserved
CSE
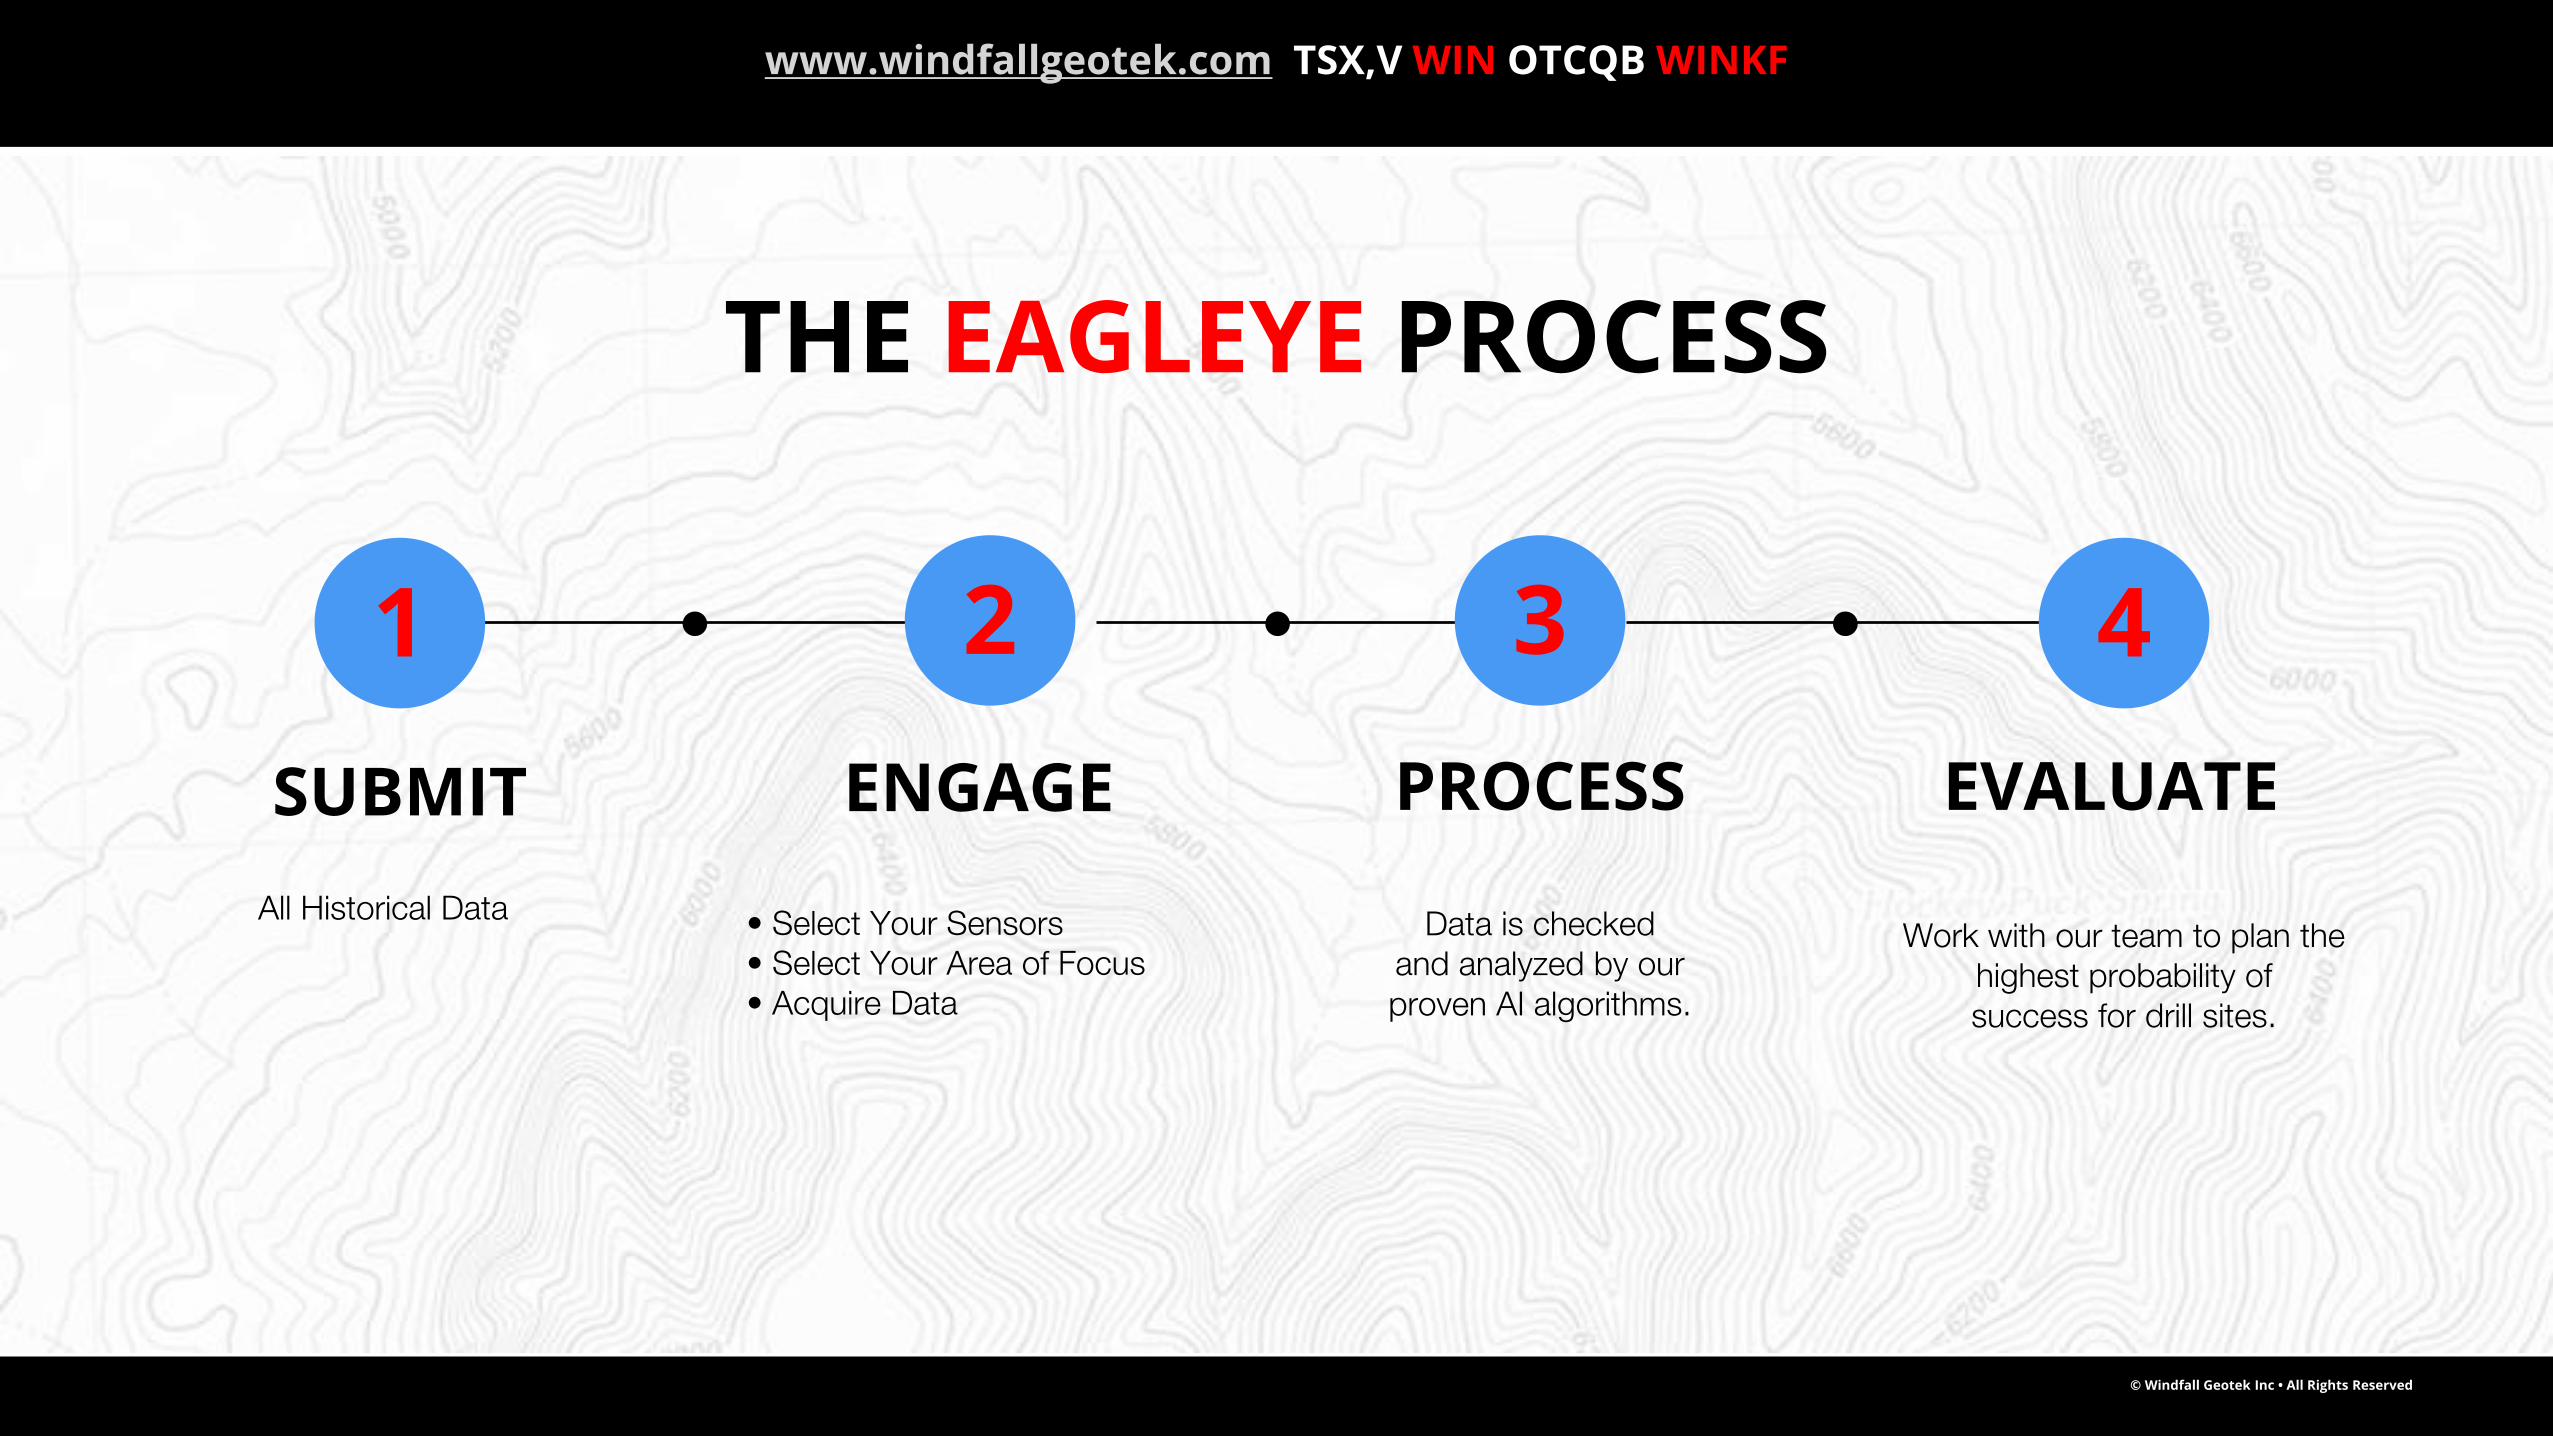
1 2 3 4
SUBMIT EVALUATEPROCESSENGAGE
THE EAGLEYE PROCESS
Work with our team to plan the highest probability of success for drill sites.
Data is checked and analyzed by our proven AI algorithms.
All Historical Data • Select Your Sensors• Select Your Area of Focus• Acquire Data
www.windfallgeotek.com TSX,V WIN OTCQB WINKF
© Windfall Geotek Inc • All Rights Reserved
CSE
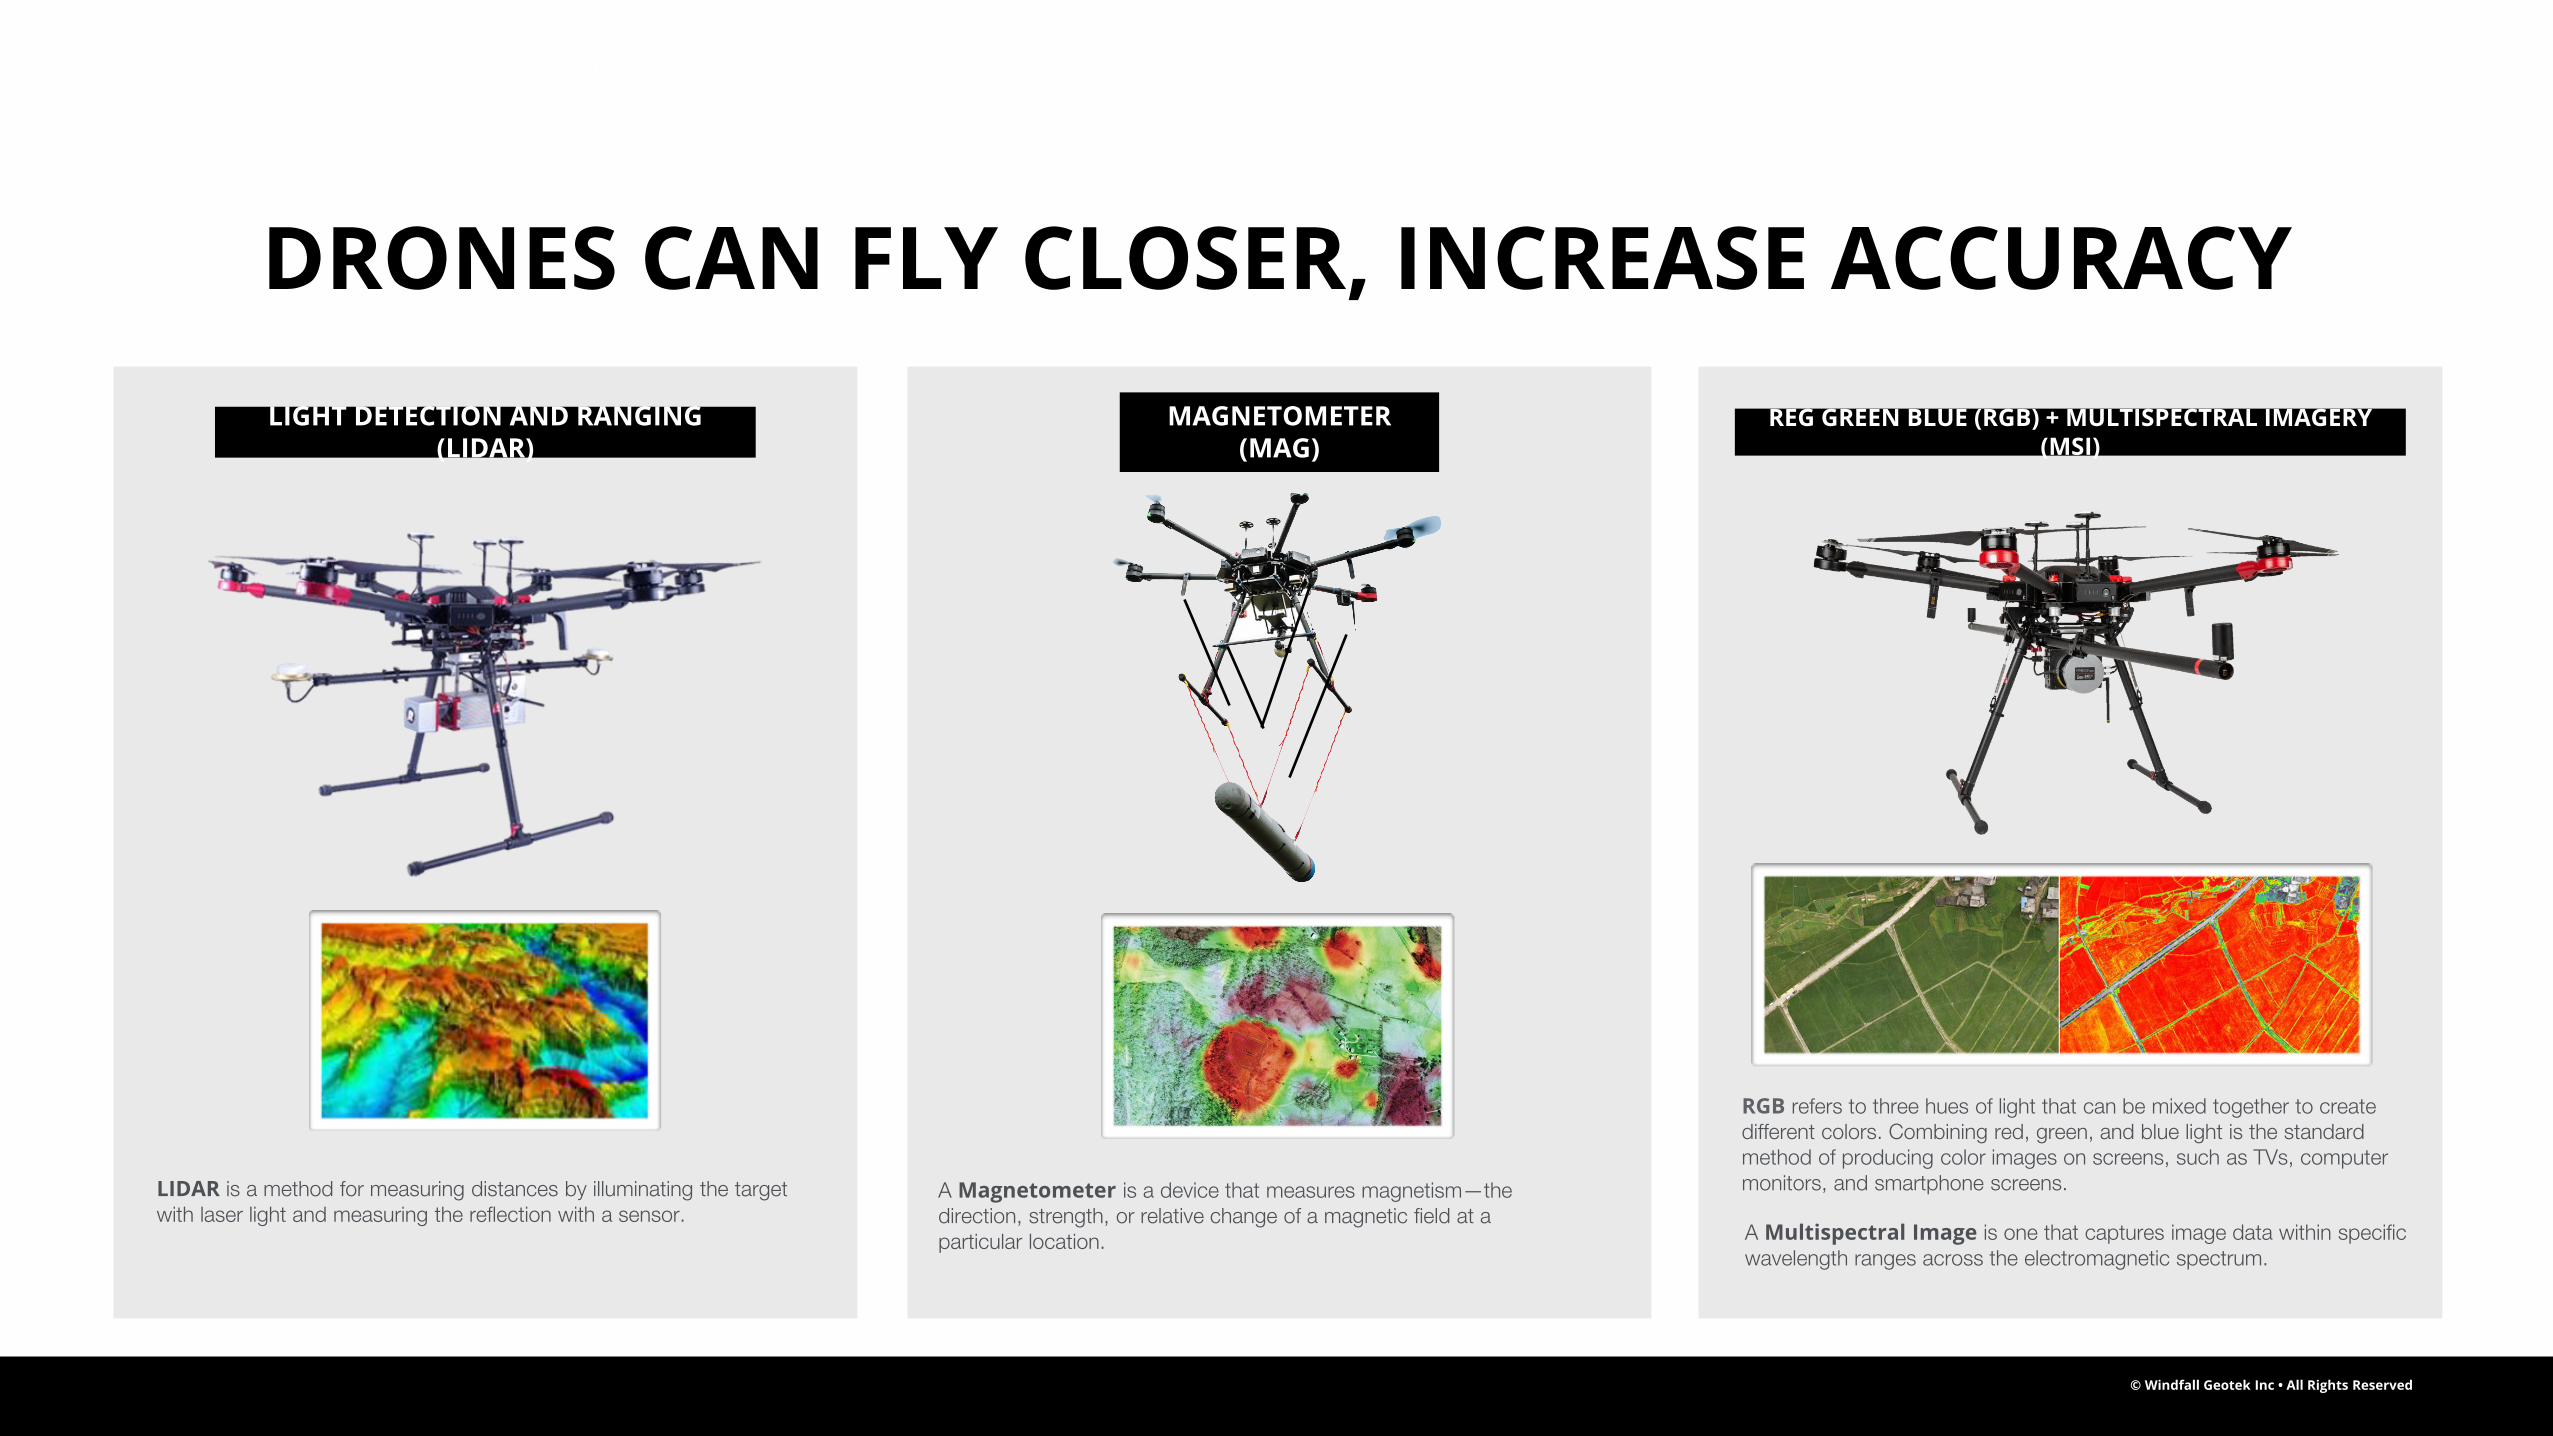
RGB refers to three hues of light that can be mixed together to create different colors. Combining red, green, and blue light is the standard method of producing color images on screens, such as TVs, computer monitors, and smartphone screens.
REG GREEN BLUE (RGB) + MULTISPECTRAL IMAGERY (MSI)
MAGNETOMETER (MAG)
A Magnetometer is a device that measures magnetism—the direction, strength, or relative change of a magnetic field at a particular location. A Multispectral Image is one that captures image data within specific
wavelength ranges across the electromagnetic spectrum.
DRONES CAN FLY CLOSER, INCREASE ACCURACY
LIDAR is a method for measuring distances by illuminating the target with laser light and measuring the reflection with a sensor.
LIGHT DETECTION AND RANGING (LIDAR)
© Windfall Geotek Inc • All Rights Reserved
CSE
Professional and reputable technology
matched with geospatial expertswith decades of experience
ready for deployment
www.windfallgeotek.com TSX,V WIN OTCQB WINKF
© Windfall Geotek Inc • All Rights Reserved
CSE
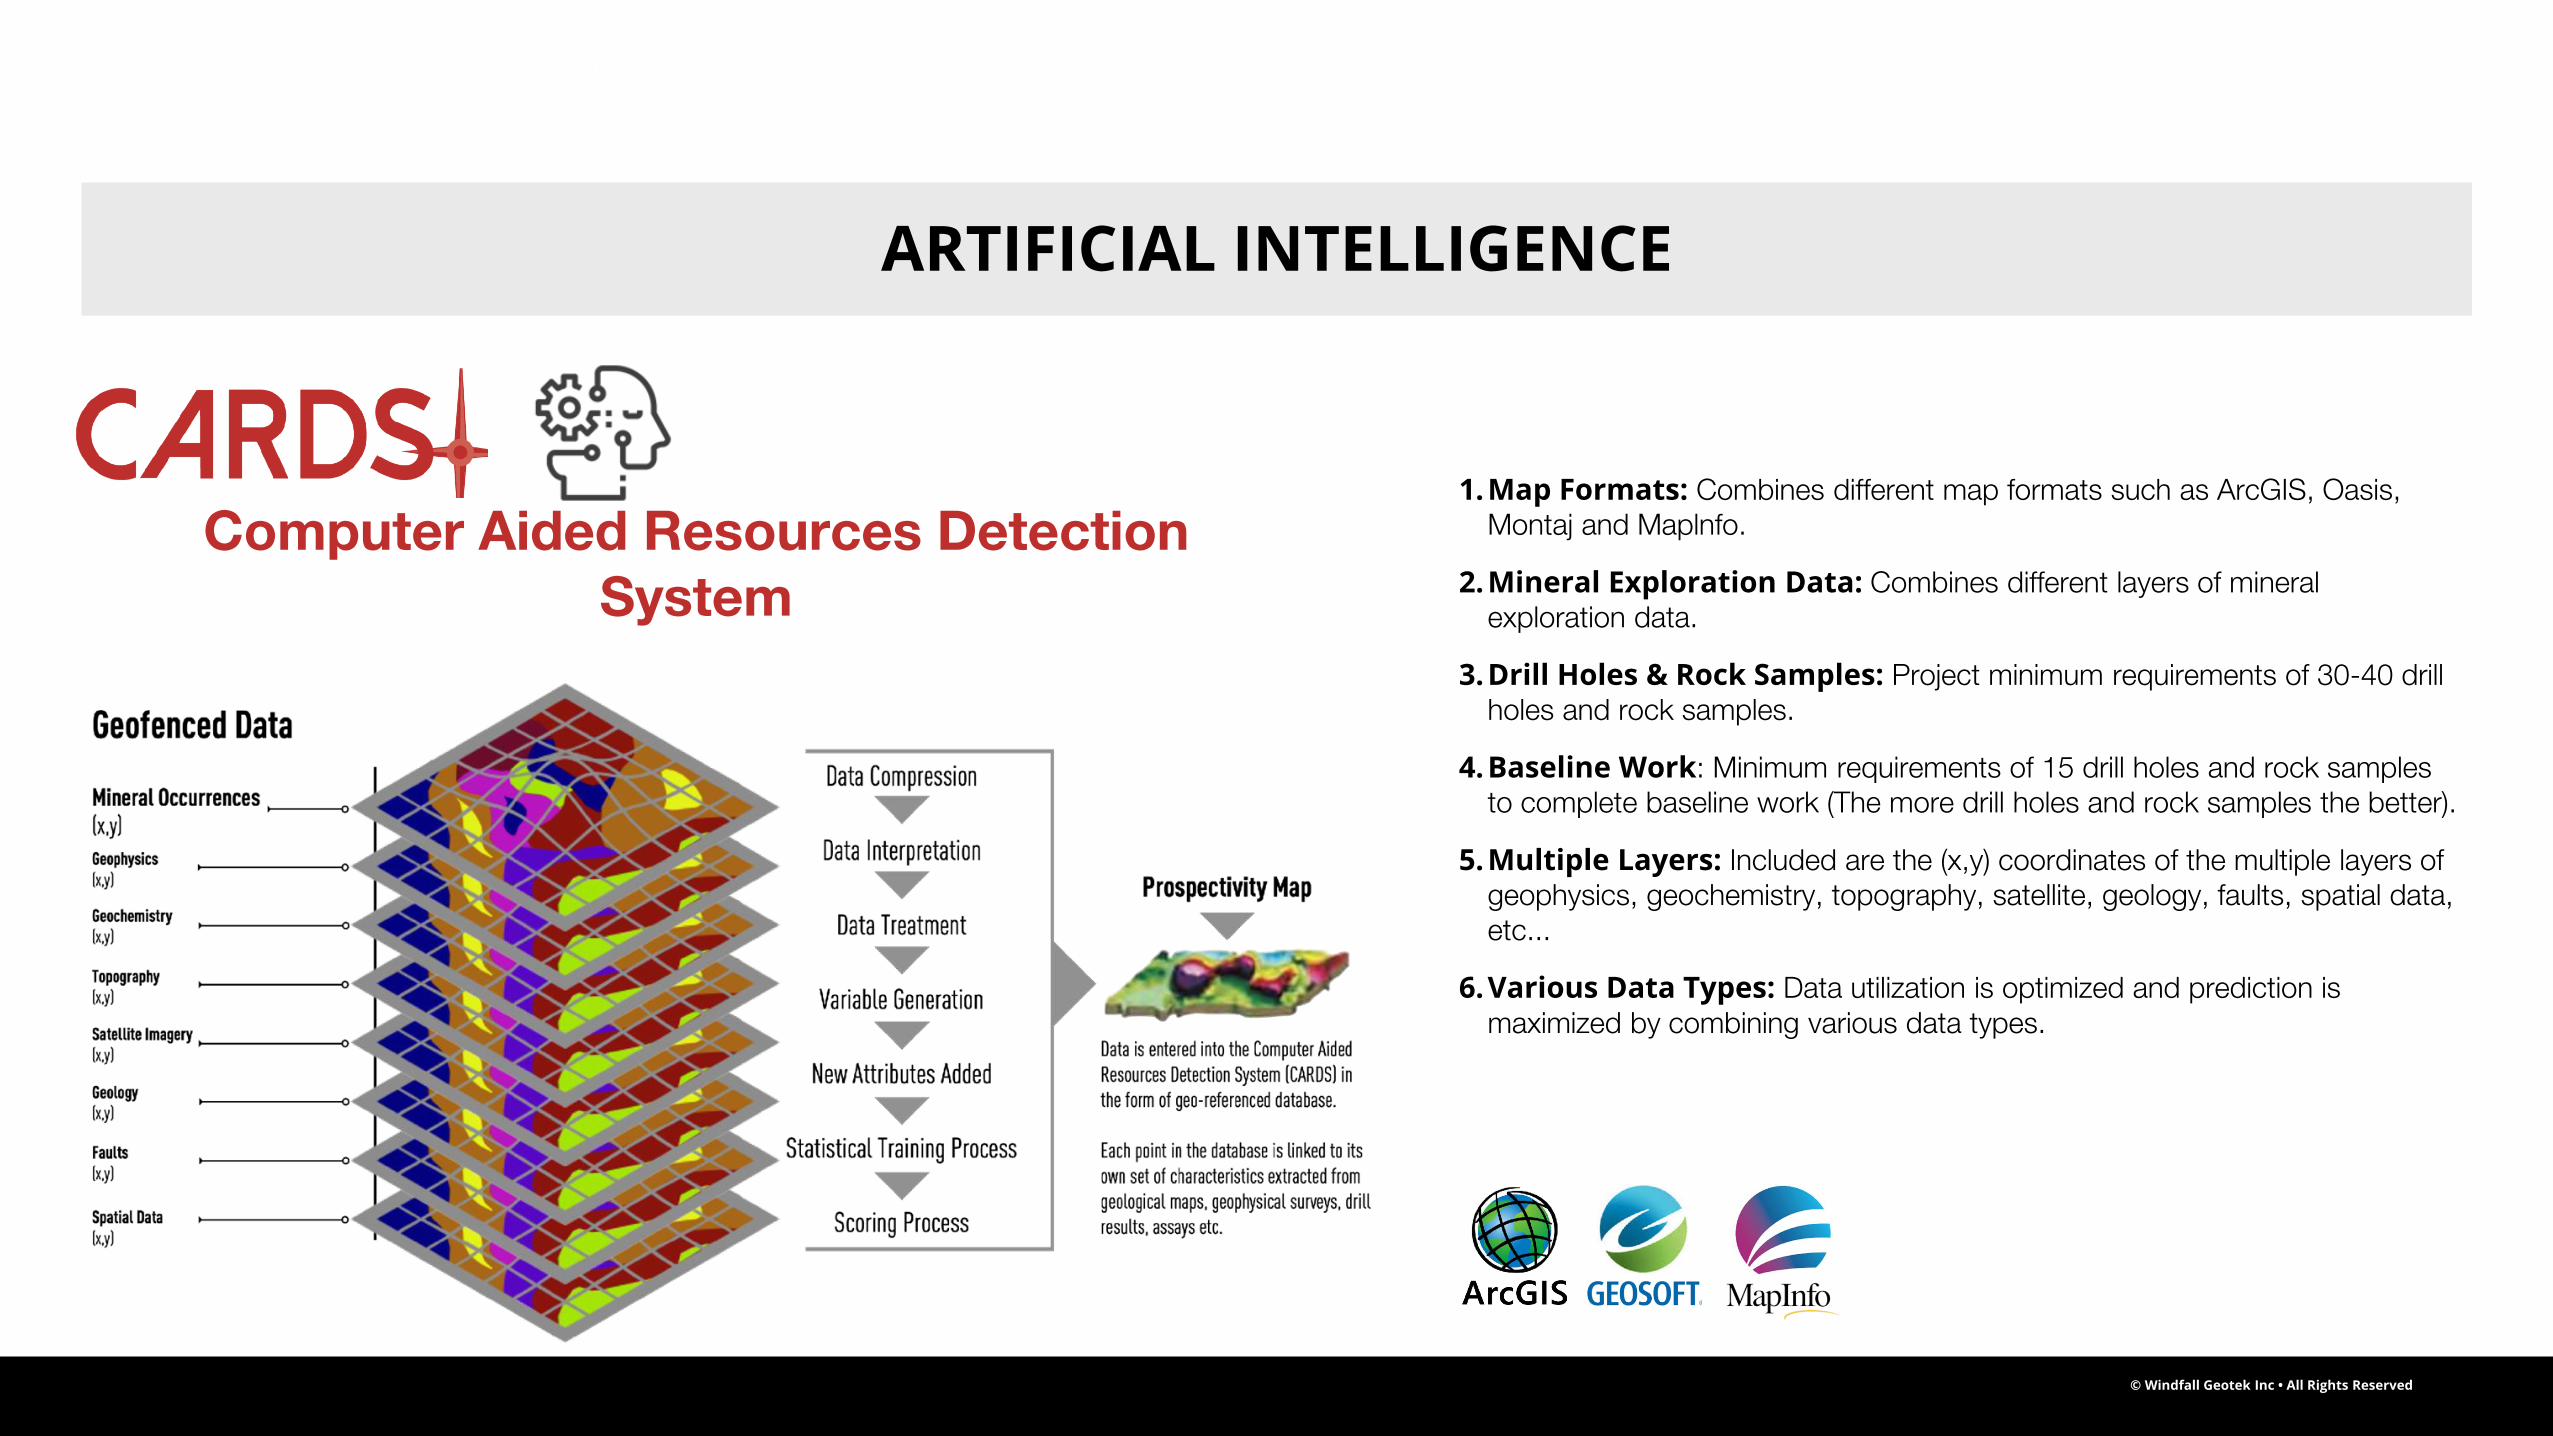
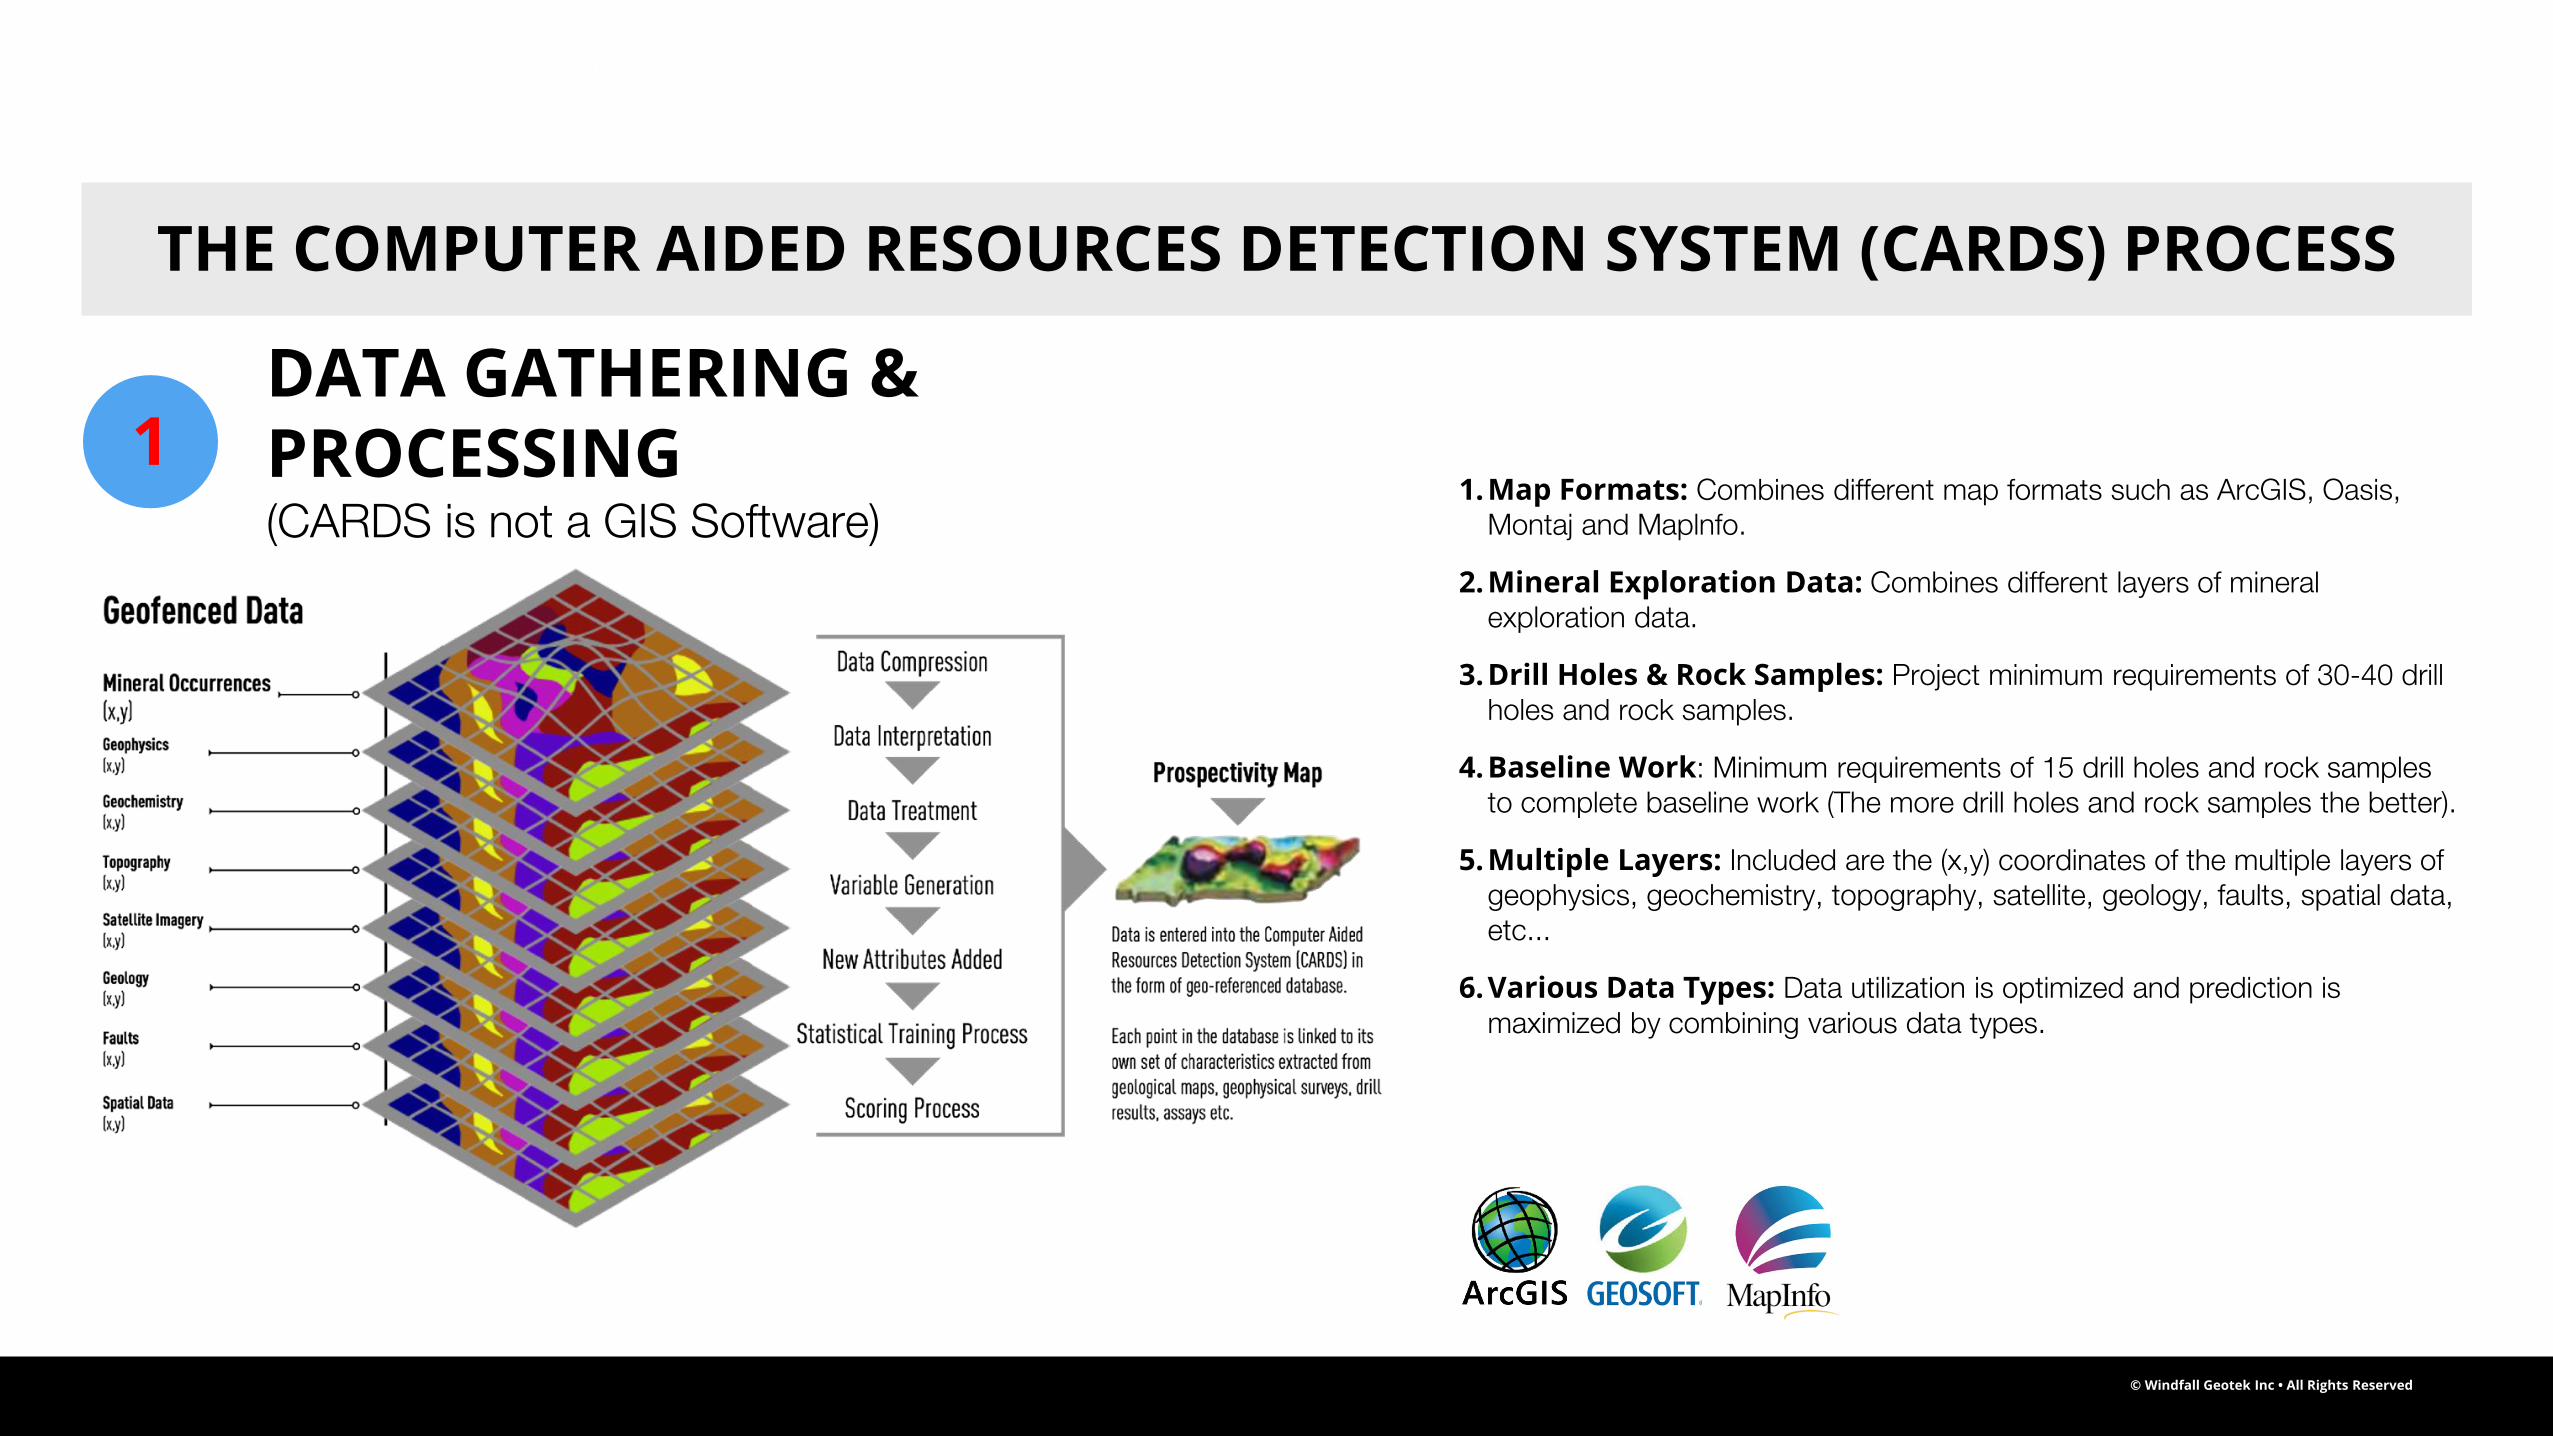
1. Map Formats: Combines different map formats such as ArcGIS, Oasis, Montaj and Maplnfo.
2. Mineral Exploration Data: Combines different layers of mineral exploration data.
3. Drill Holes & Rock Samples: Project minimum requirements of 30-40 drill holes and rock samples.
4. Baseline Work: Minimum requirements of 15 drill holes and rock samples to complete baseline work (The more drill holes and rock samples the better).
5. Multiple Layers: Included are the (x,y) coordinates of the multiple layers of geophysics, geochemistry, topography, satellite, geology, faults, spatial data, etc...
6. Various Data Types: Data utilization is optimized and prediction is maximized by combining various data types.
ARTIFICIAL INTELLIGENCE
Computer Aided Resources Detection System
© Windfall Geotek Inc • All Rights Reserved
CSE
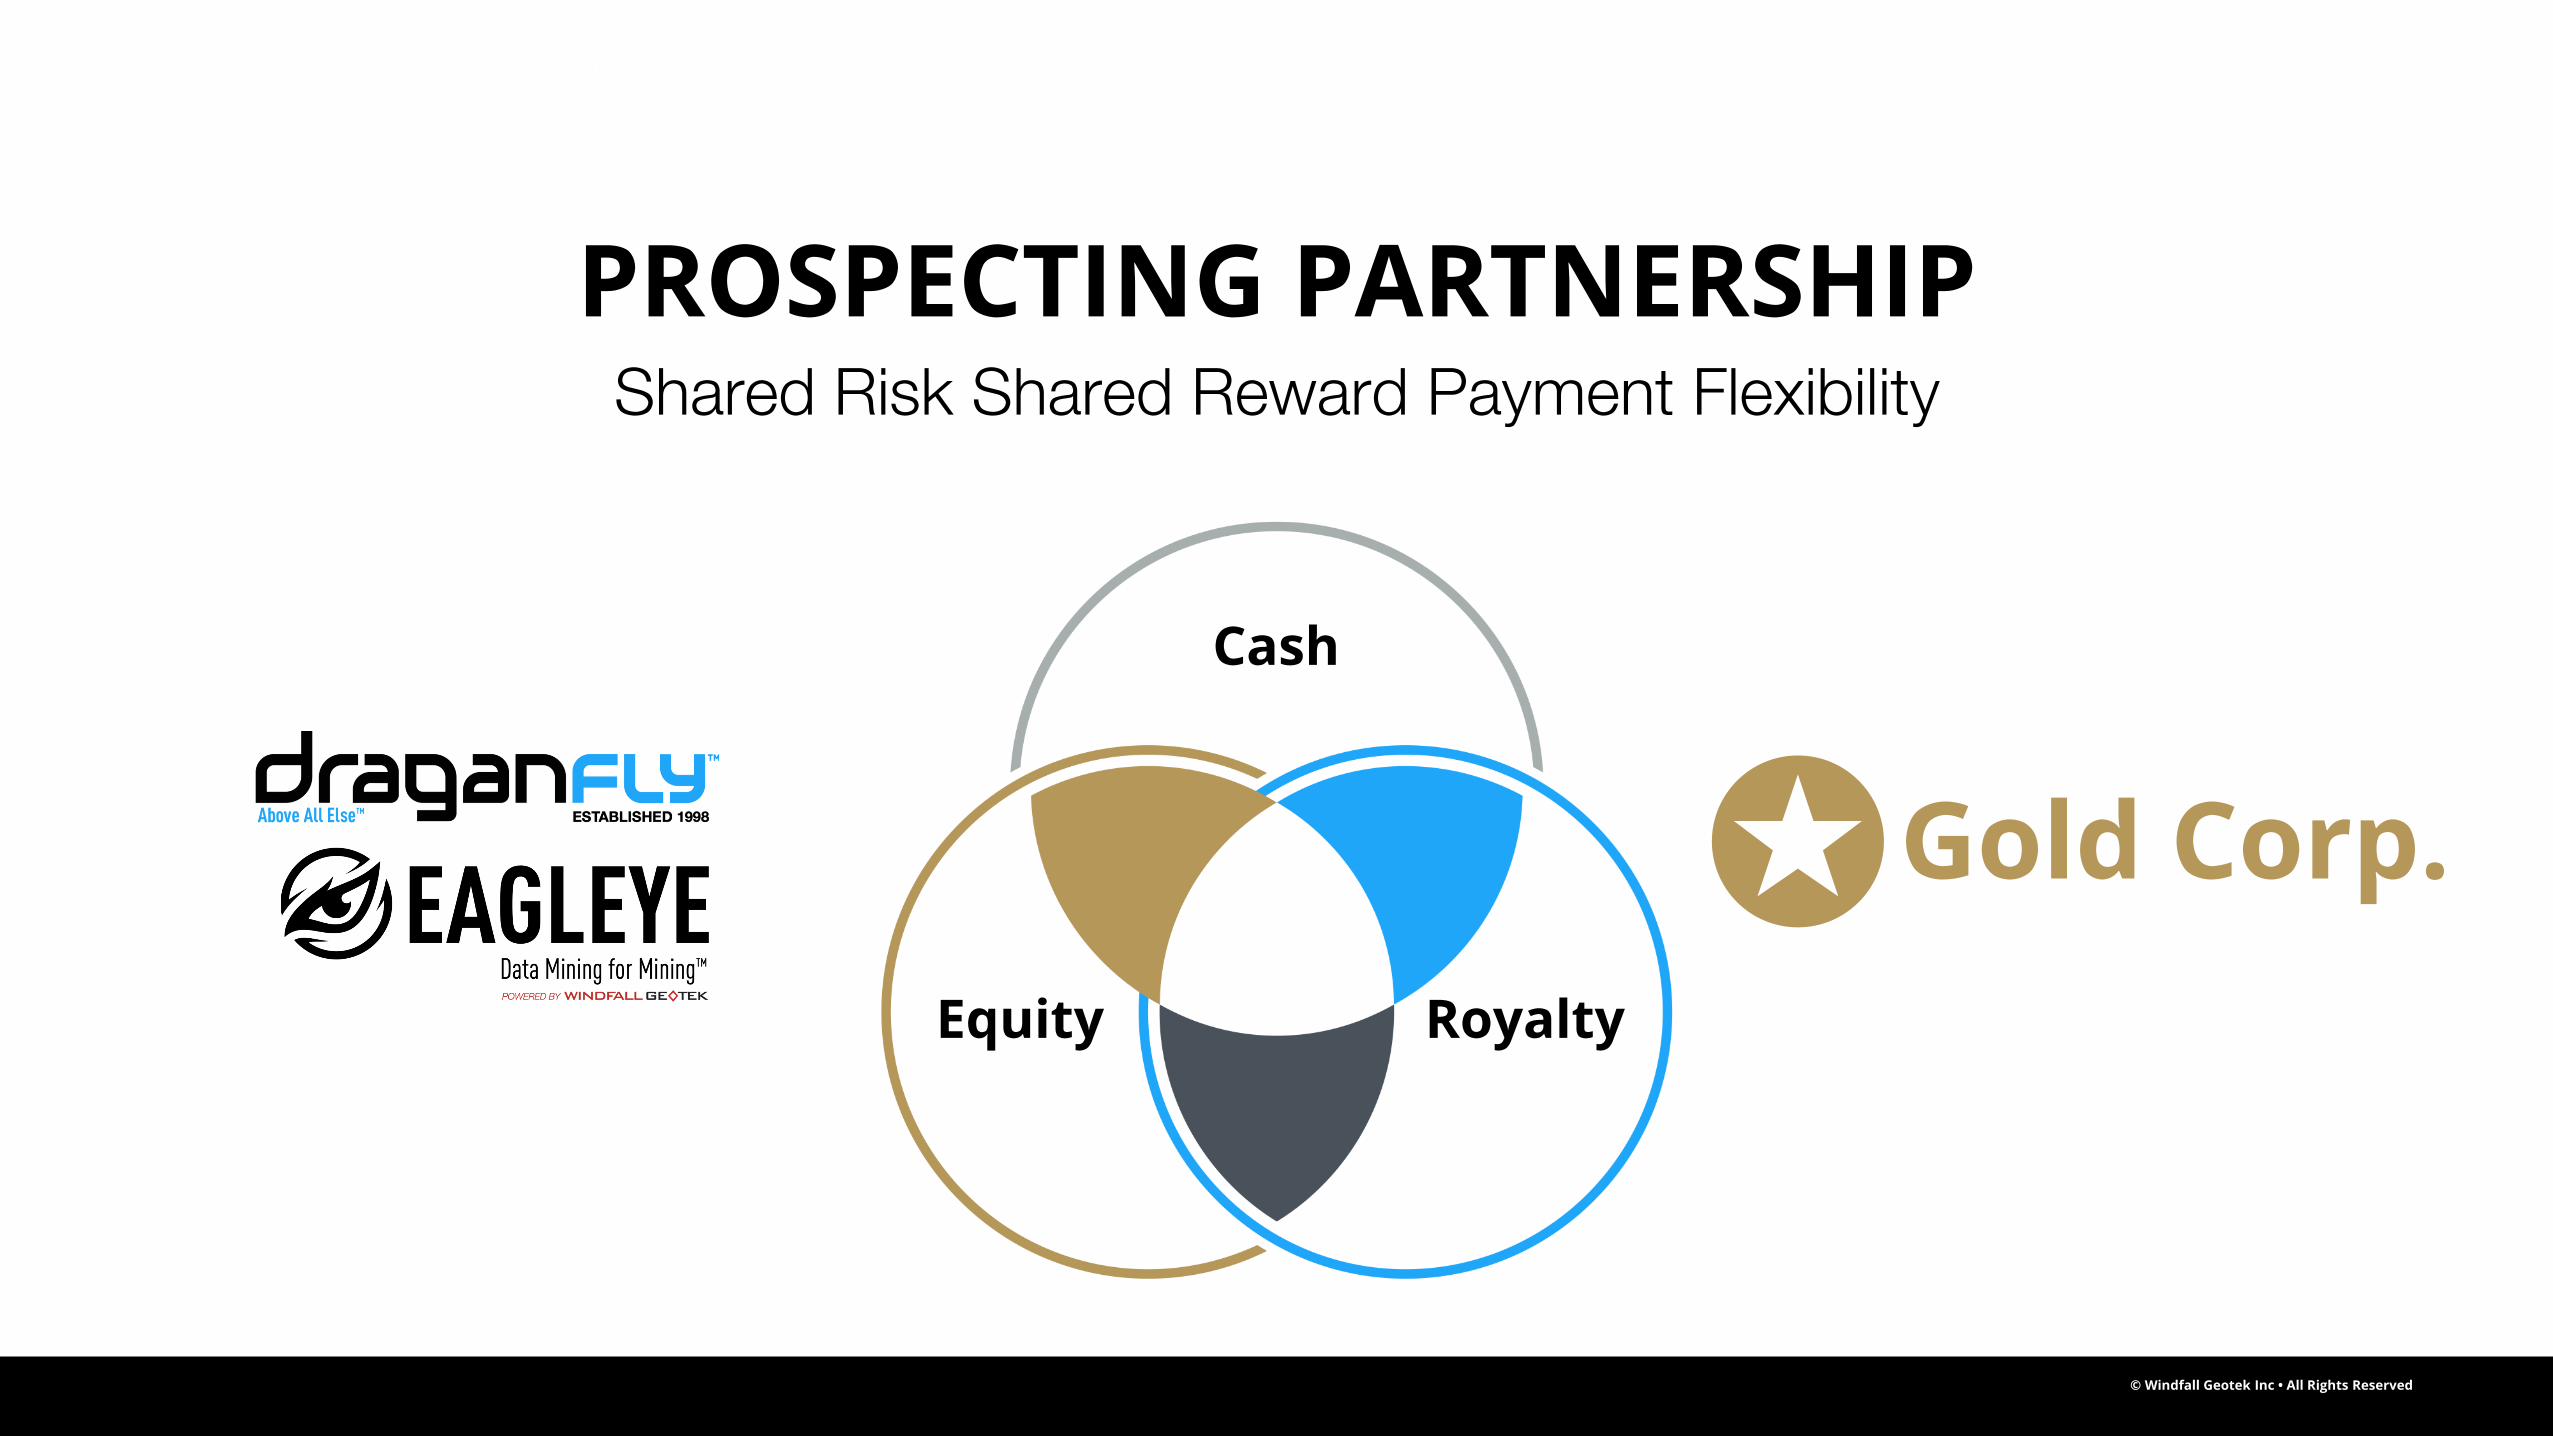
Shared Risk Shared Reward Payment Flexibility
PROSPECTING PARTNERSHIP
Cash
Equity Royalty
Gold Corp.
© Windfall Geotek Inc • All Rights Reserved
CSE
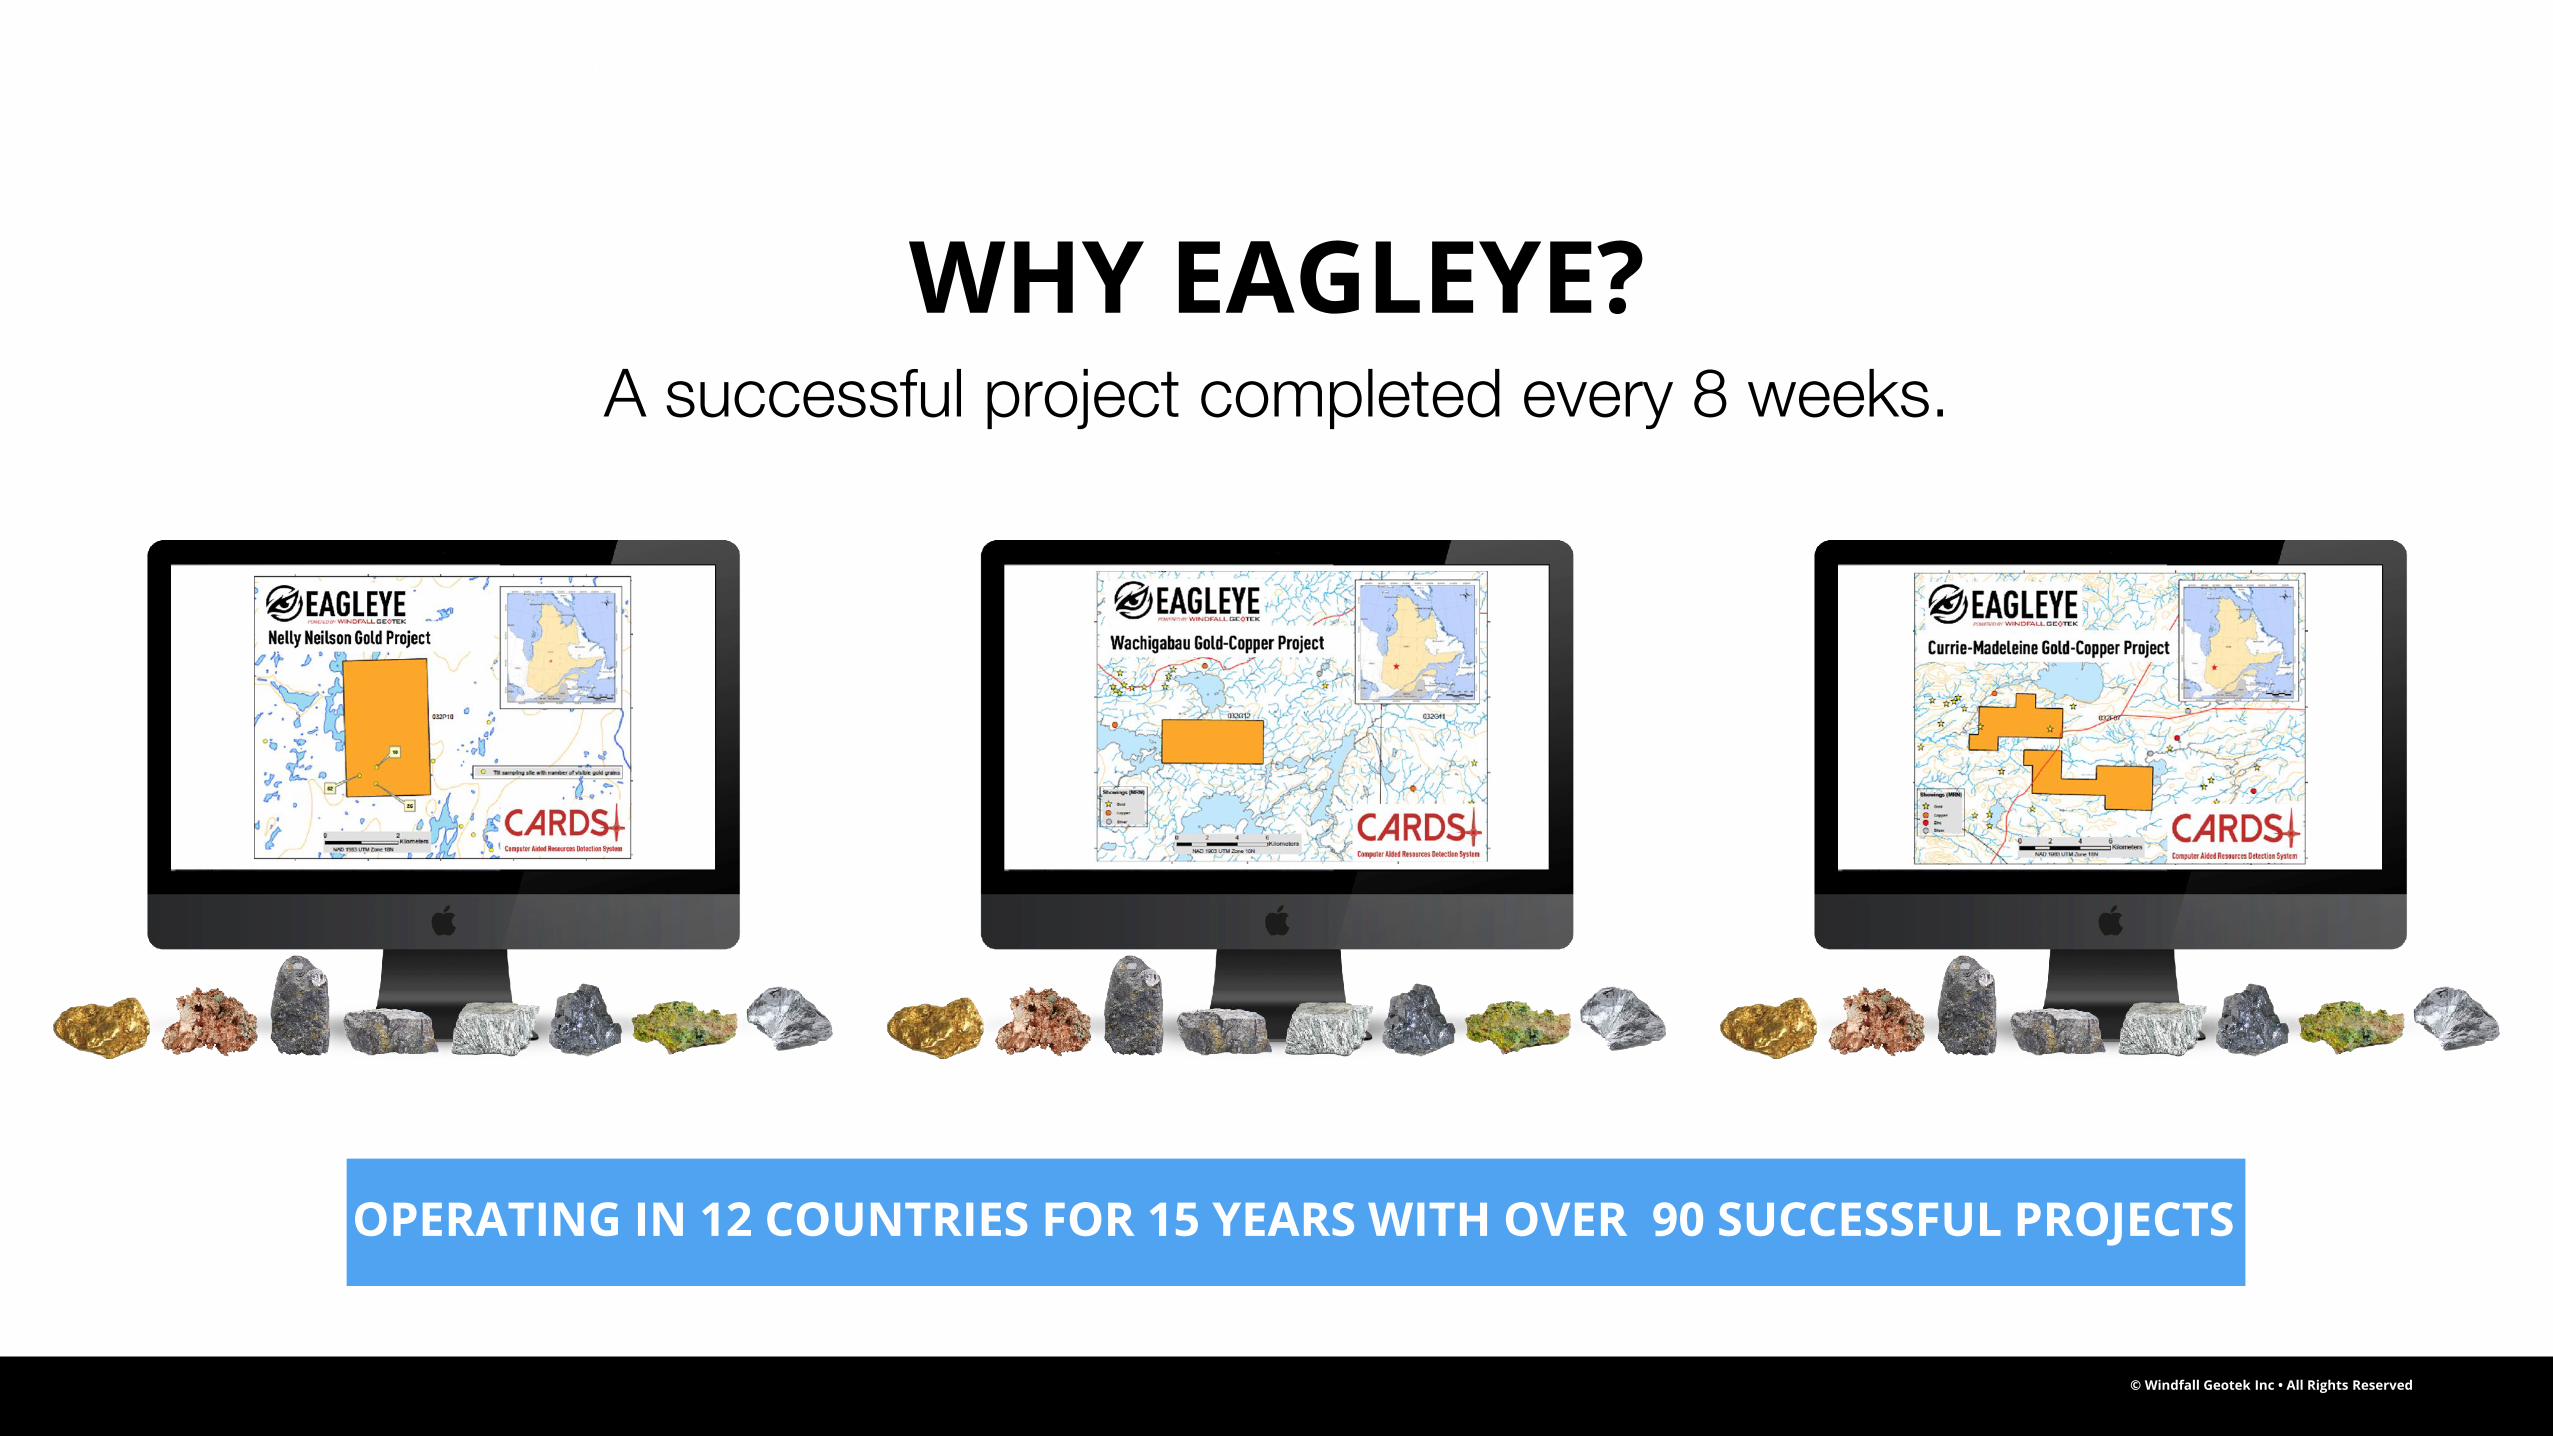
OPERATING IN 12 COUNTRIES FOR 15 YEARS WITH OVER 90 SUCCESSFUL PROJECTS
A successful project completed every 8 weeks.
WHY EAGLEYE?
© Windfall Geotek Inc • All Rights Reserved
CSE
© Windfall Geotek Inc • All Rights Reserved
CSE
1. Map Formats: Combines different map formats such as ArcGIS, Oasis, Montaj and Maplnfo.
2. Mineral Exploration Data: Combines different layers of mineral exploration data.
3. Drill Holes & Rock Samples: Project minimum requirements of 30-40 drill holes and rock samples.
4. Baseline Work: Minimum requirements of 15 drill holes and rock samples to complete baseline work (The more drill holes and rock samples the better).
5. Multiple Layers: Included are the (x,y) coordinates of the multiple layers of geophysics, geochemistry, topography, satellite, geology, faults, spatial data, etc...
6. Various Data Types: Data utilization is optimized and prediction is maximized by combining various data types.
DATA GATHERING & PROCESSING(CARDS is not a GIS Software)
THE COMPUTER AIDED RESOURCES DETECTION SYSTEM (CARDS) PROCESS
1
© Windfall Geotek Inc • All Rights Reserved
CSE
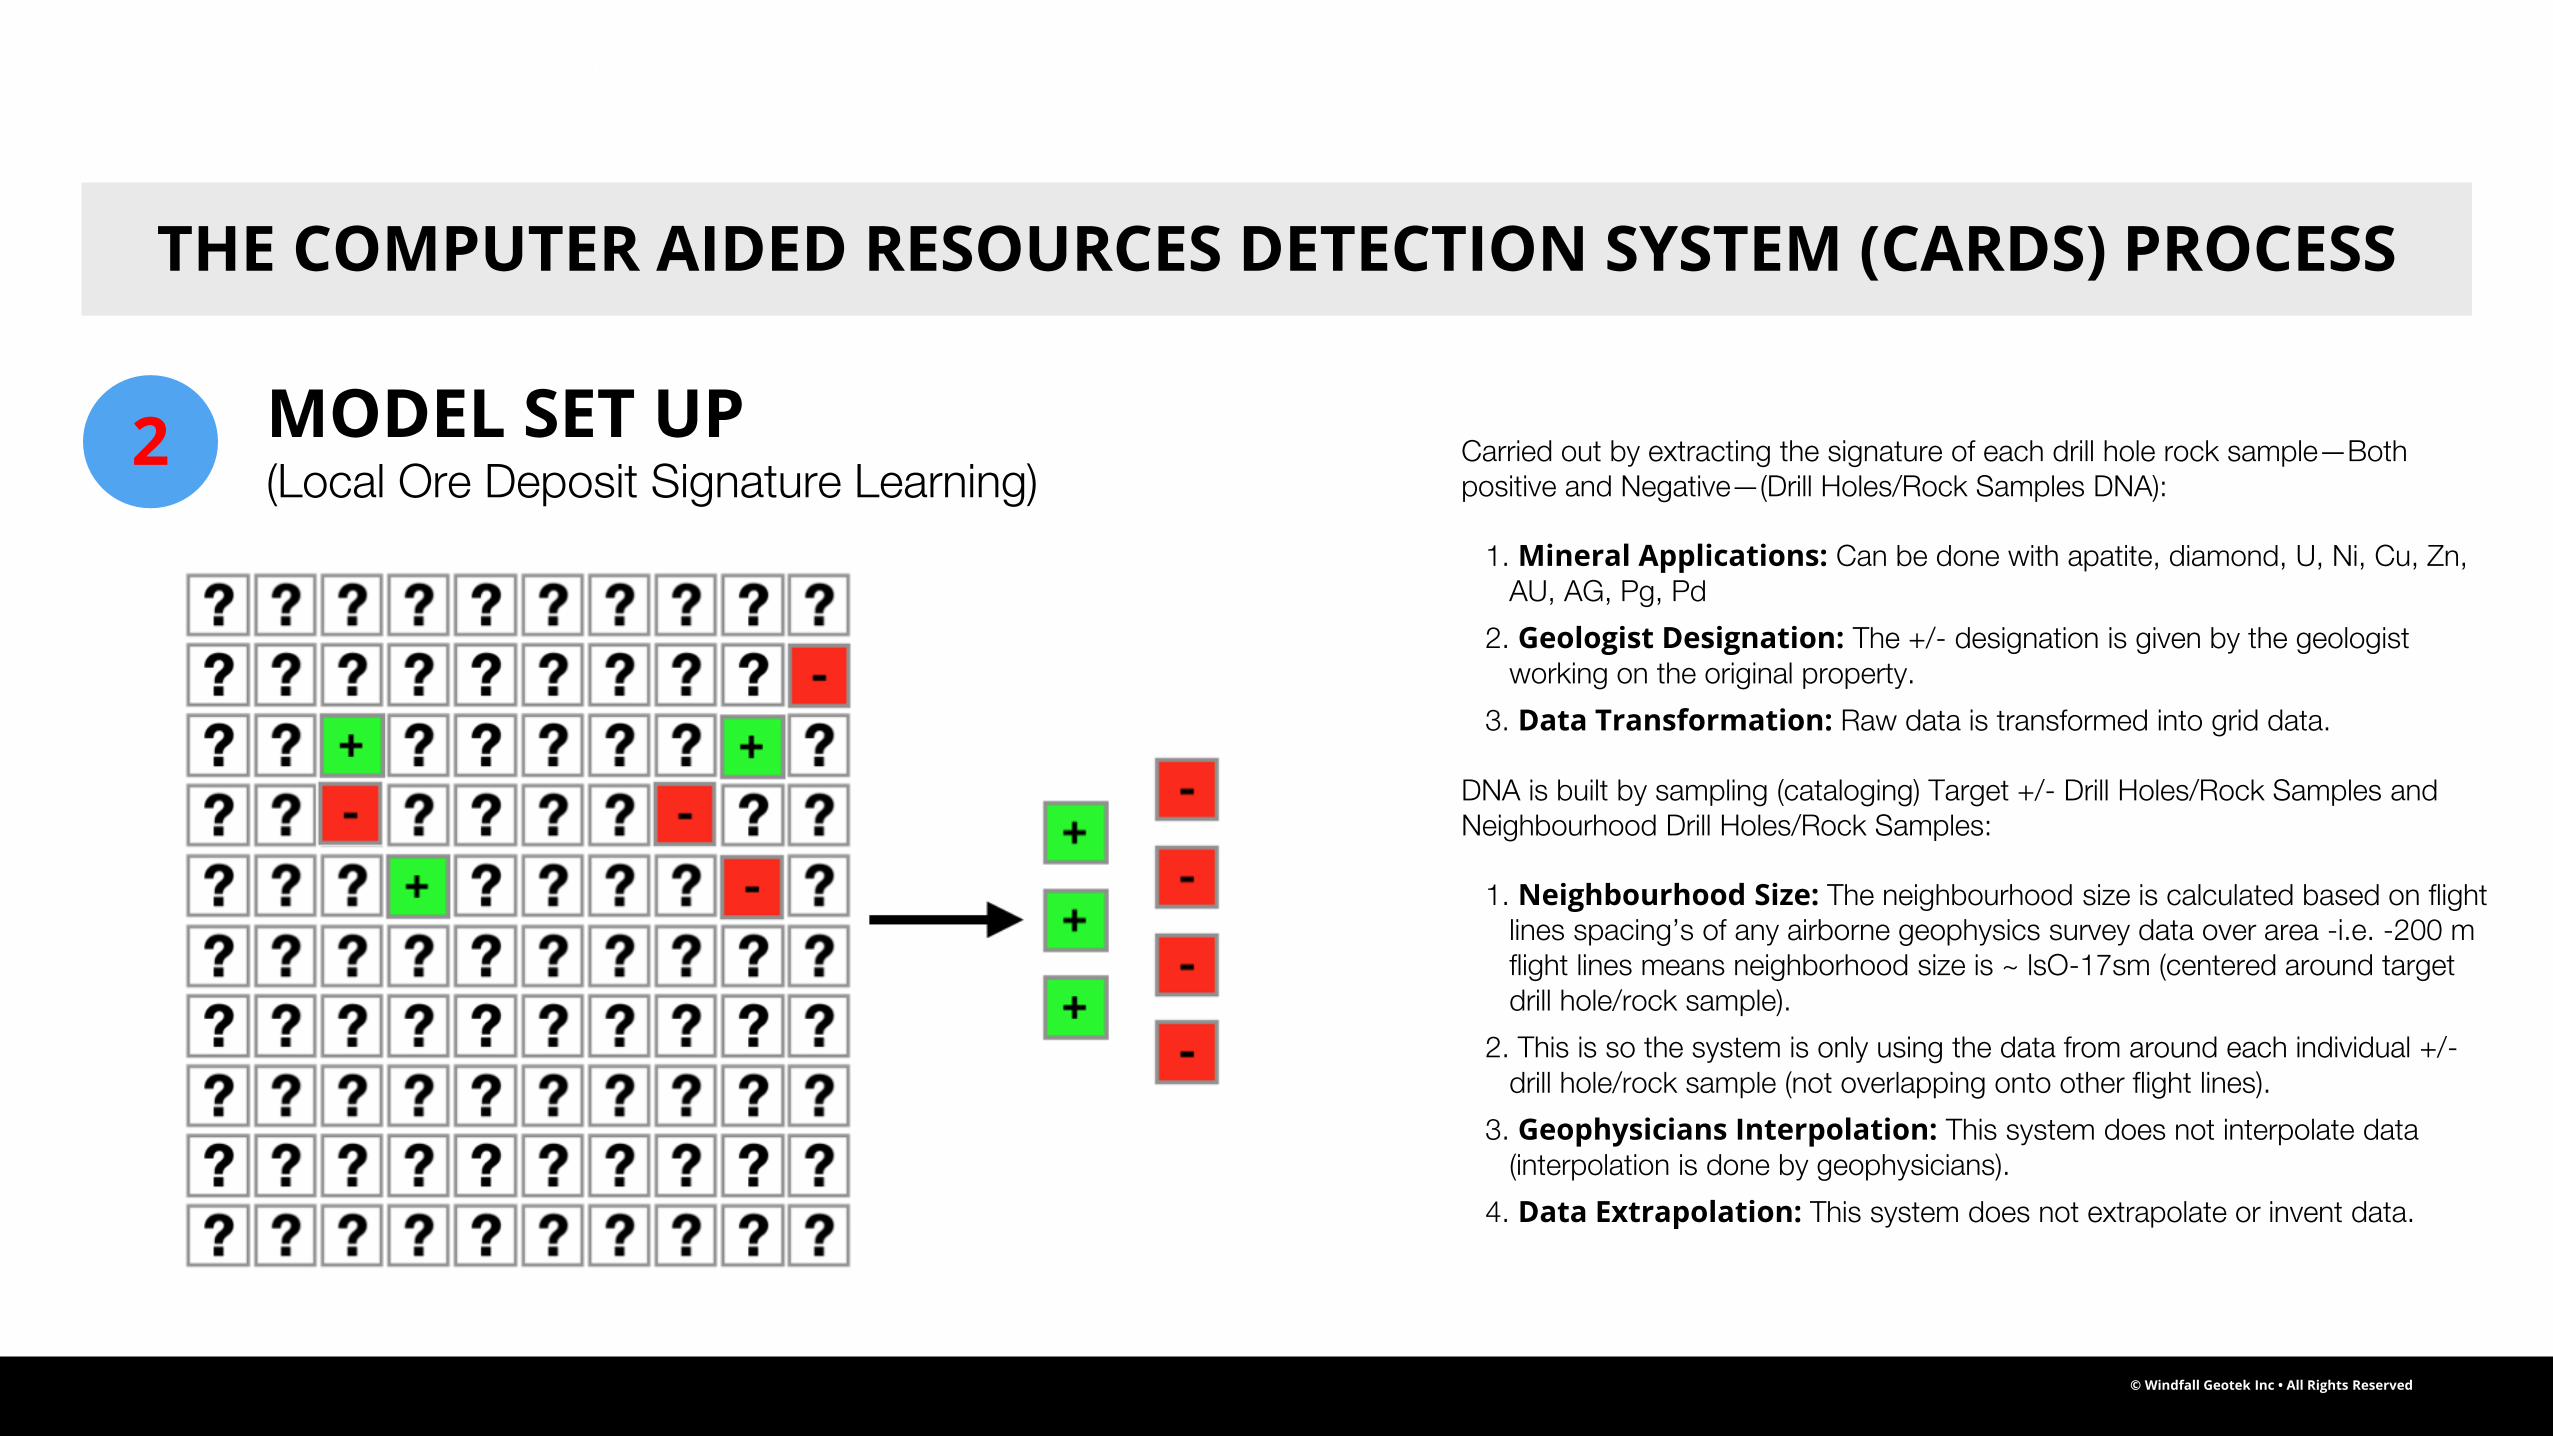
MODEL SET UP(Local Ore Deposit Signature Learning)
THE COMPUTER AIDED RESOURCES DETECTION SYSTEM (CARDS) PROCESS
2 Carried out by extracting the signature of each drill hole rock sample—Both positive and Negative—(Drill Holes/Rock Samples DNA):
1. Mineral Applications: Can be done with apatite, diamond, U, Ni, Cu, Zn, AU, AG, Pg, Pd
2. Geologist Designation: The +/- designation is given by the geologist working on the original property.
3. Data Transformation: Raw data is transformed into grid data.
DNA is built by sampling (cataloging) Target +/- Drill Holes/Rock Samples and Neighbourhood Drill Holes/Rock Samples:
1. Neighbourhood Size: The neighbourhood size is calculated based on flight lines spacing’s of any airborne geophysics survey data over area -i.e. -200 m flight lines means neighborhood size is ~ lsO-17sm (centered around target drill hole/rock sample).
2. This is so the system is only using the data from around each individual +/-drill hole/rock sample (not overlapping onto other flight lines).
3. Geophysicians Interpolation: This system does not interpolate data (interpolation is done by geophysicians).
4. Data Extrapolation: This system does not extrapolate or invent data.
© Windfall Geotek Inc • All Rights Reserved
CSE
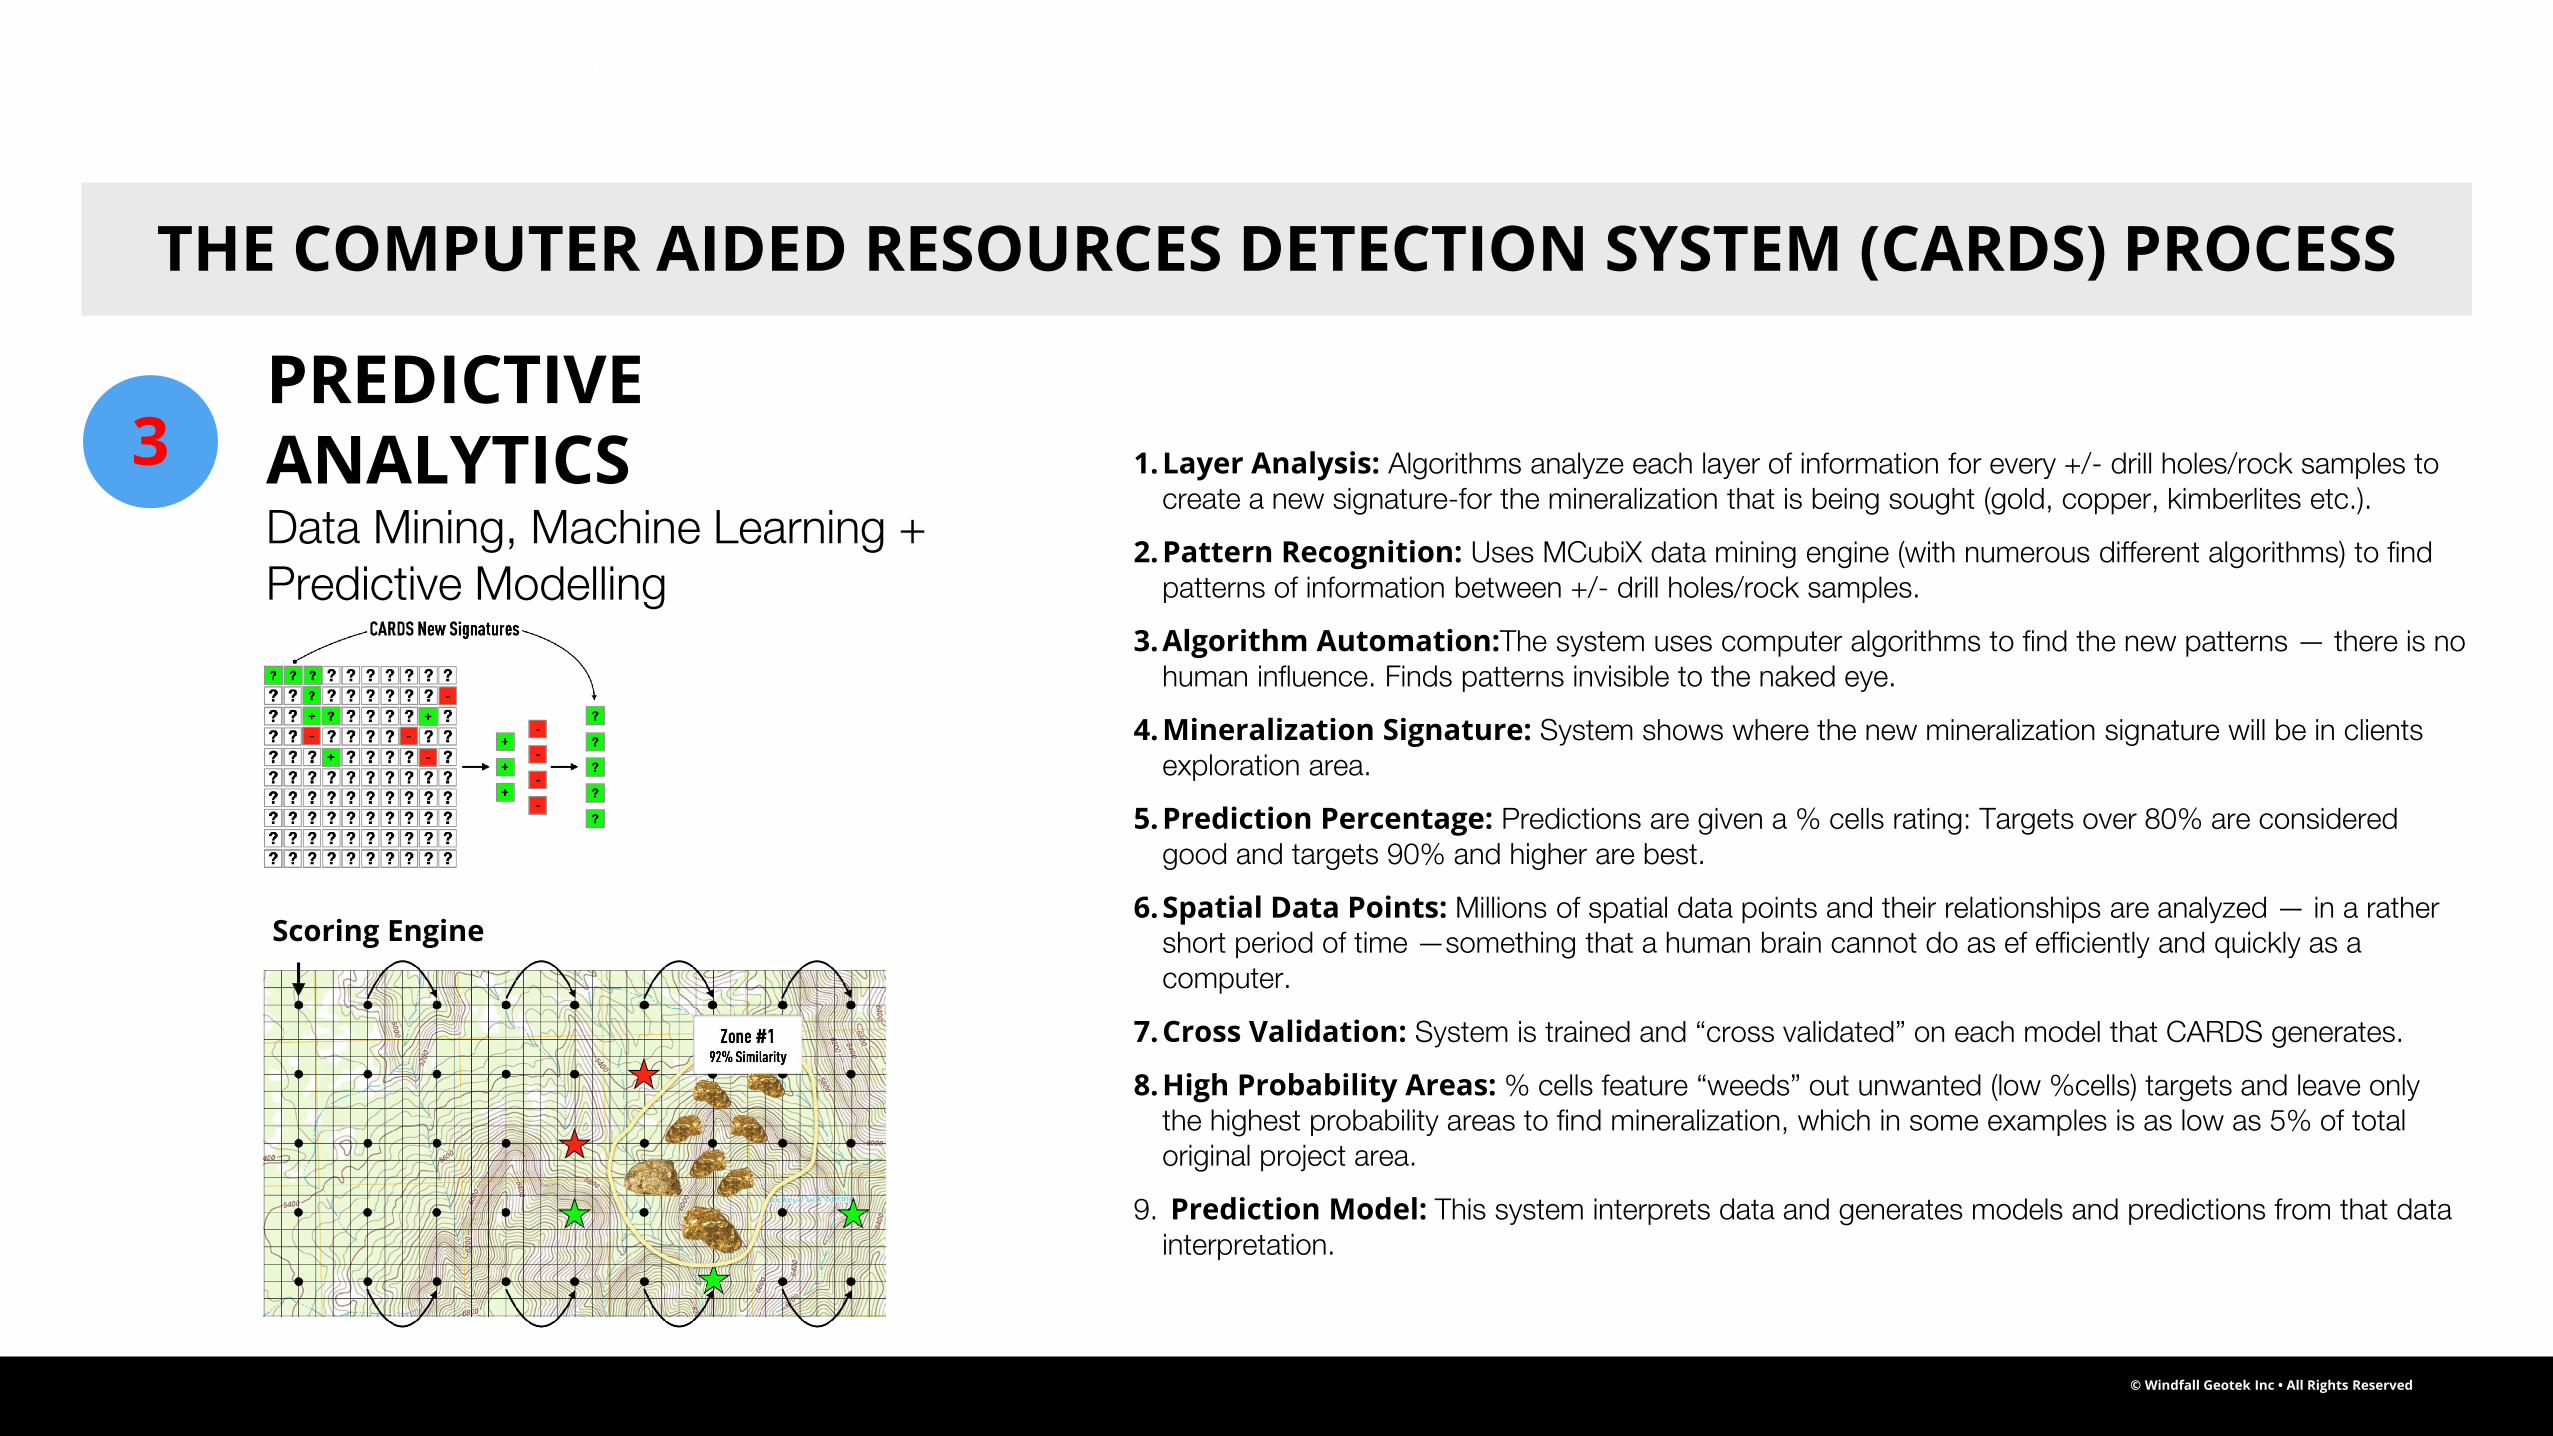
Scoring Engine
PREDICTIVE ANALYTICSData Mining, Machine Learning + Predictive Modelling
THE COMPUTER AIDED RESOURCES DETECTION SYSTEM (CARDS) PROCESS
3 1. Layer Analysis: Algorithms analyze each layer of information for every +/- drill holes/rock samples to create a new signature-for the mineralization that is being sought (gold, copper, kimberlites etc.).
2. Pattern Recognition: Uses MCubiX data mining engine (with numerous different algorithms) to find patterns of information between +/- drill holes/rock samples.
3. Algorithm Automation:The system uses computer algorithms to find the new patterns — there is no human influence. Finds patterns invisible to the naked eye.
4. Mineralization Signature: System shows where the new mineralization signature will be in clients exploration area.
5. Prediction Percentage: Predictions are given a % cells rating: Targets over 80% are considered good and targets 90% and higher are best.
6. Spatial Data Points: Millions of spatial data points and their relationships are analyzed — in a rather short period of time —something that a human brain cannot do as ef efficiently and quickly as a computer.
7. Cross Validation: System is trained and “cross validated” on each model that CARDS generates.
8. High Probability Areas: % cells feature “weeds” out unwanted (low %cells) targets and leave only the highest probability areas to find mineralization, which in some examples is as low as 5% of total original project area.
9. Prediction Model: This system interprets data and generates models and predictions from that data interpretation.
© Windfall Geotek Inc • All Rights Reserved
CSE
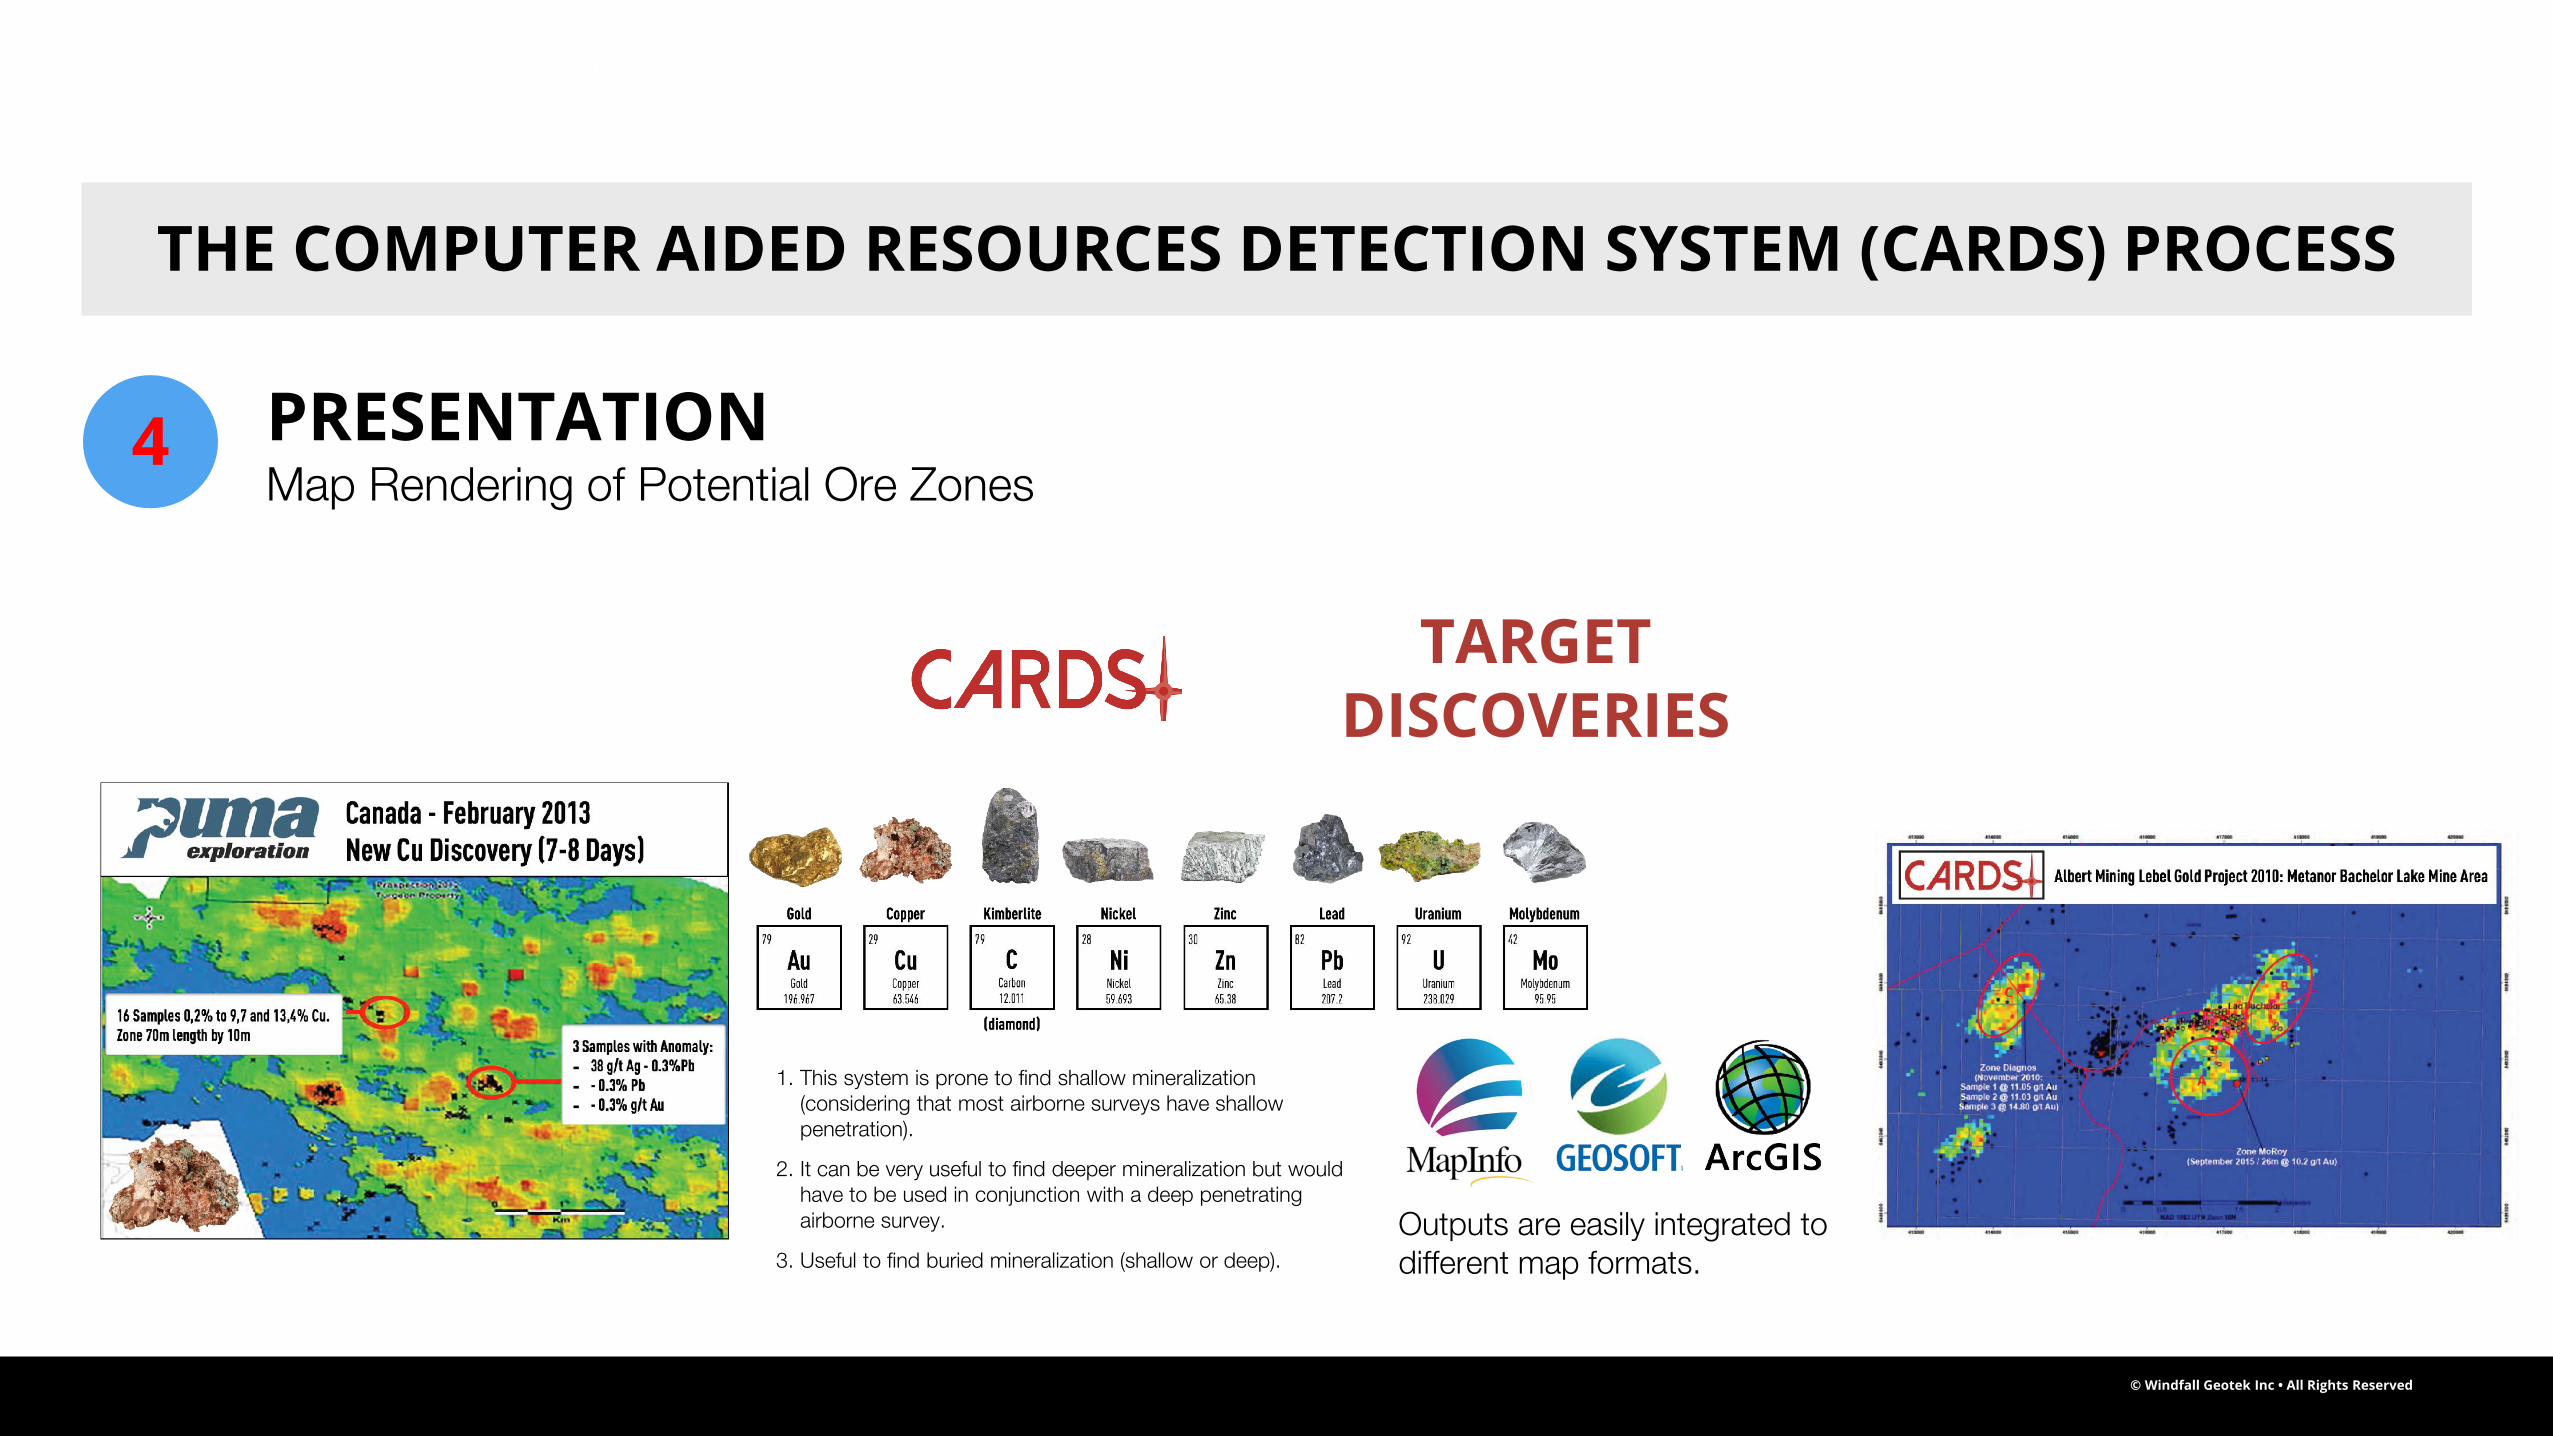
TARGET DISCOVERIES
1. This system is prone to find shallow mineralization (considering that most airborne surveys have shallow penetration).
2. It can be very useful to find deeper mineralization but would have to be used in conjunction with a deep penetrating airborne survey.
3. Useful to find buried mineralization (shallow or deep).
Outputs are easily integrated to different map formats.
PRESENTATIONMap Rendering of Potential Ore Zones
THE COMPUTER AIDED RESOURCES DETECTION SYSTEM (CARDS) PROCESS
4
© Windfall Geotek Inc • All Rights Reserved
CSE
EAGLEYE’s Computer Aided Resources Detection System (CARDS) is a state-of-the-art AI system used to identify areas with a high statistical probability of containing mineral deposits.
The backbone of CARDS is EAGLEYE’s Knowledge Extraction Data Mining Engine (KEDME).
KEDME uses AI driven pattern recognition algorithms to learn the signatures of positive and negative data points and create a model that can make predictions on the positive or negative nature of new data points.
CARDS uses these powerful algorithms to analyze digitally compiled historical exploration data and identify zones with a high potential for the discovery of mineral deposits.
The Best Place to Find a Mine is Next to a Mine
TURNING DIRT INTO DATA
© Windfall Geotek Inc • All Rights Reserved
CSE
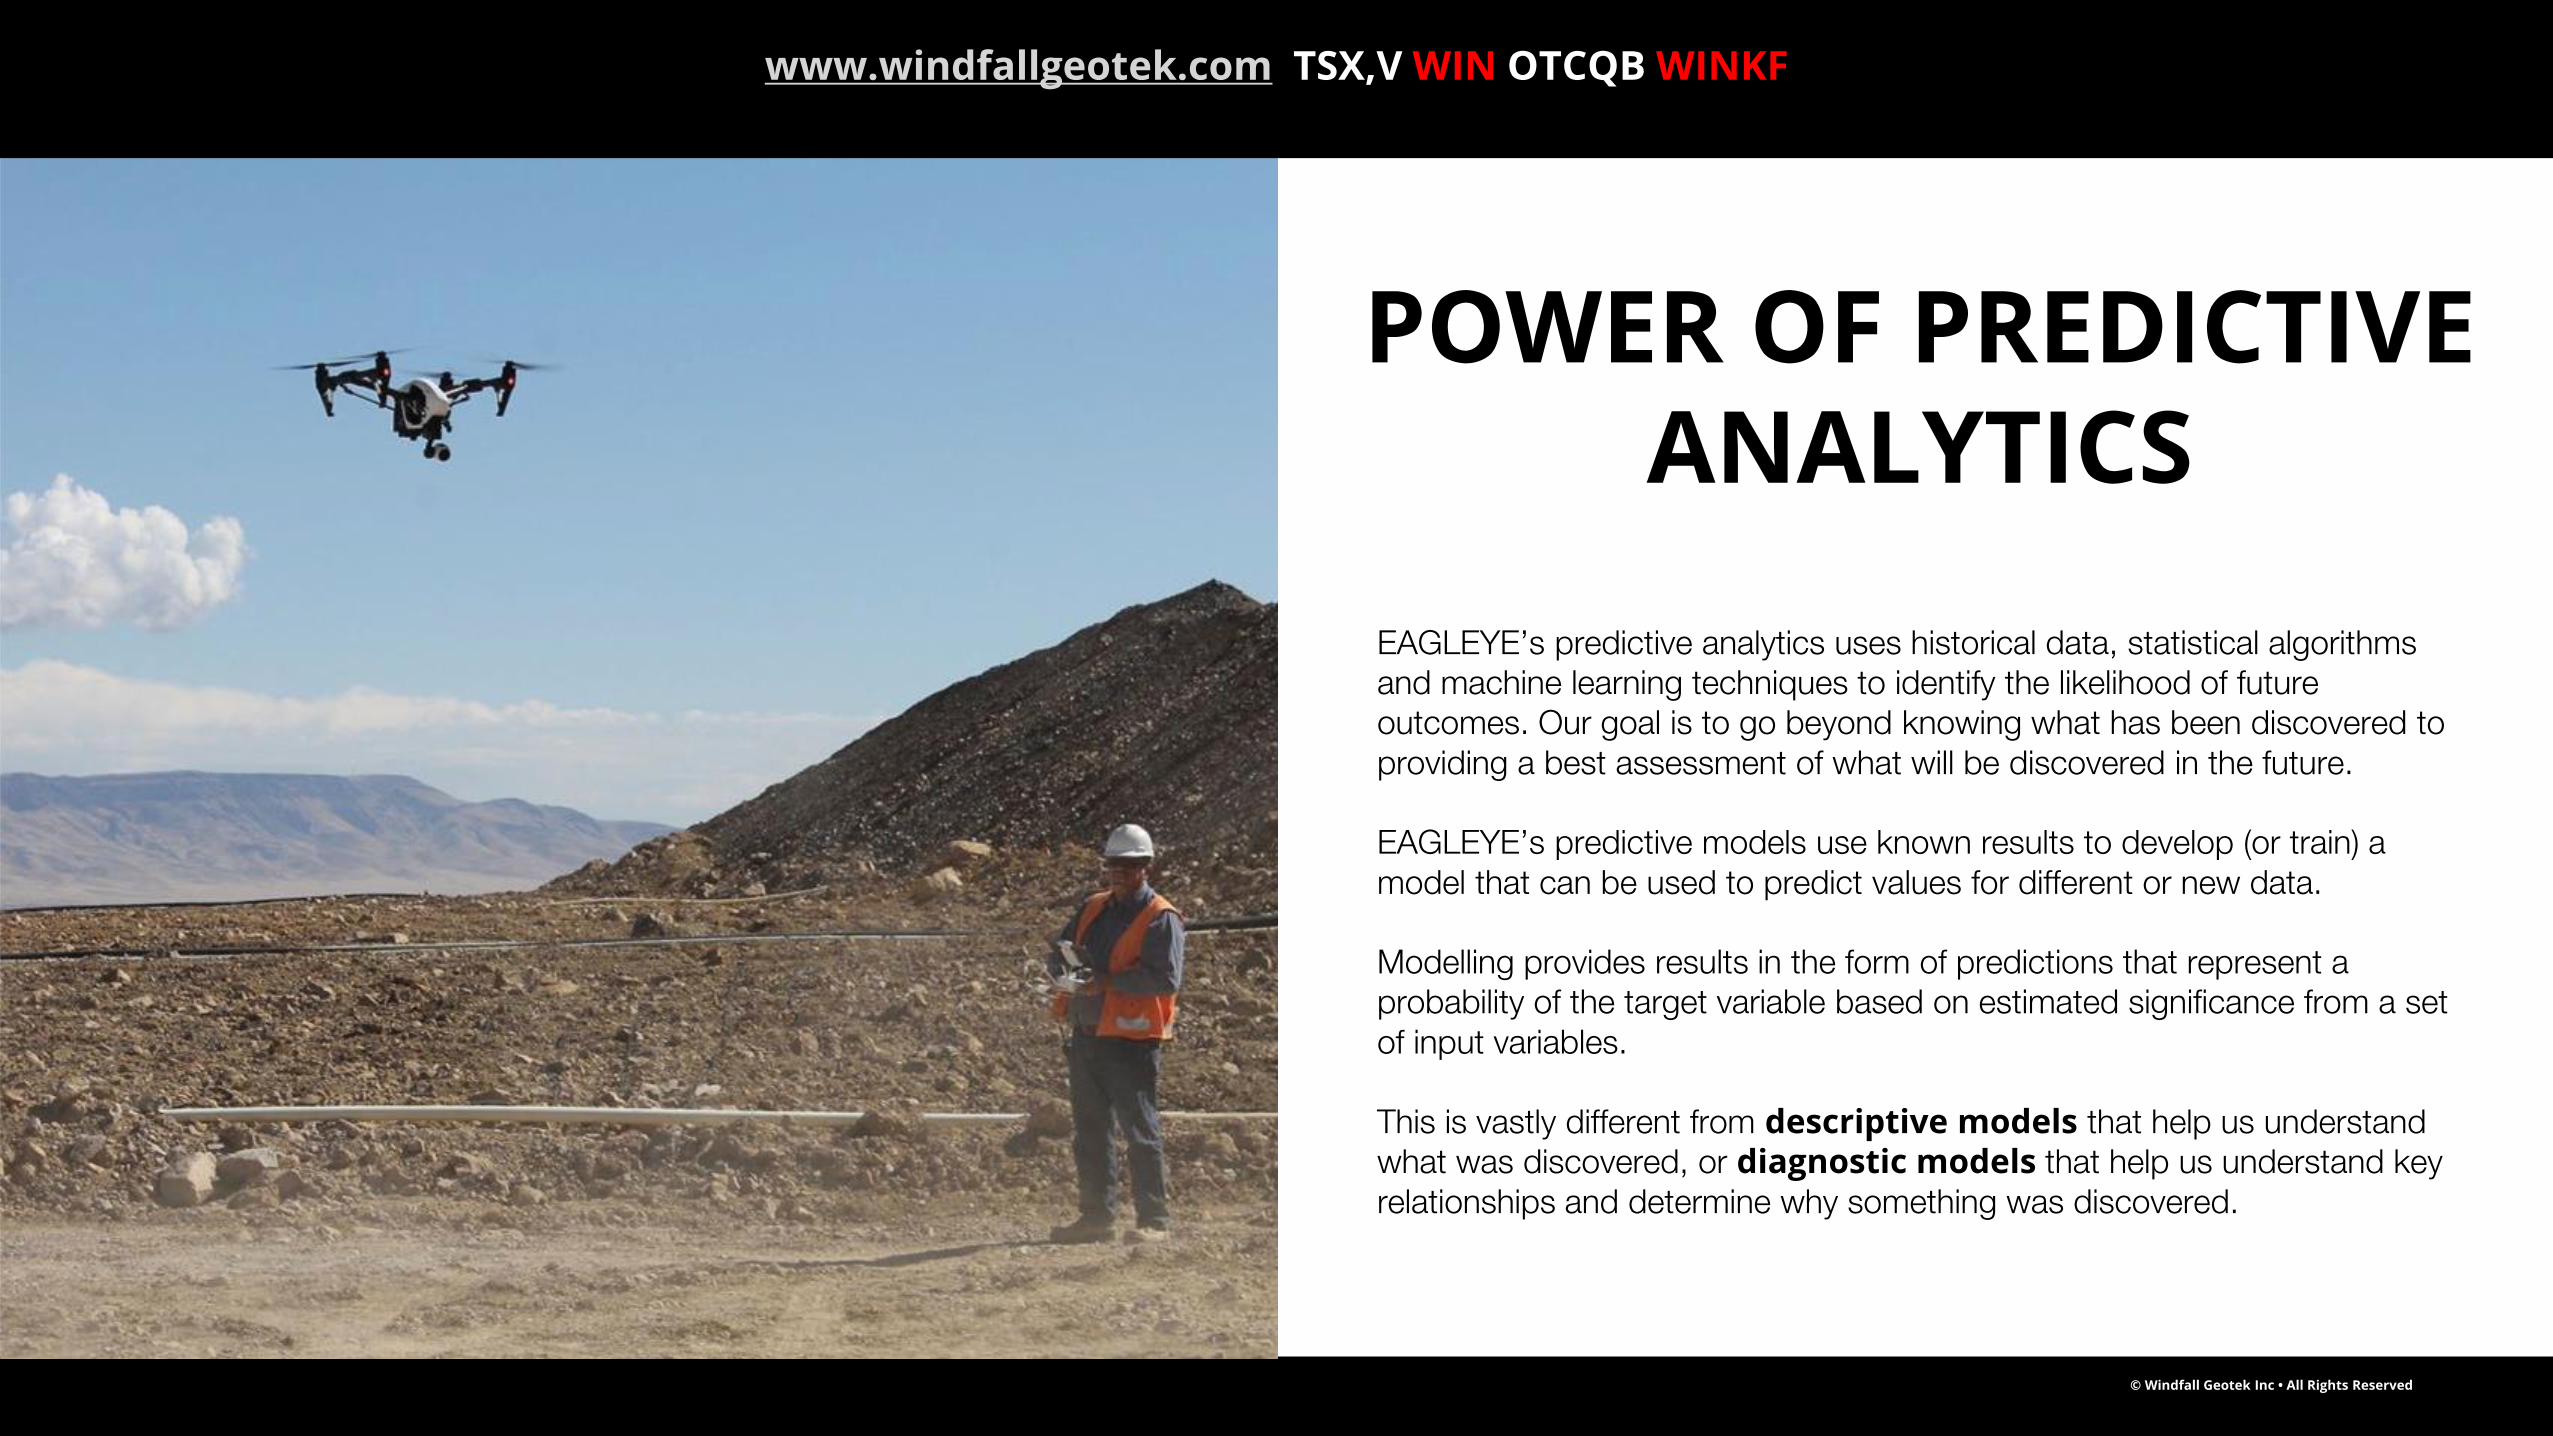
POWER OF PREDICTIVE ANALYTICS
EAGLEYE’s predictive analytics uses historical data, statistical algorithms and machine learning techniques to identify the likelihood of future outcomes. Our goal is to go beyond knowing what has been discovered to providing a best assessment of what will be discovered in the future.
EAGLEYE’s predictive models use known results to develop (or train) a model that can be used to predict values for different or new data.
Modelling provides results in the form of predictions that represent a probability of the target variable based on estimated significance from a set of input variables.
This is vastly different from descriptive models that help us understand what was discovered, or diagnostic models that help us understand key relationships and determine why something was discovered.
www.windfallgeotek.com TSX,V WIN OTCQB WINKF
© Windfall Geotek Inc • All Rights Reserved
CSE
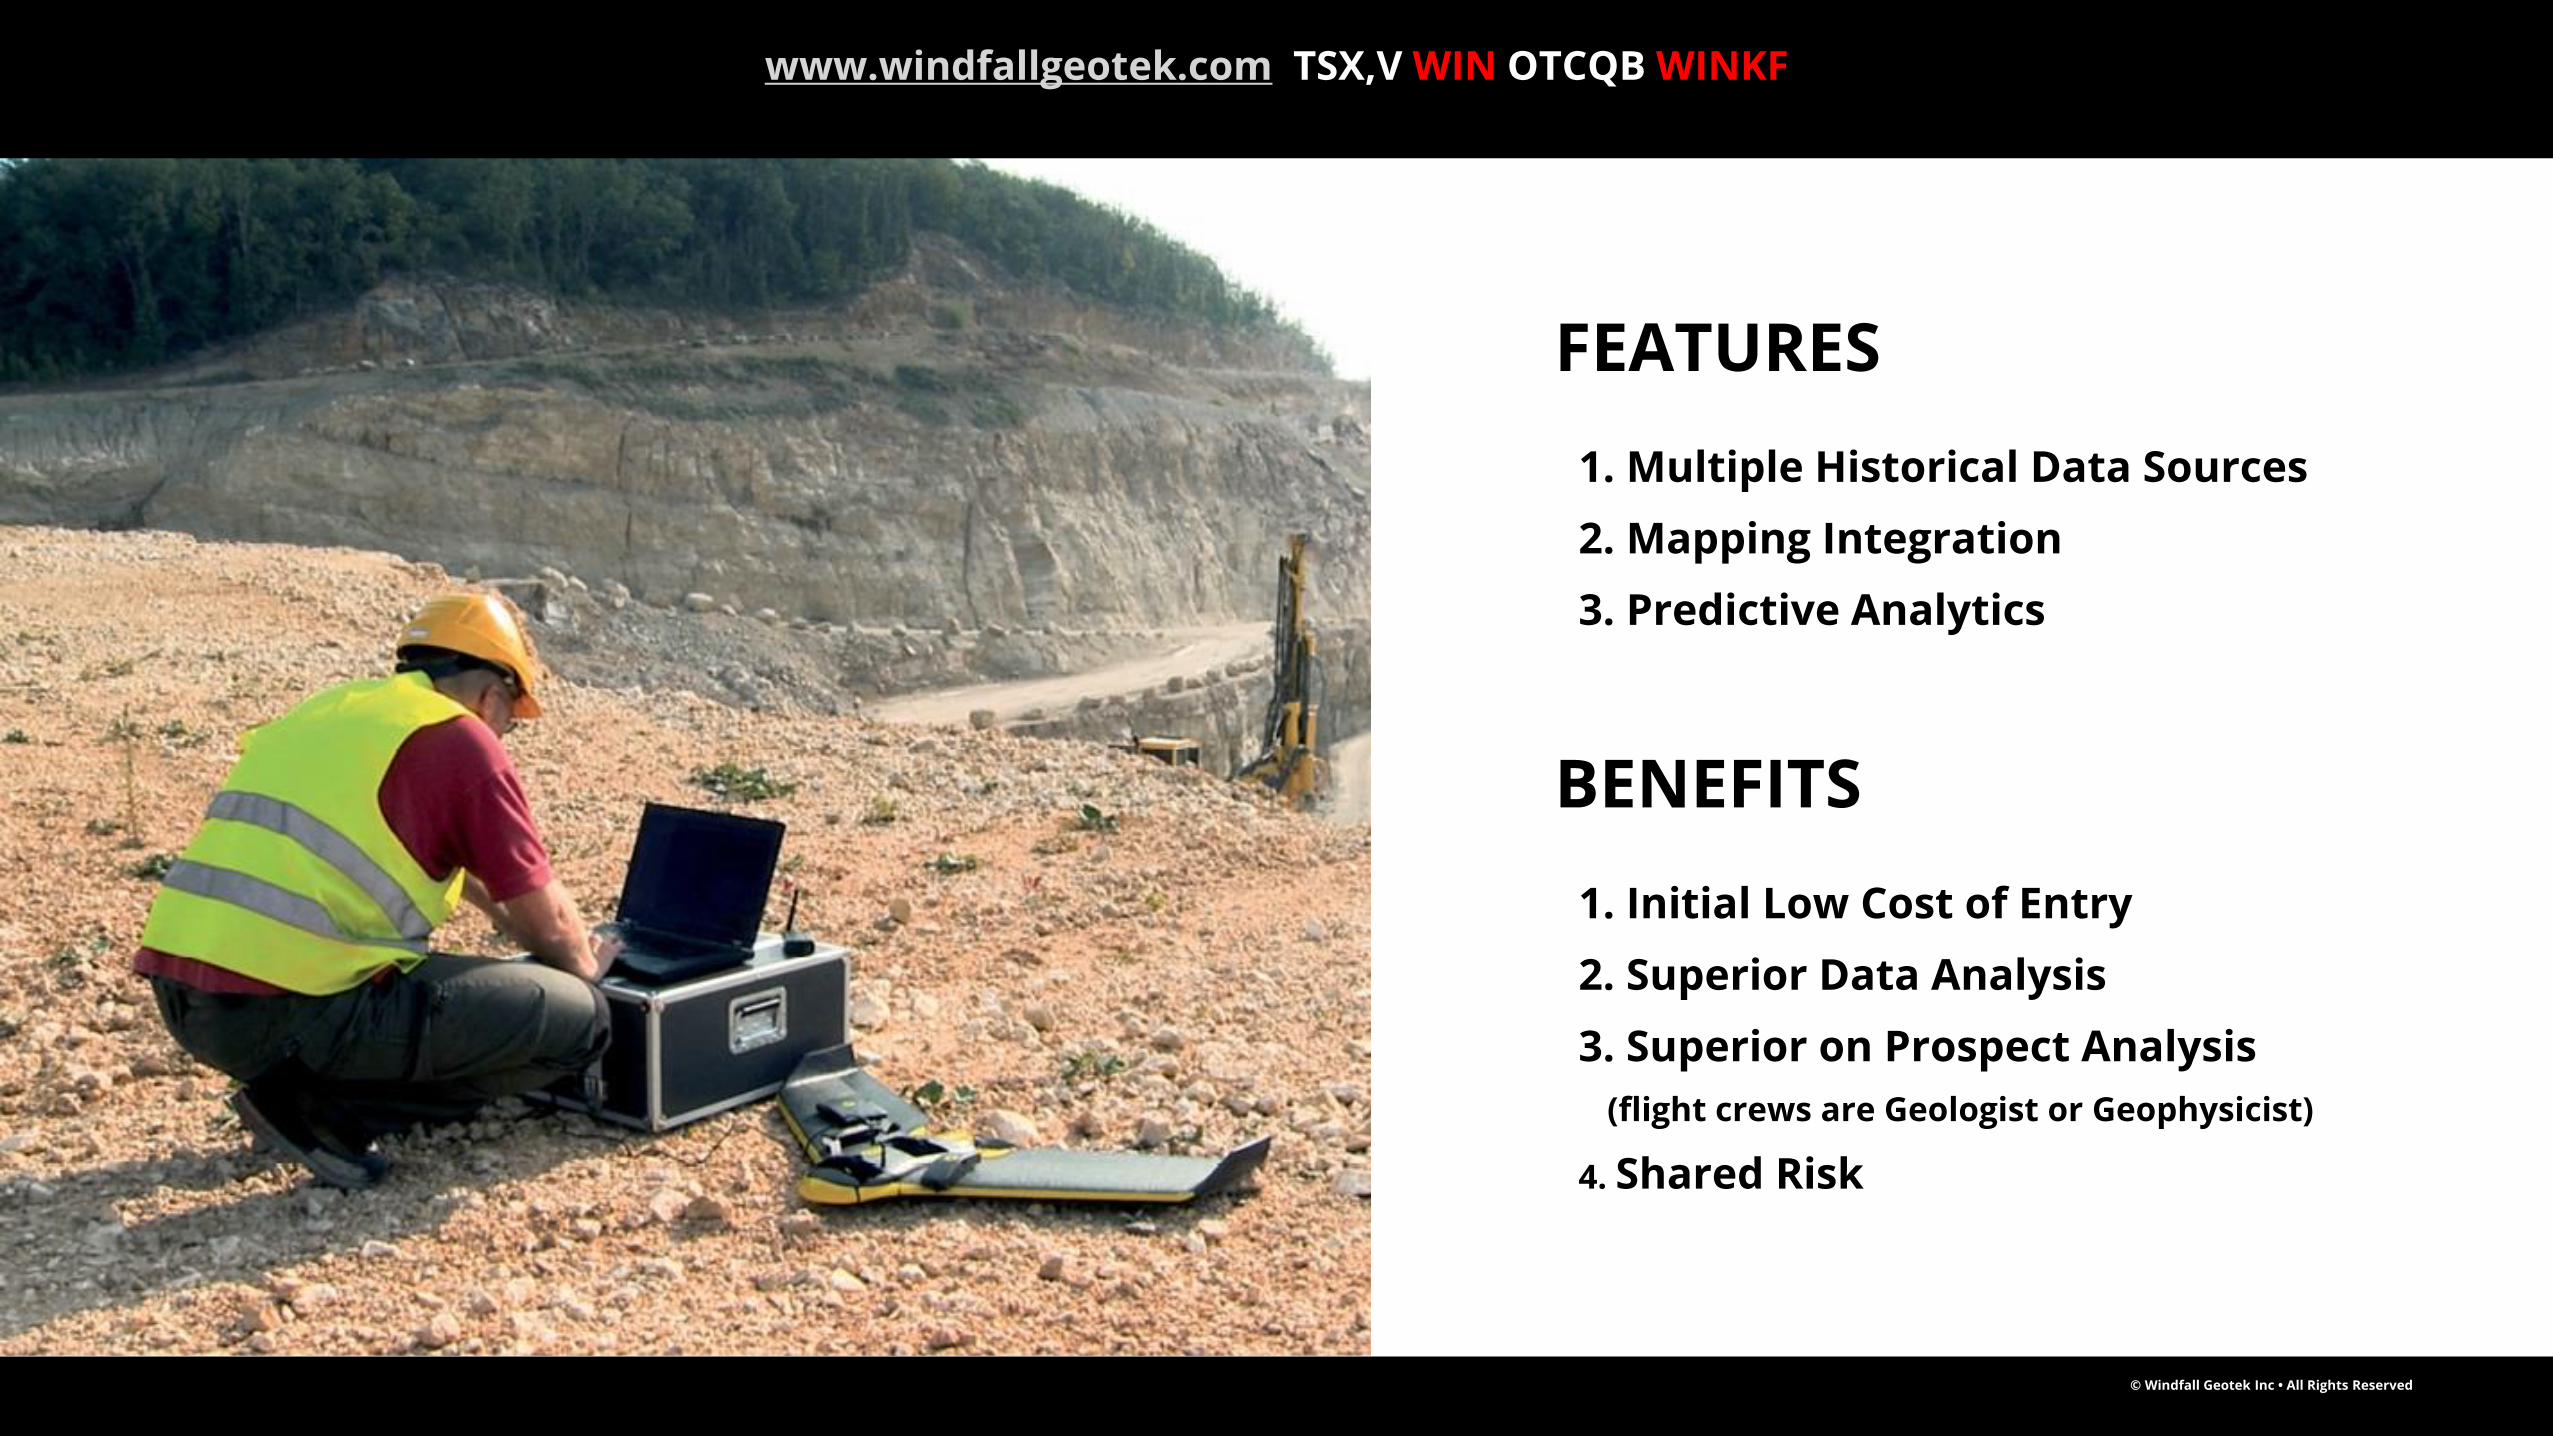
FEATURES
1. Multiple Historical Data Sources
2. Mapping Integration
3. Predictive Analytics
BENEFITS
1. Initial Low Cost of Entry
2. Superior Data Analysis
3. Superior on Prospect Analysis
(flight crews are Geologist or Geophysicist)
4. Shared Risk
www.windfallgeotek.com TSX,V WIN OTCQB WINKF
© Windfall Geotek Inc • All Rights Reserved
CSE
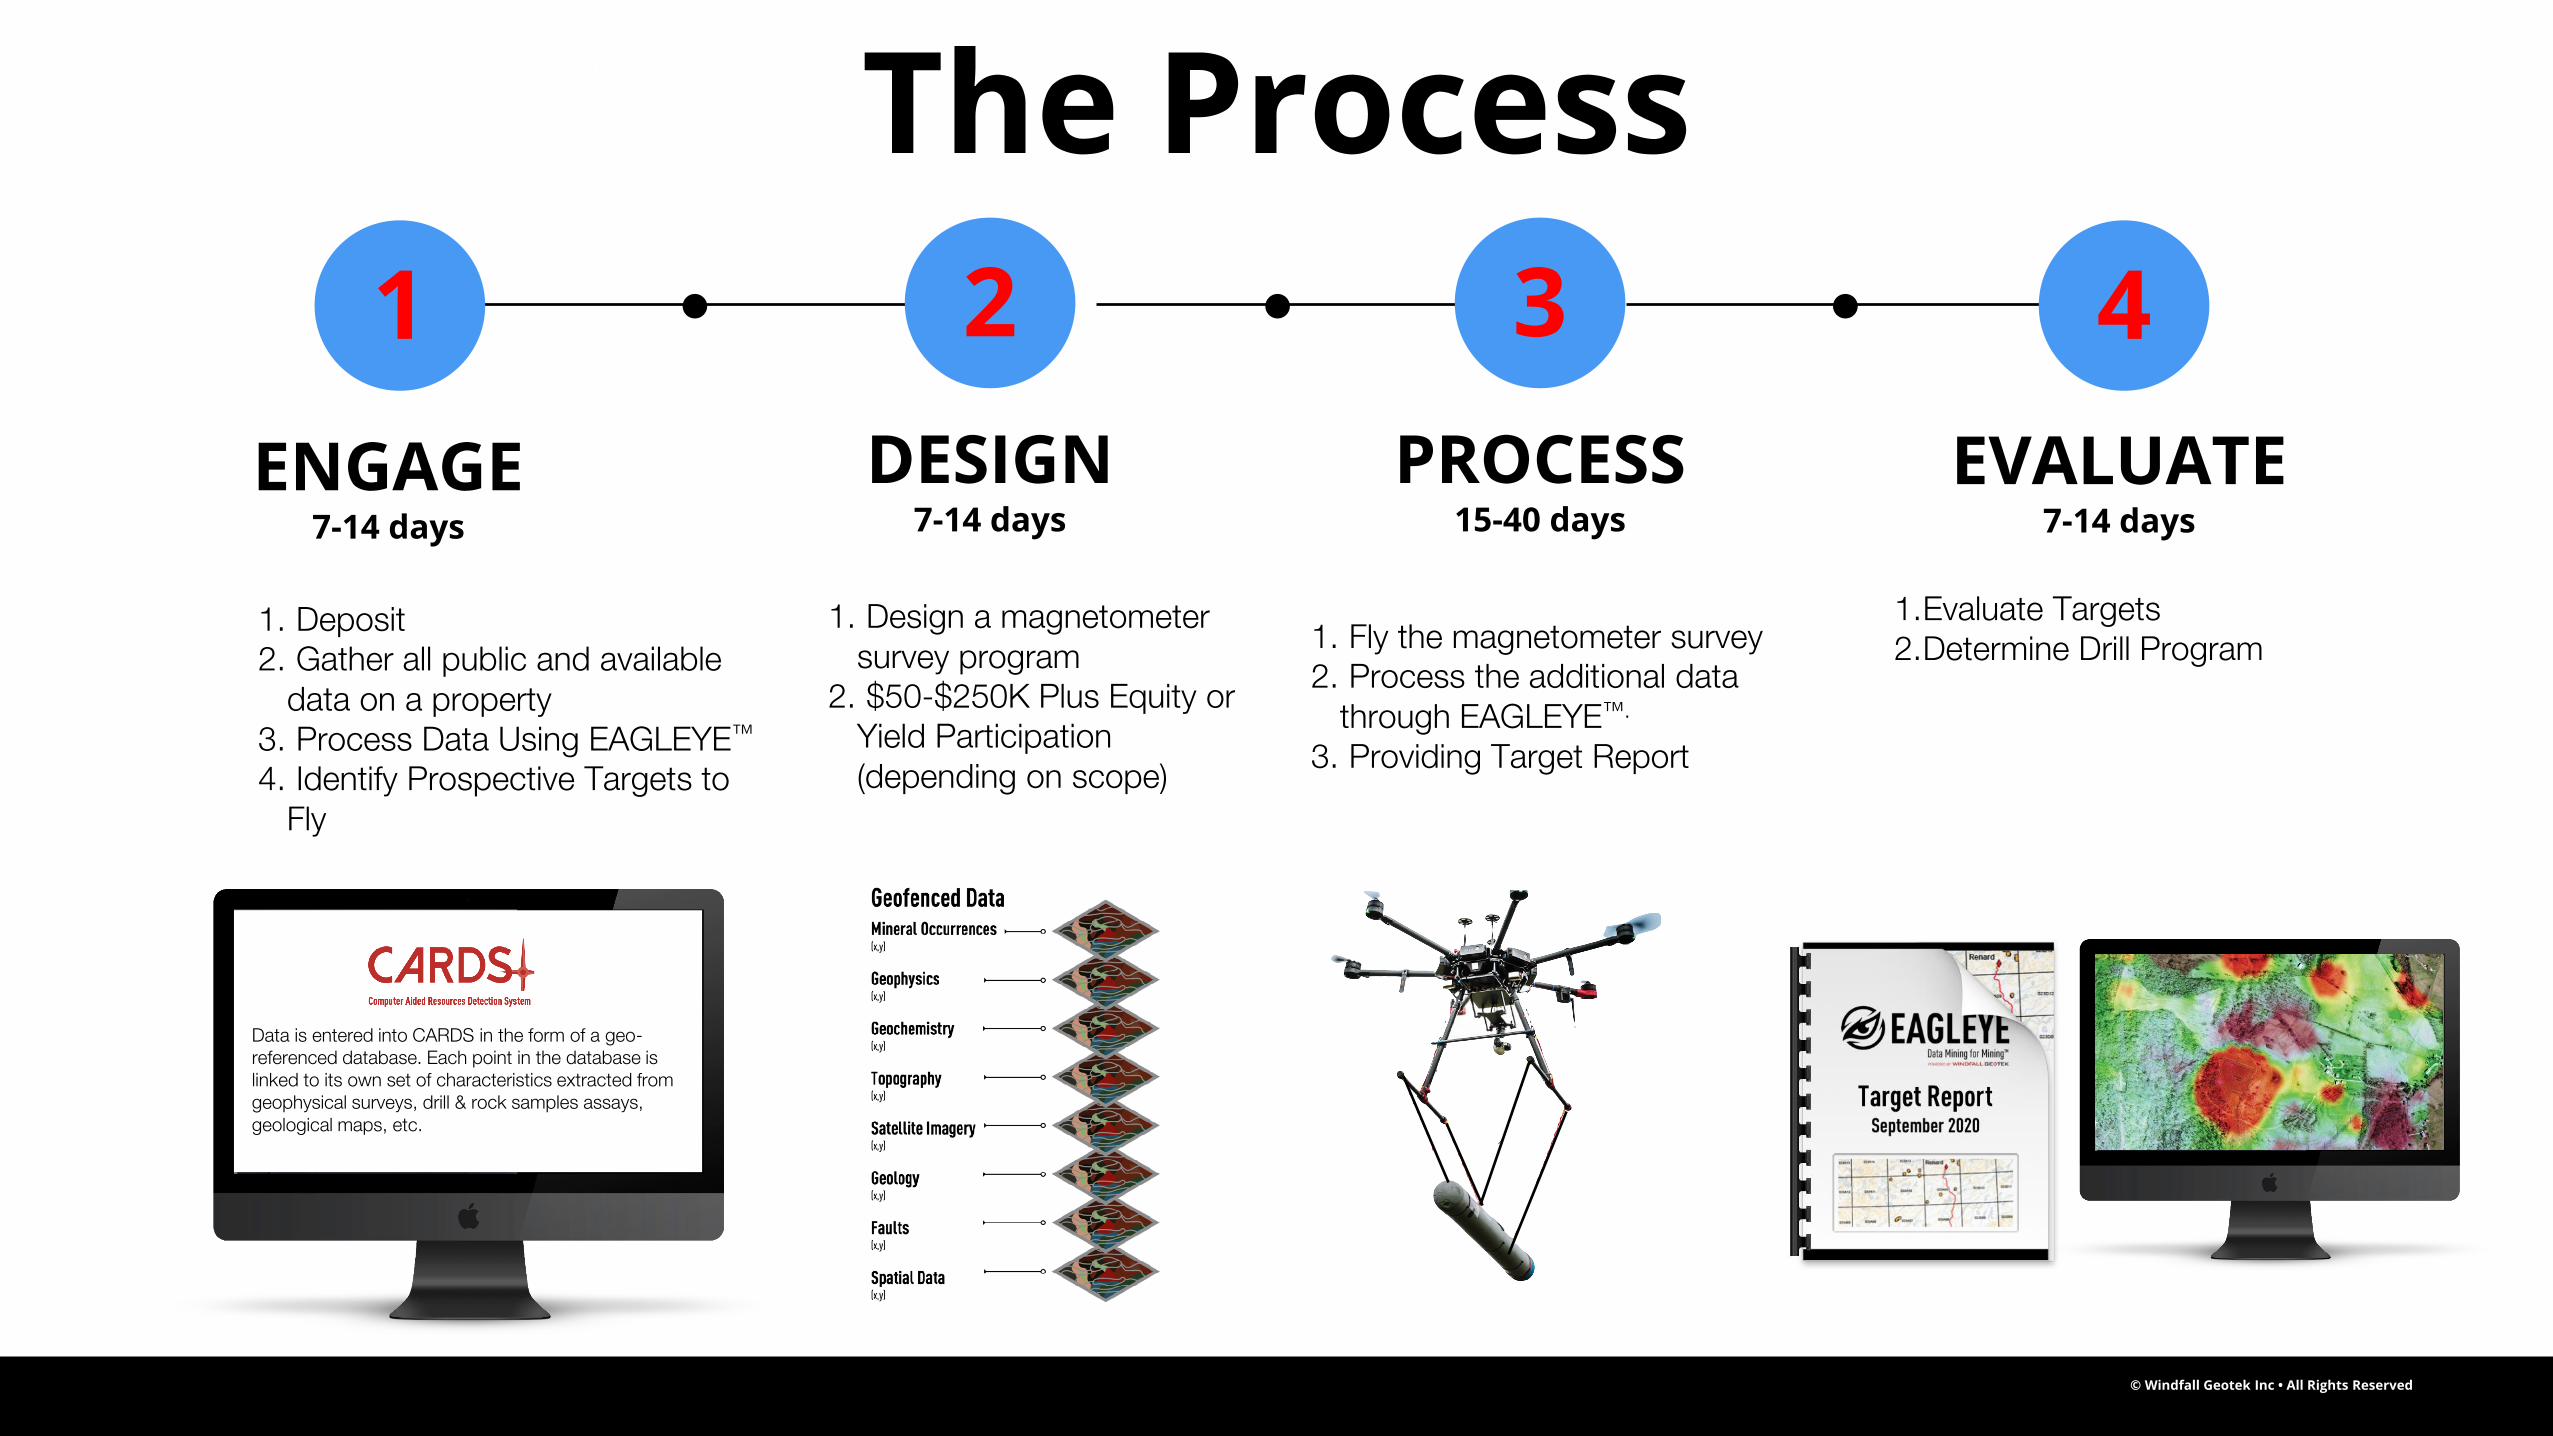
Data is entered into CARDS in the form of a geo-referenced database. Each point in the database is linked to its own set of characteristics extracted from geophysical surveys, drill & rock samples assays, geological maps, etc.
The Process
1 2 3 4
ENGAGE7-14 days
EVALUATE7-14 days
PROCESS15-40 days
DESIGN7-14 days
1.Evaluate Targets2.Determine Drill Program1. Fly the magnetometer survey
2. Process the additional data through EAGLEYE™.
3. Providing Target Report
1. Deposit2. Gather all public and available
data on a property3. Process Data Using EAGLEYE™
4. Identify Prospective Targets to Fly
1. Design a magnetometer survey program
2. $50-$250K Plus Equity or Yield Participation (depending on scope)
© Windfall Geotek Inc • All Rights Reserved
CSE
Tired of using outdated and inefficient prospecting tools?
Contact us today for a no obligation consultation
www.windfallgeotek.com TSX,V WIN OTCQB WINKF