Embed Size (px)
Citation preview

Leveraging Large-Truck Technology and Engineering
to Realize Safety Gains: Automatic Emergency
Braking Systems
September 2017
607 14th Street, NW, Suite 201 | Washington, DC 20005 | 202-638-5944

Title Leveraging Large-Truck Technology and Engineering to Realize Safety Gains: Automatic Emergency Braking Systems (September 2017)
Authors
Matthew C. Camden, Alejandra Medina-Flintsch, Jeffrey S. Hickman, Andrew M. Miller, and Richard J. Hanowski
Virginia Tech Transportation Institute, Blacksburg, Virginia
©2017, AAA Foundation for Traffic Safety

Foreword The mission of the AAA Foundation for Traffic Safety is to save lives through research and education. One of major focus areas is understanding how emerging technologies can affect traffic safety. Whereas the majority of our research into emerging technologies focuses on technologies found in the cars and light trucks driven by the general public, the research described in this report examines the issue from a different perspective: What role can advanced safety technologies for large trucks play in reducing crashes, injuries, and deaths on our roads? This is one of four reports describing the results of a comprehensive study of the benefits and costs of several advanced safety technologies for large trucks. The focus of this report is on automatic emergency braking systems. This report should be a useful reference for Federal transportation agencies, the trucking industry, and developers and suppliers of advanced safety technologies. Companion reports presenting related research on lane departure warning systems, video-based onboard safety monitoring systems, and air disc brakes for large trucks are also available.
C. Y. David Yang, Ph.D.
Executive Director AAA Foundation for Traffic Safety

About the Sponsor AAA Foundation for Traffic Safety 607 14th Street, NW, Suite 201 Washington, DC 20005 202-638-5944 www.aaafoundation.org Founded in 1947, the AAA Foundation for Traffic Safety is a not-for-profit, publicly supported charitable research and education organization dedicated to saving lives by preventing traffic crashes and reducing injuries when crashes occur. Funding for this report was provided by voluntary contributions from AAA/CAA and their affiliated motor clubs, individual members, AAA-affiliated insurance companies and other organizations or sources. This publication is distributed by the AAA Foundation for Traffic Safety at no charge, as a public service. It may not be resold or used for commercial purposes without the explicit permission of the Foundation. It may, however, be copied in whole or in part and distributed for free via any medium, provided the Foundation is given appropriate credit as the source of the material. The AAA Foundation for Traffic Safety assumes no liability for the use or misuse of any information, opinions, findings, conclusions or recommendations contained in this report. If trade or manufacturers’ names are mentioned, it is only because they are considered essential to the object of this report and their mention should not be construed as an endorsement. The AAA Foundation for Traffic Safety does not endorse products or manufacturers.
i
Table of Contents
List of Abbreviations and Acronyms ................................................................................. ii Executive Summary............................................................................................................. iv Introduction ............................................................................................................................ 1 Literature Review .................................................................................................................. 3
Methods .................................................................................................................................... 6
Results .................................................................................................................................... 28
Technology and Deployment Costs Per Truck ............................................................... 28 Crash Target Population ................................................................................................ 30 Effectiveness of Automatic Emergency Braking Systems ............................................. 31 Cost of Crashes ............................................................................................................... 33 Analysis Options ............................................................................................................. 33
New and Old Large Trucks are Equipped with Automatic Emergency Braking Systems ...................................................................................................................33 Only New Large Trucks are Equipped with Automatic Emergency Braking Systems ...................................................................................................................36
Discussion .............................................................................................................................. 40 References ............................................................................................................................. 43 Appendix A: Literature Review Summary Table .......................................................... 46 Appendix B: GES/FARS Crash Filtering Inclusion Variables ..................................... 48 Appendix C: Additional Analyses ..................................................................................... 50

ii
List of Abbreviations and Acronyms Acronym Definition
AAAFTS AAA Foundation for Traffic Safety
AIS Abbreviated injury scale
AEB Automatic emergency braking
AST Advanced safety technology
BCA Benefit-cost analysis
BCR Benefit-cost ratio
CE Cost-effectiveness
CEA Cost-effectiveness analysis
CPI Consumer price index
CUT Combination unit truck
DOT Department of Transportation
FARS Fatality Analysis Reporting System
FCW Forward collision warning
FHWA Federal Highway Administration
FMCSA Federal Motor Carrier Safety Administration
GES General Estimates System
GVWR Gross vehicle weight rating
HOS Hours-of-service
MAIS Maximum abbreviated injury severity
MCMIS Motor Carrier Management Information System
NHTSA National Highway Traffic Safety Administration
NPV Net present value
OEM Original equipment manufacturer
OMB Office of Management and Budget

iii
PDO Property damage only
PV Present value
QALY Quality adjusted life year
SUT Single unit truck
VIUS Vehicle inventory and use survey
VMT Vehicle miles traveled
VSL Value of statistical life

iv
Executive Summary In 2015, large trucks (trucks with a gross vehicle weight rating of more than 10,000 pounds) were involved in 414,958 crashes that resulted in 116,000 injuries and 4,067 fatalities (Federal Motor Carrier Safety Administration, 2016). The AAA Foundation for Traffic Safety identified the potential of several large-truck advanced safety technologies as promising countermeasures to reduce these crashes. Advanced safety technologies may use sensors or alerts to warn a driver of a possible collision, actively assume control of a vehicle in situations where a driver does not react to the threat of an imminent crash, or improve driver and fleet management (e.g., monitoring vehicle safety systems and drivers’ hours-of-service status). Although some advanced safety technologies may be effective at preventing crashes, it is also important to know whether they are cost-effective, as this information may assist consumers in purchasing advanced safety technologies and/or government regulators in mandating their use.
The objective of this research was to provide scientifically-based estimates of the societal benefits and costs of advanced safety technologies in large trucks (i.e., the impacts a technology may have across the entire society if implemented) in order to (1) allow the Department of Transportation to make informed decisions related to potential regulations on advanced safety technologies, and (2) promote the adoption of cost-effective advanced safety technologies to motor carriers. To accomplish this objective, an in-depth literature synthesis of 14 advanced safety technologies was completed, an expert advisory panel informed cost and benefit estimations for all advanced safety technologies (based on the literature review and their experience and knowledge), and benefit-cost analyses were performed on selected advanced safety technologies. The advisory panel recommended the following four technologies for benefit-cost analysis: automatic emergency braking systems, lane departure warning systems, air disc brakes, and video-based onboard safety monitoring systems. This report presents the results related to automatic emergency braking systems. See other AAA Foundation reports for analyses of lane departure warning systems, air disc brakes, and onboard safety monitoring systems.
Overview of Automatic Emergency Braking Systems
Automatic emergency braking systems combine a forward-looking sensor(s), driver alerts, and automatic vehicle braking. These systems are designed to reduce or prevent rear-end collisions in which the large truck strikes another vehicle (and, to a lesser extent, head-on collisions). The forward-looking sensor is used to detect a lead vehicle within a preset distance or time-to-collision. The system alerts the large-truck driver of the lead vehicle’s proximity through haptic, audible, visual, or a combination of warnings. At this point, the driver maintains control of the vehicle and can decide to reduce speed and/or steer to avoid the lead vehicle. However, if the driver does not apply the brakes or steer away from the lead vehicle and the system detects that a crash is imminent (i.e., a crash will occur if the truck continues at the current rate of speed and headway), the automatic emergency braking system will assume active control of the truck’s brakes to prevent or mitigate the imminent crash.

v
Efficacy and Costs Associated with Automatic Emergency Braking Systems
The literature review identified five studies that estimated the efficacy of large truck automatic emergency braking systems in reducing crashes. These studies found the efficacy of automatic emergency braking systems in preventing large-truck rear-end crashes in which the large truck is the striking vehicle ranged from 16% to 52.3%. This wide range of efficacy was the result of variations in performance capabilities (i.e., braking to moving and/or stationary objects, 0.3 g to 0.6 g braking) between different generations of automatic emergency braking systems. Additionally, two documents provided costs associated with the systems, identifying them as ranging from $2,400 to $2,600 per vehicle.
Expert Advisory Panel
An Expert Advisory Panel convened May 17, 2016, at the AAA Foundation for Traffic Safety headquarters in Washington, D.C. This advisory panel consisted of six individuals representing various aspects of the industry, including representatives from a commercial motor vehicle carrier, a trucking insurance company, the Federal Motor Carrier Association, the National Highway Traffic Safety Administration, and an automatic emergency braking system vendor. The Panel also included an industry safety consultant.
The purpose of this meeting was twofold: (1) to assist the research team in selecting technologies that require a benefit-cost analysis, and (2) to identify the appropriate efficacy rates and costs to be used in the benefit-cost analyses. Following this discussion, a benefit-cost analysis was recommended for automatic emergency braking systems, and upper- and lower-bound efficacy rates and costs were selected to use in the analysis.
The panel recommended efficacy rates of 16% and 28% to reflect current performance capabilities of automatic emergency braking systems (as opposed to systems that were under development). This recommendation was based on results from Woodrooffe et al. (2012) for pre-2014 systems (i.e., systems which braked at 0.35 g and did not brake to fixed objects) as well as post-2014 systems (i.e., braking at 0.3 g to fixed objects; braking at 0.6 g to recently stopped/stopping vehicles). Additionally, the panel recommended a cost of $2,500 per truck based on vendor feedback and information gathered from the NorthAmerican Transportation Association (n.d.), and Hickman et al. (2013).
Benefit-Cost Analysis Methods
The benefit-cost analysis followed conventional methods used in similar studies (e.g., Hickman et al., 2013) to estimate the societal benefits and costs of implementing automatic emergency braking systems in the trucking industry. Societal benefits of the systems associated with a reduction in crashes were compared with the costs of deploying the systems across the entire U.S. fleet of large trucks. The benefit and cost factors considered in this study are discussed below.
Benefit Factors: • Medical-related costs • Emergency response service costs

vi
• Property damage • Lost productivity • Monetized value of pain, and the suffering and quality-of-life decrements
experienced by families in a death or injury
Cost Factors: • System hardware purchase, installation, and financing costs • System maintenance costs • System replacement costs • Costs associated with training for drivers and managers
To assess the impact automatic emergency braking systems could have on reducing crash rates (and the costs associated with the systems), national crash databases were used to identify the population of crashes that automatic emergency braking systems could potentially prevent. These crash databases included the Fatality Analysis Reporting System (FARS) and the General Estimates System (GES). The FARS database was used to determine the number of fatal crashes and their associated fatalities and injuries, and the GES database was used as an estimation for injury and property-damage-only crashes. The GES database also was used to estimate the number of injuries as a result of injury crashes. Queries were developed for crashes relevant to automatic emergency braking systems; information was extracted for different vehicle types for a period of six years (2010 to 2015).
When filtering the GES and FARS crashes, the research team carefully considered the scenarios where a systems may have prevented the crashes. Specifically, only rear-end crashes where the large truck struck another vehicle were selected for automatic emergency braking systems. Additionally, the research team used the following GES/FARS variables to further limit crashes that may have been prevented by automatic emergency braking systems: pre-event movement, critical event, and first harmful event. Finally, all crashes that involved the use of alcohol or drugs by the large-truck driver were eliminated. The complete list of GES/FARS variables may be found in Appendix B.
Two sets of benefit-cost analyses were performed for automatic emergency braking systems. The first set of analyses included retrofitting the entire U.S. fleet of large trucks. This approach assumed all new vehicles added to the fleet would be equipped with automatic emergency braking systems and old vehicles would be retrofitted with them. This analysis approach represented the scenario with the most benefits but also the highest costs. The second set of analyses used an annual incremental costs analysis approach. This approach assumed all new vehicles would be equipped with automatic emergency braking systems (starting in 2018) and did not include retrofitting existing vehicles. Societal benefits were assessed over the life of the vehicle.
Additionally, for each analysis approach, an analysis was performed on different types of large trucks. The first analysis included all class 7 and 8 trucks (gross vehicle weight rating greater than 26,000 pounds). The second analysis was performed only using class 7 and 8 combination unit trucks (CUTs). The third analysis was performed only using class 7 and 8 single unit trucks (SUTs).

vii
Finally, separate analyses were performed to account for the rate of monetary discount, in the present value, of the cost and benefits in any future year. Following guidance from the Office of Management and Budget (OMB, 2003) analyses were performed using a 0%, 3%, and 7% discount rate.
Benefit-Cost Analysis Results: All Vehicles (New and Old) Equipped with Automatic Emergency Braking Systems
Automatic emergency braking systems were evaluated using a low and high efficacy rate (16% and 28%, respectively) and a low, average, and high cost ($500, $2,500, and $3,000, respectively1). Table 1 shows the benefit-cost ratios for automatic emergency braking systems when equipping all trucks (new and old). The analyses with a benefit-cost ratio greater than 1.00, which indicate that the benefits outweigh the costs, are highlighted. For example, the first row in Table 1 shows the results for all large trucks using a high efficacy rate for automatic emergency braking systems. When the costs of the systems are average and the discount rate is 0%, the estimated costs of the systems are greater than their estimated benefits, as indicated by the benefit-cost ratio whose value is less than 1. However, when the costs of systems are low and the discount rate is 0%, the estimated benefits of automatic emergency braking systems are 3.75 times their cost.
Table 1. Benefit-Cost Ratios for Automatic Emergency Braking Systems Installed on All Trucks by Vehicle Type, Efficacy Rate, Cost, and Discount Rate
Low Cost Average Cost High Cost
0% 3% 7% 0% 3% 7% 0% 3% 7% All Large Trucks – High Efficacy 3.75 3.58 3.37 0.91 0.87 0.82 0.76 0.73 0.69
All Large Trucks – Low Efficacy 2.14 2.05 1.93 0.52 0.50 0.47 0.44 0.42 0.39
Only CUTs – High Efficacy 4.11 3.94 3.72 0.99 0.95 0.90 0.83 0.80 0.76
Only CUTs – Low Efficacy 2.35 2.25 2.13 0.56 0.54 0.52 0.47 0.46 0.43
Only SUTs – High Efficacy 3.08 2.92 2.72 0.75 0.72 0.67 0.63 0.60 0.56
Only SUTs – Low Efficacy 1.76 1.67 1.56 0.43 0.41 0.38 0.36 0.34 0.32
Sensitivity analyses were performed for all vehicle classifications with a higher value of a statistical life ($13,260,000) and a lower value ($5,304,000). Since only the low-cost estimates were cost-effective when retrofitting the entire U.S. fleet of large trucks, using a lower value of a statistical life in the calculations would only make these systems less cost-effective. Thus, only the results based on the higher value of a statistical life are shown below (Table 2). The results with the lower value are shown in Appendix C. Using the higher value of a statistical life, the low-cost automatic emergency braking systems were found to be cost-effective regardless of efficacy rate. The average- and high-cost systems with a high efficacy rate were found to be cost-effective for all large trucks (with the exception of a 7% discount rate) and for combination-unit trucks only, but not for single-
1 As described in the body of the report, most published data showed the cost of automatic emergency braking systems was between $2,400 and $2,600. However, Ricardo et al. (2013) conducted a cost-weight analysis of the systems and found significantly lower costs. Thus, the research team used the Ricardo et al. (2013) results as a lower-bound cost estimate.

viii
unit trucks only.
Table 2. Sensitivity Analyses for Retrofitting the Entire U.S. Fleet of Large Trucks with Automatic Emergency Braking Systems and Using a $13,260,000 Value of a Statistical Life
Low Cost Average Cost High Cost
0% 3% 7% 0% 3% 7% 0% 3% 7% All Large Trucks – High Efficacy 5.13 4.90 4.61 1.24 1.19 1.12 1.04 1.00 0.94
All Large Trucks – Low Efficacy 2.93 2.80 2.63 0.71 0.68 0.64 0.60 0.57 0.54
Only CUTs – High Efficacy 5.64 5.41 5.11 1.35 1.31 1.24 1.14 1.10 1.04
Only CUTs – Low Efficacy 3.22 3.09 2.92 0.77 0.75 0.71 0.65 0.63 0.60
Only SUTs – High Efficacy 4.17 3.95 3.69 1.02 0.97 0.91 0.86 0.82 0.76
Only SUTs – Low Efficacy 2.38 2.26 2.11 0.58 0.55 0.52 0.49 0.47 0.44
Benefit-Cost Analysis Results: Only New Vehicles Equipped with Automatic Emergency Braking Systems
Table 3 shows the benefit-cost ratios for automatic emergency braking systems when only equipping new trucks. As shown in Table 3, a low-cost automatic emergency braking system was cost-effective with the lower 16% efficacy rate. However, with the higher 28% efficacy rate, $2,500 and $3,000 systems were also estimated to be cost-effective.
Table 3. Benefit-Cost Ratios for Automatic Emergency Braking Systems Installed on New Trucks Only by Vehicle Type, Efficacy Rate, Cost, and Discount Rate
Low Cost Average Cost High Cost
0% 3% 7% 0% 3% 7% 0% 3% 7% All Large Trucks – High Efficacy 6.09 5.67 5.27 1.62 1.49 1.36 1.37 1.26 1.15
All Large Trucks – Low Efficacy 3.48 3.24 3.01 0.92 0.85 0.78 0.78 0.72 0.66
Only CUTs – High Efficacy 6.41 5.97 5.54 1.70 1.57 1.43 1.44 1.32 1.21
Only CUTs – Low Efficacy 3.66 3.41 3.17 0.97 0.89 0.82 0.82 0.76 0.69
Only SUTs – High Efficacy 5.41 5.04 4.68 1.44 1.32 1.21 1.21 1.12 1.02
Only SUTs – Low Efficacy 3.09 2.88 2.68 0.82 0.76 0.69 0.69 0.64 0.58
Table 4 shows the sensitivity analyses for only equipping new trucks with automatic emergency braking systems using the higher value of a statistical life. The results with the lower value are shown in Appendix C. As shown in Table 4, only equipping new trucks with automatic emergency braking systems was cost-effective regardless of efficacy rate or vehicle classification when benefits were estimated using the higher value of a statistical life.

ix
Table 4. Sensitivity Analyses for Equipping All New Large Trucks with Automatic Emergency Braking Systems and Using a $13,260,000 Value of a Statistical Life
Low Cost Average Cost High Cost
0% 3% 7% 0% 3% 7% 0% 3% 7% All Large Trucks – High Efficacy 8.33 7.76 7.21 2.21 2.03 1.86 1.87 1.72 1.57
All Large Trucks – Low Efficacy 4.76 4.43 4.12 1.26 1.16 1.06 1.07 0.98 0.90
Only CUTs – High Efficacy 8.80 8.19 7.61 2.34 2.15 1.96 1.97 1.81 1.66
Only CUTs – Low Efficacy 5.03 4.68 4.35 1.33 1.23 1.12 1.13 1.04 0.95
Only SUTs – High Efficacy 7.34 6.84 6.35 1.95 1.79 1.64 1.65 1.51 1.38
Only SUTs – Low Efficacy 4.19 3.91 3.63 1.11 1.03 0.94 0.94 0.87 0.79
Discussion
This report presents the scientifically-based estimates of the societal benefits and costs of automatic emergency braking systems installed on large trucks. The current study used efficacy rates from previously published research and identified crashes that may have been prevented through the deployment of automatic emergency braking systems. Crashes were identified using 2010 to 2015 GES and FARS datasets. Benefit-cost analyses were performed using varying efficacy rates, vehicle types, system costs, and discount rates.
The results showed that automatic emergency braking systems have the potential to save many lives each year. However, the current pricing/efficacy rate used in this study did not suggest that automatic emergency braking systems were always cost effective. Only at the lowest cost considered ($500) were the systems consistently found to be cost-effective regardless of which trucks were equipped with the system. Average and high cost systems were only found to be cost-effective under some specific circumstances when only equipping new trucks.
These results provide insight into the feasibility of government regulation for large-truck automatic emergency braking systems. There was not a strong case for government regulation requiring automatic emergency braking systems for the entire U.S. fleet of large trucks given the cost/efficacy rates used in this study. However, the analyses showed that automatic emergency braking systems would be cost-effective on new combination unit trucks when analysis assumed a high efficacy rate, regardless of cost, within the range of costs considered. If the cost and efficacy of automatic emergency braking systems can be maintained at (or improved from) $2,500 and 28%, respectively, the estimated economic benefits of equipping all new large trucks with automatic emergency braking systems would be greater than the costs of doing so.
Limitations
Although the analyses used to assess the benefits and costs associated with automatic emergency braking systems were comprehensive, there were several limitations, including the following:

x
• It is possible the efficacy rates used in this study may not represent the current functionality/effectiveness of the current generation of automatic emergency braking systems. However, as the advisory panel consisted of experts with knowledge of current technology research, the efficacy rates recommended by the panel should be consistent with the current generation of systems’ efficacy rates.
• The technology costs used in this study may differ from current costs (costs typically decrease over time).
• This study used estimated crash, technology, and labor costs. It is possible that actual costs may differ and thus impact the cost-effectiveness of automatic emergency braking systems.
• The GES only included crashes that required a police accident report. However, automatic emergency braking systems may also prevent less severe crashes. Thus, these additional benefits are not accounted for in the benefit-cost analyses.
• The real-world effectiveness against different severity crashes may differ significantly. However, data limitations precluded the use of separate efficacy estimates for this study.
• These analyses did not account for reduced litigation costs associated with reduced crashes. These may be significant cost savings that were not integrated into the analyses.
• The failure to use data generated by automatic emergency braking systems (e.g., reports tracking alerts/activations) may result in missed driver coaching opportunities. Thus, maximum system efficacy may not be achieved.
• The efficacy of automatic emergency braking systems is dependent upon effective introduction, then initial and subsequent ongoing driver and management training.
• This study assumed all vehicle systems were functioning as intended. However, this is unlikely to be seen in the real world. Specifically, anti-lock brakes and foundation brakes have a direct impact on a vehicle’s ability to avoid a crash. If they are poorly maintained, the actual efficacy rates achieved would likely be lower than those used in this study.

1
Introduction
In 2015, large trucks (trucks with a gross vehicle weight rating [GVWR] of more than 10,000 pounds) were involved in 414,958 crashes that resulted in 116,000 injuries and 4,067 fatalities (Federal Motor Carrier Safety Administration [FMCSA], 2016). Decades of research have shown that, historically, between 87% and 92% of all U.S. crashes have resulted from driver errors or risky behaviors. For example, the Large Truck Crash Causation Study (FMCSA, 2006) found that approximately 87% of all large-truck crashes were the result of risky driving behaviors or errors. Similarly, Treat et al. (1979) found that human factors (i.e., recognition errors, decision errors, performance errors, and critical non-performances) were determined to be the probable cause in 92.6% of all crashes, and Hendricks et al. (2001) found that driver behavioral errors contributed to or caused 717 out of the 723 crashes examined in their research. Risky driving behaviors and errors include excessive speed, violations of speed limits, excessive lateral acceleration on curves, unplanned lane departures, frequent hard braking, close following distances, lateral encroachment, failure to yield at intersections, distracted driving, and general disobedience of the rules of the road, among others.
The AAA Foundation for Traffic Safety (AAAFTS), which is recognized as an industry leader in traffic safety research, identified the potential of advanced safety technologies (ASTs) to mitigate risky driving behaviors or errors, which in turn may help prevent large-truck crashes. ASTs may use sensors or alerts to warn a driver of a possible collision. ASTs may also actively assume control of a vehicle in situations where a driver does not react to the threat of an imminent crash. In addition, ASTs include devices that improve driver and fleet management by, for example, monitoring vehicle safety systems and drivers’ hours-of-service (HOS) status. There are a wide variety of ASTs available for large trucks, including the following:
• Forward collision warning (FCW)
• Adaptive cruise control
• Automatic emergency braking (AEB) systems
• Lane departure warning
• Blind spot warning
• Electronic stability control
• Roll stability control
• Speed limiters
• Video-based onboard safety monitoring systems
• Kinematic-based onboard safety monitoring systems
• Vehicle-to-vehicle communication and large-truck platooning systems
• Electronic logging devices
• Air disc brakes
• Brake stroke monitoring systems

2
Project Objective
The objective of this research was to provide scientifically-based estimates of the societal benefits and costs of ASTs in large trucks. To accomplish this objective, an in-depth literature synthesis of 14 ASTs was completed, an expert advisory panel informed cost and benefit estimations for all ASTs, and a benefit-cost analysis (BCA) was performed on selected ASTs. The results of this study may be used by motor carriers and the Department of Transportation (DOT) to inform decisions related to the potential regulation and implementation of ASTs. These results may also be used to promote the adoption of cost-effective ASTs. Although the Advisory Panel recommended BCAs for four ASTs, this report only presents the information pertaining to AEB systems. Information about other ASTs is provided in separate AAAFTS reports.

3
Literature Review
The general approach taken for the literature synthesis was to identify relevant documents from the broader research literature and summarize the key information regarding the costs and benefits using a structured review format.
The major information sources for the literature review were (i) Transportation Research Information Services; (ii) U.S. government departments, such as the DOT; (iii) industry groups, such as the American Transportation Research Institute and the Owner-Operator Independent Drivers’ Association; and (iv) academic journals (e.g., Accident Analysis and Prevention and the Journal of Safety Research).
All research obtained in the literature review was assessed to determine whether it contained the following detailed information: (i) a description of the AEB system features, (ii) a description of the vehicles examined, (iii) the estimated benefits of AEB systems (e.g., reduction in crashes or costs), and (iv) the estimated costs associated with AEB systems (e.g., purchase, installation, and/or maintenance). Literature that did not contain information about any of these fields was eliminated from further review. Additionally, only research pertaining to large trucks was considered. Literature that only discussed the costs and benefits of AEB systems on light vehicles was also eliminated from further review. Each relevant document was reviewed to identify the specific AEB system, vehicle type, study methodology, results related to benefits and costs, and study quality.
Some of the studies produced multiple reports, journal articles, and conference presentations (i.e., the same study was published in different journals, conference proceedings, etc.). Where possible, priority was given to a final report over journal articles and conference proceedings (which tend to provide less information). Typically, these secondary documents were removed from consideration or noted as duplicate works. In addition, the capabilities of the current generation of AEB systems vary greatly compared to prior generations. Studies conducted after the year 2000 were given priority over research published before then.
Automatic Emergency Braking Systems
AEB systems are active safety systems; i.e., technologies that preemptively assume lateral and/or longitudinal vehicle control to mitigate or prevent a crash. However, the driver still remains involved in controlling the vehicle to help mitigate or prevent the crash.
AEB systems combine a forward-looking sensor(s), driver alerts, and automatic vehicle braking. These systems are designed to reduce or prevent rear-end collisions in which the large truck strikes another vehicle (and, to a lesser extent, head-on collisions). The forward-looking sensor is used to detect a lead vehicle within a preset distance or time-to-collision. The system alerts the large-truck driver of the lead vehicle’s proximity through haptic, audible, visual, or a combination of warnings. At this point, the driver maintains control of the vehicle and can decide to reduce speed and/or steering to avoid the lead vehicle. However, if the driver does not apply the brakes or steer away from the lead vehicle, and the system detects that a crash is imminent (i.e., a crash will occur if the truck continues at the current rate of speed and headway), the AEB system will assume active control of the

4
truck’s brakes to prevent or mitigate the imminent crash.
Crash Reductions Associated with Automatic Emergency Braking Systems
The literature review identified five studies that estimated the effectiveness of large-truck AEB systems in reducing crashes. These studies are described below.
Kuehn, Hummel, and Bende (2011) analyzed 443 German truck crashes with insurance claims totaling over €15,000 (approximately $20,890). They estimated the percentage of these crashes that could have been prevented if the truck had been equipped with one of six different ASTs (including an AEB system, a turning assistant system, an intelligent rear view camera, lane departure warning, blind spot warning, and electronic stability control). The authors extrapolated these results to 18,467 German insurance claims to estimate the potential safety benefits given a 100% penetration rate across all German trucks. The authors estimated that an AEB system capable of detecting stationary and moving objects would eliminate 12% of all large-truck crashes and 52.3% of all rear-end crashes in which the large truck was the striking vehicle.
Jermakian (2012) estimated the potential number of crashes, injuries, and fatalities that might be prevented with 100% adoption of five ASTs (including blind spot warning, AEB systems, lane departure warning, electronic stability control, and roll stability control). The author used crash and injury data from the National Highway Traffic Safety Administration’s (NHTSA) General Estimates System (GES) and Fatality Analysis Reporting System (FARS) from 2004 to 2008, reviewing data from each crash and eliminating all crashes where an AST may have been ineffective (e.g., large truck was rear-ended, inclement weather, mechanical problems, off-road crashes, a crash due to an evasive maneuver, etc.). Jermakian (2012) found that AEB systems could prevent 31% (calculations included only crashes with indications that the driver braked) to 37% (calculations included crashes with no indication that the driver braked during the incident) of all rear-end crashes that involved a large truck striking the back of another vehicle. This estimate indicates that AEB systems may prevent between 26,000 and 31,000 crashes, 2,000 and 3,000 injuries, and 98 and 115 fatalities per year.
Woodrooffe et al. (2012) estimated the safety benefits of current generation AEB systems (pre-2014; braking at 0.35 g; does not brake for fixed objects), as well as next-generation AEB systems (post-2014; braking at 0.3 g for fixed objects; braking at 0.6 g for recently stopped/stopping vehicles) and future generation AEB systems (not in production at the time of the report; braking at 0.6 g for all objects). The authors’ first step was to estimate AEB system effectiveness using test track data and computer simulations to model 100% adoption across all large trucks. Next, the authors created crash scenarios using NHTSA’s GES, the Trucks Involved in Fatal Accidents dataset, and driver performance data from Nodine, Lam, Najm, Wilson, and Brewer (2011). The researchers found that current generation AEB systems reduced 16% of rear-end crashes where the large truck was the striking vehicle and 25% and 24% of the associated injuries and fatalities, respectively, resulting from this crash type. Next-generation AEB systems were found to potentially reduce 28% of all large truck striking rear-end crashes and 47% and 44% of the associated injuries and fatalities, respectively, resulting from this crash type. Future AEB systems were found to potentially reduce 40% of all large-truck striking rear-end crashes, 54% of all

5
injuries resulting from this crash type, and 57% of all fatalities resulting from this crash type.
Hickman et al. (2013) used carrier-owned data to evaluate the efficacy and costs and benefits of three onboard safety systems. The authors collected three years of vehicle and crash data from 14 fleets. The final dataset included 151,624 truck-years of operation, 13 billion vehicle miles traveled (VMT), and 88,112 crash records. Although AEB systems were not specifically studied, trucks equipped with these systems were included in the analyses. Results showed that trucks equipped with AEB systems were involved in 20.7% fewer large-truck striking rear-end and head-on crashes compared to trucks not equipped with AEB systems. However, this result was not statistically significant, most likely because of limited AEB system deployment in the fleets that participated in the study.
Birkland (2016) described the ASTs offered through Bendix. Bendix’s Wingman Advanced AEB system was among these ASTs. A large fleet that purchased Bendix’s AEB system reported that rear-end crashes were reduced by more than 50%. Furthermore, AEB systems significantly mitigated the severity in the remaining 50% of rear-end crashes.
Berg (2016) provided a description of Wabco’s OnGuard AEB system, a popular AEB system with 100,000 systems installed on trucks that have traveled a total of over 45 billion miles, and customer-reported reductions in crashes between 65% and 87%, with an 89% reduction in crash costs. However, the article did not specify the methods used to calculate these reductions. It also did not specify whether these reductions included all crashes, or if they were only for crashes related to AEB systems (i.e., rear-end, truck striking).
Automatic Emergency Braking Costs
The cost for AEB systems usually varies based on the vendor and the number of units purchased. Additionally, many vendors do not publish cost estimates. However, the NorthAmerican Transportation Association (n.d.) states that AEB systems cost approximately $2,500, excluding the costs associated with anti-lock brakes and vehicle stability systems. Similarly, the three fleets in Hickman et al. (2013) that reported costs for AEB systems estimated the price to be approximately $2,400 to $2,600 per vehicle. They also reported that the average cost of training required for system use ranged from $6.25 to $100 per driver.
Literature Review Conclusions
The published literature was reviewed to identify the costs and benefits associated with large-truck AEB systems. Appendix A provides a summary of citations for AEB systems. The literature review identified five studies that estimated the efficacy of large-truck AEB systems in reducing crashes. These studies found the efficacy of AEB systems in preventing large-truck striking rear-end crashes ranged from 16% to 52.3%. This wide range of efficacy was the result of variations in performance capabilities (i.e., braking to moving and/or stationary objects, 0.3 g to 0.6 g braking) between different generations of AEB systems. Additionally, two documents provided costs associated with AEB systems. The documents identified the costs of AEB systems as ranging from $2,400 to $2,600 per vehicle.

6
Methods
This section of the report provides an overview of the design and methods used to perform the BCAs.
Expert Advisory Panel
An Expert Advisory Panel convened May 17, 2016, at AAAFTS headquarters in Washington, D.C. The advisory panel consisted of six individuals representing various aspects of the industry, including representatives from a commercial motor vehicle carrier, trucking insurance company, FMCSA, NHTSA, and an AEB system vendor, as well as an industry safety consultant.
The purpose of this meeting was twofold: (1) to assist the research team in selecting technologies that require a BCA, and (2) to identify the appropriate efficacy rates and costs to be used in the BCAs. Following this discussion, upper- and lower- bound efficacy rates and costs were selected for each of the four ASTs.
When determining the recommended efficacy rates and cost associated with AEB systems, the advisory panel prioritized recent research, real-world studies, generation of the technology, federal regulations, efficacy/cost estimates from the U.S. (due to differences in roadway infrastructure, safety culture, and crash rates), and crash reductions for specific crash types (compared to crash reductions for all large-truck crashes). Additionally, the Advisory Panel sought to be conservative in its efficacy estimates to avoid overestimating the potential benefits and cost-effectiveness of systems.
For AEB systems, the panel recommended efficacy rates of 16% and 28% to reflect current performance capabilities of AEB systems (instead of systems that were under development). This recommendation was based on Woodrooffe et al.’s (2012) results for pre-2014 systems (i.e., braking at 0.35 g; does not brake to fixed objects) as well as the post-2014 systems (i.e., braking at 0.3 g to fixed objects; braking at 0.6 g to recently stopped/stopping vehicles). Additionally, the panel recommended a cost of $2,500 per truck based on vendor feedback, NorthAmerican Transportation Association (n.d.), and the work of Hickman et al. (2013).

7
Benefit-Cost Analysis Approach
The objective of deploying an AST is to reduce crashes and their associated fatalities and injuries. However, when faced with limited resources, industry stakeholders need to understand the positive and negative impacts associated with the deployment of each AST to make an informed decision. One tool often used to assist in the decision-making process is an economic analysis. An economic analysis is defined as “a systematic approach in determining the optimum use of scarce resources, involving comparison of two or more alternatives in achieving a specific objective under the given assumptions and constraints” (Business Dictionary, 2016). A BCA (a form of economic analysis) is the systematic process of calculating and comparing monetary benefits and costs for two purposes: (i) to determine if it is a sound investment (justification/feasibility), and (ii) to see how it compares with alternate projects (i.e., ranking/priority assignment; Transportation Economies Committee of the Transportation Research Board, n.d.). A cost-effectiveness analysis (CEA) is also a form of economic analysis in which the benefits are not expressed in monetary gains, but in outcomes.
The process of an economic analysis involves relatively straightforward steps, as shown in Figure 1.
Figure 1. Economic analysis steps.
The associated AST deployment costs, benefits, and assumptions for each of the steps mentioned above are specific to the particular stakeholder group affected by the decision (i.e., carriers or society as a whole). Federal regulations require a societal BCA of an AST before any final decision is made (i.e., the impact of an AST-related regulation on all large trucks for which the regulation is being considered).
Societal benefits and costs are likely to differ from the benefits and costs for private carriers measured in the marketplace due to imperfections in analyses arising from: (i) external economies or diseconomies where actions by one party impose benefits or costs on other groups that are not compensated for in the marketplace, (ii) a monopoly power that distorts the relationship between marginal costs and market prices, and (iii) specific taxes or subsidies.
The present study focused on the evaluation of the expected societal costs and benefits originated by the deployment of AEB systems. This type of analysis is needed to evaluate the impact of new regulations through a regulatory analysis process (e.g., such as mandating a specific AST—in this case AEB systems—on trucks). Regulatory analysis
Select AST(s) Compute CostsCompute Benefits
Conduct Economic Analysis
Select the Best Option(s)

8
requirements for the rulemaking process vary in terms of the regulating agency, rules the agency covers, and the “significant impact” of a proposed regulation. Currently, the most applied set of requirements includes those provided in Executive Order 12866 (1993), Executive Order 13563 (2011), and Office of Management and Budget (OMB) Circular A-4 (2003).
Executive Order 12866 (1993), Regulatory Planning and Review, requires “covered agencies” to conduct a regulatory analysis for “economically significant regulatory actions.” Section 1 states,
“In deciding whether and how to regulate, agencies should assess all costs and benefits of available regulatory alternatives, including the alternative of not regulating. Costs and benefits shall be understood to include both quantifiable measures (to the fullest extent that these can be usefully estimated) and qualitative measures of costs and benefits that are difficult to quantify, but nevertheless essential to consider. Further, in choosing among alternative regulatory approaches, agencies should select those approaches that maximize net benefit.” (Executive Order 12866, 1993) Section 1 (b) states that some costs and benefits are difficult to quantify, and agencies “should propose or adopt a regulation only upon a reasoned determination that the benefits of the intended regulation justify its cost.” (Executive Order 12866, 1993)
A regulatory action is classified as significant if any of four parameters are met. In most cases, the trigger criterion is when an action will have an annual effect of $100 million on the economy or adversely affect the economy as a whole or certain sectors. For the present study, the research team conducted an economic analysis for AEB systems, which would independently affect the economy by $100 million.
Executive Order 13563 (2011) is supplemental and reaffirms the principles of Executive Order 12866 (1993). This directs agencies to propose or adopt regulations after conducting an analysis that shows the benefits justified the costs.
Circular A-4 (OMB, 2003) was designed “to assist analysts in the regulatory agencies by defining good regulatory analysis, called either ‘regulatory analysis’ or ‘analysis’ for brevity, and standardizing the way benefits and costs of Federal regulatory actions are measured and reported.” (OMB, 2003) The circular specifies that “a good regulatory analysis should include the following three basic elements: (i) a statement of the need for the proposed action, (ii) an examination of alternative approaches, and (iii) an evaluation of the benefits and costs— quantitative and qualitative—of the proposed action and the main alternatives identified by the analysis.” (OMB, 2003) With regard to analytical approaches, the circular states that BCAs provide a systematic framework for identifying and evaluating the likely outcomes of alternative regulatory choices and, when possible, a major rulemaking should be supported by both types of analysis.
To comply with Circular A-4 (2003) and Executive Orders 12866 (1993) and 13563 (2011), the OMB (2003) provides guidance on the steps that need to be completed, which include the following: (i) describe the need for the regulatory action, (ii) define the baseline alternative, (iii) select the analysis period, (iv) identify alternatives, (v) identify the consequences of regulatory alternatives, (vi) quantify and monetize costs and benefits, (vii)
9
discount future benefits and costs, (ix) evaluate non-quantified and non-monetized benefits and costs, and (x) characterize uncertainty in benefits, costs, and net benefits.
NHTSA, the federal agency that governs new vehicle standards and also has the legal authority to mandate retrofitting of trucks, is in charge of completing the steps of the regulatory analysis process for the mandatory deployment of any AST. The present study completed the same steps described in Circular A-4 by using a formal economic analysis approach (OMB, 1992; 2003).
Conceptually, two options were formulated for the deployment of AEB systems. The first option assumed the agency did not issue any new rules regarding the adoption of AEB systems. These are the baselines against which costs and benefits were computed. The second option for AEB systems assumed rules were issued mandating the deployment of AEB systems. In addition, two sets of BCAs were performed for AEB systems. The first set of analyses assumed all large trucks would be equipped with AEB systems. In other words, these analyses assumed all new trucks would be equipped with AEB systems, and all old trucks would be retrofitted with AEB systems. The second set of analyses only assumed new trucks would be equipped with AEB systems. The following sections provide a brief description of the analysis period, technology and deployment costs, estimation of the target crash/injury base population, crash costs, identification of benefits as a reduction in crashes/injuries, discount rate, and expected economic indicators.
Analysis Period
According to the OMB (2003), the analysis period “should cover a period long enough to encompass all the important benefits and costs.” (page 15) The time period should be long enough to consider the costs and most of the benefits in the project. Predicting the effects of state of the art of AEB is a difficult task, especially taking into account the advancements made in the fields of connected and autonomous vehicles. There was consensus among the advisory panel that 20 years, with a 2018 base year, would be a reasonable analysis period. Selecting 2018 as the base year allowed for a lead implementation period of two years.
Technology and Deployment Costs
The costs associated with implementing AEB systems include all nonrecurring costs, such as the initial cost of the equipment and initial training, along with all recurring and operational costs, such as maintenance and additional training. These costs include everything that is needed to maintain the AEB system at operational levels. The cost of the installation and deployment of each AEB system per truck/driver per year is computed as:
𝐶𝐶𝐶𝐶𝐶𝐶𝐶𝐶𝑦𝑦 = 𝐶𝐶𝐶𝐶𝐶𝐶𝑦𝑦 + 𝐼𝐼𝑦𝑦 + 𝑇𝑇𝑦𝑦 + 𝑀𝑀𝑦𝑦
where CAEBy is the total cost of installation and deployment of AEB system per truck for year y; y is the year of the analysis period (0, 1, 2…n); AEBy is the cost of the AEB system for year y; Iy is the initial installation cost of the AEB system for year y; Ty is the training cost for year y; and My is the maintenance cost for year y. It is important to note that some costs of the AEB system hardware are directly related to the number of trucks in which the technology will be implemented, whereas other costs (e.g., training) are related to the number of drivers.
10
Technology Costs The cost of the technology is usually the most significant cost in AST implementation. This holds true for AEB systems.
Different costs can be included in the computation of the technology costs: research and development, manufacturing setup for mass production, compliance, and the marginal unit costs. For this report, the authors assumed these costs were built in to the initial cost of AEB systems (i.e., the technology provider allocated these costs over the life of the technology).
In general, three different approaches are used to identify the “real cost” of a new technology when considering a future regulation: a weight/cost tear down study, an optional equipment method, and an aftermarket computation. The weight/cost tear down study relies on experts to estimate how the technology is made, including the materials and labor involved, etc., to determine a variable cost for each piece of the AST, in this case the AEB system. A markup factor is applied for burden, fixed costs, etc. When there is not a weight/cost tear down study available, but the AST is already being sold as a stand-alone option on some vehicles, the optional equipment approach computes the “real cost of the technology” as the cost of the stand-alone option multiplied by a rule of thumb factor. Finally, the aftermarket equipment approach uses a subjective judgment based on how sophisticated the AST is, the number of competitors, and volumes produced to come up with the best price “estimation.”
When a weight cost analysis accounts for AST costs (i.e., research and development, corporate operations, marketing), the direct costs (materials and labor) are usually multiplied by a retail price equivalent. This formulation assumes the indirect costs of each technology are a fixed percentage of the AST, independent of the complexity of the technology. As a result, this analysis can underestimate the costs of less complex technologies and overestimate the cost of more complex ones. In addition, assumptions are made regarding the number of units produced by the industry when using a weight cost analysis. Thus, it is critical that the number of units for the base year of the BCA are similar to those used to compute the costs. After the literature review was completed, the research team found a weight cost analysis for AEB systems. A more detailed discussion of the cost components is discussed below.
In order to minimize the impact of the cost uncertainties, the research team used three costs: low, average, and high. The average costs were those recommended by the advisory panel, and generally corresponded to the most representative cost provided by the industry. For example, in the case of AEB systems, the lower and higher costs (including installation) reported by manufacturers varied between $2,400 and $2,600, respectively. After careful consideration, the advisory panel recommended an AEB system value of $2,500 as a base for the analysis. This cost was adopted as the average value. The lower cost was determined by the weight cost analysis, and the maximum cost corresponds to the maximum cost reported by the advisory panel.
The cost of AEB systems was related not only to the number of units produced, but also the manufacturer’s experience in producing the AEB system. Experience curves or learning curves can be used to estimate the potential reduction in costs as experience is gained in producing the technology. In general, one-factor learning curves are the most prevalent:

11
Ci = a xi-b
where Ci is the cost to produce the ith unit, B is learning rate exponent, A is the coefficient (constant), and xi is cumulative production or capacity through period i.
The curves represent the reduction in costs when a cumulative value of the production is reached. If a 92% learning curve is selected, it can be expected that costs are reduced 8% every time production is doubled.
Driver/Manager Training
Although training is not directly regulated, a BCA must identify all costs and benefits associated with a proposed alternative. Training the drivers and managers on the new technology’s capabilities and how to use it is not only a reasonable assumption, but a cost that cannot be disregarded. The training required when deploying a new technology can be subdivided into initial and recurrent training. The initial training is applicable when the technology is installed on the truck. The recurrent training is conducted by the carrier each time they have a new driver or manager (or during a refresher training course). For this study, an initial training time (generally one hour) was assumed for AEB systems. Three factors influence the needed recurrent training in further years: the complexity of AEB system, the driver attrition rate in the industry (assumed to be 100%), and the point at which the AEB system becomes integrated into basic safety training. To compute the technology and deployment cost for all trucks for year y, the costs were multiplied by the number of trucks where the AEB system will be installed or replaced and the number of drivers/managers who will receive training.
Truck Population
A critical part of any BCA is the identification of the number of vehicles where the technology will be implemented. The trucking industry is as diverse in operating characteristics as it is in the services it provides. Carriers are usually classified based on the size of the fleet, type of trucks, and type of operations and commodities they haul. There is not a unique classification system for trucks. In general, agencies classify trucks by the number of axles, their carrying capacity, or GVWR. The Federal Highway Administration’s (FHWA’s) Vehicle Inventory and Use Survey (VIUS) classifies trucks by their GVWR. As shown in Figure 2, this classification system includes eight classes ranging from 1 to 8.

12
Figure 2. Truck classifications by gross vehicle weight.
Based on this classification, trucks also can be grouped as (i) “Light Duty” (class 1 and 2 vehicles), (ii) “Medium Duty” (class 3, 4, 5, and 6 trucks), and (iii) “Heavy Duty” (class 7 and 8 trucks). Per the recommendation of the advisory panel, the majority of the analyses in this study focus only on heavy duty trucks (i.e., class 7 and 8 truck-tractor and trailers) to match the vehicle populations found in previous studies identified in the literature review.
To identify the current and future truck target population, the research team relied on three sources of information: (i) the number of vehicles registered, (ii) the number of new vehicles that entered the market, and (iii) the number of vehicle miles traveled (VMT) per year for each vehicle category. FHWA’s Office of Highway Policy Information regularly publishes Table VM1 (2014), which contains information regarding the number of vehicles registered and VMT for different types of vehicles. This table classifies vehicles as light vehicles, trucks, motorcycles, and buses. Trucks are further classified as single unit trucks (SUTs) and combination unit trucks (CUTs). SUTs include all class 3 to 8 single trucks with a GVWR of more than 10,000 pounds. CUTs include all class 7 and 8 trucks with a GVWR of more than 26,000 pounds that are designed to be used in combination with one or more trailers. Table 5 shows the number of registered vehicles, the total number of VMT, and the average annual VMT for SUTs and CUTs.

13
Table 5. Number of Registered Vehicles, VMT, and Average Annual VMT for SUTs and CUTs (adapted from Office of Highway Policy Information, 2014)
Year
Truck Single Unit 2 axle 6 tires or more Combination Trucks
Registration VMT (millions)
Average Annual
VMT Registration VMT
(millions) Average Annual
VMT 1990 4,487,000 51,901 11,567 1,709,000 94,341 55,202 1991 4,481,000 52,898 11,805 1,691,000 96,645 57,153 1992 4,370,000 53,874 12,328 1,675,000 99,510 59,409 1993 4,408,000 56,772 12,879 1,680,000 103,116 61,379 1994 4,906,000 61,284 12,492 1,681,000 108,932 64,802 1995 5,024,000 62,705 12,481 1,696,000 115,451 68,073 1996 5,266,000 64,072 12,167 1,747,000 118,899 68,059 1997 5,293,000 66,893 12,638 1,790,000 124,584 69,600 1998 5,414,000 67,894 12,540 1,831,000 128,159 69,994 1999 5,763,000 70,304 12,199 2,029,000 132,384 65,246 2000 5,926,000 70,500 11,897 2,097,000 135,020 64,387 2001 5,704,000 72,448 12,701 2,154,000 136,584 63,409 2002 5,651,000 75,866 13,425 2,277,000 138,737 60,930 2003 5,849,000 77,757 13,294 1,908,000 140,160 73,459 2004 6,161,000 78,441 12,732 2,010,000 142,370 70,831 2005 6,395,000 78,496 12,275 2,087,000 144,028 69,012 2006 6,649,000 80,344 12,084 2,170,000 142,169 65,516 2007 8,117,000 119,979 14,781 2,635,000 184,199 69,905 2008 8,228,000 126,855 15,417 2,585,000 183,826 71,113 2009 8,356,000 120,207 14,386 2,617,000 168,100 64,234 2010 8,217,000 110,738 13,477 2,553,000 175,789 68,856 2011 7,819,000 103,803 13,276 2,452,000 163,791 66,809 2012 8,190,000 105,605 12,894 2,469,000 163,602 66,262 2013 8,126,000 106,582 13,116 2,471,000 168,436 68,165 2014 8,329,000 109,301 13,123 2,577,000 169,830 65,897
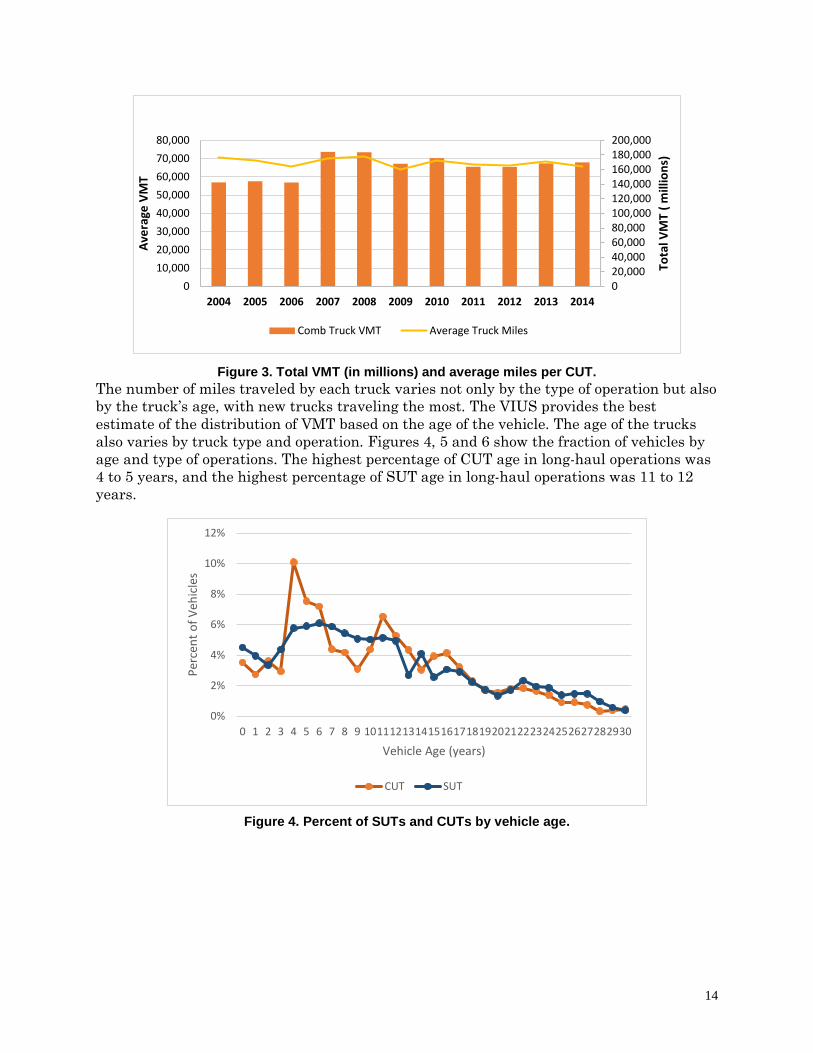
As shown in Table 5, in 2014, there were 8,329,000 SUTs registered, which traveled a total of 109.3 billion miles, with an average of 13,123 miles per SUT. In the same year, there were 2,577,000 CUTs registered that traveled 169.8 billion miles, with an average per vehicle of 65,897 miles. Since 2010, the total VMT and the average number of miles per truck have experienced only small fluctuations, as shown in Figure 3. A closer look shows that the number of registered vehicles went down after 2009 and it wasn’t until 2014 that the number reached levels similar to those in 2010.
14
Figure 3. Total VMT (in millions) and average miles per CUT.
The number of miles traveled by each truck varies not only by the type of operation but also by the truck’s age, with new trucks traveling the most. The VIUS provides the best estimate of the distribution of VMT based on the age of the vehicle. The age of the trucks also varies by truck type and operation. Figures 4, 5 and 6 show the fraction of vehicles by age and type of operations. The highest percentage of CUT age in long-haul operations was 4 to 5 years, and the highest percentage of SUT age in long-haul operations was 11 to 12 years.
Figure 4. Percent of SUTs and CUTs by vehicle age.
020,00040,00060,00080,000100,000120,000140,000160,000180,000200,000
010,00020,00030,00040,00050,00060,00070,00080,000
2004 2005 2006 2007 2008 2009 2010 2011 2012 2013 2014
Tota
l VM
T ( m
illio
ns)
Aver
age
VMT
Comb Truck VMT Average Truck Miles
0%
2%
4%
6%
8%
10%
12%
0 1 2 3 4 5 6 7 8 9 101112131415161718192021222324252627282930
Perc
ent o
f Veh
icle
s
Vehicle Age (years)
CUT SUT

15
Figure 5. Percent of CUT age by operation type.
Figure 6. Percent of SUTs by operation.
Regarding future truck populations, the U.S. Energy Information Administration (2016) predicts an annual increase of 1.5% in the number of VMT between 2016 and 2040 for trucks heavier than 10,000 pounds. Similarly, the American Trucking Associations’ (2016) U.S. Freight Transportation Forecast to 2027 predicted that truck load volumes will grow 2% annually between 2016 and 2020 and then 1.6% per year until 2027. In addition to the number of vehicles registered, it is important to know the number of new trucks that will enter the market for each truck category. Table 6 shows the number of new trucks by GVWR that were sold in the U.S.
0%
2%
4%
6%
8%
10%
12%
14%
16%
0 1 2 3 4 5 6 7 8 9 101112131415161718192021222324252627282930
Perc
ent o
f Veh
icle
s
Vehicle Age (years)
CUT Short Haul CUT Long Haul
0%
2%
4%
6%
8%
10%
12%
14%
16%
0 1 2 3 4 5 6 7 8 9 101112131415161718192021222324252627282930
Perc
ent o
f Veh
icle
s
Vehicle Age (years)
SUT Short Haul SUT Long Haul

16
Table 6. New Retail Truck Sales by GVWR (Adapted from Davis, Diegel, & Boundy, 2016)
Year New Retail Sales (Thousands)
Class 1 Class 2 Class 3 Class 4 Class 5 Class 6 Class 7 Class 8
1990 3,451 1,097 21 27 5 38 85 121 1991 3,246 876 21 24 3 22 73 99 1992 3,608 1,021 26 26 4 28 73 119 1993 4,119 1,232 27 33 4 27 81 158 1994 4,527 1,506 35 44 4 20 98 186 1995 4,422 1,631 40 53 4 23 107 201 1996 4,829 1,690 52 59 7 19 104 170 1997 5,085 1,712 53 57 9 18 114 179 1998 5,263 2,036 102 43 25 32 115 209 1999 5,707 2,366 122 49 30 48 130 262 2000 5,965 2,421 117 47 29 51 123 212 2001 6,073 2,525 102 52 24 42 92 140 2002 6,068 2,565 80 38 24 45 69 146 2003 6,267 2,671 91 40 29 51 67 142 2004 6,458 2,796 107 47 36 70 75 203 2005 6,586 2,528 167 49 46 60 89 253 2006 6,136 2,438 150 50 49 70 91 284 2007 5,682 2,623 166 51 45 54 70 151 2008 4,358 1,888 135 36 40 39 49 133 2009 3,528 1,306 112 20 24 22 39 95 2010 4,245 1,513 161 12 31 29 38 107 2011 4,714 1,735 195 10 42 41 41 171 2012 5,164 1,811 223 9 55 40 47 195 2013 5,615 2,077 254 12 60 47 48 185 2014 6,209 2,275 264 13 67 52 54 220 2015 7,161 2,417 283 24 72 55 59 249
Classes 7 and 8 correspond to trucks heavier than 26,000 pounds and the information does not differentiate between SUTs and CUTs. However, NHTSA estimates that on average, 80% of class 8 and 10% of class 7 trucks correspond to CUTs and the rest are SUTs. Since 2010, the number of new class 3 to 8 vehicles increased significantly, with an average of 47,800 new class 7 and 188,000 new class 8 trucks for the period 2010 to 2015. Dividing by the estimated proportion of class 7 and 8 CUTs, the average number of retail sales for CUTs has been 80,000 and 155,000 vehicles per year, respectively. However, since the beginning of 2016, it was predicted that heavy-truck demand in the previous years would begin to weaken (IHS Markit, 2016). Additionally, reductions between 29% and 39% on class 8 orders have been reported (Shedlock, 2016). Analysts point to an excessive number of new vehicles in stock, weakening pressure to replace older trucks, and a generally weak freight environment as potential reasons for this decline in sales.

17
Identifying Safety Benefits as a Reduction in the Number of Crashes/Injuries/Fatalities
One of the main objectives in the study was to quantitatively evaluate the safety impact of ASTs. (This report evaluates AEB systems specifically.) As described above, two alternatives were formulated to assess the potential cost of AEB systems: no AEB system deployment and AEB system deployment. Circular A-4 requires a BCA and a CEA to evaluate the benefits and costs of the alternatives proposed. The BCA assigns a monetary value to the benefits and costs of the alternatives and uses economic indicators to evaluate the feasibility of implementing the specific alternative. The CEA, on the other hand, is expressed as a ratio where the denominator is a quantitative measure of the benefits and the numerator is the expected cost to be able to reach those benefits. For the BCA, the criterion is that the present and future value of the benefits must be greater than the present and future value of the costs. This can be expressed as the Net Value (benefit/costs greater than zero) or as a Benefit-Cost Ratio (BCR; benefit/cost greater than 1)
The CEA for vehicle safety is measured as equivalent fatalities or equivalent lives saved. The final goal is not only to justify the proposed alternative but to be able to select among different alternatives or proposed regulations to guarantee society the best allocation of the limited resources.
In the BCA, the safety benefits of AEB systems were computed as the difference in number of crashes/number of injury severity types (fatality equivalent) for both options (without mandatory AEB system deployment and with mandatory AEB system deployment) for each year over the period of the analysis:
𝐶𝐶𝐶𝐶𝐶𝐶𝐶𝐶 = �(𝑁𝑁𝑗𝑗𝑗𝑗𝑗𝑗 − 𝑁𝑁𝑗𝑗𝑗𝑗1) ∗ 𝐶𝐶𝐶𝐶𝑗𝑗𝑗𝑗𝑗𝑗,𝑗𝑗
where AACC was the average annual cost; j was the type of crash/injury the AEB system was expected to prevent; i was the severity of the crash or type of the injury; N ji0 was the number of crashes/injuries by severity i without mandatory AEB system deployment; N jiN was the number of crashes/injuries by severity i with mandatory AEB system deployment; and CCji was the crash cost for type j and severity i crashes. To identify the number of crashes that can be prevented by the deployment of AEB systems, the research team identified the types of crashes that were preventable by AEB systems and selected the efficacy rate of AEB systems.
Types of Crash/Crash Scenarios Preventable by Automatic Emergency Braking Systems AEB systems have the capability of preventing only some types of crashes/crash scenarios. Specifically, the installation of an AEB system is expected to reduce rear-end collisions in which the truck is striking another vehicle and, to a much lesser extent, head-on collisions. In general, the crashes preventable by AEB systems exclude crashes when the driver is incapacitated or crashes due to a vehicle malfunctioning (e.g., faulty brakes). To identify the type and number of preventable crashes, the research team identified the different variables and pre-crash scenarios in different crash databases.
For this study, the Advisory Panel recommended that AEB systems only be considered

18
effective at preventing large-truck striking rear-end crashes. Any future descriptions of crashes prevented by AEB systems refer back to this crash type only. Thus, when indicating reduction in crashes for AEB systems, we are only referring to reduction in large-truck striking rear-end crashes.
Crash Databases When societal impacts are considered, the target population refers to the total number of reported crashes (i.e., by crash type, by crash severity, by injury severity) by vehicle type that can be affected by the deployment of AEB systems. To this end, national crash databases are used as a tool to identify the target population and its subgroups. These crash databases include the FARS, GES, and the Motor Carrier Management Information System (MCMIS). The FARS database is usually recommended to identify the total number of fatal crashes and fatalities. The GES database has the limitation that it is an estimation of nonfatal injury crashes and property damage only (PDO) crashes. The MCMIS database includes truck crashes that are reported to FMCSA by the states and has the limitation that, to be reported, the crash at a minimum needs to be a tow-away crash, involve a fatality, or cause an injury that results in transportation to a hospital.
The research team decided to use the FARS database to determine the number of fatal crashes and their associated fatalities and injuries, and the GES database as an estimation for injury and PDO crashes. The GES database was also used to estimate the number of injuries as a result of injury crashes. Queries were developed for AEB systems and information was extracted for different vehicle types for a period of six years (2010 to 2015; see Appendix B for the list of crash filtering criteria).
When filtering the GES and FARS crashes, the research team carefully considered the scenarios in which AEB systems may have prevented the crash. Additionally, the research team used the following GES/FARS variables to further limit crashes that may have been prevented by AEB systems: pre-event movement, critical event, and first harmful event. Finally, all crashes that involved the use of alcohol or drugs by the large-truck driver were eliminated.
The research team generated the two matrixes shown in tables 7 and 8. The GES and FARS used a five-point KABCO severity scale to define the severity of injuries for all persons involved in a crash. Since many crashes have more than one injury, the worst severity was used to characterize the severity of the crash. Values for the KABCO scale are as follows: K = fatal; A = incapacitating injury; B = non-incapacitating injury; C = possible injury; O = no injury.
Table 7. Total Number of Crashes by Crash Type and Maximum Injury Severity (Example) Body Type Fatal Crashes Injury Crashes PDO Crashes
X X X X X X X X X

19
Table 8. Number of Injured Persons for Each Crash Type and Injury Severity (Example)
Crash Type Crashes Police Reported Number of
Persons Injured K A B C O U PDO
The number of crashes and injuries shown in tables 7 and 8 corresponds to crashes that may be prevented by AEB systems if the efficacy rate is 100%. In order to realistically estimate the number of crashes that may be prevented by AEB system deployment, the AEB system efficacy rate must be considered.
Efficacy of Automatic Emergency Braking Systems The efficacy rate of AEB systems corresponds to their capability to reduce the collision probability and/or severity of the crash types prevented with the technology. Efficacy is usually expressed as a percentage or reduction in number of crashes/fatalities/injuries, or as an expected crash rate (crashes per VMT). Independent of the method of measuring effectiveness, the efficacy rate is usually expressed as a range and not as a specific value. For the present study, the advisory panel selected an efficacy range. Thus, economic indicators will be presented for the lower and higher efficacy rates. It is important to note that most of the studies in the literature review did not differentiate the efficacy rate by the severity of the crash (fatal, different type of injuries, or property damage). To this end, the research team applied the same efficacy rate to fatal crashes, injury crashes, type of injuries, and PDO crashes. The authors note that real-world effectiveness against different severities of injuries may differ, but data limitations precluded development of separate efficacy estimates for AEB systems at the time of this study.
Expected Number of Crashes/Injuries/Fatalities Preventable by Automatic Emergency Braking Systems The number of preventable crashes by crash type and injury severity for the base year was computed as:
𝑁𝑁𝑗𝑗𝑗𝑗𝑗𝑗𝑗𝑗𝑗𝑗𝑗𝑗(𝑁𝑁𝑗𝑗 𝐴𝐴𝐴𝐴𝐴𝐴−𝐴𝐴𝐴𝐴𝐴𝐴) = �(𝑁𝑁𝑗𝑗𝑗𝑗𝑦𝑦) ∗1𝑦𝑦∗ 𝐶𝐶𝐶𝐶𝐶𝐶𝑗𝑗𝑒𝑒𝑒𝑒𝑗𝑗𝑗𝑗 ∗ (𝐺𝐺𝑅𝑅)𝑗𝑗𝑗𝑗𝑗𝑗
𝑦𝑦
where, Njibase was the number of type j, category i crashes preventable by an AEB system for the base year. Crash type j corresponds to the specific type of crash avoided by the technology; y was the number of years of crash data. Njiy was the total number of type j, category i crashes preventable for year y by an AEB system. AEBeffj was the efficacy of an AEB system for crash j, category i; and GRbas was a growth factor (if any) that was applied due to the lead time.
Change of Crash Frequency Over Time It is generally accepted that there is a direct relationship between the exposure to traffic and the number of crashes. If all conditions remain equal, the number of crashes in a fleet population will increase if the number of vehicles or the mileage increases. However, it is also important to recognize that advancements in vehicle and road safety will reduce the number of crashes. Unfortunately, the latest statistics have shown an increase in the

20
number of crashes despite those improvements and without an increase of the VMT. From 2004 to 2009, there were significant reductions in the number of crashes (likely due to the recession). During that period, large-truck fatal and injury crashes declined 33% and 37%, respectively. However, the situation reversed during the period 2010 to 2015 (when the economy improved), as shown in Table 9.
Table 9. Fatal, Injury, and PDO Crash Rates from 2010 to 2015 (Data from 2010-2015 GES) Fatal Injury PDO VMT Fatal
rate Injury rate
PDO rate
2010 3,271 56,000 207,000 286,527 1.14 19.54 72.24 2011 3,365 60,000 210,000 267,594 1.26 22.42 78.48 2012 3,486 73,000 241,000 269,207 1.29 27.12 89.52 2013 3,554 69,000 254,000 275,017 1.29 25.09 92.36 2014 3,424 82,000 326,000 279,132 1.23 29.38 116.79 2015 3,598 83,000 328,000 279,844 1.29 29.65 117.21
As a result of discussions with the advisory panel, a conservative approach (fewer crashes resulting in fewer benefits) was chosen. This approach, which assumed the number of crashes or the rate of crashes would remain constant at the 2004–2009 baseline average, would likely produce a conservative estimate of benefits. In other words, this approach provided lower cost-effectiveness estimates to reflect the AEB system possibilities with lower crash rates.
Crash Costs
Components of the societal or public cost of truck crashes included costs associated with property damage, increases or changes in emissions, and personal costs related to fatalities or injuries, medical expenses, lost productivity due to injuries, and emergency services. The Value of Statistical Life (VSL) attempts to measure the value that consumers place on their lives as computed by the price that they are willing to pay to avoid death. Although VSL is a good indicator of the cost of a fatality, the reality is that most of the crashes involved only injury victims or no injuries at all. To estimate the cost of injuries and the different type of injuries, the same willing-to-pay studies can be used to estimate the quality adjusted life years (QALYs). This indicator uses a value of 1 for perfect health in a good year and a value of 0 when death occurs. These costs do not cover the unexpected costs that arise from the injury related to medical costs, legal costs, emergency services, congestion costs, emissions, and/or property damage. The deterioration of good health when someone suffers an injury is measured by estimating the QALYs. QALYs is a function of the VSL and has been used in previous studies, using an updated VSL value and the Employment Cost Index.
Regarding the VSL monetary value, the U.S. DOT annually publishes the Guidance on Treatment of the Economic Value of a Statistical Life in U.S. Department of Transportation Analyses (USDOT, 2015). This document provides guidance on the revised VSL, indicates how the VSL needs adjustment, and determines how to account for uncertainties. Because it is expected that safety regulations affect a broad cross section of people, the U.S. DOT considers only a single nationwide VSL regardless of age, income, the mode of travel, or nature of risk. The latest Guidance, issued in 2015, establishes a VSL economic value of

21
$9.4 million (base year 2014).
For this study, FMCSA provided the research team with new cost estimates (soon to be released) of crashes per victim and cost per crash per truck. These costs are in 2014 dollars with a VLS value of $9.4 million. To update the cost, NHTSA recommended using the consumer price index (CPI). This index represents changes of all goods and services purchased for consumption by urban households. To this effect, the Bureau of Labor Statistics provides the CPI inflation calculator that uses the average CPI for a given calendar year. The CPI ratio for 2015 to 2014 was 1. Thus, the values provided by FMCSA were considered the values to use in the BCA.
As shown in Table 10, the average cost of a fatal CUT crash was estimated as $11,313,000 (in 2014 dollars), $11,175,000 of which was the monetized QALY component. The remaining $138,000 comprised medical costs, emergency services, property damages, lost productivity from roadway congestion, environmental costs, and fuel consumption. Similarly, a CUT injury crash had an average cost of $540,000. This included a monetized QALY of $476,000, plus $64,000 for medical costs, emergency services, and property damage. These values correspond to an average number of 1.192 fatalities per fatal crash and an average number of 1.38 injuries per injury crash.
Table 10. Average Crash Cost by Crash Severity for CUTs Severity Average Cost
All $383,000 Fatal $11,313,000 Injury $540,000 Unknown and No Injury $117,000
In this study, the authors used the disaggregate crash costs by severity, as the number of fatalities and injuries differed among the total crashes and the specific crash types (see Table 11). For example, the cost of an incapacitating or serious injury resulted in $52,100 in medical costs, $400 in emergency services, and $853,600 in QALY. Similar to the Maximum Abbreviated Injury Severity (MAIS) scale described below, the VSL fraction provided a coefficient to estimate (when multiplied by the VSL) the cost of an injury as a fraction of a fatality.
Table 11. Average CUT Crash Cost Per Victim Per Severity Type
Severity Medical Costs
Emergency Services VSL Fraction Monetized
QALY Fatality $41,600 $1,300 1 $9,400,000 Incapacitating Injury $52,100 $400 0.0908 $853,600 Non-incapacitating Injury $18,000 $200 0.0298 $279,800 Possible Injury $11,500 $200 0.0196 $184,400 Unknown and No Injury $800 $100 0.0047 $43,800 Injury, Severity Unknown $6,600 $200 0.0124 $117,000
Similarly, an injury crash results, on average, in $20,000 in property damage, $43,000 in lost productivity and roadway congestion, and $3,000 in environmental costs and fuel as

22
shown in Table 12.
Table 12. Average Cost by Crash Severity for Property Damage, Lost Productivity and Roadway Congestion, and Environmental Costs and Fuel
Type of Crash Property Damages Lost Productivity Roadway Congestion
Environmental Cost and Fuel
All $11,000 $14,000 $1,000 Fatal $20,000 $43,000 $3,000 Injury $20,000 $16,000 $1,000 Unknown and No Injury $8,000 $13,000 $1,000
Expected Number of Equivalent Lives Saved
Circular A-4 (2003) states that when conducting a regulatory analysis, agencies should use both BCA and CEA. The computation of the number of lives saved by each AST constitutes an excellent tool to compare each AST’s efficacy. The circular describes CEA as a way “to identify options that achieve the most effective use of the resources available without requiring monetization of all of relevant benefits or costs” (pp. 11). Nonfatal injuries as a result of crashes vary widely in severity and probability, but still result in losses of the quality of life and reduction of income. Thus, capturing the “value” of these injuries is essential to conducting a CEA. As mentioned before, the VSL attempts to capture the additional cost that individuals are willing to pay for improvements in safety (reduction of risks) that in aggregate reduce the number of fatalities by one.
To translate the different nonfatal injuries to “equivalent fatalities,” the U.S. DOT rated each type of accidental injury on a scale of QALYs in comparison with the alternative of perfect health. Scores were then aggregated using the Abbreviated Injury Scale (AIS), and as a result, each MAIS is associated with a coefficient that can be applied to the VSL as a corresponding fraction of a fatality, as shown in Table 13 (Spicer & Miller, 2010). These values, expressed as a fraction of VSL, can be used to convert the number of injuries to equivalent fatalities.
Table 13. MAIS Scales/Fatality Fraction MAIS Scale Severity Fraction of VSL
1 Minor 0.03 2 Moderate 0.047 3 Serious 0.105 4 Severe 0.266 5 Critical 0.593 6 Unsurvivable 1
KABCO and AIS Scales are not directly related (i.e., an injury observed and a reported crash could be more or less severe than originally reported). Thus, it was necessary to apply a KABCO/AIS Data Conversion Matrix to convert the number of injuries under the KABCO system to the MAIS number (Table 14).

23
Table 14. KABCO/MAIS Data Conversion Matrix KABCO MAIS
O C B A K U No Injury
Possible Injury
Non- Incapacitating Incapacitating Killed
Injury Severity Unknown
Unknown if Injured
0 0.9254 0.23437 0.08347 0.03437 0.000 0.21538 0.43676 1 0.07257 0.68946 0.76843 0.55449 0.000 0.62728 0.41739 2 0.0198 0.06391 0.10898 0.20908 0.000 0.10400 0.08872 3 0.00008 0.01071 0.03191 0.14437 0.000 0.03858 0.04817 4 0.0000 0.00142 0.0620 0.03986 0.000 0,00442 0.00617 5 0.00003 0.00013 0.00101 0.01783 0.000 0.01034 0.00279 Fatality 0.0000 0.000 0.000 0.000 1.000 0.000 0.000 Probability 1.00 1.00 1.00 1.00 1.00 1.00 1.00
The usefulness of this matrix can be seen with crashes classified as non-incapacitating (i.e., KABCO scale “B”). Using the MAIS matrix reveals that only 8.3% of these crashes would be classified as MAIS 0 (i.e., no injury), and 76.8% of crashes would be classified as MAIS 1 (i.e., minor injury), 10.8% would be classified as MAIS 2, etc. Additionally, the total of MAIS 1 injuries was the sum of 7.257%, 68.946%, 76.843%, 55.449%, 62.728% and 41.739% of the total number of the O, C, B, A, and U categories, respectively. This study obtained the number of equivalent fatalities that may be prevented by the installation of AEB systems by multiplying the crashes by the relative fatality ratios shown in Table 13. This matrix also can be used to compute the crash costs by multiplying the relative fatality ratios per the VSL, and adding the cost of property damage, lost productivity from roadway congestion, and environmental cost and fuel. Although the authors calculated both of these values as a verification measure, the crash costs reported are those obtained from FMCSA, as previously noted (soon to be released).
Annual Incremental Cost Analysis
The standard practice described above assumes a constant rate of crashes over the analysis period reflecting the useful life of the AEB system/vehicle. The costs of crashes for each year are discounted to reflect the net present value (NPV) of those yearly benefits on the base year. Similarly, the costs of the installation, maintenance, and training are also discounted by the same factors. This discount factor is discussed in more detail below.
The period between when an AEB system is installed and when the crash may be prevented follows an empirical distribution that indicates the safety benefits can occur at any point during the vehicle’s lifetime. If it can be assumed a constant number of vehicles experience a constant number of crashes, the previous methodology may be refined. To capture this lag on time, it can be assumed that the distribution of the VMT can be used as a proxy for the distribution of crashes (see Table 15). A survival probability may be used to represent a large number of vehicles across the population in question. As a result, the probability of the crash occurring will depend on the percent of miles traveled per each year of life multiplied by the survival probability. Furthermore, the cumulative percentage of VMT should be used when analyzing the number of vehicle life years. A more detailed description of this procedure can be found in Kirk (2009).

24
Table 15. Survival Probability and Annual VMT
Year Total
Annual Miles
Traveled Survivability
Weighted Miles
Traveled
% Total Weighted
Miles
Raw Discount Rate Discount Rate
3% 7% 3% 7%
1 240,737 1 240,737 0.10 0.985329 0.966736 0.097713 0.09587
2 226,110 0.993 224,527.2 0.09 0.95663 0.903492 0.08848 0.083565
3 212,378 0.981 208,342.8 0.09 0.928767 0.844385 0.07971 0.072468
4 199,486 0.9642 192,344.4 0.08 0.901716 0.789145 0.071446 0.062527
5 187,381 0.9432 176,737.8 0.07 0.875452 0.737519 0.063737 0.053695
6 176,017 0.9181 161,601.2 0.07 0.849954 0.68927 0.056581 0.045884
7 165,346 0.8894 147,058.7 0.06 0.825198 0.644177 0.049989 0.039023
8 155,327 0.8575 133,192.9 0.05 0.801163 0.602035 0.043957 0.033032
9 145,919 0.823 120,091.3 0.05 0.777828 0.562649 0.038479 0.027834
10 137,085 0.786 107,748.8 0.04 0.755173 0.525841 0.033519 0.02334
11 128,789 0.7473 96,244.02 0.04 0.733178 0.49144 0.029068 0.019484
12 120,999 0.7071 85,558.39 0.04 0.711823 0.45929 0.025088 0.016187
13 113,683 0.666 75,712.88 0.03 0.69109 0.429243 0.021554 0.013388
14 106,813 0.6244 66,694.04 0.03 0.670961 0.401161 0.018434 0.011021
15 100,360 0.5826 58,469.74 0.02 0.651419 0.374917 0.01569 0.00903
16 94,300 0.5411 51,025.73 0.02 0.632445 0.35039 0.013294 0.007365
17 88,609 0.5003 44,331.08 0.02 0.614025 0.327467 0.011213 0.00598
18 83,263 0.4604 38,334.29 0.02 0.59614 0.306044 0.009414 0.004833
19 78,242 0.4217 32,994.65 0.01 0.578777 0.286022 0.007867 0.003888
20 73,526 0.3845 28,270.75 0.01 0.56192 0.267311 0.006544 0.003113
21 69,096 0.349 24,114.5 0.01 0.545553 0.249823 0.005419 0.002482
22 64,935 0.3152 20,467.51 0.01 0.529663 0.23348 0.004466 0.001969
23 61,026 0.2835 17,300.87 0.01 0.514236 0.218205 0.003665 0.001555
24 57,354 0.2537 14,550.71 0.01 0.499258 0.20393 0.002993 0.001222
25 53,905 0.226 12,182.53 0.01 0.484717 0.190589 0.002433 0.000956
26 50,664 0.2004 10,153.07 0.00 0.470599 0.17812 0.001968 0.000745
27 47,620 0.1769 8,423.978 0.00 0.456892 0.166468 0.001585 0.000578
28 44,759 0.1554 6,955.549 0.00 0.443584 0.155577 0.001271 0.000446
29 42,072 0.1359 5,717.585 0.00 0.430665 0.145399 0.001014 0.000342
30 39,547 0.1183 4,678.41 0.00 0.418121 0.135887 0.000806 0.000262
31 37,175 0.1025 3,810.438 0.00 0.405943 0.126997 0.000637 0.000199
32 34,945 0.0884 3,089.138 0.00 0.394119 0.118689 0.000502 0.000151
33 32,851 0.0759 2,493.391 0.00 0.38264 0.110924 0.000393 0.000114
34 30,883 0.0649 2,004.307 0.00 0.371495 0.103668 0.000307 8.56E-05
35 29,033 0.0552 1,602.622 0.00 0.360675 0.096886 0.000238 6.4E-05
Total 3,530,235 2,427,562 0.35017 0.809473 0.642697
To determine the weighted discount factors, the authors multiplied the fraction of the weighted VMT that occurred in each year by the discount factors in that year. For example, the weighted discount factor for a vehicle 10 years old and a 3% discount rate was 0.0310.

25
This was obtained by multiplying the fraction of total weighted VMT (0.04) by the proportion discount factor associated with a 3% discount rate at year 10 (0.7552). Figure 7 shows the plotted undiscounted and discounted distribution of the weighted VMT versus the vehicle age.
Figure 7. Distribution of weighted VMT by survival rate as a surrogate of probability of crash
occurrence. Figure 7 shows that the undiscounted distribution has a top value of 1 and the discounted distribution maximum value, or lifetime discount factor, was 0.809 for a 3% discount rate and 0.642 for a 7% discount rate. These discounts represent the lag between the investment and the return. Figure 7 also shows that all the undiscounted and discounted distributions flatten around 20 years. If a constant number of vehicles and crashes is assumed, this equals the linearized distribution for an analysis period of 20 years.
Benefit-Cost Analysis Measures
This section describes the BCA measures developed to compare the benefits and costs in implementing AEB systems, including NPV, BCR, and sensitivity analysis.
Discount Rate The discount rate is the rate of discounts, in the present value (PV), of the cost and benefits in any future year. The discount rate is used to compute the PV of future costs and benefits using the following formula (OMB, 2003):
𝑃𝑃𝑃𝑃 =𝑃𝑃𝑦𝑦
(1 + 𝑟𝑟)𝑛𝑛
where PV is the present value of the amount invested; Py is the dollar value of the future amount in time y; r is the discount rate; and y is the year in which Py is computed (0, 1, …
0
0.2
0.4
0.6
0.8
1
1.2
0 5 10 15 20 25 30 35 40
Prop
ortio
n
Truck Age
Cumulative Distribution of Weighted VMT
Undiscounted 3% 7%

26
n). The higher the discount rate, the lower the PV in future costs and benefits. A real discount rate of 7% will be used per OMB (2003) recommendations. The OMB (2003) also recommends conducting a sensitivity analysis to show the impact of discount rate variation (using 0%, 3%, and 7%).
Net Present Value The NPV is the current value of all projected PV benefits minus the sum of all projected PV costs. If the NPV is greater than zero (“0”), it can be assumed that equipping the truck with an AEB system is a good alternative. The NPV was calculated as follows (OMB, 1992; Pearce et al. 2006):
𝑁𝑁𝑃𝑃𝑃𝑃 = �(𝐶𝐶𝐵𝐵𝐵𝐵𝐵𝐵𝐵𝐵𝐵𝐵𝐵𝐵𝐵𝐵𝑦𝑦−𝐶𝐶𝐶𝐶𝐵𝐵𝐵𝐵𝑦𝑦)
(1 + 𝑟𝑟)𝑦𝑦
𝑌𝑌
𝑦𝑦=1
where Benefitsy are the expected benefits for the year y and were computed as:
𝐶𝐶𝐵𝐵𝐵𝐵𝐵𝐵𝐵𝐵𝐵𝐵𝐵𝐵𝐵𝐵𝑦𝑦 = 𝐶𝐶𝑟𝑟𝐶𝐶𝐵𝐵ℎ 𝐶𝐶𝐶𝐶𝐵𝐵𝐵𝐵𝐵𝐵𝑦𝑦0 − 𝐶𝐶𝑟𝑟𝐶𝐶𝐵𝐵ℎ 𝐶𝐶𝐶𝐶𝐵𝐵𝐵𝐵𝐵𝐵𝑦𝑦1
Crash Costsy0 were the expected crash costs for the year y without mandatory AEB system deployment, and Crash Costsy1 were the expected crash costs for the year y with mandatory AEB system deployment. The crash costs will be divided by VSL. Costy was the expected cost for the year y and was computed as:
𝐶𝐶𝐶𝐶𝐵𝐵𝐵𝐵𝑦𝑦 = 𝐶𝐶𝐶𝐶𝐵𝐵𝐵𝐵𝑦𝑦1 − 𝐶𝐶𝐶𝐶𝐵𝐵𝐵𝐵𝑦𝑦𝑗𝑗
where Costy1 is the expected total cost of installing and operating the AEB system for the year y with mandatory AEB system deployment; Costy0 is the expected total cost of installing and operating the AEB system for the year y without mandatory AEB system deployment; r is the discount rate; and y is the year in which Cy is computed (0, 1, …n).
Benefit–Cost Ratio The BCR was calculated as the NPV of benefits divided by the NPV of costs. If the BCR exceeds 1, the benefits of installing the AEB system are higher than the costs incurred in buying, installing, and maintaining the AEB system. The BCR was calculated as follows (OMB, 2003):
𝐶𝐶𝐶𝐶𝑅𝑅 =∑
𝐶𝐶𝑦𝑦(1 + 𝑟𝑟)𝑛𝑛
𝑛𝑛𝑦𝑦=1
∑𝑐𝑐𝑦𝑦
(1 + 𝑟𝑟)𝑛𝑛𝑛𝑛𝑦𝑦=1
where BCR is the BCR in implementing AEB systems over a period of analysis n assuming a rate of return r; By is the benefit associated with implementing AEB systems in year y; Cy is the cost associated with implementing AEB systems in year y; r is the discount rate; and n is the number of years for the analysis period.
27
Cost-Effectiveness Analysis The cost-effectiveness (CE) was calculated as the total number of equivalent fatalities that would be avoided by the installation and deployment of AEB systems divided by the NPV of costs. The CE was calculated as follows (OMB, 2003):
𝐶𝐶𝐶𝐶 =∑
𝑁𝑁𝐶𝐶𝑦𝑦 ∗(1 + 𝑟𝑟)𝑛𝑛
𝑛𝑛𝑦𝑦=1
∑𝐶𝐶𝐹𝐹𝑦𝑦
(1 + 𝑟𝑟)𝑛𝑛𝑛𝑛𝑦𝑦=1
where CE was the cost of each fatality prevented by implementing AEB systems over a period of analysis n and a rate or return r; NCy was the net cost associated with implementing AEB systems in year y; EFy was the benefit associated with implementing AEB systems (in this case equivalent saved lives) in year y; r was the discount rate; and n was the number of years for the analysis period.
NCosty is the expected net cost for the year y and was computed as:
𝑁𝑁𝐶𝐶𝐶𝐶𝐵𝐵𝐵𝐵𝑦𝑦 = 𝐶𝐶𝐶𝐶𝐵𝐵𝐵𝐵𝑦𝑦1 − 𝐶𝐶𝐶𝐶𝐵𝐵𝐵𝐵𝑦𝑦𝑗𝑗 − 𝐶𝐶𝑟𝑟𝐶𝐶𝐵𝐵ℎ 𝐶𝐶𝐶𝐶𝐵𝐵𝐵𝐵 −𝑉𝑉𝑉𝑉𝑉𝑉𝑦𝑦0 + 𝐶𝐶𝑟𝑟𝐶𝐶𝐵𝐵ℎ 𝐶𝐶𝐶𝐶𝐵𝐵𝐵𝐵 −𝑉𝑉𝑉𝑉𝑉𝑉1
Crash Cost –VSLy was the crash cost minus the monetized VLS component.
Sensitivity Analysis
A sensitivity analysis was performed to examine how changes in the assumptions affected the outputs of the BCA or robustness of the results. The sensitivity analysis was conducted using $5,304,000 and $13,260,000 for low and high estimates of VSL values, and discount rates from 3% to 7% were applied.

28
Results
This section details the benefits and costs of AEB systems and the results of the BCA.
Technology and Deployment Costs per Truck
In a BCA, the costs associated with implementing AEB systems in each truck must include all the recurring and nonrecurring costs. Costs can also be subdivided into hardware, training, and maintenance. The hardware costs include the costs associated with installing the system in an in-service truck or the added cost to the value of a new truck. Additionally, the hardware may not have the same service life of the truck, which may necessitate replacing the hardware. The training costs refer to any kind of personnel training needed to ensure that the system is being used appropriately. The maintenance costs include annual costs required to keep the system operative. In general, the AEB system’s normal maintenance costs are very small and may be covered in the routine maintenance of the truck.
As discussed in the literature review, the published literature estimated AEB system initial installation costs to range from $2,400 to $2,600 per truck. However, Ricardo Inc. (2013) identified much lower system costs in two large truck AEB systems: Meritor WABCO OnGuard and Bendix Wingman Advance. To conduct the study, the authors identified/computed all the elements that were needed to retrofit a truck with each AEB system. Ricardo Inc. (2013) also assumed a volume of 250,000 units per system and reported costs using 2012 dollars. Finally, the authors assumed all components were sold by a Tier 1 supplier to a vehicle original equipment manufacturer (OEM). To account for indirect costs (e.g., OEM engineering design and development cost, OEM tooling and factory capital costs, warranty recall cost and dealer markup), the OEM costs were multiplied for a Retail Price Equivalent factor of 1.42.
The consumer costs identified by Ricardo Inc. (2013) are shown in Table 16 and ranged from $270 to $290 per truck. Using the gross domestic product deflator, the 2015 equivalent cost for the AEB systems ranged from $270 to $290 per unit.
Table 16. Summary of Costs for AEB Systems (Ricardo Inc., 2013) Components Meritor WABCO/
ON Guard Bendix/WINGMAN
Radar $134 $92 Brackets/Trim $5 $6 Display $38 $65 Wiring and Electrical $20 $20 Installation $7 $7
Impact
OEM Costs $204 $190 Consumer Costs $290 $270
However, Ricardo Inc. (2013) did not account for the labor required to install and calibrate

29
the AEB systems. The research team estimated this would require an additional two hours of technician labor. The technician’s time was computed using the 50th percentile salary from the job category Large Truck and Mobile Equipment Service Technicians ($22.65 per hour in 2015) from the Bureau of Labor Statistics (BLS; 2015). Fringe benefits and overhead costs (42% and 27%, respectively, based on the Employer Cost for Employee Compensation; BLS, 2016) were added to this hourly wage, resulting in a total cost per hour of $40. Thus, the research team estimated the 2015 total cost of each AEB system to range from $310.85 to $344.85.
The results found in Ricardo Inc. (2013) and the published literature review were significantly different. Ricardo Inc. (2013) acknowledged the single service part quote obtained from a dealer may be more than 40 times that of the costs found. Furthermore, the authors also suggested the cost differences may be partially explained by the differences in “real volumes” of AEB system units produced in 2012 compared with the 250,000 annual volume units used in the study. Based on Ricardo Inc.’s (2013) results, the research team included a $500 lower-bound estimate of AEB systems and used the advisory panel’s $2,500 cost estimate as the average estimate of AEB systems.
For this study’s societal BCA, the research team assumed the cost of the technology was incurred when the technology was installed or repaired, independently of the financial mechanism used by the carriers to acquire it. The service life of the technology was assumed to be 10 years with replacement costs equaling the cost of new technology.
The previous literature found that AEB system training time varied from 15 minutes to two hours. An average training time of one hour per driver was used in the BCAs. Based on previous studies (e.g., Hickman et al., 2013), this analysis assumed there was one driver per truck. The cost of the driver’s time was computed using the 50th percentile driver salary from the BLS ($19.36 per hour for 2015; 2016) plus fringe and overhead costs. The fringe benefits were obtained from the Employer Cost for Employee Compensation (57%; 2016). The overhead cost was based on industry data gathered by Berwick and Farooq (2003).
During the course of this study, carriers mentioned that some drivers received training more often. The research team realized that some carriers may provide more frequent training, while others may not train as often. To account for this potential difference, a sensitivity analysis was conducted to account for differences in training hours, driver retention rate, and discount rates (see Figure 8). This sensitivity analysis showed the impact on the total cost of AEB systems with an increase in the number of training hours from one hour per driver per year to one and a half, and two hours per driver per year, driver retention rates of 200% and 50%, and different discount rates. The variability in these costs was not significant and was always less than the variability in equipment costs in AEB systems (i.e., low, average, and high). For example, a sensitivity analysis including an AEB system cost of $2,500, a discount rate of 0%, a service life of 10 years with one replacement after 10 years, and the cost for one, one and a half, or two hours of training per driver resulted in a total cost per truck of $5,550, $5,825 and $6,100, respectively. Similar costs were obtained with different discount rates and retention rates.

30
Figure 8. Impact of number of training hours and retention rates for different costs and AEB
system discount rates.
Crash Target Population
The initial target population was the estimated number of large-truck striking rear-end crashes, and the associated fatalities and injuries that would be prevented if all large trucks were equipped with AEB systems. The research team used the 2010 to 2015 GES and the FARS databases to determine the numbers of rear-end crashes and injuries, which were computed as a six-year average from 2010 to 2015.
The six-year selection period was expected to capture some of the variations in crashes due to external factors, such as recession or market changes in the number of new trucks. However, as shown in Figure 9, there was a considerable variation in the number of crashes over the years. Data from 2015 showed a relative trend of returning to values achieved prior to 2013, but the 2015 values continued to be higher than those from 2010 and 2011. Thus, a six-year average represented a more conservative approach for the BCA.
$0
$1,000
$2,000
$3,000
$4,000
$5,000
$6,000
$7,000
0% 3% 7%Cost
of T
echn
olog
y De
ploy
men
t
Discount rate
High Initial Cost
Average Initial Cost
2 horus of training (av cost)
1.5 hours of training (av cost)
Turnover rate 200% (av cost)
Turnover rate 25% (av cost)
Low Initial Cost

31
Figure 9. Number of large-truck rear-end striking crashes that may be prevented by AEB systems (Data from 2010 to 2015 GES and FARS).
As shown in Table 17 below, the installation of the large-truck AEB system has the potential to reduce an annual maximum of 18,908 crashes. Of those crashes, 0.9% correspond to fatal crashes, 31.8% to injury crashes, and 67.3% to PDO crashes. As a result of these crashes, AEB systems were associated with a maximum reduction of 197 fatalities and 9,830 injuries.
Table 17. Maximum Number of Crashes That May Be Preventable by Large-Truck AEB Systems, by Severity (Data from 2010 to 2015 GES and FARS)
Number of Crashes
Percent of Total
Crashes Fatal 165 0.9% Injury 6,010 31.8% PDO 12,732 67.3% Total Crashes 18,908 100%
Effectiveness of Automatic Emergency Braking Systems
The efficacy rate of the AEB system corresponds to its capability to reduce the collision probability and/or severity of the crash types prevented with the technology. As discussed in the previous section, the advisory panel recommended lower- and upper-bound efficacy rates of 16% and 28%, respectively. Although these efficacy rates are smaller than others found in the literature review, the advisory panel felt the lower rates were a true representation of current AEB system efficacy.
Tables 18 and 19 below show the low, high, and maximum number of crashes and injuries
FatalInjury
Property DamageAll
0
5000
10000
15000
20000
25000
2010 2011 2012 2013 2014 2015
NU
MBE
R O
F C
RAS
HES

32
that may be prevented by large-truck AEB systems. On average, large-truck AEB systems may prevent 26 to 46 fatal crashes, 962 to 1,683 injury crashes, and 2,037 to 3,565 property damage crashes each year. These crashes were associated with 31 to 55 fatalities, 130 to 228 suspected serious injuries, 430 to 753 suspected minor injuries, and 947 to 1,657 possible injuries.
Table 18. Average Number of Crashes by Efficacy Rate That May Be Prevented Each Year with a Large-Truck AEB System (Data from 2010 to 2015 GES and FARS)
Crash Severity Number of Crashes
Low Efficacy (16%)
High Efficacy (28%) Maximum Efficacy
Fatal 26 46 165
Injury 962 1,683 6,010 Property Damage 2,037 3,565 12,732 Total 3,025 5,294 18,908
Table 19. Average Number of Injuries by Efficacy Rate That May Be Prevented Each Year with a Large-Truck AEB System (Data from 2010 to 2015 GES and FARS)
Injury Severity Number of Injuries
Low Efficacy (16%)
High Efficacy (28%) Maximum Efficacy
Fatal Injury (K) 31 55 197 Suspected Serious Injuries (A) 130 228 814 Suspected Minor injury (B) 430 753 2,689 Possibly Injury (C) 947 1,657 5,917 Injury Severity Unknown 66 115 409
Equivalent Lives Saved
To estimate the number of fatal equivalents over six years for each of the efficacy rates, the average number of fatalities and injuries was converted from KABCO to MAIS as shown in Table 14 and multiplied by the MAIS matrix (see Table 13). As a result, the installation of an AEB system in a large truck may prevent 48 to 83 MAIS 1 fatal equivalents, 13 to 23 MAIS 2 fatal equivalents, five to eight MAIS 3 fatal equivalents, nine to 16 MAIS 4 fatal equivalents, and two to four MAIS 5 fatal equivalents each year (Table 20).
Table 20. Number of Fatal Equivalents Per Year by Efficacy Rate for AEB Systems (Data from 2010 to 2015 GES and FARS)
Low Efficacy (16%) High Efficacy (28%) MAIS Fatal Equivalent MAIS Fatal Equivalent
Minor (MAIS 1) 1,586 48 2,775 83 Moderate (MAIS 2) 276 13 483 23 Serious (MAIS 3) 46 5 80 8 Severe (MAIS 4) 33 9 59 16 Critical (MAIS 5) 4 2 7 4 Unsurvivable (MAIS 6) 31 31 55 55 Total Fatal Equivalents 108 189

33
Cost of Crashes
Table 21 shows the annual costs of the crashes that may be prevented with AEB systems for each of the efficacy rates. The societal costs of crashes include medical and emergency costs, environmental and fuel costs, the cost of property damage, costs associated with lost productivity due to roadway congestion, and monetized QALY. In this study, the non-injury (i.e., lost productivity, congestion, and environmental) and injury (i.e., monetized QALY, medical, and emergency) costs were aggregated. To compute these costs, the research team used a procedure established by FMCSA and used in Hickman et al. (2013). This involved multiplying the costs provided by FMCSA (as described in the Methods chapter) by the number of crashes and number of injuries found in Table 18 and Table 19, respectively.
Table 21. Average Annual Cost of Crashes and Their Associated Injuries
Low Efficacy
(16%) High Efficacy
(28%) 100% Efficacy
Number of fatalities 31 55 197 Societal economic cost of crashworthiness $33,661,831 $58,908,205 $210,386,446
Congestion, property damage and environmental savings $82,646,203 $144,630,855 $516,538,768
Societal economic costs $116,308,034 $203,539,060 $726,925,214
Monetized QALY $1,007,241,739 $1,762,673,043 $6,295,260,868
Total monetized value per year $1,123,549,773 $1,966,212,103 $7,022,186,082
Analysis Options
When implementing a new technology, several options can be analyzed. The first option includes retrofitting the entire U.S. fleet of large trucks. This approach assumes all new vehicles added to the fleet are equipped with the technology and that old vehicles are retrofitted. The second approach is what is known as an annual incremental costs analysis. This approach assumes that all new vehicles will be equipped with the technology in 2018 and does not include retrofitting old vehicles. Societal benefits are assessed over the life of the vehicle. One of the major drawbacks of this scheme is the fact that it assumes a constant number of vehicles and a constant number of crashes.
For each implementation option, an analysis was performed on different types of vehicle fleets. The first one included all class 7 and 8 trucks. The second analysis was performed only using class 7 and 8 CUTs. The third analysis was performed only using class 7 and 8 SUTs. Only the analyses for all class 7 and 8 trucks are shown below. The analyses for CUTs and SUTs are in Appendix C.
New and Old Large Trucks are Equipped with Automatic Emergency Braking Systems
This section describes the BCA, which assumed all large trucks (new and old) would be equipped with AEB systems. A BCA was conducted for two efficacy levels (low and high), three cost levels (low, average, and high), three vehicle classifications (SUTs and CUTs, SUTs, and CUTs), and three discount rates (0%, 3%, and 7%).

34
The assumptions used in this BCA include:
• Annual increase of 1.5% in the number of trucks, • Annual increase of 1.5% in the number of drivers, • One driver per truck, • One hour of training per driver for the first 10 years followed by a 10% decrease per
year, and • A technology service life of 10 years with a replacement after year 10.
This BCA was conducted for an analysis period of 20 years. Typically, a lead time of two years is provided when regulating new technology on all large trucks. For the present study, the first year in the analysis period was 2018.
BCA Results for Retrofitting Entire U.S. Fleet of Large Trucks Table 22 shows the BCA using the low efficacy rate (16%) for all large trucks equipped with AEB systems. For the lower efficacy rate, the low-cost option was the only combination that resulted in a BCR greater than 1.00 (2.14, 2.05, and 1.93 for 0%, 3%, and 7%, respectively). Furthermore, the results for the low efficacy rate showed that between 1,185 and 2,159 equivalent lives could be saved over the six-year analysis period, with a net cost per fatality equivalent ranging from $3.78 million to $4.32 million for the low-cost estimate, when all new large trucks (CUT and SUT) are equipped with AEB systems.
Table 22. Results for Retrofitting the Entire U.S. Fleet of Large Trucks with AEB Systems: Low Efficacy (16%), by Cost and Discount Rate
Fleet CUT + SUT > 26,000
pounds
Low Cost Average Cost High Cost
0% 3% 7% 0% 3% 7% 0% 3% 7% Equivalent Lives Saved 2,159 1,630 1,185 2,159 1,630 1,185 2,159 1,630 1,185 Vehicle Costs $8,231 $6,461 $4,962 $41,154 $32,304 $24,810 $49,385 $38,765 $29,772 Training Costs $2,253 $1,829 $1,431 $2,253 $1,829 $1,431 $2,253 $1,829 $1,431 Total AST Cost $10,484 $8,290 $6,393 $43,407 $34,133 $26,241 $51,638 $40,593 $31,203 Soc. Savings from Crashworthiness $673 $508 $369 $673 $508 $369 $673 $508 $369
Congestion, PD and E S $1,653 $1,248 $906 $1,653 $1,248 $906 $1,653 $1,248 $906 Total Societal Economic Savings $2,326 $1,756 $1,275 $2,326 $1,756 $1,275 $2,326 $1,756 $1,275
VSL $20,145 $15,208 $11,038 $20,145 $15,208 $11,038 $20,145 $15,208 $11,038 Total Monetized Savings $22,471 $16,964 $12,312 $22,471 $16,964 $12,312 $22,471 $16,964 $12,312 Net Cost $8,158 $6,533 $5,119 $41,081 $32,377 $24,967 $49,312 $38,837 $29,929 Net Cost per Fatal Equivalent $3.78 $4.01 $4.32 $19.03 $19.87 $21.07 $22.84 $23.83 $25.26
Net Benefit $11,987 $8,675 $5,919 -$20,937
-$17,168
-$13,929
-$29,167
-$23,629
-$18,891
Benefit-Cost Ratio 2.14 2.05 1.93 0.52 0.50 0.47 0.44 0.42 0.39 Table 23 shows the BCA using a higher efficacy rate (28%) for all large trucks equipped with AEB systems. As shown in Table 23, the BCA results for the high efficacy rate were similar. The average and high cost options continued to be non-cost-effective, with a BCR ranging from 0.91 to 0.82 for the average-cost estimate and 0.76 to 0.69 for the high-cost estimate. The low-cost option became more attractive with a BCR of 3.75 (0% discount), 3.58 (3% discount), and 3.37 (7% discount) and a net cost per fatality equivalent ranging from $1.70 million to $2.01 million. The results showed that a high efficacy AEB system may save 2,073 to 3,778 equivalent lives over six years when all large trucks are equipped.

35
Table 23. Results for Retrofitting the Entire U.S. Fleet of Large Trucks with AEB Systems: High Efficacy (28%), by Cost and Discount Rate
Fleet CUT + SUT > 26000
pounds
Low Cost Average Cost High Cost
0% 3% 7% 0% 3% 7% 0% 3% 7% Equivalent Lives Saved 3,778 2,852 2,073 3,778 2,852 2,073 3,778 2,852 2,073 Vehicle Costs $8,231 $6,461 $4,962 $41,154 $32,304 $24,810 $49,385 $38,765 $29,772 Training Costs $2,253 $1,829 $1,431 $2,253 $1,829 $1,431 $2,253 $1,829 $1,431 Total AST Cost $10,484 $8,290 $6,393 $43,407 $34,133 $26,241 $51,638 $40,593 $31,203 Soc. Savings from Crashworthiness $1,178 $889 $646 $1,178 $889 $646 $1,178 $889 $646
Congestion, PD and E S $2,893 $2,184 $1,585 $2,893 $2,184 $1,585 $2,893 $2,184 $1,585 Total Societal Economic Savings $4,071 $3,073 $2,230 $4,071 $3,073 $2,230 $4,071 $3,073 $2,230
VSL $35,253 $26,615 $19,316 $35,253 $26,615 $19,316 $35,253 $26,615 $19,316 Total Monetized Savings $39,324 $29,688 $21,547 $39,324 $29,688 $21,547 $39,324 $29,688 $21,547 Net Cost $6,413 $5,216 $4,163 $39,337 $31,059 $24,011 $47,568 $37,520 $28,973 Net Cost per Fatal Equivalent $1.70 $1.83 $2.01 $10.41 $10.89 $11.58 $12.59 $13.16 $13.97
Net Benefit $28,840 $21,398 $15,153 -$4,083 -$4,445 -$4,695 -$12,314
-$10,906 -$9,657
Benefit Cost Ratio 3.75 3.58 3.37 0.91 0.87 0.82 0.76 0.73 0.69
Sensitivity Analysis for Retrofitting the Entire U.S. Fleet of Large Trucks with Automatic Emergency Braking Systems
Sensitivity analyses were performed for all vehicle classifications and a $13,260,000 VSL and $5,304,000 VSL. Since only the low-cost estimates were cost effective, lowering the VSL would only make these systems less cost-effective. Thus, only the results with the higher VSL are shown below. The results with the lower VSL are shown in Appendix C. Table 24 shows the results using the low efficacy rate. The analyses with a BCR greater than 1.00 are highlighted. Using the low efficacy and a $13,260,000 VSL did not yield different results. Only the low-cost estimate was found to be cost effective.
Table 24. Sensitivity Analysis for Retrofitting the Entire U.S. Fleet of Large Trucks with AEB Systems with a $13,260,000 VSL: Low Efficacy (16%), by Cost and Discount Rate
Fleet Low Cost Average Cost High Cost
0% 3% 7% 0% 3% 7% 0% 3% 7% All Large Trucks 2.93 2.80 2.63 0.71 0.68 0.64 0.60 0.57 0.54 Only CUTs 3.22 3.09 2.92 0.77 0.75 0.71 0.65 0.63 0.60 Only SUTs 2.38 2.26 2.11 0.58 0.55 0.52 0.49 0.47 0.44
As shown in Table 25, the high efficacy rate with a $13,260,000 VSL resulted in a BCR greater than 1.00 for all the cost estimates when considering all large trucks and only CUTs (except for all large trucks with a high-cost and 7% discount rate). However, the high-cost estimate was not cost-effective for SUTs. Furthermore, the average-cost estimate was only cost-effective for SUTs given a 0% discount rate.

36
Table 25. Sensitivity Analysis for Retrofitting the Entire U.S. Fleet of Large Trucks with AEB Systems with a $13,260,000 VSL: High Efficacy (28%), by Cost and Discount Rate
Fleet Low Cost Average Cost High Cost
0% 3% 7% 0% 3% 7% 0% 3% 7% All Large trucks 5.13 4.90 4.61 1.24 1.19 1.12 1.04 1.00 0.94 Only CUTs 5.64 5.41 5.11 1.35 1.31 1.24 1.14 1.10 1.04 Only SUTs 4.17 3.95 3.69 1.02 0.97 0.91 0.86 0.82 0.76
Only New Large Trucks are Equipped with Automatic Emergency Braking Systems
For the incremental BCA, a constant number of vehicles per year was assumed (in this case 170,000 CUTs and 80,000 SUTs). These numbers were obtained by computing the average number of Class 7 and 8 trucks sold in the U.S. Davis et al. (2016) found that 80% of class 8 and 10% of class 7 trucks are CUTs and the remaining trucks are SUTs (see Table 26). The average number of new SUTs and CUTs that entered the market for the same analysis period as for the crash analysis was 81,000 and 15,500, respectively.
Table 26. Total Number of Large Truck SUTs and CUTs Sold (thousands), 2010–2015 Year GVWR
Class 7 GVWR Class
8 SUT CUT
2010 38 107 55.6 89.4 2011 41 171 71.1 140.9 2012 47 195 81.3 160.7 2013 48 185 80.2 152.8 2014 54 220 92.6 181.4 2015 59 249 102.9 205.1
Average 81 155
The total number of crashes that each of these vehicles will experience during their lifetime will equal the annual number of crashes computed for the previous analysis. However, the crashes may occur any time during the vehicle’s lifetime, and it was assumed they followed the same distribution of the weighted average of VMT and survival rate. Thus, the crashes were discounted by applying a multiplicative factor of 0.8389 for a 3% discount rate and 0.6899 for a 7% rate. Since this analysis applied only to the new trucks entering the market, system replacement was assumed to occur when the truck reached the 50% weighted average lifetime VMT. This represented an increase in the vehicle cost of the technology of 7.4% (0% discount rate), 12% (3% discount rate), and 15% (7% discount rate). Results presented were for the calendar year replacement. In this study, the research team used the same CUT survival rates as the FMCSA electronic logging device mandate (Federal Motor Vehicle Safety Standards; Electronic Logging Devices).
The number of drivers receiving training will be proportional to the number of vehicles surviving. The number of drivers receiving training followed the same scenario as described above, where each remaining truck had a driver, but the percentage of drivers receiving training was reduced by 10% after year 10. The hourly cost per driver and the cost of the technology continued to be the same as described above. The major difference was the crashes were reduced using the new accelerated discount factors.
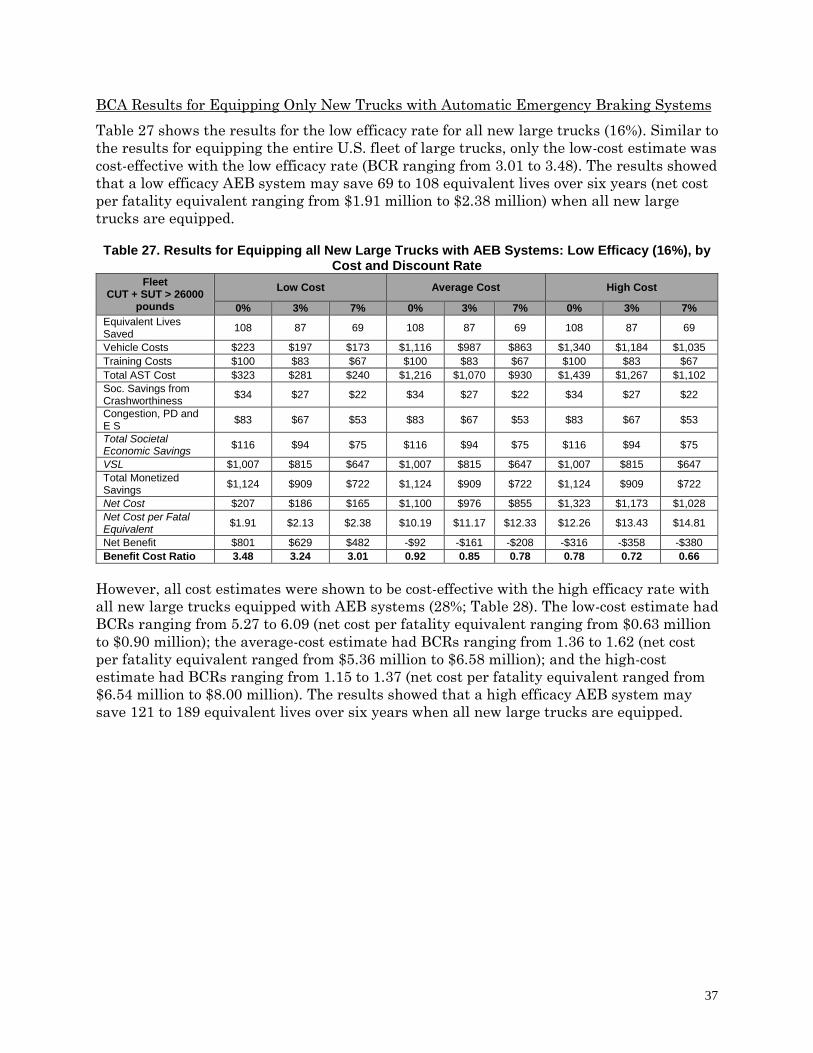
37
BCA Results for Equipping Only New Trucks with Automatic Emergency Braking Systems Table 27 shows the results for the low efficacy rate for all new large trucks (16%). Similar to the results for equipping the entire U.S. fleet of large trucks, only the low-cost estimate was cost-effective with the low efficacy rate (BCR ranging from 3.01 to 3.48). The results showed that a low efficacy AEB system may save 69 to 108 equivalent lives over six years (net cost per fatality equivalent ranging from $1.91 million to $2.38 million) when all new large trucks are equipped.
Table 27. Results for Equipping all New Large Trucks with AEB Systems: Low Efficacy (16%), by Cost and Discount Rate
Fleet CUT + SUT > 26000
pounds
Low Cost Average Cost High Cost
0% 3% 7% 0% 3% 7% 0% 3% 7% Equivalent Lives Saved 108 87 69 108 87 69 108 87 69
Vehicle Costs $223 $197 $173 $1,116 $987 $863 $1,340 $1,184 $1,035 Training Costs $100 $83 $67 $100 $83 $67 $100 $83 $67 Total AST Cost $323 $281 $240 $1,216 $1,070 $930 $1,439 $1,267 $1,102 Soc. Savings from Crashworthiness $34 $27 $22 $34 $27 $22 $34 $27 $22
Congestion, PD and E S $83 $67 $53 $83 $67 $53 $83 $67 $53
Total Societal Economic Savings $116 $94 $75 $116 $94 $75 $116 $94 $75
VSL $1,007 $815 $647 $1,007 $815 $647 $1,007 $815 $647 Total Monetized Savings $1,124 $909 $722 $1,124 $909 $722 $1,124 $909 $722
Net Cost $207 $186 $165 $1,100 $976 $855 $1,323 $1,173 $1,028 Net Cost per Fatal Equivalent $1.91 $2.13 $2.38 $10.19 $11.17 $12.33 $12.26 $13.43 $14.81
Net Benefit $801 $629 $482 -$92 -$161 -$208 -$316 -$358 -$380 Benefit Cost Ratio 3.48 3.24 3.01 0.92 0.85 0.78 0.78 0.72 0.66
However, all cost estimates were shown to be cost-effective with the high efficacy rate with all new large trucks equipped with AEB systems (28%; Table 28). The low-cost estimate had BCRs ranging from 5.27 to 6.09 (net cost per fatality equivalent ranging from $0.63 million to $0.90 million); the average-cost estimate had BCRs ranging from 1.36 to 1.62 (net cost per fatality equivalent ranged from $5.36 million to $6.58 million); and the high-cost estimate had BCRs ranging from 1.15 to 1.37 (net cost per fatality equivalent ranged from $6.54 million to $8.00 million). The results showed that a high efficacy AEB system may save 121 to 189 equivalent lives over six years when all new large trucks are equipped.

38
Table 28. Results for Equipping All New Large Trucks with AEB Systems: High Efficacy (28%), by Cost and Discount Rate
Fleet CUT + SUT > 26000
pounds
Low Cost Average Cost High Cost
0% 3% 7% 0% 3% 7% 0% 3% 7% Equivalent Lives Saved 189 153 121 189 153 121 189 153 121
Vehicle Costs $223 $197 $173 $1,116 $987 $863 $1,340 $1,184 $1,035 Training Costs $100 $83 $67 $100 $83 $67 $100 $83 $67 Total AST Cost $323 $281 $240 $1,216 $1,070 $930 $1,439 $1,267 $1,102 Soc. Savings from Crashworthiness $59 $48 $38 $59 $48 $38 $59 $48 $38
Congestion, PD and E S $145 $117 $93 $145 $117 $93 $145 $117 $93
Total Societal Economic Savings $204 $165 $131 $204 $165 $131 $204 $165 $131
VSL $1,763 $1,427 $1,133 $1,763 $1,427 $1,133 $1,763 $1,427 $1,133 Total Monetized Savings $1,966 $1,592 $1,264 $1,966 $1,592 $1,264 $1,966 $1,592 $1,264
Net Cost $119 $116 $109 $1,012 $905 $799 $1,236 $1,103 $972 Net Cost per Fatal Equivalent $0.63 $0.76 $0.90 $5.36 $5.92 $6.58 $6.54 $7.21 $8.00
Net Benefit $1,643 $1,311 $1,024 $750 $522 $334 $527 $324 $161 Benefit Cost Ratio 6.09 5.67 5.27 1.62 1.49 1.36 1.37 1.26 1.15
Sensitivity Analysis for Only Equipping New Trucks with Automatic Emergency Braking Systems
Similar to the analyses for equipping the entire U.S. fleet, sensitivity analyses were performed for all vehicle classifications and a $13,260,000 VSL and $5,304,000 VSL. Since only the low-cost estimates were cost-effective, lowering the VSL would only make these systems less cost-effective. Thus, only the results with the higher VSL are shown below. The analyses using the lower VSL are shown in Appendix C. Table 29 shows the results using the low efficacy rate. The low efficacy rate with a $13,260,000 VSL resulted in at least one cost-effective solution for each of the cost estimates for all large trucks and CUTs only. However, the high-cost estimate was shown to be not-cost-effective when only SUTs are equipped with AEB systems.
Table 29. Sensitivity Analysis for Equipping All New Trucks with AEB Systems Using $13,260,000 VSL: Low Efficacy (16%), by Cost and Discount Rate
Fleet Low Cost Average Cost High Cost
0% 3% 7% 0% 3% 7% 0% 3% 7% All Large Trucks 4.76 4.43 4.12 1.26 1.16 1.06 1.07 0.98 0.90 Only CUTs 5.03 4.68 4.35 1.33 1.23 1.12 1.13 1.04 0.95 Only SUTs 4.19 3.91 3.63 1.11 1.03 0.94 0.94 0.87 0.79
As shown in Table 30, a $13,260,000 VSL and high efficacy resulted in significantly higher BCRs compared to all other combinations for all cost estimates and discount rates.

39
Table 30. Sensitivity Analysis for Equipping All New Trucks with AEB Systems Using a $13,260,000 VSL: High Efficacy (28%), by Cost and Discount Rate
Fleet Low Cost Average Cost High Cost
0% 3% 7% 0% 3% 7% 0% 3% 7% All Large trucks 8.33 7.76 7.21 2.21 2.03 1.86 1.87 1.72 1.57 Only CUTs 8.80 8.19 7.61 2.34 2.15 1.96 1.97 1.81 1.66 Only SUTs 7.34 6.84 6.35 1.95 1.79 1.64 1.65 1.51 1.38

40
Discussion This study assessed scientifically-based estimates of the societal benefits and costs of AEB systems installed on large trucks. This study also assessed the societal benefits and costs of lane departure warning systems, video-based onboard safety monitoring systems, and air disc brakes; the assessment results of these ASTs are presented in separate AAAFTS reports. In addition to these ASTs, other ASTs were considered; however, the advisory panel only selected ASTs that were not mandated, had empirical research evaluating the efficacy of the system, had an outdated BCA, or for which a BCA was not available. The current study used efficacy rates from previously published research and identified crashes that may have been prevented through the deployment of the AST (in this case, AEB systems). Crashes were identified using 2010 to 2015 GES and FARS datasets. BCAs were performed using varying efficacy rates (low and high), vehicle types (SUTs and CUTs, CUTs, and SUTs), costs (low, average, and high), and discount rates (0%, 3%, and 7%).
The current study used a lower and upper bound efficacy rate to estimate the benefits and costs associated with implementing AEB systems across the entire U.S. fleet of large trucks. This study found that an AEB system with 16% efficacy may prevent 3,025 total rear-end crashes, 962 injury crashes (1,507 total injuries), and 26 fatal crashes (31 total fatalities) each year. An AEB system with a 28% efficacy may prevent 5,294 total rear-end crashes, 1,683 injury crashes (2,638 total injuries), and 46 fatal crashes (55 total fatalities) each year.
The number of crashes that may be prevented with AEB systems are similar to prior studies. Woodrooffe et al. (2012) estimated that AEB systems may prevent 2,539 (16% efficacy) to 4,542 (28% efficacy) rear-end crashes and 55 to 99 fatalities annually. Furthermore, Fitch et al. (2008) estimated that FCW may prevent 4,800 crashes annually. Although Fitch et al. (2008) evaluated FCW rather than AEB systems, the methodologies assumed 100% effectiveness, and it can be argued that 100% effectiveness with basic FCW would be similar to the efficacy found in AEB systems.
The first set of BCAs estimated the cost-effectiveness of equipping all new and old large trucks with AEB systems. These analyses showed BCRs ranging from 0.39 to 3.75 (for all large trucks), 0.43 to 4.11 (if only CUTs were equipped), and 0.32 to 3.08 (if only SUTs were equipped). However, all the BCRs greater than 1.00 (indicating the benefits outweighed the costs) resulted from the low-cost estimate.
The second set of BCAs estimated the cost-effectiveness of equipping only new vehicles with AEB systems. These analyses showed BCRs ranging from 0.66 to 6.09 (for all large trucks), 0.69 to 6.41 (if only CUTs were equipped), and 0.58 to 5.41 (if only SUTs were equipped). All cost estimates were shown to be cost-effective using the high efficacy rate.
The results of these analyses are similar to those found in Murray et al. (2009a). Murray et al. (2009a) conducted BCAs for FCW. Though the authors were evaluating basic FCW, they used 21% and 44% efficacy rates, and thus, this study’s estimates should be expected to be similar. Murray et al. (2009a) found that FCW had BCRs ranging from 1.51 to 3.03 for tractor-trailers. The BCRs in this study for only new CUTs were similar (1.21 to 6.41) with a 28% efficacy rate.

41
This study also found that AEB systems provided the highest returns for CUTs, even if they were only shown to be cos- effective at the lowest cost when new and old vehicles are equipped with the technology. Similar results were found for only equipping new vehicles; however, these analyses showed that all cost estimates were found to be cost-effective with a high efficacy rate.
While this study chose to use 16% and 28% efficacy rates, the real-world effectiveness against different severity crashes may differ significantly. However, data limitations precluded the use of separate efficacy estimates for this study. Additionally, it is likely AEB systems have higher efficacy rates compared to those used in this study. While these efficacy rates are in the lower ranges of effectiveness found in the literature review, the Advisory Panel preferred to choose conservative estimates that may reflect a truer representation of reality.
Conclusions
The results showed that AEB systems have the potential to save many lives each year. However, the current pricing/efficacy rate used in this study did not always suggest that AEB systems were cost-effective. Only a $500 AEB system was found to consistently be cost-effective regardless of which trucks were equipped with the system. Average and high-cost systems were only found to be cost-effective occasionally. Additionally, retrofitting old large trucks with AEB systems typically was not cost-effective.
These results provide insight into the feasibility of government regulation for large-truck AEB systems. There was not a strong case for government regulation requiring AEB systems for the entire U.S. fleet of large trucks given the cost/efficacy rates used in this study. However, the analyses showed AEB systems on new CUTs were cos- effective with a high efficacy rate regardless of cost. If the cost and efficacy of AEB systems can be maintained at (or improved from) $2,500 and 28%, respectively, the estimated economic benefits of equipping all new large trucks with AEB would be greater than the costs of doing so.
Limitations
Although the analyses used to assess the benefit-costs associated with AEB systems were comprehensive, there were several limitations.
• It is possible the efficacy rates used in this study do not represent the current functionality/effectiveness of the current generation of the technologies evaluated. However, the advisory panel consisted of experts with knowledge of current technology research. Thus, the efficacy rates selected by the advisory panel should adequately match current efficacy rates.
• This study used estimated crash, technology, and labor costs. It is possible actual costs may differ and thus impact the cost-effectiveness of AEB systems.

42
• The GES only includes crashes that required a police accident report. However, AEB systems may also prevent less severe crashes. Thus, these additional benefits are not accounted for in the BCAs.
• The real-world effectiveness against different severity crashes may differ significantly. However, data limitations precluded the use of separate efficacy estimates for this study.
• The technology costs used in this study may differ from current costs. However, the advisory panel consisted of experts in the industry, including a technology vendor. Thus, the cost selected should be a close match to current prices.
• This study assumed all vehicle systems were functioning as intended. However, this is unlikely to be seen in the real world. Specifically, anti-lock brakes and foundation brakes have a direct impact on a vehicle’s ability to avoid a crash. If they are poorly maintained, the actual efficacy rates achieved may be lower than those used in the analyses reported here.
• These analyses did not account for reduced litigation costs associated with reduced crashes. These can be significant costs savings that were not integrated into the analyses.
• The failure to use data generated by AEB systems (i.e., reports tracking alerts/activation) may result in missed driver coaching opportunities. Thus, maximum efficacy may not be achieved.
• The efficacy of AEB systems is dependent upon effective introduction, then initial and subsequent ongoing driver and management training.

43
References American Trucking Associations. (2016). U.S. Freight Transportation Forecast to 2027. Arlington, VA: American Trucking Associations. Berwick, M., & Farooq, M. (2003). Truck Costing Model for Transportation Managers. Fargo, ND: Upper Great Plains Transportation Institute. Retrieved November 18, 2016 from http://www.mountain-plains.org/pubs/pdf/MPC03-152.pdf Birkland, C. (2016, January 22). Strapping in to advanced safety offerings. Retrieved April 6, 2016, from http://www.fleetequipmentmag.com/heavy-duty-truck-advanced-safety-radar-lane-detection/ Bureau of Labor Statistics. (2015). Occupational Outlook Handbook, 2016-2017 Edition. Washington, D.C.: Bureau of Labor Statistics, U.S. Department of Labor. Retrieved November 1, 2016 from https://www.bls.gov/ooh/installation-maintenance-and-repair/heavy-vehicle-and-mobile-equipment-service-technicians.htm Bureau of Labor Statistics. (2016). Occupational Employment and Wages, 2015. Washington, D.C.: Bureau of Labor Statistics, U.S. Department of Labor. Retrieved November 1, 2016 from https://www.bls.gov/oes/current/oes533032.htm Bureau of Labor Statistics. (2016). Employer Costs for Employee Compensation – September 2016. Washington, D.C.: Bureau of Labor Statistics, U.S. Department of Labor. Retrieved December 10, 2016 from https://www.bls.gov/news.release/pdf/ecec.pdf Business Dictionary. (2016). Economic analysis. Retrieved from http://www.businessdictionary.com/definition/economic-analysis.html. Davis, S.C., Diegel, S. W., & Boundy, R. G. (2016). Transportation Energy Data Book: Edition 35. Washington, D.C.: U.S. Department of Energy. Retrieved from http://www.cta.ornl.gov/data/tedb35/Edition35_Title_Pages.pdf Executive Order 12866, 3 C.F.R. (1993). Washington, D.C. Retrieved from http://www.whitehouse.gov/omb/inforeg/eo12866.pdf Executive Order 13563, 3 C.F.R. (2011). Washington, D.C. Retrieved from https://www.whitehouse.gov/the-press-office/2011/01/18/executive-order-13563-improving-regulation-and-regulatory-review Federal Motor Carrier Safety Administration. (2006). Report to Congress on the Large Truck Crash Causation Study. (Report No. MC-R/MC-RRA). Washington, D.C.: Federal Motor Carrier Safety Administration. Federal Motor Carrier Safety Administration. (2016). Large Truck and Bus Crash Facts 2014. Washington, D.C.: Federal Motor Carrier Safety Administration. Federal Motor Vehicle Safety Standards; Electronic Logging Devices, Final Rule, 49 CFR Parts 385, 386, 390, and 395. Fitch, G. M., Rakha, H. A., Arafeh, M., Blanco, M., Gupta, S. K., Zimmermann, R. P. & Hanowski, R. J. (2008). Safety Benefit Evaluation of a Forward Collision Warning System. (Report No. DOT HS 810 910). Washington, D.C.: National Highway Traffic Safety Administration. Hendricks, D. L., Freedman, M., Zador, P. L., & Fell, J. C. (2001). The Relative Frequency of Unsafe Driving Acts in Serious Traffic Crashes. (Report No. DTNH22-94-C-05020).

44
Washington, D.C.: National Highway Traffic Safety Administration. Hickman, J. S., Geo, F., Camden, M. C., Medina, A., Hanowski, R. J., & Mabry, E. (2013). Onboard Safety System Effectiveness Evaluation Final Report. (Report No. FMCSA-RRT-12-012). Washington, D.C.: Federal Motor Carrier Safety Administration. IHS Markit. (2016, January). U.S. commercial vehicle market expected to grow slightly in 2016, IHS says. Retrieved November 1, 2016 from http://news.ihsmarkit.com/press-release/automotive/us-commercial-vehicle-market-expected-grow-slightly-2016-ihs-says Jermakian, J. S. (2012). Crash avoidance potential of four large truck technologies. Accident Analysis and Prevention, 49, 338-346. Kuehn, M., Hummel, T. & Bende, J. (2011). Advanced driver assistance systems for trucks – benefit estimation from real-life accidents. Proceedings of the 22nd International Technical Conference on Enhanced Safety of Vehicles, Washington, D.C. Kirk, A. (2009). An In-Service Analysis of Maintenance and Repair Expenses for the Anti-Lock Brake System and Underride Guard for Tractors and Trailers. Washington, D.C.: National Center for Statistics and Analysis, National Highway Traffic Safety Administration. Najm, W. G., Koopmann, J., Smith, J. D., & Brewer, J. (2010). Frequency of Target Crashes for IntelliDrive Safety Systems. (Report No. DOT HS 811 381). Washington, D.C.: National Highway Traffic Safety Administration. Nodine, E., Lam, A., Najm, W., Wilson, B., & Brewer, J. (2011). Integrated Vehicle-Based Safety Systems Heavy-Truck Field Operational Test Independent Evaluation. (Report No. DOT HS 811 464). Washington, D.C.: National Highway Traffic Safety Administration. NorthAmerican Transportation Association. (n.d.). Collision mitigation systems. Retrieved April 12, 2016, from http://www.ntassoc.com/uploads/FileLinks/be1d5f8106d64e0198d776625e0f31aa/Colision%20Mitigation%20Systems.pdf Office of Highway Policy Information. (2014). Roadway Extent, Characteristics, and Performance. Washington, D.C.: Federal Highway Administration. Retrieved from https://www.fhwa.dot.gov/policyinformation/statistics/ Office of Management and Budget (OMB) (1992). Circular No. A-94 Revised. Washington, D.C. Retrieved from https://www.whitehouse.gov/omb/circulars_a094 Office of Management and Budget (OMB) (2003). Circular A-4: Regulatory Analysis. Washington, D.C. Retrieved from http://www.whitehouse.gov/omb/assets/regulatory_matters_pdf/a-4.pdf Pearce, D., Atkinson, G., & Mourato, S. (2006). Cost-Benefit Analysis and the Environment: Recent Developments. Paris, France: OECD Publishing. Ricardo Inc. (2013). Cost and Weight Analysis for CMB and LDWS for Heavy Trucks. Washington, D.C.: National Highway Traffic Safety Administration. Shedlock, M. (2016, May). Class 8 truck orders plunge 39%; Large truck sales vs. recessions. Retrieved November 1, 2016 from https://mishtalk.com/2016/05/05/class-8-truck-orders-plunge-39-large-truck-sales-vs-recessions/ Spicer, R.S., & Miller, T.R. (2010). Uncertainty Analysis of Quality Adjusted Life Years Lost.

45
Washington, D.C.: National Highway Traffic Safety Administration. Transportation Economics Committee of the Transportation Research Board. (n.d.). Transportation benefit-cost analysis. Retrieved from http://bca.transportationeconomics.org/ Treat, J. R., Tumbas, N. S., McDonald, S. T., Shinar, D., Hume, R. D., Mayer, R. E., Stansider, R. L., & Castellan, N. J. (2006). Tri-Level Study of the Causes of Traffic Accidents: Final Report. (Volume I: Causal Factor Tabulations and Assessments; Volume II: Special Analyses). (Report No. DOT HS 805 085). Washington, D.C.: National Highway Traffic Safety Administration. U.S. Department of Transportation (USDOT). (2015). Guidance on Treatment of the Economic Value of a Statistical Life in U.S. Department of Transportation Analyses (2015). Washington, D.C.: U.S. Department of Transportation. Retrieved May 25, 2016 from http://www.dot.gov/office-policy/transportation-policy/guidance-treatment-economic-value-statistical-life U.S. Energy Information Administration. (2016). Annual Energy Outlook 2016. Washington, D.C.: U.S. Energy Information Administration. Retrieved from http://www.eia.gov/outlooks/aeo/ Woodrooffe, J., Blower, D., Bao, S., Bogard, S., Flannagan, C., Green, P. E., & LeBlanc, D. (2012). Final Report: Performance Characterization and Safety Effectiveness Estimates of Forward Collision Avoidance and Mitigation Systems for Medium/Heavy Commercial Vehicles. (Docket No. NHTSA-2013-0067). Washington, D.C.: National Highway Traffic Safety Administration.

46
Appendix A: Literature Review Summary Table
Citation Title AST Effectiveness and/or cost
Hickman et al. (2013) Onboard safety system effectiveness evaluation final report
AEB • Not statistically significant, but AEB system-equipped trucks were involved in 20.7% fewer large-truck striking rear-end and head-on crashes.
Kuehn, Hummel, & Bende (2011)
Advanced driver assistance systems for trucks: Benefit estimation from real-life accidents
AEB
• AEB could prevent 12% of all large-truck crashes or 52.3% of all large-truck striking rear-end crashes.
Jermakian (2012) Crash avoidance potential of four large-truck technologies
AEB
• AEB could prevent 31% of large-truck striking rear-end crashes where a large-truck driver did brake; 37% of all large-truck striking rear-ends where a large-truck driver did not brake

47
Citation Title AST Effectiveness and/or cost
Woodrooffe et al. (2012)
Final report: Performance characterization and safety effectiveness estimates of forward collision avoidance and mitigation systems for medium/heavy commercial vehicles
AEB • Prior generation AEB (pre-2014; brake at 0.35g & no braking for fixed objects) could reduce large-truck striking rear-ends by 16%, fatalities related to this crash type by 24%, and injuries related to this crash type by 25%.
• Next-generation AEB (post-2014; brake at 0.3g to fixed objects, 0.6g to moving/stopping) could reduce large-truck striking rear-ends by 28%, fatalities related to this crash type by 44%, and injuries related to this crash type by 47%.
• Future generation AEB systems (none in production at time of report; 0.6g to all objects) could reduce large-truck striking rear-ends by 40%, fatalities related to this crash type by 57%, and injuries related to this crash type by 54%.
Birkland (2016) Strapping in to advanced safety offerings (magazine article with quote from Bendix)
AEB • Customers have seen a 50% or more reduction in rear-end crashes
• Customers have seen a positive ROI in 18–24 months.
NorthAmerican Transportation Association (n.d.)
Collision mitigation systems AEB • Cost = $2,500.
Berg (2016) Wabco-SmartDrive system uses video analytics
AEB • Customers report 65%–87% reductions in crashes.
• Reduce crash costs by 89%.

48
Appendix B: GES/FARS Crash Filtering Inclusion Variables
1. Vehicle Body Type a. 63: Single-Unit Straight Truck or Cab-Chassis(GVWR > 26,000 lbs) b. 64: Single-Unit Straight Truck or Cab-Chassis(GVWR unknown) c. 66: Truck-Tractor d. 68: Single-Unit Straight Truck (GVWR unknown) e. 72: Unknown if Single-Unit or Combination-Unit Heavy Truck (GVWR >
26,000 lbs) f. 78: Unknown Medium/Heavy Truck Type
2. Accident Type
a. 11: Single Driver, Forward Impact, Parked Vehicle b. 20: Same Trafficway, Same Direction, Rear End, Stopped c. 24: Same Trafficway, Same Direction, Rear End, Slower d. 28: Same Trafficway, Same Direction, Rear End, Decelerating e. 34: Same Trafficway, Same Direction, Forward Impact, This Vehicle’s Fontal
Area Impacts Another Vehicle f. 36: Same Trafficway, Same Direction, Forward Impact, This Vehicle’s Fontal
Area Impacts Another Vehicle g. 38: Same Trafficway, Same Direction, Forward Impact, This Vehicle’s Fontal
Area Impacts Another Vehicle h. 40: Same Trafficway, Same Direction, Forward Impact, This Vehicle’s Fontal
Area Impacts Another Vehicle
3. Pre-event Movement a. 1: Going Straight b. 2: Decelerating in Road c. 3: Accelerating in Road
4. Critical Event – Pre-crash
a. 50: Other Motor Vehicle in Lane, Other Vehicle Stopped b. 51: Other Motor Vehicle in Lane, Traveling in Same Direction with Lower
Steady Speed c. 52: Other Motor Vehicle in Lane, Traveling in Same Direction while
Decelerating d. 53: Other Motor Vehicle in Lane, Traveling in Same Direction with Higher
Speed
5. Police-Reported Alcohol Involvement a. 0: No (Alcohol Not Involved)
6. Police-Reported Drug Involvement
a. 0: No (Drugs Not Involved)
7. Impairment at Time of Crash – Driver a. Removed 1: Ill/Blackout

49
8. First Harmful Event
a. 12: Collision with Motor Vehicle in Transport, Motor Vehicle in Transport b. 55: Collision with Motor Vehicle in Transport, Motor Vehicle in Motion
Outside the Trafficway

50
Appendix C: Additional Analyses
Table 31. Results for Retrofitting the Entire U.S. Fleet of Large-Truck CUTs with AEB by Low Efficacy (16%), Cost, and Discount Rate
Fleet CUT
Low Cost Average Cost High Cost
0% 3% 7% 0% 3% 7% 0% 3% 7% Equivalent Lives Saved 1,582 1,195 868 1,582 1,195 868 1,582 1,195 868 Vehicle Costs $5,422 $4,237 $3,236 $27,111 $21,185 $16,182 $32,533 $25,422 $19,419 Training Costs $1,424 $1,156 $905 $1,424 $1,156 $905 $1,424 $1,156 $905 Total AST Cost $6,847 $5,393 $4,141 $28,535 $22,341 $17,087 $33,958 $26,578 $20,324 Soc. Savings from Crashworthiness $465 $351 $255 $465 $351 $255 $465 $351 $255
Congestion, PD and E S $1,013 $765 $555 $1,013 $765 $555 $1,013 $765 $555 Total Societal Economic Savings $1,478 $1,116 $810 $1,478 $1,116 $810 $1,478 $1,116 $810
VSL $14,602 $11,023 $8,001 $14,602 $11,023 $8,001 $14,602 $11,023 $8,001 Total Monetized Savings $16,080 $12,139 $8,810 $16,080 $12,139 $8,810 $16,080 $12,139 $8,810 Net Cost $5,369 $4,277 $3,332 $27,057 $21,226 $16,278 $32,479 $25,463 $19,514 Net Cost per Fatal Equivalent $3.39 $3.58 $3.84 $17.10 $17.77 $18.74 $20.53 $21.31 $22.47
Net Benefit $9,233 $6,746 $4,669 -$12,456
-$10,202 -$8,277 -
$17,878 -
$14,439 -
$11,513 Benefit Cost Ratio 2.35 2.25 2.13 0.56 0.54 0.52 0.47 0.46 0.43
Table 32. Results for Retrofitting the Entire U.S. Fleet of Large-Truck CUTs with AEB by High Efficacy (28%), Cost, and Discount Rate
Fleet CUT
Low Cost Average Cost High Cost
0% 3% 7% 0% 3% 7% 0% 3% 7% Equivalent Lives Saved 2,769 2,091 1,520 2,769 2,091 1,520 2,769 2,091 1,520 Vehicle Costs $5,422 $4,237 $3,236 $27,111 $21,185 $16,182 $32,533 $25,422 $19,419 Training Costs $1,424 $1,156 $905 $1,424 $1,156 $905 $1,424 $1,156 $905 Total AST Cost $6,847 $5,393 $4,141 $28,535 $22,341 $17,087 $33,958 $26,578 $20,324 Soc. Savings from Crashworthiness $813 $614 $446 $813 $614 $446 $813 $614 $446
Congestion, PD and E S $1,773 $1,339 $972 $1,773 $1,339 $972 $1,773 $1,339 $972 Total Societal Economic Savings $2,587 $1,953 $1,417 $2,587 $1,953 $1,417 $2,587 $1,953 $1,417
VSL $25,553 $19,291 $14,001 $25,553 $19,291 $14,001 $25,553 $19,291 $14,001 Total Monetized Savings $28,139 $21,244 $15,418 $28,139 $21,244 $15,418 $28,139 $21,244 $15,418 Net Cost $4,260 $3,440 $2,724 $25,949 $20,389 $15,670 $31,371 $24,626 $18,907 Net Cost per Fatal Equivalent $1.54 $1.65 $1.79 $9.37 $9.75 $10.31 $11.33 $11.78 $12.44
Net Benefit $21,293 $15,851 $11,277 -$396 -$1,098 -$1,669 -$5,818 -$5,335 -$4,906 Benefit Cost Ratio 4.11 3.94 3.72 0.99 0.95 0.90 0.83 0.80 0.76

51
Table 33. Results for Retrofitting the Entire U.S. Fleet of Large-Truck SUTs with AEB by Low Efficacy (16%), Cost, and Discount Rate
Fleet SUT
Low Cost Average Cost High Cost
0% 3% 7% 0% 3% 7% 0% 3% 7% Equivalent Lives Saved 576 435 316 576 435 316 576 435 316 Vehicle Costs $2,809 $2,224 $1,725 $14,043 $11,119 $8,627 $16,852 $13,342 $10,353 Training Costs $829 $673 $526 $829 $673 $526 $829 $673 $526 Total AST Cost $3,637 $2,896 $2,252 $14,872 $11,791 $9,154 $17,681 $14,015 $10,879 Soc. Savings from Crashworthiness $209 $157 $114 $209 $157 $114 $209 $157 $114
Congestion, PD and E S $640 $483 $350 $640 $483 $350 $640 $483 $350 Total Societal Economic Savings $848 $640 $465 $848 $640 $465 $848 $640 $465
VSL $5,543 $4,185 $3,037 $5,543 $4,185 $3,037 $5,543 $4,185 $3,037 Total Monetized Savings $6,391 $4,825 $3,502 $6,391 $4,825 $3,502 $6,391 $4,825 $3,502 Net Cost $2,789 $2,256 $1,787 $14,024 $11,151 $8,689 $16,833 $13,375 $10,415 Net Cost per Fatal Equivalent $4.84 $5.19 $5.65 $24.34 $25.63 $27.47 $29.21 $30.74 $32.93
Net Benefit $2,754 $1,929 $1,250 -$8,481 -$6,966 -$5,652 -$11,289 -$9,190 -$7,377
Benefit Cost Ratio 1.76 1.67 1.56 0.43 0.41 0.38 0.36 0.34 0.32
Table 34. Results for Retrofitting the Entire U.S. Fleet of Large-Truck SUTs with AEB by High Efficacy (28%), Cost, and Discount Rate
Fleet SUT
Low Cost Average Cost High Cost
0% 3% 7% 0% 3% 7% 0% 3% 7% Equivalent Lives Saved 1,008 761 553 1,008 761 553 1,008 761 553 Vehicle Costs $2,809 $2,224 $1,725 $14,043 $11,119 $8,627 $16,852 $13,342 $10,353 Training Costs $829 $673 $526 $829 $673 $526 $829 $673 $526 Total AST Cost $3,637 $2,896 $2,252 $14,872 $11,791 $9,154 $17,681 $14,015 $10,879 Soc. Savings from Crashworthiness $365 $276 $200 $365 $276 $200 $365 $276 $200
Congestion, PD and E S $1,119 $845 $613 $1,119 $845 $613 $1,119 $845 $613 Total Societal Economic Savings $1,484 $1,120 $813 $1,484 $1,120 $813 $1,484 $1,120 $813
VSL $9,701 $7,324 $5,315 $9,701 $7,324 $5,315 $9,701 $7,324 $5,315 Total Monetized Savings $11,185 $8,444 $6,129 $11,185 $8,444 $6,129 $11,185 $8,444 $6,129 Net Cost $2,153 $1,776 $1,439 $13,388 $10,671 $8,341 $16,197 $12,895 $10,066 Net Cost per Fatal Equivalent $2.14 $2.33 $2.60 $13.28 $14.02 $15.07 $16.06 $16.94 $18.19
Net Benefit $7,548 $5,548 $3,877 -$3,687 -$3,347 -$3,025 -$6,496 -$5,571 -$4,751 Benefit Cost Ratio 3.08 2.92 2.72 0.75 0.72 0.67 0.63 0.60 0.56
Table 35. Sensitivity Analysis for Retrofitting the Entire U.S. Fleet of Large Trucks with AEB using a $5,304,000 VSL by Low Efficacy (16%), Cost, and Discount Rate
Fleet Low Cost Average Cost High Cost
0% 3% 7% 0% 3% 7% 0% 3% 7% All Large trucks 1.31 1.25 1.17 0.32 0.30 0.29 0.27 0.25 0.24 Only CUTs 1.42 1.36 1.29 0.34 0.33 0.31 0.29 0.28 0.26 Only SUTs 1.09 1.04 0.97 0.27 0.25 0.24 0.22 0.21 0.20

52
Table 36. Sensitivity Analysis for Retrofitting the Entire U.S. Fleet of Large Trucks with AEB using a $5,304,000 VSL by High Efficacy (28%), Cost, and Discount Rate
Fleet Low Cost Average Cost High Cost
0% 3% 7% 0% 3% 7% 0% 3% 7% All Large trucks 2.29 2.18 2.05 0.55 0.53 0.50 0.46 0.45 0.42 Only CUTs 2.48 2.38 2.25 0.60 0.57 0.55 0.50 0.48 0.46 Only SUTs 1.91 1.81 1.69 0.47 0.45 0.42 0.39 0.37 0.35
Table 37. Results for Equipping Only New CUTs with AEB by Low Efficacy (16%), Cost, and Discount Rate
Fleet CUT
Low Cost Average Cost High Cost
0% 3% 7% 0% 3% 7% 0% 3% 7% Equivalent Lives Saved 79 64 51 79 64 51 79 64 51 Vehicle Costs $152 $134 $117 $759 $671 $587 $911 $805 $704 Training Costs $68 $57 $46 $68 $57 $46 $68 $57 $46 Total AST Cost $220 $191 $163 $827 $728 $632 $979 $862 $750 Soc. Savings from Crashworthiness $23 $19 $15 $23 $19 $15 $23 $19 $15
Congestion, PD and E S $51 $41 $33 $51 $41 $33 $51 $41 $33 Total Societal Economic Savings $74 $60 $47 $74 $60 $47 $74 $60 $47
VSL $730 $591 $469 $730 $591 $469 $730 $591 $469 Total Monetized Savings $804 $651 $517 $804 $651 $517 $804 $651 $517 Net Cost $146 $131 $116 $753 $668 $585 $905 $802 $702 Net Cost per Fatal Equivalent $1.84 $2.05 $2.27 $9.52 $10.43 $11.50 $11.44 $12.52 $13.81
Net Benefit $584 $460 $354 -$23 -$77 -$116 -$175 -$211 -$233 Benefit Cost Ratio 3.66 3.41 3.17 0.97 0.89 0.82 0.82 0.76 0.69
Table 38. Results for Equipping Only New CUTs with AEB by High Efficacy (28%), Cost, and Discount Rate
Fleet CUT
Low Cost Average Cost High Cost
0% 3% 7% 0% 3% 7% 0% 3% 7% Equivalent Lives Saved 138 112 89 138 112 89 138 112 89 Vehicle Costs $152 $134 $117 $759 $671 $587 $911 $805 $704 Training Costs $68 $57 $46 $68 $57 $46 $68 $57 $46 Total AST Cost $220 $191 $163 $827 $728 $632 $979 $862 $750 Soc. Savings from Crashworthiness $41 $33 $26 $41 $33 $26 $41 $33 $26
Congestion, PD and E S $89 $72 $57 $89 $72 $57 $89 $72 $57 Total Societal Economic Savings $129 $105 $83 $129 $105 $83 $129 $105 $83
VSL $1,278 $1,034 $821 $1,278 $1,034 $821 $1,278 $1,034 $821 Total Monetized Savings $1,407 $1,139 $904 $1,407 $1,139 $904 $1,407 $1,139 $904 Net Cost $90 $86 $80 $698 $623 $549 $849 $757 $666 Net Cost per Fatal Equivalent $0.65 $0.77 $0.90 $5.04 $5.56 $6.17 $6.13 $6.76 $7.49
Net Benefit $1,187 $948 $741 $580 $411 $272 $428 $277 $155 Benefit Cost Ratio 6.41 5.97 5.54 1.70 1.57 1.43 1.44 1.32 1.21

53
Table 39. Results for Equipping Only New SUTs with AEB by Low Efficacy (16%), Cost, and Discount Rate
Fleet SUT
Low Cost Average Cost High Cost
0% 3% 7% 0% 3% 7% 0% 3% 7% Equivalent Lives Saved 29 23 19 29 23 19 29 23 19 Vehicle Costs $71 $63 $55 $357 $316 $276 $429 $379 $331 Training Costs $32 $27 $22 $32 $27 $22 $32 $27 $22 Total AST Cost $103 $90 $77 $389 $342 $298 $461 $406 $353 Soc. Savings from Crashworthiness $10 $8 $7 $10 $8 $7 $10 $8 $7
Congestion, PD and E S $32 $26 $21 $32 $26 $21 $32 $26 $21 Total Societal Economic Savings $42 $34 $27 $42 $34 $27 $42 $34 $27
VSL $277 $224 $178 $277 $224 $178 $277 $224 $178 Total Monetized Savings $320 $259 $205 $320 $259 $205 $320 $259 $205 Net Cost $61 $55 $49 $347 $308 $270 $418 $371 $326 Net Cost per Fatal Equivalent $2.12 $2.38 $2.67 $12.03 $13.21 $14.60 $14.51 $15.92 $17.58
Net Benefit $216 $169 $129 -$70 -$84 -$92 -$141 -$147 -$147 Benefit Cost Ratio 3.09 2.88 2.68 0.82 0.76 0.69 0.69 0.64 0.58
Table 40. Results for Equipping Only New SUTs with AEB by High Efficacy (28%), Cost, and Discount Rate
Fleet SUT
Low Cost Average Cost High Cost
0% 3% 7% 0% 3% 7% 0% 3% 7% Equivalent Lives Saved 50 41 32 50 41 32 50 41 32 Vehicle Costs $71 $63 $55 $357 $316 $276 $429 $379 $331 Training Costs $32 $27 $22 $32 $27 $22 $32 $27 $22 Total AST Cost $103 $90 $77 $389 $342 $298 $461 $406 $353 Soc. Savings from Crashworthiness $18 $15 $12 $18 $15 $12 $18 $15 $12
Congestion, PD and E S $56 $45 $36 $56 $45 $36 $56 $45 $36 Total Societal Economic Savings $74 $60 $48 $74 $60 $48 $74 $60 $48
VSL $485 $393 $312 $485 $393 $312 $485 $393 $312 Total Monetized Savings $559 $453 $359 $559 $453 $359 $559 $453 $359 Net Cost $29 $30 $29 $315 $282 $250 $386 $346 $305 Net Cost per Fatal Equivalent $0.58 $0.73 $0.90 $6.25 $6.92 $7.71 $7.66 $8.47 $9.41
Net Benefit $456 $363 $283 $170 $110 $62 $99 $47 $7 Benefit Cost Ratio 5.41 5.04 4.68 1.44 1.32 1.21 1.21 1.12 1.02
Table 41. Sensitivity Analysis for Equipping Only New Trucks with AEB using a $5,304,000 VSL by Low Efficacy (16%), Cost, and Discount Rate
Fleet Low Cost Average Cost High Cost
0% 3% 7% 0% 3% 7% 0% 3% 7% All Large trucks 2.12 1.98 1.83 0.56 0.52 0.47 0.48 0.44 0.40 Only CUTs 2.21 2.06 1.91 0.59 0.54 0.49 0.50 0.46 0.42 Only SUTs 1.92 1.79 1.66 0.51 0.47 0.43 0.43 0.40 0.36
Table 42. Sensitivity Analysis for Equipping Only New Trucks with AEB using a $5,304,000 VSL by High Efficacy (28%), Cost, and Discount Rate
Fleet Low Cost Average Cost High Cost
0% 3% 7% 0% 3% 7% 0% 3% 7% All Large trucks 3.71 3.46 3.21 0.99 0.91 0.83 0.83 0.77 0.70 Only CUTs 3.87 3.61 3.35 1.03 0.95 0.86 0.87 0.80 0.73 Only SUTs 3.37 3.14 2.91 0.89 0.82 0.75 0.76 0.69 0.63

54