Embed Size (px)
Citation preview
Inflow Design Flood Control System Plan for Louisa
Generating Station CCR Impoundment
MidAmerican Energy Company
October 10, 2016
Inflow Design Flood Control System Plan for Louisa Generating Station CCR
Impoundment
Prepared for
MidAmerican Energy Company
Muscatine, Iowa
October 10, 2016
Prepared by
Burns & McDonnell Engineering Company, Inc. Kansas City, Missouri
COPYRIGHT © 2016 BURNS & McDONNELL ENGINEERING COMPANY, INC.
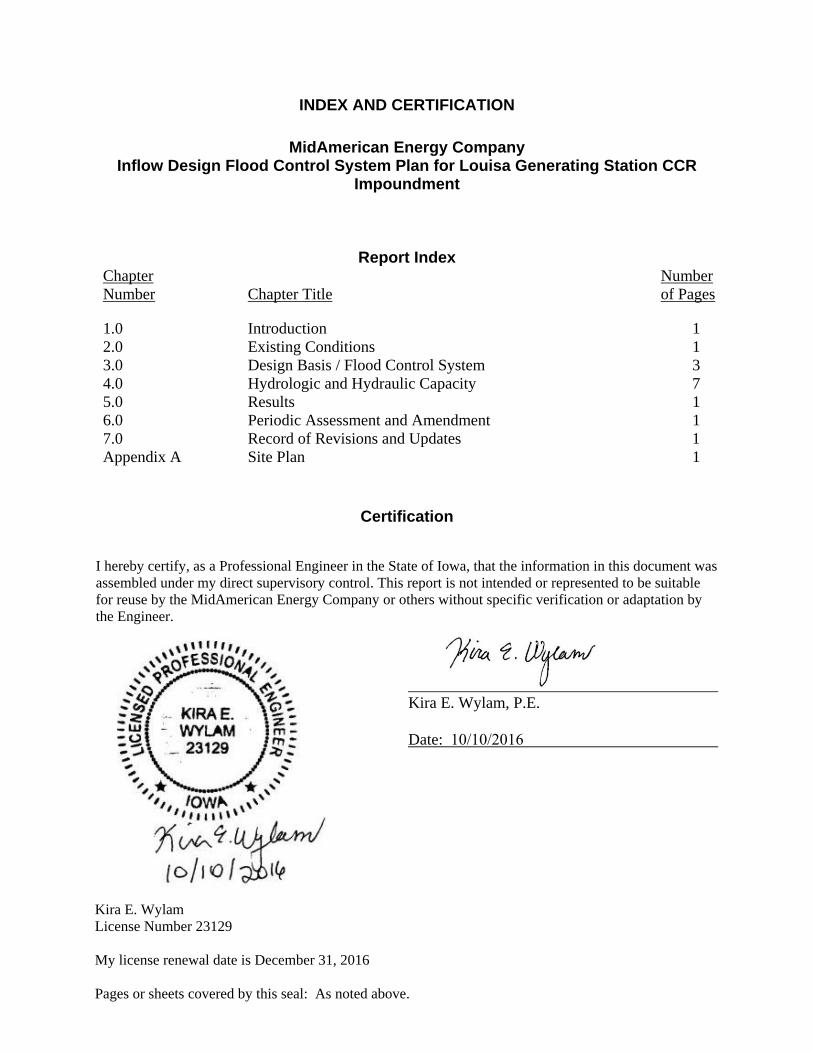
INDEX AND CERTIFICATION
MidAmerican Energy Company Inflow Design Flood Control System Plan for Louisa Generating Station CCR
Impoundment
Report Index Chapter Number Chapter Title
Number of Pages
1.0 Introduction 1 2.0 Existing Conditions 1 3.0 Design Basis / Flood Control System 3 4.0 Hydrologic and Hydraulic Capacity 7 5.0 Results 16.0 Periodic Assessment and Amendment 1 7.0 Record of Revisions and Updates 1 Appendix A Site Plan 1
Certification
I hereby certify, as a Professional Engineer in the State of Iowa, that the information in this document was assembled under my direct supervisory control. This report is not intended or represented to be suitable for reuse by the MidAmerican Energy Company or others without specific verification or adaptation by the Engineer.
Kira E. Wylam, P.E.
Date: 10/10/2016
Kira E. Wylam License Number 23129
My license renewal date is December 31, 2016
Pages or sheets covered by this seal: As noted above.
Inflow Design Flood LGS CCR Surface Impoundment Table of Contents
MidAmerican Energy Company TOC-1 Burns & McDonnell
TABLE OF CONTENTS
Page No.
1.0 INTRODUCTION ............................................................................................... 1-1
2.0 EXISTING CONDITIONS .................................................................................. 2-1
3.0 DESIGN BASIS / FLOOD CONTROL SYSTEM ............................................... 3-1 3.1 Hazard Potential Classification ............................................................................ 3-1 3.2 Inflow Design Flood System Criteria .................................................................. 3-1
3.2.1 Capacity Criteria ................................................................................... 3-1 3.2.2 Freeboard Criteria ................................................................................. 3-1
3.3 Flood Routing Design Criteria ............................................................................. 3-2 3.4 Model Scenarios................................................................................................... 3-2 3.5 Project Mapping ................................................................................................... 3-2
3.5.1 Mapping Sources .................................................................................. 3-2 3.5.2 Vertical Datum ...................................................................................... 3-3 3.5.3 Horizontal Coordinate System .............................................................. 3-3
4.0 HYDROLOGIC AND HYDRAULIC CAPACITY ................................................ 4-1 4.1 Calculation Approach .......................................................................................... 4-1 4.2 Hydrology ............................................................................................................ 4-1
4.2.1 Recurrence Interval and Rainfall Duration ........................................... 4-1 4.2.2 Rainfall Distribution and Depth ............................................................ 4-1 4.2.3 Watershed Delineation and Hydrologic Characteristics ....................... 4-3 4.2.4 Process Inflows ..................................................................................... 4-6 4.2.5 Hydraulic Analysis................................................................................ 4-6
5.0 RESULTS .......................................................................................................... 5-1 5.1 Assumptions ......................................................................................................... 5-1 5.2 Scenario 1 – Normal Operating Conditions ......................................................... 5-1 5.3 Scenario 2 – Federal Design Flood Event ............................................................ 5-1 5.4 Summary .............................................................................................................. 5-2
6.0 PERIODIC ASSESSMENT AND AMENDMENT ............................................... 6-1
7.0 RECORD OF REVISIONS AND UPDATES ...................................................... 7-2
8.0 REFERENCES .................................................................................................. 8-1
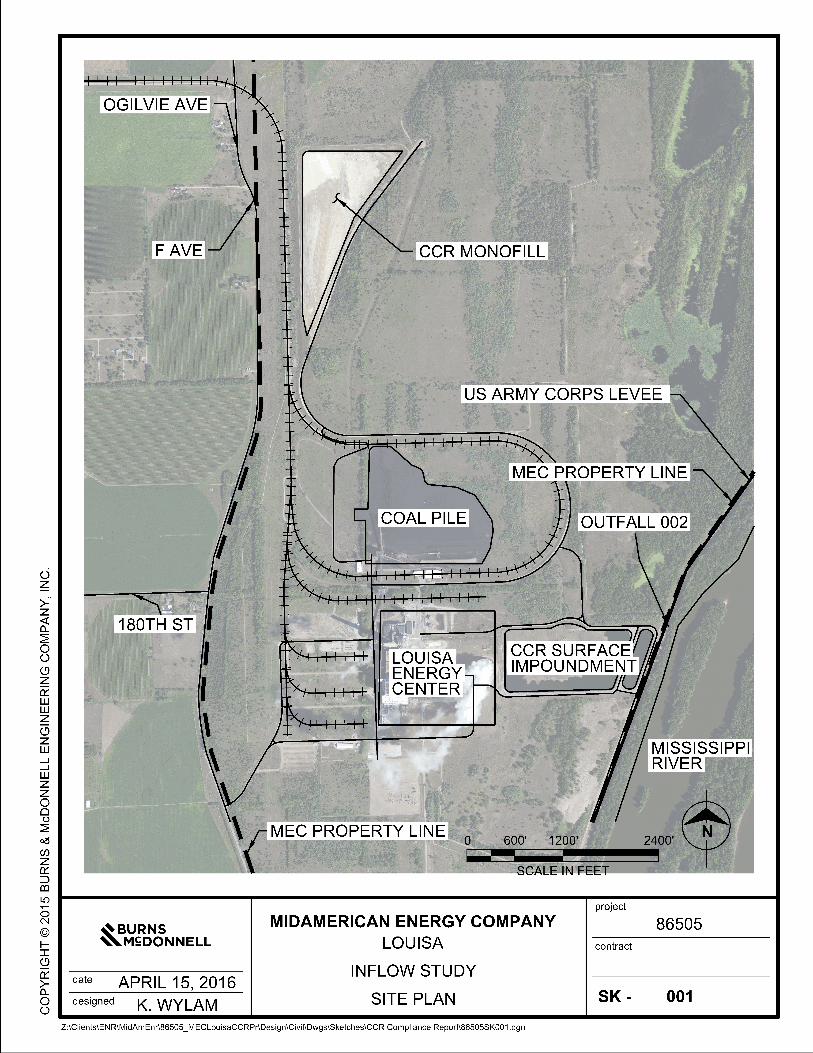
– SITE PLAN

Inflow Design Flood LGS CCR Surface Impoundment List of Abbreviations
MidAmerican Energy Company i Burns & McDonnell
LIST OF ABBREVIATIONS
Abbreviation Term/Phrase/Name
BMcD Burns & McDonnell Engineering Company, Inc.
CCR Coal Combustion Residual
CFR Code of Federal Regulations
CFS Cubic Feet per Second
CY Cubic Yards
ELG Effluent Limitations Guidelines
EPA Environmental Protection Agency
GIS Geographical Information System
GPM Gallons per Minute
LGS Louisa Generating Station
MEC MidAmerican Energy Company
PMP Probable Maximum Precipitation
RCRA Resource Conservations and Recovery Act
U.S.C United States Code
Inflow Design Flood LGS CCR Surface Impoundment Introduction
MidAmerican Energy Company 1-1 Burns & McDonnell
1.0 INTRODUCTION
On April 17, 2015, the Environmental Protection Agency (EPA) issued the final version of the federal
Coal Combustion Residual Rule (CCR Rule) to regulate the disposal of coal combustion residual (CCR)
materials generated at coal-fired units. The rule is administered as part of the Resource Conservation and
Recovery Act [RCRA, 42 United States Code (U.S.C.) §6901 et seq.], using the Subtitle D approach.
The MidAmerican Energy Company (MEC) is subject to the CCR Rule and as such must meet the
hydrologic and hydraulic capacity requirements per 40 Code of Federal Regulations (CFR) §257.82. This
report serves as the inflow design flood control system initial plan for an existing CCR surface
impoundment, known as the CCR Impoundment or Bottom Ash Pond, at the Louisa Generating Station.
Per §257.82, the inflow design flood control system initial plan must contain documentation (including
supporting engineering calculations) that the inflow design flood control system has been designed and
constructed to:
Adequately manage flow into the CCR unit during and following the peak discharge of the
inflow design flood;
Adequately manage flow from the CCR unit to collect and control the peak discharge resulting
from the inflow design flood;
Handle discharge from the CCR surface impoundment in accordance with the surface water
requirements described in 40 CFR §257.3-3.
The seal on this report certifies that the initial inflow design flood control system plan provided herein
meets the requirements of 40 Code of Federal Regulations §257.82.
Inflow Design Flood LGS CCR Surface Impoundment Existing Conditions
MidAmerican Energy Company 2-1 Burns & McDonnell
2.0 EXISTING CONDITIONS
The Louisa Generating Station (LGS), owned by MidAmerican Energy Company (MEC) is located
approximately five miles south of Muscatine, Iowa. The CCR surface impoundment, herein referred to as
the Impoundment, is approximately 30 acres in size, and is composed of two areas: the main
Impoundment area and an overflow portion that is referred to as the “reclaim” area. To the east of the
Impoundment is the U.S. Army Corps of Engineers levee for the Mississippi River near river mile 447.5.
MEC property surrounds the perimeter of the Impoundment on the north, west, and south sides, as shown
on SK-001 in Appendix A.
Discharge from the Impoundment flows through an outfall control structure, which pumps water to
Outfall 002 on the Mississippi River. Plant flows that are directed to the Impoundment are the main plant
drains, ash recycle strainer, oil/water separator, economizer ash tank, pyrites holding tank, and bottom ash
hoppers. Flowrates from these processes were obtained from MEC. The Impoundment also receives
precipitation across its extent.
A normal pool elevation of 561.33 feet North American Vertical Datum of 1988 (NAVD 88), has been
assumed. This elevation was measured during survey activities on July 17, 2015, by HGM and
Associates. Per MEC, this elevation can be maintained using transfer pumps that are capable of pumping
from the reclaim area at a rate of 1,000 gallons per minute (GPM).
Based on available data from the Midwest Regional Climate Center, the area surrounding Muscatine,
Iowa, typically receives about 35.8 inches of precipitation annually. There were 17 and 47 inches of
evapotranspiration in 2014 and 2015 respectively, providing precipitation excess in 2014 and a deficit in
2015.
Inflow Design Flood LGS CCR Surface Impoundment Design Basis / Flood Control System
MidAmerican Energy Company 3-1 Burns & McDonnell
3.0 DESIGN BASIS / FLOOD CONTROL SYSTEM
3.1 Hazard Potential Classification
Per the CCR Rule compliance document titled, “Hazard Potential Classification Assessment for the
Louisa CCR Impoundment”, written in 2016, the Impoundment is classified as having a Low Hazard
Classification per §257.73(a)(2).
3.2 Inflow Design Flood System Criteria
3.2.1 Capacity Criteria
The CCR Rule requires that CCR surface impoundments must have adequate hydrologic and hydraulic
capacity to manage flows for the inflow design flood. Specifically, §257.82 (a) of the CCR regulations
states the following:
“The owner or operator of an existing or new CCR surface impoundment or any lateral expansion
of a CCR surface impoundment must design, construct, operate and maintain an inflow design
flood control system as specified in paragraphs (a)(1) and (2) of this section.
(1) The inflow design flood control system must adequately manage flow into the CCR
unit during and following the peak discharge of the inflow design flood.
(2) The inflow design flood control system must adequately manage flow from the CCR
unit to collect and control the peak discharge resulting from the inflow design flood.”
For this analysis, the above criteria was interpreted to mean that the top of the Impoundment dike should
not be overtopped during the inflow design flood.
3.2.2 Freeboard Criteria
The CCR documentation further discusses that operating freeboard must be adequate to meet performance
standards, but a specific freeboard is not defined. As stated previously, the CCR criteria is interpreted to
mean that the top of the Impoundment dike should not be overtopped during the inflow design flood.
The State of Iowa regulation includes a freeboard requirement (IDNR, 2009). Iowa State regulations state
that for dams without an emergency spillway, the top of dam elevation shall be two feet higher than the
peak flood elevation expected to occur during passage of the freeboard design flood. The suggested
freeboard design flood is one-half of the probable maximum flood. The probable maximum flood is
derived from Equation 1, below.
Inflow Design Flood LGS CCR Surface Impoundment Design Basis / Flood Control System
MidAmerican Energy Company 3-2 Burns & McDonnell
Equation 1
Rainfall = P100 +0.12(PMP-P100).
where PMP is the probable maximum precipitation, and P100 is the 100-year event
A PMP storm duration and 100-year storm duration of six hours is recommended by the state criteria.
3.3 Flood Routing Design Criteria
To evaluate the criterion discussed above, the inflow design flood rainfall event was considered. Per
§257.82, the inflow design flood is based on the hazard potential classification of the Impoundment as
required by §257.73. The inflow design flood for this analysis was a 100-year flood event, due to the
Impoundment’s low hazard classification.
3.4 Model Scenarios
Three (3) modeling scenarios were completed as part of this evaluation. These scenarios were developed
to determine normal operating conditions and to evaluate the above outlined criteria.
Scenario 1 - Normal Operating Conditions. This scenario considered the Impoundment conditions
with no rainfall event occurring (refer to Section 5.2).
Scenario 2 – Inflow Design Flood. The Impoundment was analyzed under a 100-year, 24-hour
event to determine peak stage and freeboard (refer to Section 5.3).
Scenario 3 - Freeboard analysis, using IDNR state recommendations. A precipitation event,
described by Equation 1, was precipitated onto the watershed of the surface impoundment to
evaluate peak stage in comparison to top of dike (refer to Section 5.4).
3.5 Project Mapping
Project mapping for this analysis consisted of a comprehensive inventory of stormwater assets that
contribute to the Impoundment. This included stormwater structures, piping, culverts, and drainage
ditches. To develop the characterization of the existing stormwater system, two primary sources of
information were utilized: a survey and field investigation.
3.5.1 Mapping Sources
Survey data utilized for this analysis was obtained from a survey performed by HGM and Associates in
2015. Background data such as aerial images and information from the National Hydrography Dataset
was obtained from the Iowa Geographic Map Server (IDNR, 2016).

Inflow Design Flood LGS CCR Surface Impoundment Design Basis / Flood Control System
MidAmerican Energy Company 3-3 Burns & McDonnell
3.5.2 Vertical Datum
Mapping sources referenced were in the North American Vertical Datum of 1988 (NAVD 88).
3.5.3 Horizontal Coordinate System
North American Datum (NAD) 1983 State Plane Iowa South (US Feet) coordinate system was utilized as
the basis for mapping and modeling efforts.
Inflow Design Flood LGS CCR Surface Impoundment Hydrologic and Hydraulic Capacity
MidAmerican Energy Company 4-1 Burns & McDonnell
4.0 HYDROLOGIC AND HYDRAULIC CAPACITY
4.1 Calculation Approach
Based upon the simplicity of the water mass balance flows into and out of the Impoundment, the use of
sophisticated modeling software was not required. A spreadsheet analysis that includes all known process
inflows and outflows was used to create a quantitative estimate of the volume and stage of the
Impoundment during design flood conditions.
4.2 Hydrology
4.2.1 Recurrence Interval and Rainfall Duration
The inflow flood design event for this study, as dictated by the hazard potential classification, was a
100-year flood event. Since a storm duration was not specified under §257.82 or other pertinent inflow
flood design sections, a 24-hour storm duration was utilized. This is an industry standard duration and
produces a more conservative rainfall depth than shorter duration storm events. The calculated depth from
Equation 1 was used in the analyzing the State of Iowa requirements, separate from the CCR
requirements. The duration of the storm under the Iowa regulations is six hours.
4.2.2 Rainfall Distribution and Depth
The water mass balance based spreadsheet analysis used to calculate stage and storage within the
Impoundment during design flood conditions does not require the use of rainfall distribution. The
assumption is that the rainfall occurs at once, which is a more conservative approach than distributing the
rainfall over a longer period of time.
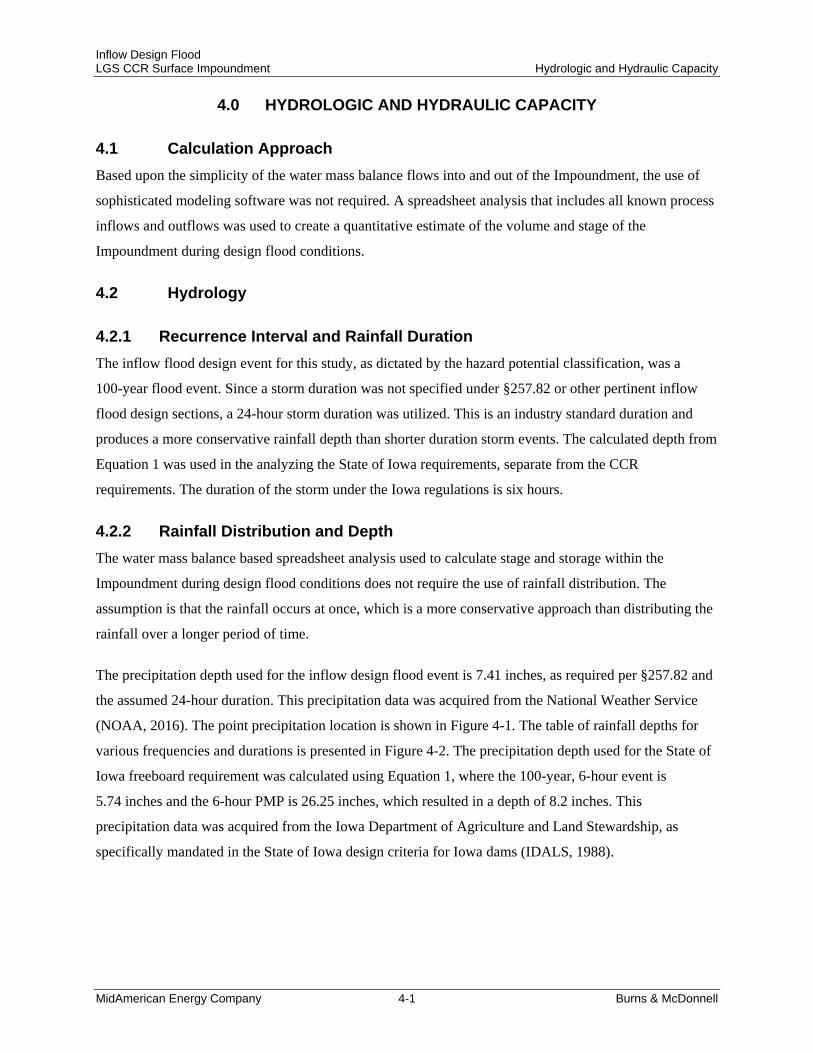
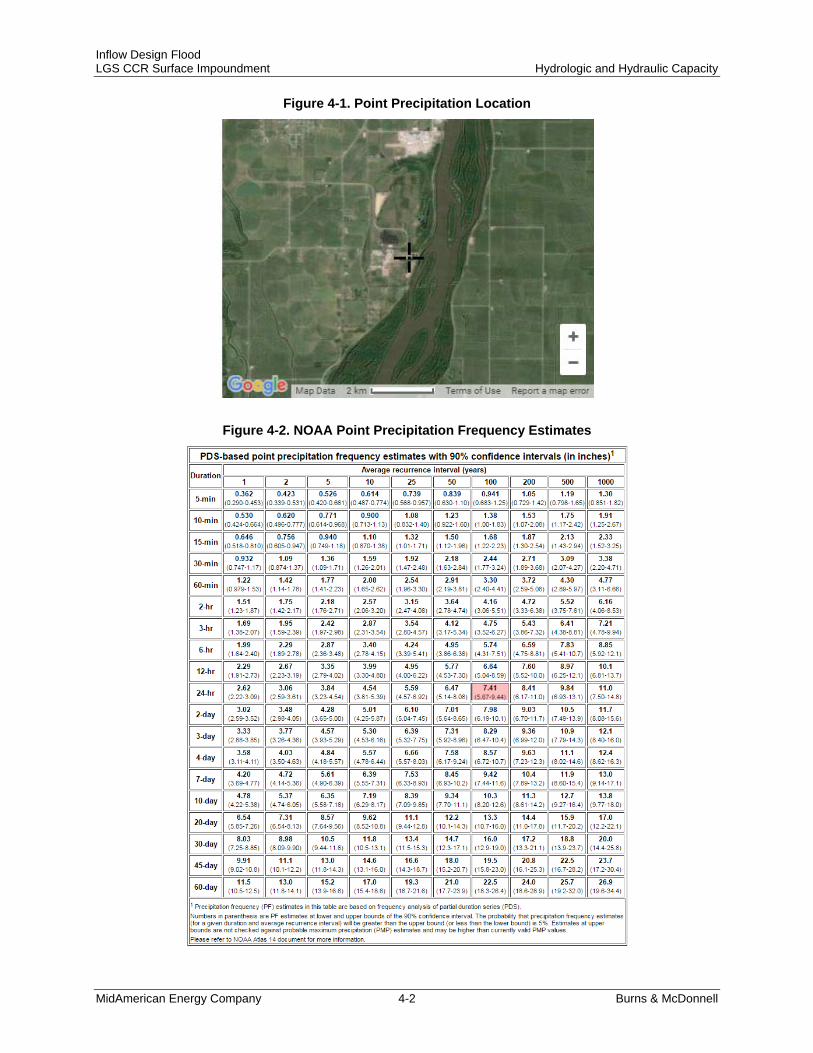
The precipitation depth used for the inflow design flood event is 7.41 inches, as required per §257.82 and
the assumed 24-hour duration. This precipitation data was acquired from the National Weather Service
(NOAA, 2016). The point precipitation location is shown in Figure 4-1. The table of rainfall depths for
various frequencies and durations is presented in Figure 4-2. The precipitation depth used for the State of
Iowa freeboard requirement was calculated using Equation 1, where the 100-year, 6-hour event is
5.74 inches and the 6-hour PMP is 26.25 inches, which resulted in a depth of 8.2 inches. This
precipitation data was acquired from the Iowa Department of Agriculture and Land Stewardship, as
specifically mandated in the State of Iowa design criteria for Iowa dams (IDALS, 1988).
Inflow Design Flood LGS CCR Surface Impoundment Hydrologic and Hydraulic Capacity
MidAmerican Energy Company 4-2 Burns & McDonnell
Figure 4-1. Point Precipitation Location
Figure 4-2. NOAA Point Precipitation Frequency Estimates

Inflow Design Flood LGS CCR Surface Impoundment Hydrologic and Hydraulic Capacity
MidAmerican Energy Company 4-3 Burns & McDonnell
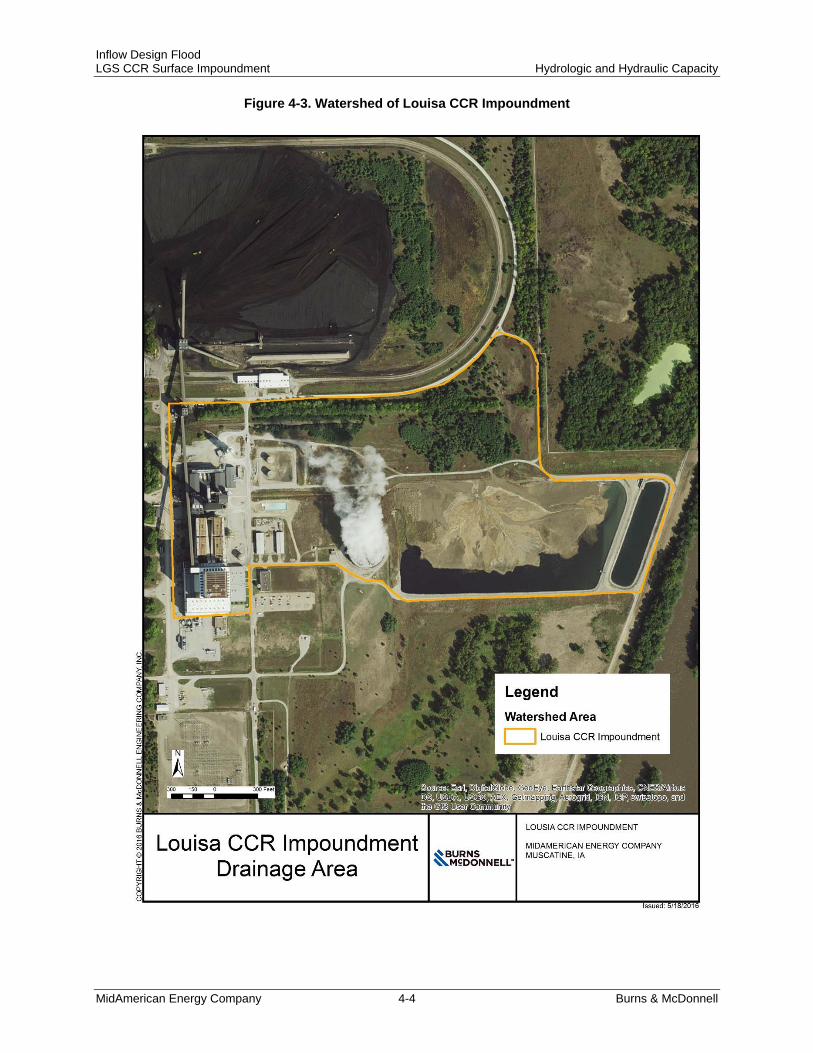
4.2.3 Watershed Delineation and Hydrologic Characteristics
The watershed of the Impoundment was delineated using the mapping sources as discussed in Section
3.5.1. The watershed of the Impoundment is shown in Figure 4-3, below. Using Geographical Information
System (GIS) tools, the watershed was calculated to be 99.5 acres.
The simple water mass balance approach proposed in this document uses conservative assumptions, with
respect to timing. The NRCS TR-55 methodology of rainfall loss was used to estimate the total rainfall
depth after losses.
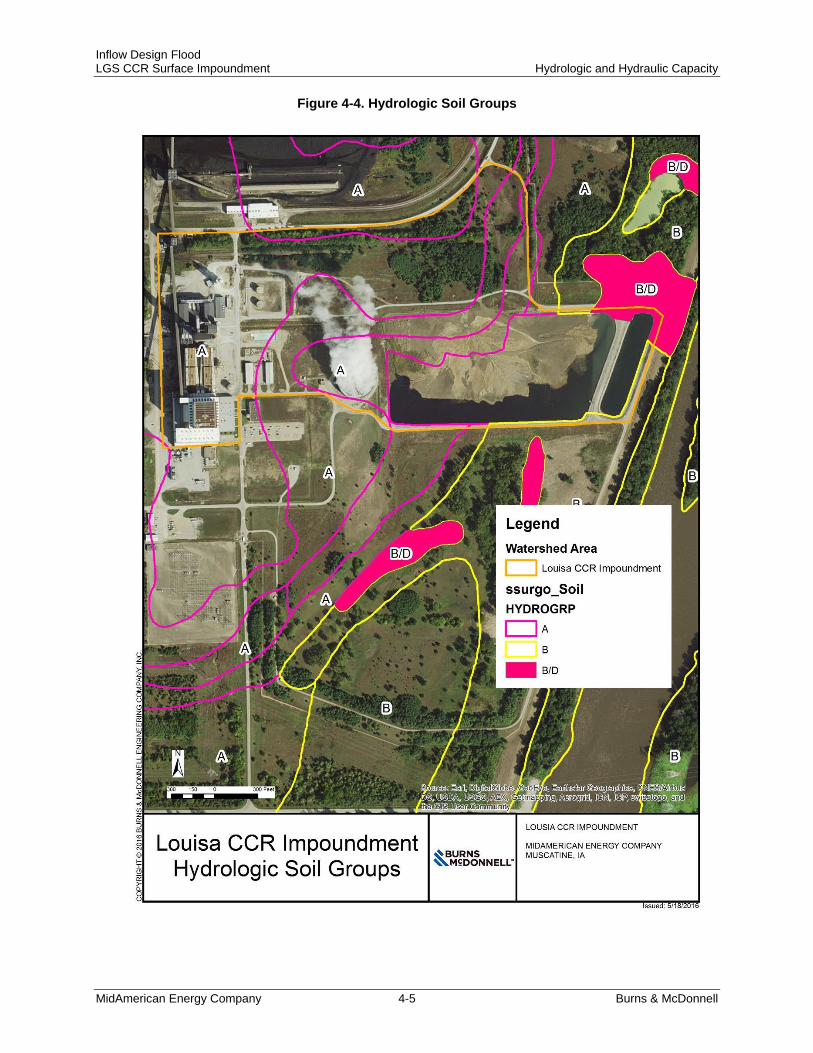
The site soils primarily belong to hydrologic soil group (HSG) A, characterized by having low run-off
potential and a high infiltration rate, even when fully wetted, as shown in Figure 4-4. The hydrologic soil
classification was obtained from the Iowa Geological and Water Survey. A curve number of 70 was used
to determine rainfall losses due to infiltration and was obtained from Table 3 in Section 2C-5 of the Iowa
Stormwater Manual (IDNR, 2009).
Inflow Design Flood LGS CCR Surface Impoundment Hydrologic and Hydraulic Capacity
MidAmerican Energy Company 4-4 Burns & McDonnell
Figure 4-3. Watershed of Louisa CCR Impoundment
Inflow Design Flood LGS CCR Surface Impoundment Hydrologic and Hydraulic Capacity
MidAmerican Energy Company 4-5 Burns & McDonnell
Figure 4-4. Hydrologic Soil Groups
Inflow Design Flood LGS CCR Surface Impoundment Hydrologic and Hydraulic Capacity
MidAmerican Energy Company 4-6 Burns & McDonnell
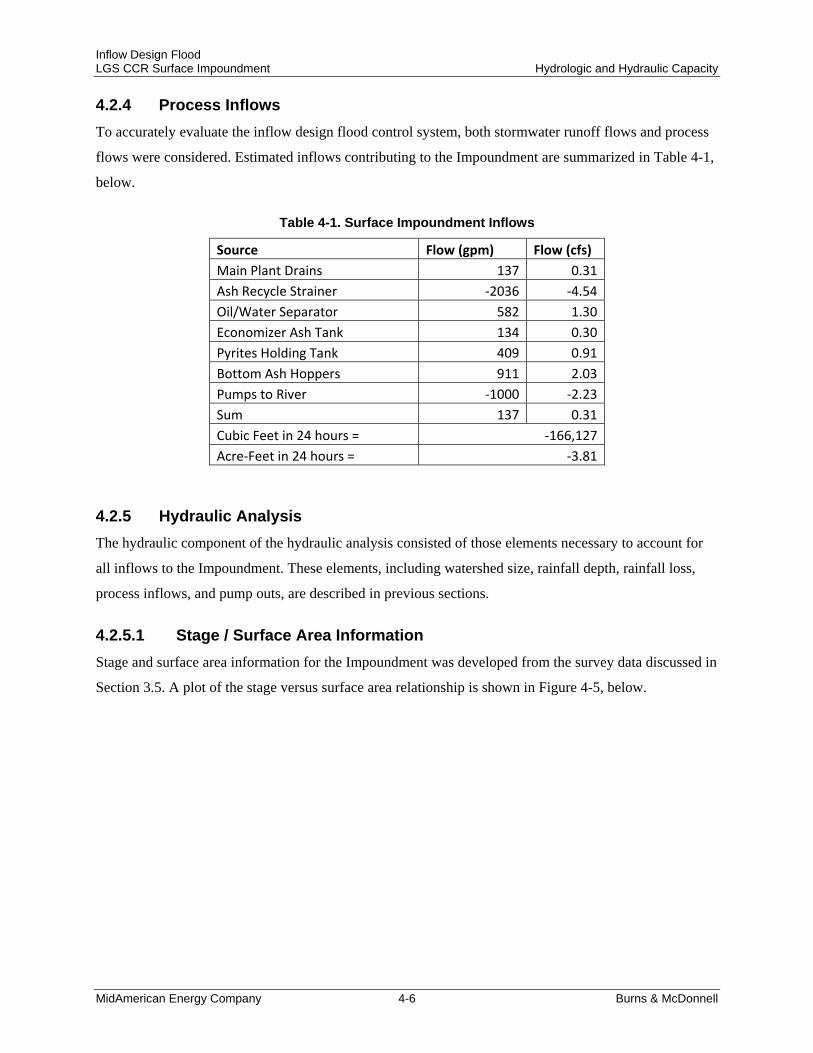
4.2.4 Process Inflows
To accurately evaluate the inflow design flood control system, both stormwater runoff flows and process
flows were considered. Estimated inflows contributing to the Impoundment are summarized in Table 4-1,
below.
Table 4-1. Surface Impoundment Inflows
Source Flow (gpm) Flow (cfs)
Main Plant Drains 137 0.31
Ash Recycle Strainer ‐2036 ‐4.54
Oil/Water Separator 582 1.30
Economizer Ash Tank 134 0.30
Pyrites Holding Tank 409 0.91
Bottom Ash Hoppers 911 2.03
Pumps to River ‐1000 ‐2.23
Sum 137 0.31
Cubic Feet in 24 hours = ‐166,127
Acre‐Feet in 24 hours = ‐3.81
4.2.5 Hydraulic Analysis
The hydraulic component of the hydraulic analysis consisted of those elements necessary to account for
all inflows to the Impoundment. These elements, including watershed size, rainfall depth, rainfall loss,
process inflows, and pump outs, are described in previous sections.
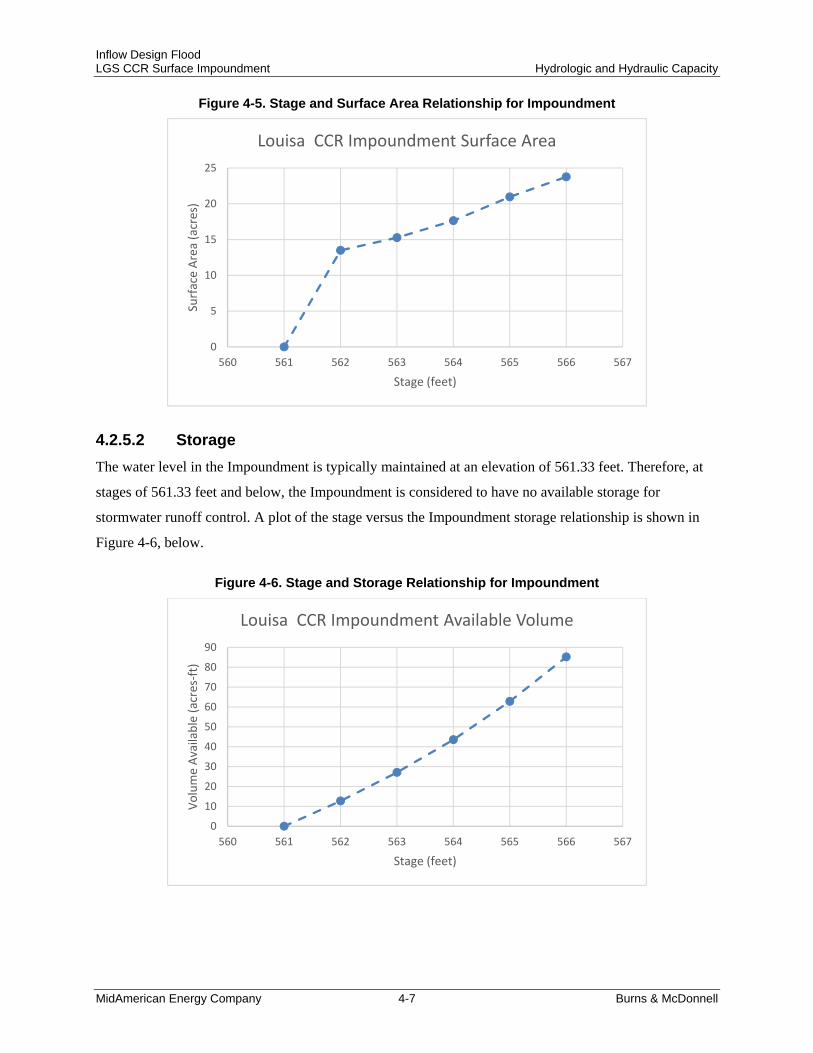
4.2.5.1 Stage / Surface Area Information
Stage and surface area information for the Impoundment was developed from the survey data discussed in
Section 3.5. A plot of the stage versus surface area relationship is shown in Figure 4-5, below.
Inflow Design Flood LGS CCR Surface Impoundment Hydrologic and Hydraulic Capacity
MidAmerican Energy Company 4-7 Burns & McDonnell
Figure 4-5. Stage and Surface Area Relationship for Impoundment
4.2.5.2 Storage
The water level in the Impoundment is typically maintained at an elevation of 561.33 feet. Therefore, at
stages of 561.33 feet and below, the Impoundment is considered to have no available storage for
stormwater runoff control. A plot of the stage versus the Impoundment storage relationship is shown in
Figure 4-6, below.
Figure 4-6. Stage and Storage Relationship for Impoundment
0
5
10
15
20
25
560 561 562 563 564 565 566 567
Surface Area (acres)
Stage (feet)
Louisa CCR Impoundment Surface Area
0
10
20
30
40
50
60
70
80
90
560 561 562 563 564 565 566 567
Volume Available (acres‐ft)
Stage (feet)
Louisa CCR Impoundment Available Volume
Inflow Design Flood LGS CCR Surface Impoundment Results
MidAmerican Energy Company 5-1 Burns & McDonnell
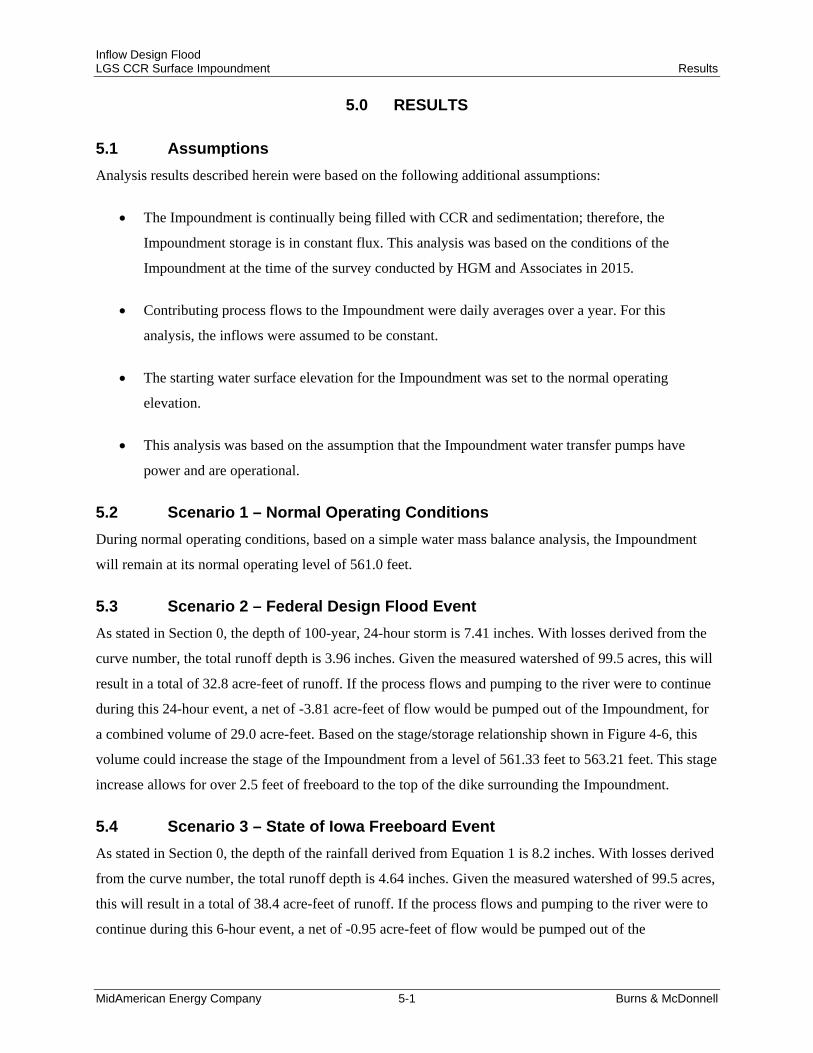
5.0 RESULTS
5.1 Assumptions
Analysis results described herein were based on the following additional assumptions:
The Impoundment is continually being filled with CCR and sedimentation; therefore, the
Impoundment storage is in constant flux. This analysis was based on the conditions of the
Impoundment at the time of the survey conducted by HGM and Associates in 2015.
Contributing process flows to the Impoundment were daily averages over a year. For this
analysis, the inflows were assumed to be constant.
The starting water surface elevation for the Impoundment was set to the normal operating
elevation.
This analysis was based on the assumption that the Impoundment water transfer pumps have
power and are operational.
5.2 Scenario 1 – Normal Operating Conditions
During normal operating conditions, based on a simple water mass balance analysis, the Impoundment
will remain at its normal operating level of 561.0 feet.
5.3 Scenario 2 – Federal Design Flood Event
As stated in Section 0, the depth of 100-year, 24-hour storm is 7.41 inches. With losses derived from the
curve number, the total runoff depth is 3.96 inches. Given the measured watershed of 99.5 acres, this will
result in a total of 32.8 acre-feet of runoff. If the process flows and pumping to the river were to continue
during this 24-hour event, a net of -3.81 acre-feet of flow would be pumped out of the Impoundment, for
a combined volume of 29.0 acre-feet. Based on the stage/storage relationship shown in Figure 4-6, this
volume could increase the stage of the Impoundment from a level of 561.33 feet to 563.21 feet. This stage
increase allows for over 2.5 feet of freeboard to the top of the dike surrounding the Impoundment.
5.4 Scenario 3 – State of Iowa Freeboard Event
As stated in Section 0, the depth of the rainfall derived from Equation 1 is 8.2 inches. With losses derived
from the curve number, the total runoff depth is 4.64 inches. Given the measured watershed of 99.5 acres,
this will result in a total of 38.4 acre-feet of runoff. If the process flows and pumping to the river were to
continue during this 6-hour event, a net of -0.95 acre-feet of flow would be pumped out of the

Inflow Design Flood LGS CCR Surface Impoundment Results
MidAmerican Energy Company 5-2 Burns & McDonnell
Impoundment, for a combined volume of 37.5 acre-feet. Based on the stage/storage relationship shown in
Figure 4-6, this volume could increase the stage of the Impoundment from a level of 561.33 feet to
563.96 feet. This stage increase allows for 2.04 feet of freeboard to the top of the dike surrounding the
Impoundment.
5.5 Summary
Results for all scenarios indicated that the Impoundment was not overtopped. Based on these results, CCR
regulations were considered to be met for the LGS Surface Impoundment.

Inflow Design Flood LGS CCR Surface Impoundment Periodic Assessment and Amendment
MidAmerican Energy Company 6-1 Burns & McDonnell
6.0 PERIODIC ASSESSMENT AND AMENDMENT
MidAmerican Energy must place this initial inflow design flood plan in the CCR Operating Record by
October 17, 2016. MEC may amend the plan at any time, and is required to do so whenever there is a
change in conditions which would substantially affect the written plan in effect. MEC must prepare
periodic inflow design flood control system plans every five years. Each periodic plan or amendment to
the written plan shall be certified by a qualified professional engineer in the State of Iowa. All
amendments and revisions must be placed on the CCR public website. A record of revisions made to this
document is included in Section 7.0.

Inflow Design Flood LGS CCR Surface Impoundment Record of Revisions and Updates
MidAmerican Energy Company 7-2 Burns & McDonnell
7.0 RECORD OF REVISIONS AND UPDATES
Revision Number Date Revisions Made By Whom
0 10/10/2016 Initial Issue Burns & McDonnell
Inflow Design Flood LGS CCR Surface Impoundment References
MidAmerican Energy Company 8-1 Burns & McDonnell
8.0 REFERENCES
Geographic Information Systems (GIS Section), Iowa Geological and Water Survey, Iowa Department of
Natural Resources. https://programs.iowadnr.gov/nrgislibx/. Accessed 3/7/2016.
Iowa Department of Natural Resources, 1990. Technical Bulletin No. 16, Design Criteria and Guidelines
for Iowa Dams. Des Moines, Iowa
Iowa Department of Agriculture and Land Stewardship, State Climatology Office. Climatology of Iowa
Series No. 2, Revised. Iowa Precipitation Frequencies. Paul Waite, 1988.
Iowa Department of Natural Resources. 2009. Iowa Stormwater Management Manual, Version 3.
http://www.iowadnr.gov/Environmental-Protection/Water-Quality/NPDES-Storm-Water/Storm-Water-
Manual
Iowa State University http://mesonet.agron.iastate.edu/, Muscatine (Muscatine County, FRUI4)
National Weather Service. Precipitation Frequency Data Server (PFDS). NOAA's National Weather
Service, Hydrometeorological Design Studies Center. [Online] [Cited: March 15, 2016.]
http://hdsc.nws.noaa.gov/hdsc/pfds/.
United States Department of Agriculture, Natural Resources Conservation Service. Urban Hydrology for
Small Watersheds, Technical Release 55. June 1986. (210-VI-TR-55, Second Ed., June 1986)
United States Environmental Protection Agency (EPA) Federal Register, 2015. Vol. 80. No. 74. April 17,
2015. 40 CFR Parts 257 and 261. Page 21480.

– SITE PLAN

Burns & McDonnell World Headquarters9400 Ward Parkway
Kansas City, MO 64114 O 816-333-9400 F 816-333-3690
www.burnsmcd.com