Embed Size (px)
Citation preview
315 International Research: Journal of Library & Information Science | Vol.4 No.3, Sep. 2014
Measuring Service Quality in the Central Library of Jawaharlal Nehru University: A
Study
Sufian Ahmad
Librarian
Sahitya Akademi
New Delhi, India
Abstract
The present study aims to assess the service quality of the Central Library of Jawaharlal Nehru
University. The major objective of the study is to investigate the quality management system in
the proposed library and how far it has been succeeded in delivering service quality.
Questionnaire method (closed-ended and open-ended) has been used for data collection. A
modified SERVQUAL instrument developed by Parasuraman, et al. (1988) has been used in the
questionnaire to measure the outcome performance and perceptions of quality services through
users. The questionnaire contains six dimensions of quality services, i.e., reliability,
responsiveness, assurance, access, communications and tangibles. The closed-ended
questionnaire was designed to assess responses of users on a five point Likert scale for both
types of respondents (Faculty Members and Research Scholars) to measure perception of service
quality.
Keywords: Quality management, Service quality, Jawaharlal Nehru University (JNU), Central
Library, SERVEQUAL instrument, Service quality attributes.
Introduction
Amidst drastic and dramatic changes in global information environment, libraries and
information centers have become very complex systems. The libraries have transformed
drastically from mere storehouses of books and journals to the powerhouses of knowledge and
information. The advent of information and communication technology is responsible for this
revolution. The very existence of libraries depends on users’ satisfaction and users are getting
satisfied when the library is able to rise up to his or her expectations or meet the actual needs. A
quality service is said to be one, which satisfy the users’ expectation resulting a good experience.
Throughout the history, libraries were mainly concerned with collection development and
processing. The library professions were less concern to quality in product and services and
hence never checked whether the users were satisfied or not. However, the increasing
expectations of users have challenged libraries to improve their quality of services. With
constraint budget, librarians, today, feel more pressure to fully exploit the available resources.
Therefore, several libraries and information services have adopted quality management practices
in recent years.
About the Central Library
The library of JNU truly is one of the outstanding libraries with the modern infrastructures and a
huge collection of rare books, journals, research papers which are of immense use for the
316 International Research: Journal of Library & Information Science | Vol.4 No.3, Sep. 2014
research scholars, teachers, students, etc. JNUL is truly the reigning king in India by catering to
the infinite demands of the students by its huge repository of books, periodicals, journals,
research papers etc.
The Central library has approx. 6 lacs of books, more than1. lac of bound volume periodicals,
18000 thesis and dissertations, and 1,18,701 Newsclippings. The library also subscribes 711
current periodicals. Apart from that the library also subscribes large number of e-journals and
databases.
Objective of the Study
The objective of the study is primarily to investigate the quality management in the Central
Library of JNU and to measure the perception of users as they relate to quality of information
products and services. The study also reveals how far the library has succeeded in delivering the
quality services to the users.
Tools used for the Study
Questionnaire, observation and interview method have been used for the study.
Questionnaire Design
The questionnaire were designed for the investigation of quality service perceptions among
faculty members and research scholars which contained the modified SERVQUAL instrument
developed by Parasuraman (1988), to measure the outcome performance and perceptions of
quality services. It includes 38 questions (open-ended and closed-ended) referring to different
aspects of service quality of the university library. The closed-ended questions were designed to
solicit responses on a five-point Likert scale for both types of respondents (faculty members and
research scholars) to measure the perception of service quality. The questionnaire contains six
dimensions of quality services, which are as follows:
Reliability: This service quality dimension consists of five attributes (questions), which refers to
the delivery of services as it relates to dependability and accuracy, such as;
1. Giving correct answers to reference questions,
2. Making relevant information available,
3. Consistency of cataloguing and classification of Library materials,
4. Reliability of databases in providing information,
5. Making sure that overdue and fine notices are accurate.
Responsiveness: This service quality dimension consists of six attributes (questions), which
measures the readiness of library staff in providing services, such as;
1. Making latest information available,
2. Timeliness delivery of information,
3. Re-Shelving of books,
4. Effective Inter Library Loan (ILL) System),
5. Familiarity with OPAC,
6. Recency of Periodicals.
Assurance: This service quality dimension consists of five attributes (questions), which
measures the knowledge and courtesy of the library staff and their ability to convey confidence,
such as;
1. Appearance of staff,
317 International Research: Journal of Library & Information Science | Vol.4 No.3, Sep. 2014
2. Thorough understanding of the collections,
3. Familiarity of CD-ROM System,
4. Providing individual attention to users,
5. Recognizing the regular users by the library staff.
Access: This service quality dimension consists of five attributes (questions), which measures
the ability to reach out for something and getting and finding it as and when it is needed, such as;
1. Availability of staff at reference desk,
2. Availability of photocopy facility,
3. Availability of computer terminals,
4. Library opening hours,
5. Time spent at circulation desk,
Communication: This service quality dimension consists of six attributes (questions), which
measures the ability to keep clients informed in a language they understand and the ability to
listen to them, such as;
1. Awareness of library facilities and services,
2. Provision of user education,
3. Effectiveness of library website,
4. Availability and easiness in the use of OPAC user manual,
5. Availability and easiness in the use of CD-ROM user manual,
6. Assuring users that his/her problems will be handled.
Tangibles: This service quality dimension consists of four attributes (questions), which
measures the maintenance of physical facilities, such as;
1. Library furniture,
2. Temperature setting in the library,
3. Proper lighting in the library,
4. Maintenance of silence in the reading room.
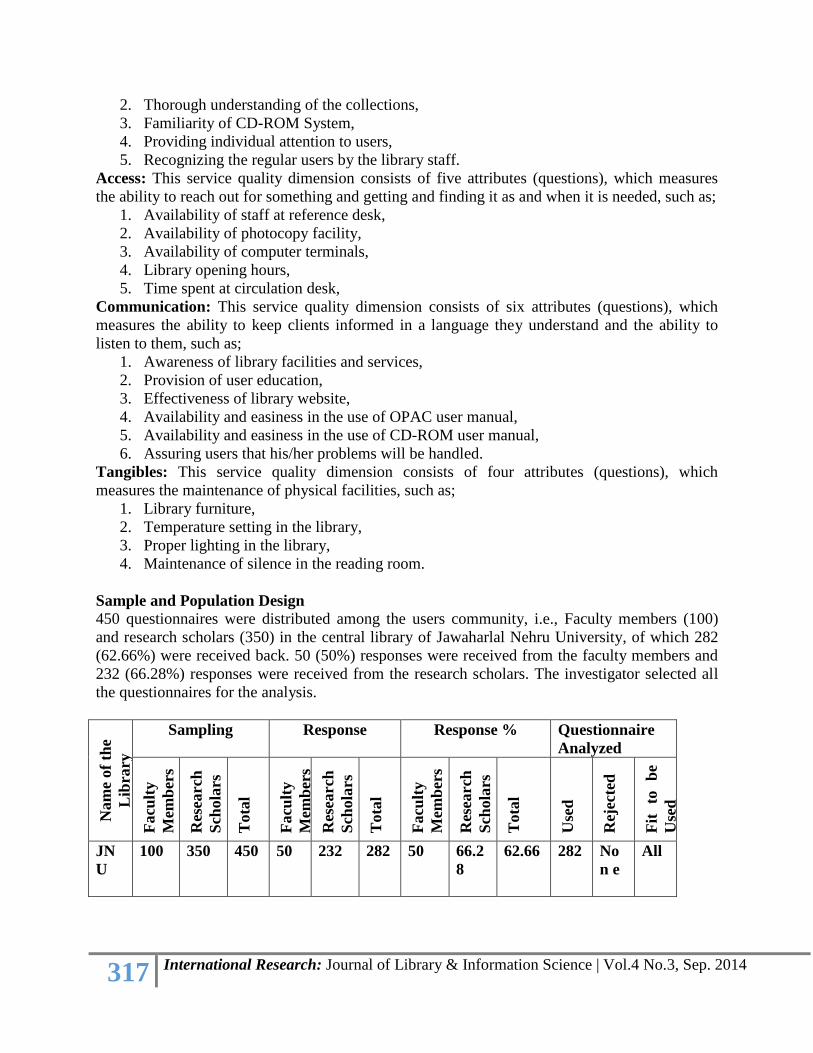
Sample and Population Design
450 questionnaires were distributed among the users community, i.e., Faculty members (100)
and research scholars (350) in the central library of Jawaharlal Nehru University, of which 282
(62.66%) were received back. 50 (50%) responses were received from the faculty members and
232 (66.28%) responses were received from the research scholars. The investigator selected all
the questionnaires for the analysis.
Nam
e of
the
Lib
rary
Sampling Response Response % Questionnaire
Analyzed
Facu
lty
Mem
ber
s
Res
earch
Sch
ola
rs
Tota
l
Facu
lty
Mem
ber
s
Res
earch
Sch
ola
rs
Tota
l
Facu
lty
Mem
ber
s
Res
earch
Sch
ola
rs
Tota
l
Use
d
Rej
ecte
d
Fit
to
b
e
Use
d
JN
U
100 350 450 50 232 282 50 66.2
8
62.66 282 No
n e
All
318 International Research: Journal of Library & Information Science | Vol.4 No.3, Sep. 2014
Methodology
A questionnaire was designed to assess responses of users. The data collected through
questionnaires and informal interviews were organized and tabulated by using statistical
methods, tables and percentage, mean and average mean. For analyzing the users perception
score each item were calculated on a five point Likert scale for both types of users in the form of
mean, and average mean.
Data Analysis, Interpretation and Findings
The investigator used six quality dimensions, i.e., reliability, responsiveness, assurance, access,
communication and tangibles to measure the quality management in the central library of JNU.
Each dimension posses certain set of attributes, dependable enough to measure the qualitative
aspect. Responses indicated in questionnaire as 1 represented ‘strongly agree’, 2 ‘agree’, 3
‘disagree’, 4 ‘strongly disagree’ and 5 ‘not sure’. The option 1 & 2 indicated ‘Positive’ response,
option 3 & 4 is ‘Negative’ response and option 5 represented ‘Not Sure’.
Quality Dimension: Reliability
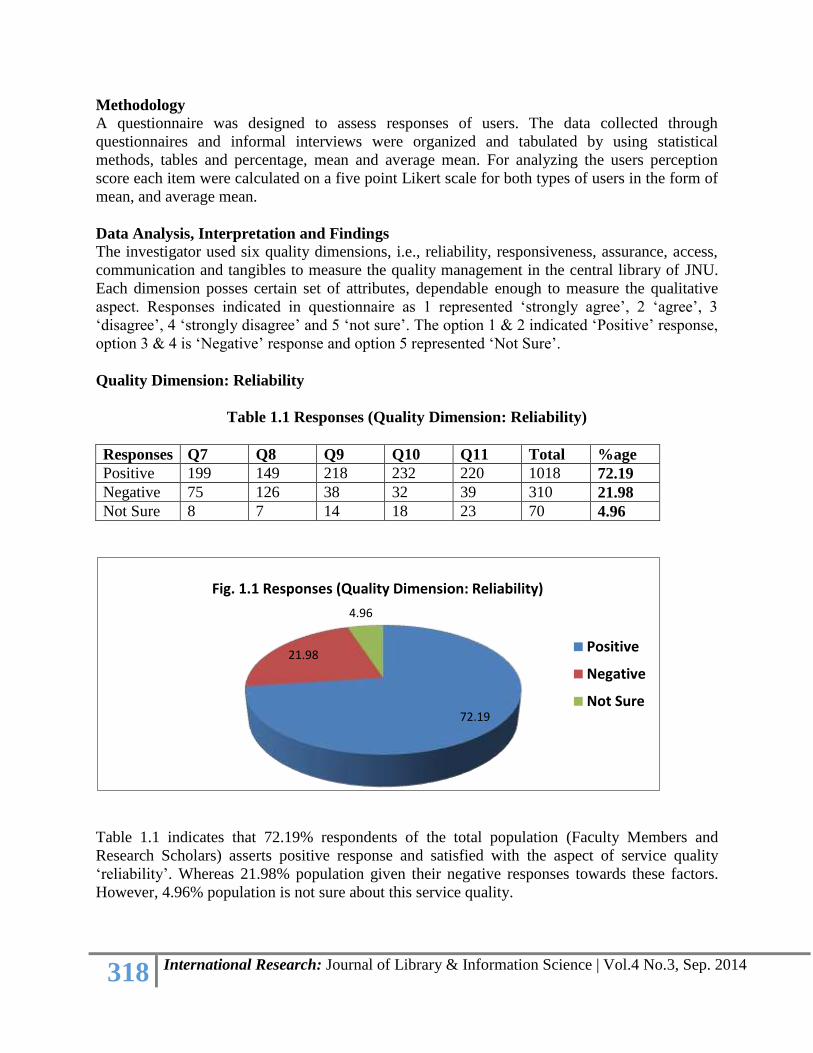
Table 1.1 Responses (Quality Dimension: Reliability)
Responses Q7 Q8 Q9 Q10 Q11 Total %age
Positive 199 149 218 232 220 1018 72.19
Negative 75 126 38 32 39 310 21.98
Not Sure 8 7 14 18 23 70 4.96
Table 1.1 indicates that 72.19% respondents of the total population (Faculty Members and
Research Scholars) asserts positive response and satisfied with the aspect of service quality
‘reliability’. Whereas 21.98% population given their negative responses towards these factors.
However, 4.96% population is not sure about this service quality.
72.19
21.98
4.96
Positive
Negative
Not Sure
Fig. 1.1 Responses (Quality Dimension: Reliability)
319 International Research: Journal of Library & Information Science | Vol.4 No.3, Sep. 2014
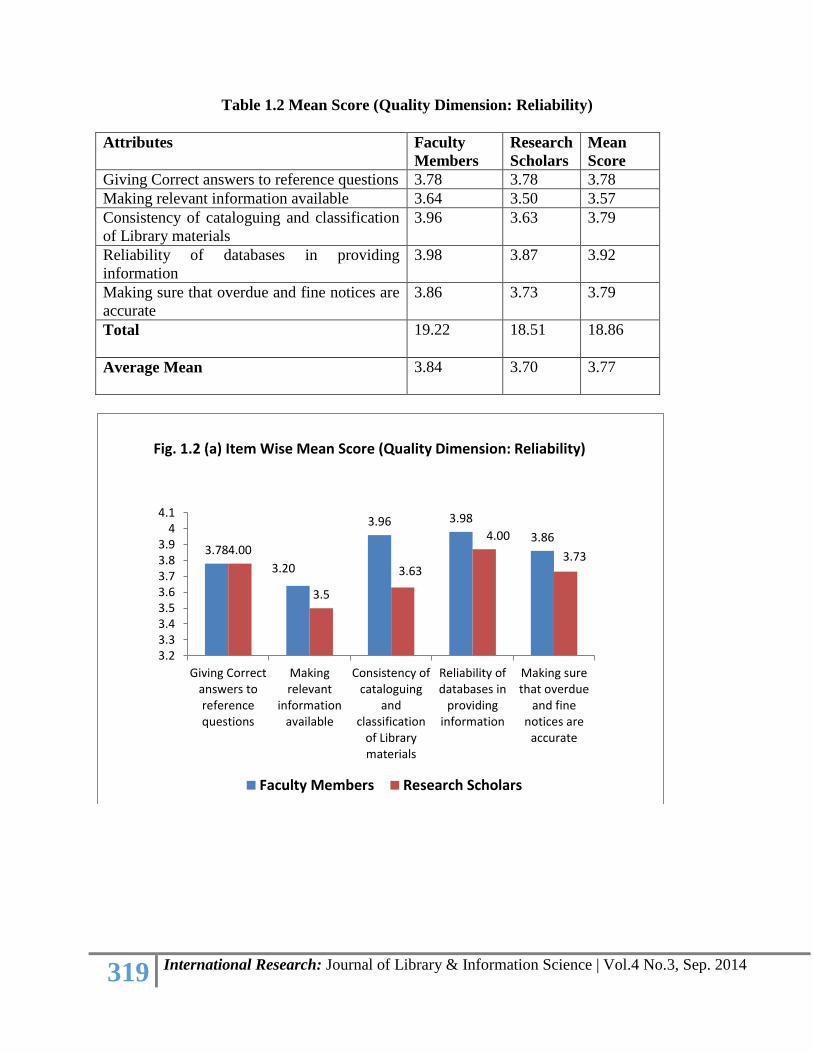
Table 1.2 Mean Score (Quality Dimension: Reliability)
Attributes Faculty
Members
Research
Scholars
Mean
Score
Giving Correct answers to reference questions 3.78 3.78 3.78
Making relevant information available 3.64 3.50 3.57
Consistency of cataloguing and classification
of Library materials
3.96 3.63 3.79
Reliability of databases in providing
information
3.98 3.87 3.92
Making sure that overdue and fine notices are
accurate
3.86 3.73 3.79
Total
19.22 18.51 18.86
Average Mean
3.84 3.70 3.77
3.78
3.20
3.96 3.98
3.864.00
3.5
3.63
4.00
3.73
3.23.33.43.53.63.73.83.9
44.1
Giving Correctanswers toreferencequestions
Makingrelevant
informationavailable
Consistency ofcataloguing
andclassification
of Librarymaterials
Reliability ofdatabases in
providinginformation
Making surethat overdue
and finenotices are
accurate
Faculty Members Research Scholars
Fig. 1.2 (a) Item Wise Mean Score (Quality Dimension: Reliability)
320 International Research: Journal of Library & Information Science | Vol.4 No.3, Sep. 2014
Table 1.2 reveals that ‘Reliability of databases in providing information’ scored the highest mean
for both types of user groups (3.92), followed by ‘Consistency of cataloguing and classification
of library materials’ as well as ‘Making sure that overdue and fine notices are accurate’ which
scored (3.79). Whereas ‘Giving correct answers to reference questions’ scored (3.78), followed
by ‘Making relevant information available’ (3.57), which is the lowest mean score of the
respondents.
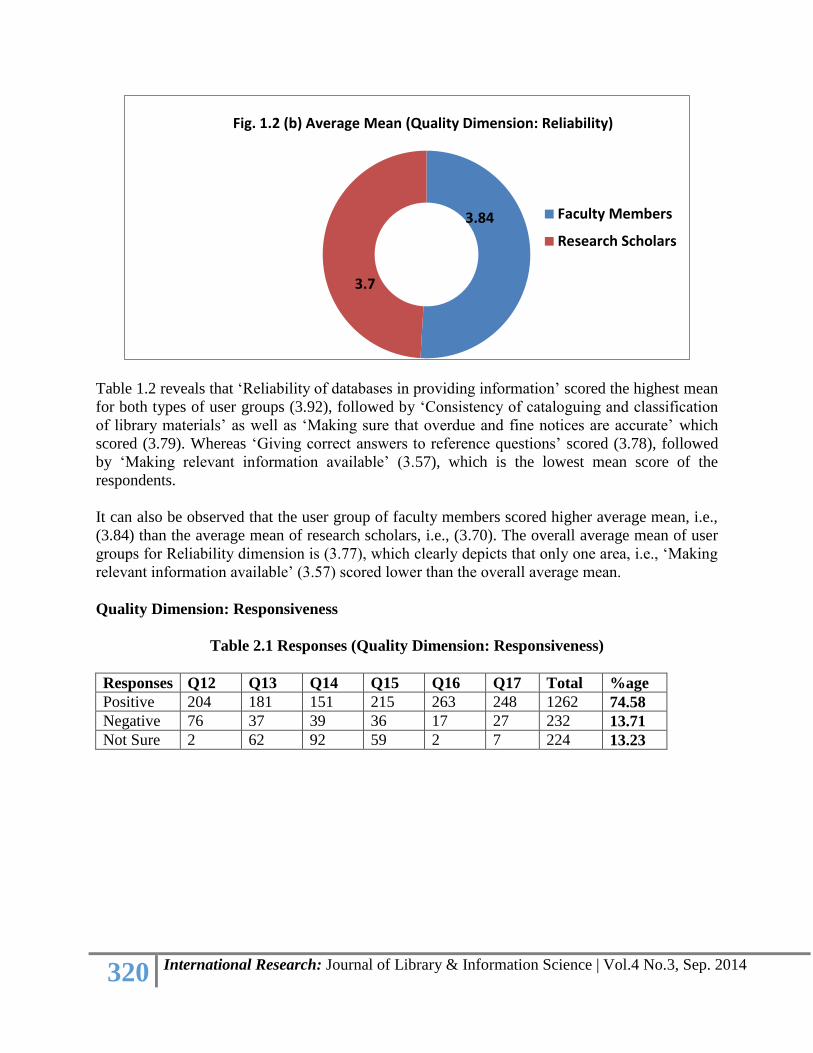
It can also be observed that the user group of faculty members scored higher average mean, i.e.,
(3.84) than the average mean of research scholars, i.e., (3.70). The overall average mean of user
groups for Reliability dimension is (3.77), which clearly depicts that only one area, i.e., ‘Making
relevant information available’ (3.57) scored lower than the overall average mean.
Quality Dimension: Responsiveness
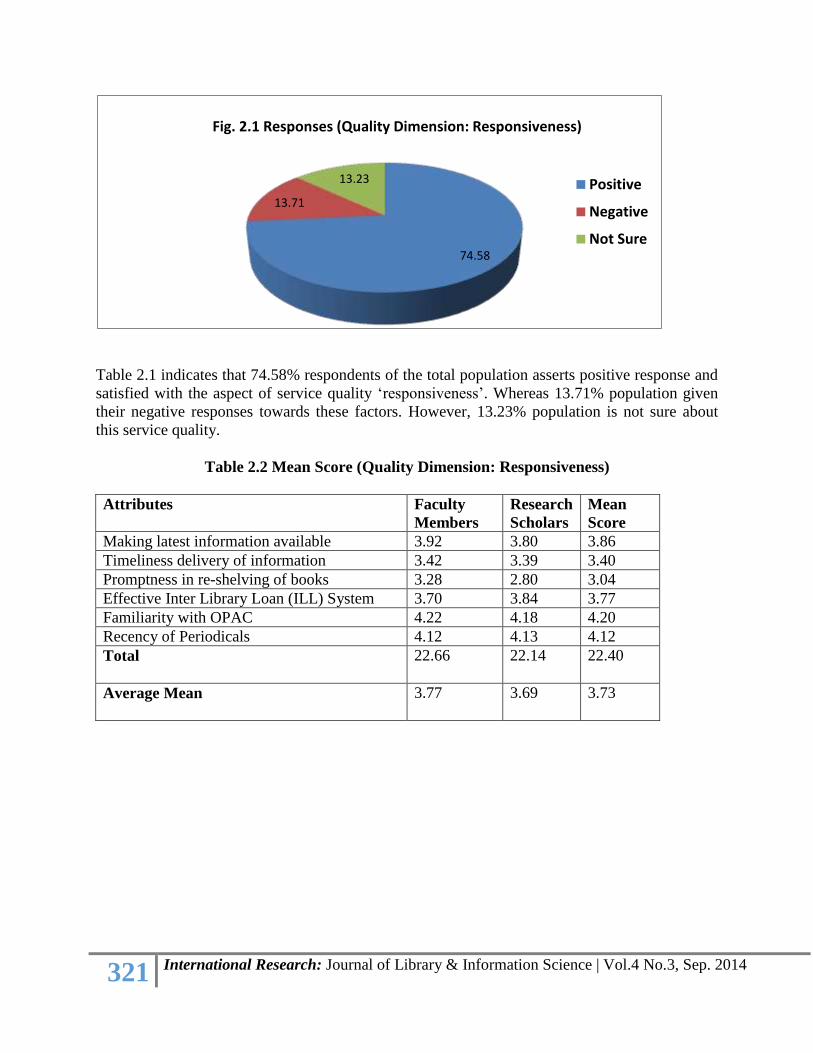
Table 2.1 Responses (Quality Dimension: Responsiveness)
Responses Q12 Q13 Q14 Q15 Q16 Q17 Total %age
Positive 204 181 151 215 263 248 1262 74.58
Negative 76 37 39 36 17 27 232 13.71
Not Sure 2 62 92 59 2 7 224 13.23
3.84
3.7
Faculty Members
Research Scholars
Fig. 1.2 (b) Average Mean (Quality Dimension: Reliability)
321 International Research: Journal of Library & Information Science | Vol.4 No.3, Sep. 2014
Table 2.1 indicates that 74.58% respondents of the total population asserts positive response and
satisfied with the aspect of service quality ‘responsiveness’. Whereas 13.71% population given
their negative responses towards these factors. However, 13.23% population is not sure about
this service quality.
Table 2.2 Mean Score (Quality Dimension: Responsiveness)
Attributes Faculty
Members
Research
Scholars
Mean
Score
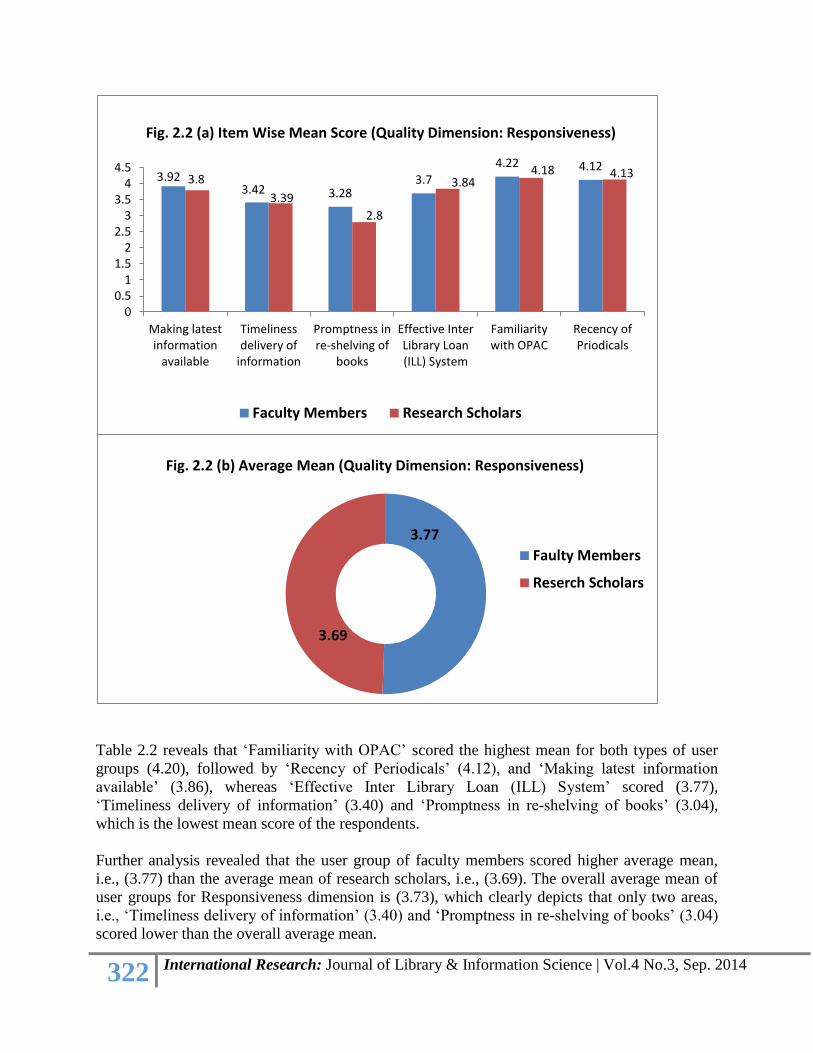
Making latest information available 3.92 3.80 3.86
Timeliness delivery of information 3.42 3.39 3.40
Promptness in re-shelving of books 3.28 2.80 3.04
Effective Inter Library Loan (ILL) System 3.70 3.84 3.77
Familiarity with OPAC 4.22 4.18 4.20
Recency of Periodicals 4.12 4.13 4.12
Total
22.66 22.14 22.40
Average Mean
3.77 3.69 3.73
74.58
13.71
13.23 Positive
Negative
Not Sure
Fig. 2.1 Responses (Quality Dimension: Responsiveness)
322 International Research: Journal of Library & Information Science | Vol.4 No.3, Sep. 2014
Table 2.2 reveals that ‘Familiarity with OPAC’ scored the highest mean for both types of user
groups (4.20), followed by ‘Recency of Periodicals’ (4.12), and ‘Making latest information
available’ (3.86), whereas ‘Effective Inter Library Loan (ILL) System’ scored (3.77),
‘Timeliness delivery of information’ (3.40) and ‘Promptness in re-shelving of books’ (3.04),
which is the lowest mean score of the respondents.
Further analysis revealed that the user group of faculty members scored higher average mean,
i.e., (3.77) than the average mean of research scholars, i.e., (3.69). The overall average mean of
user groups for Responsiveness dimension is (3.73), which clearly depicts that only two areas,
i.e., ‘Timeliness delivery of information’ (3.40) and ‘Promptness in re-shelving of books’ (3.04)
scored lower than the overall average mean.
3.923.42 3.28
3.7
4.22 4.123.8
3.39
2.8
3.844.18 4.13
00.5
11.5
22.5
33.5
44.5
Making latestinformation
available
Timelinessdelivery of
information
Promptness inre-shelving of
books
Effective InterLibrary Loan(ILL) System
Familiaritywith OPAC
Recency ofPriodicals
Faculty Members Research Scholars
Fig. 2.2 (a) Item Wise Mean Score (Quality Dimension: Responsiveness)
3.77
3.69
Faulty Members
Reserch Scholars
Fig. 2.2 (b) Average Mean (Quality Dimension: Responsiveness)
323 International Research: Journal of Library & Information Science | Vol.4 No.3, Sep. 2014
Quality Dimension: Assurance
Table 3.1 Responses (Quality Dimension: Assurance)
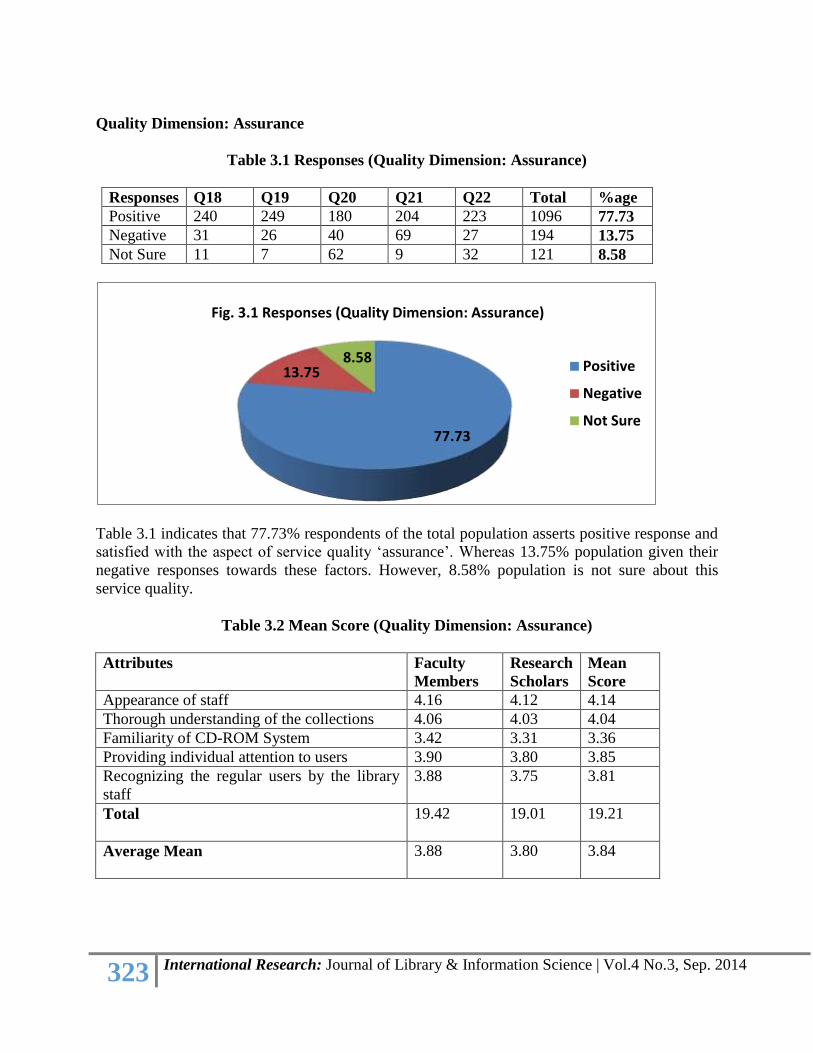
Responses Q18 Q19 Q20 Q21 Q22 Total %age
Positive 240 249 180 204 223 1096 77.73
Negative 31 26 40 69 27 194 13.75
Not Sure 11 7 62 9 32 121 8.58
Table 3.1 indicates that 77.73% respondents of the total population asserts positive response and
satisfied with the aspect of service quality ‘assurance’. Whereas 13.75% population given their
negative responses towards these factors. However, 8.58% population is not sure about this
service quality.
Table 3.2 Mean Score (Quality Dimension: Assurance)
Attributes Faculty
Members
Research
Scholars
Mean
Score
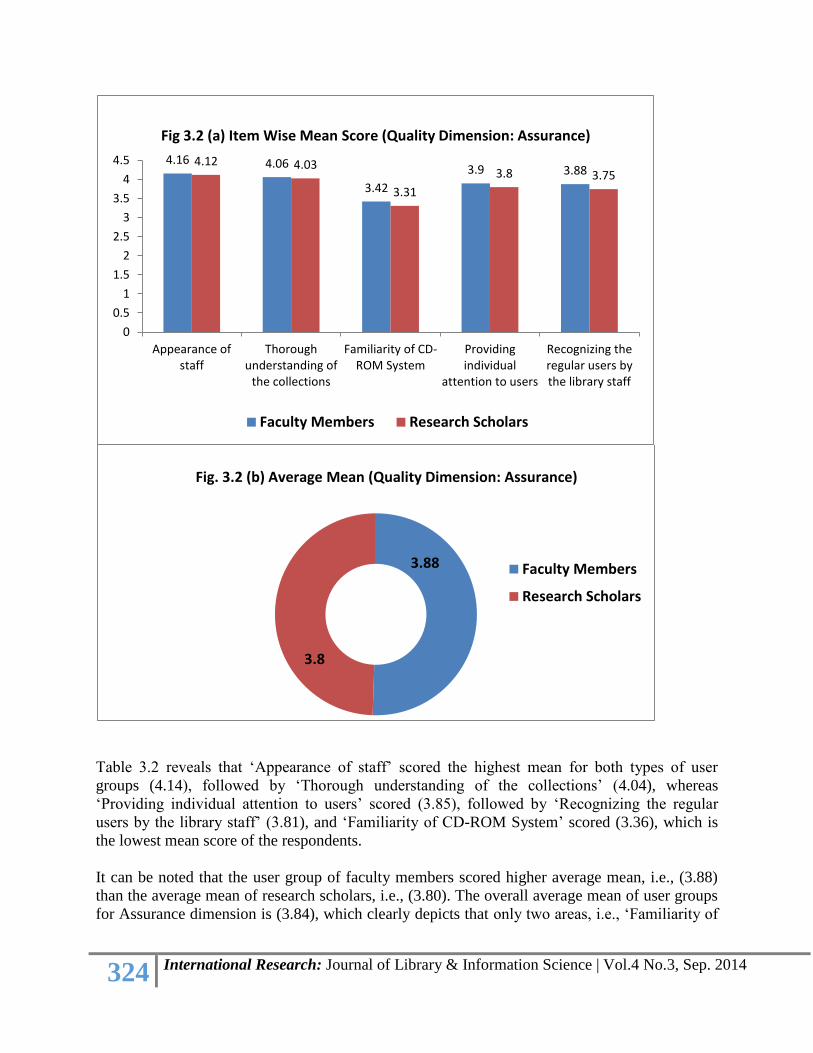
Appearance of staff 4.16 4.12 4.14
Thorough understanding of the collections 4.06 4.03 4.04
Familiarity of CD-ROM System 3.42 3.31 3.36
Providing individual attention to users 3.90 3.80 3.85
Recognizing the regular users by the library
staff
3.88 3.75 3.81
Total
19.42 19.01 19.21
Average Mean
3.88 3.80 3.84
77.73
13.758.58
Positive
Negative
Not Sure
Fig. 3.1 Responses (Quality Dimension: Assurance)
324 International Research: Journal of Library & Information Science | Vol.4 No.3, Sep. 2014
Table 3.2 reveals that ‘Appearance of staff’ scored the highest mean for both types of user
groups (4.14), followed by ‘Thorough understanding of the collections’ (4.04), whereas
‘Providing individual attention to users’ scored (3.85), followed by ‘Recognizing the regular
users by the library staff’ (3.81), and ‘Familiarity of CD-ROM System’ scored (3.36), which is
the lowest mean score of the respondents.
It can be noted that the user group of faculty members scored higher average mean, i.e., (3.88)
than the average mean of research scholars, i.e., (3.80). The overall average mean of user groups
for Assurance dimension is (3.84), which clearly depicts that only two areas, i.e., ‘Familiarity of
4.16 4.06
3.42
3.9 3.884.12 4.03
3.31
3.8 3.75
0
0.5
1
1.5
2
2.5
3
3.5
4
4.5
Appearance ofstaff
Thoroughunderstanding of
the collections
Familiarity of CD-ROM System
Providingindividual
attention to users
Recognizing theregular users bythe library staff
Faculty Members Research Scholars
Fig 3.2 (a) Item Wise Mean Score (Quality Dimension: Assurance)
3.88
3.8
Faculty Members
Research Scholars
Fig. 3.2 (b) Average Mean (Quality Dimension: Assurance)
325 International Research: Journal of Library & Information Science | Vol.4 No.3, Sep. 2014
CD-ROM System’ (3.36) and ‘Recognizing the regular users by the library staff’ (3.81) scored
lower than the overall average mean.
Quality Dimension: Access
Table 4.1 Responses (Quality Dimension: Access)
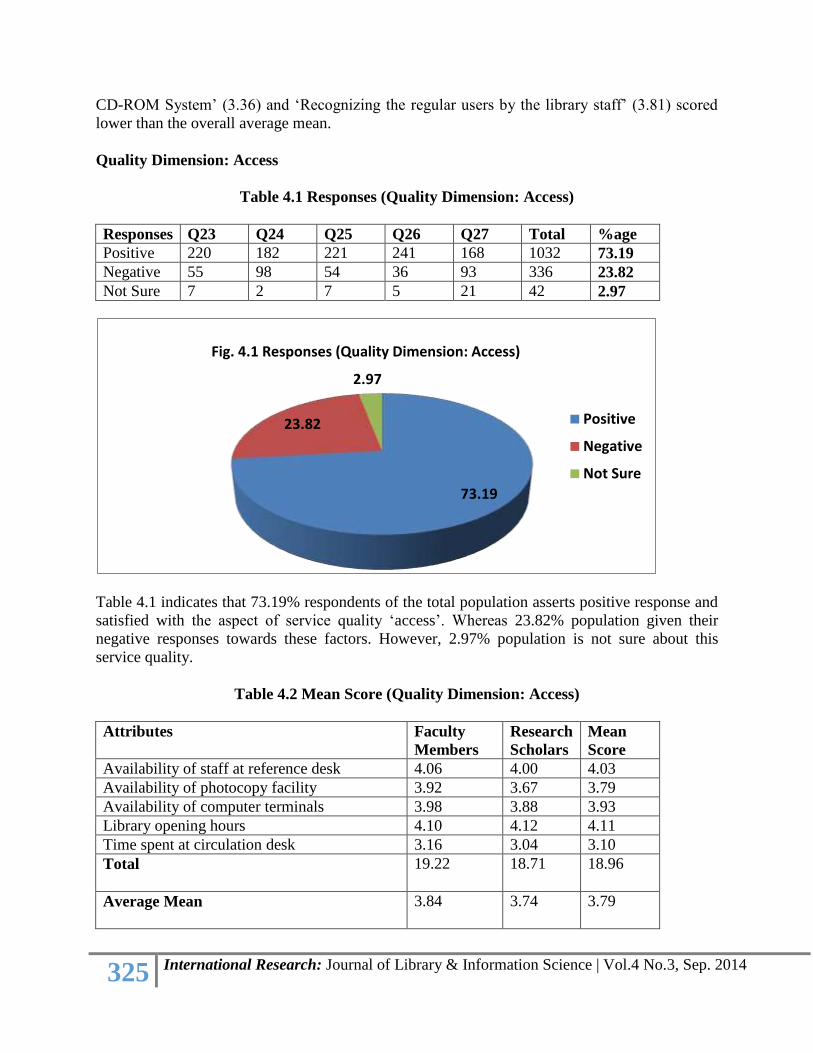
Responses Q23 Q24 Q25 Q26 Q27 Total %age
Positive 220 182 221 241 168 1032 73.19
Negative 55 98 54 36 93 336 23.82
Not Sure 7 2 7 5 21 42 2.97
Table 4.1 indicates that 73.19% respondents of the total population asserts positive response and
satisfied with the aspect of service quality ‘access’. Whereas 23.82% population given their
negative responses towards these factors. However, 2.97% population is not sure about this
service quality.
Table 4.2 Mean Score (Quality Dimension: Access)
Attributes Faculty
Members
Research
Scholars
Mean
Score
Availability of staff at reference desk 4.06 4.00 4.03
Availability of photocopy facility 3.92 3.67 3.79
Availability of computer terminals 3.98 3.88 3.93
Library opening hours 4.10 4.12 4.11
Time spent at circulation desk 3.16 3.04 3.10
Total
19.22 18.71 18.96
Average Mean
3.84 3.74 3.79
73.19
23.82
2.97
Positive
Negative
Not Sure
Fig. 4.1 Responses (Quality Dimension: Access)
326 International Research: Journal of Library & Information Science | Vol.4 No.3, Sep. 2014
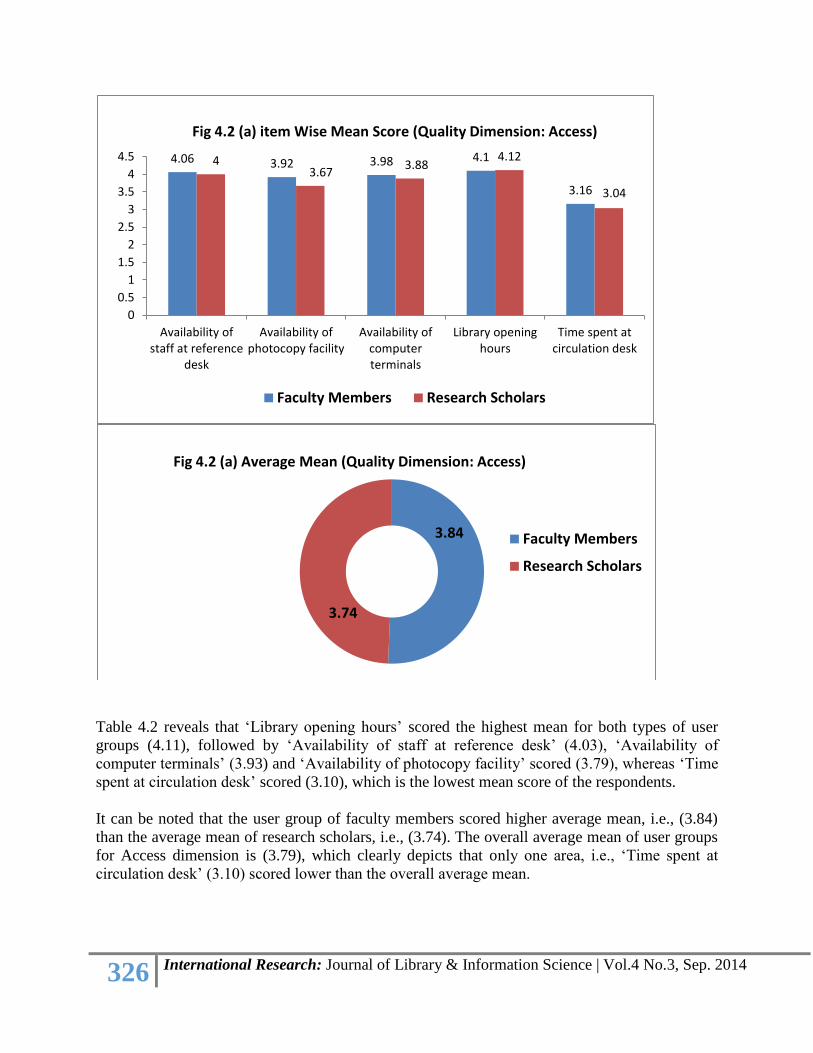
Table 4.2 reveals that ‘Library opening hours’ scored the highest mean for both types of user
groups (4.11), followed by ‘Availability of staff at reference desk’ (4.03), ‘Availability of
computer terminals’ (3.93) and ‘Availability of photocopy facility’ scored (3.79), whereas ‘Time
spent at circulation desk’ scored (3.10), which is the lowest mean score of the respondents.
It can be noted that the user group of faculty members scored higher average mean, i.e., (3.84)
than the average mean of research scholars, i.e., (3.74). The overall average mean of user groups
for Access dimension is (3.79), which clearly depicts that only one area, i.e., ‘Time spent at
circulation desk’ (3.10) scored lower than the overall average mean.
4.06 3.92 3.98 4.1
3.16
43.67
3.884.12
3.04
0
0.5
1
1.5
2
2.5
3
3.5
4
4.5
Availability ofstaff at reference
desk
Availability ofphotocopy facility
Availability ofcomputerterminals
Library openinghours
Time spent atcirculation desk
Faculty Members Research Scholars
Fig 4.2 (a) item Wise Mean Score (Quality Dimension: Access)
3.84
3.74
Faculty Members
Research Scholars
Fig 4.2 (a) Average Mean (Quality Dimension: Access)
327 International Research: Journal of Library & Information Science | Vol.4 No.3, Sep. 2014
Quality Dimension: Communications
Table 5.1 Responses (Quality Dimension: Communications)
Responses Q28 Q29 Q30 Q31 Q32 Q33 Total %age
Positive 218 143 247 251 184 228 1271 75.11
Negative 54 89 19 22 69 45 298 17.61
Not Sure 10 50 16 9 29 9 123 7.26
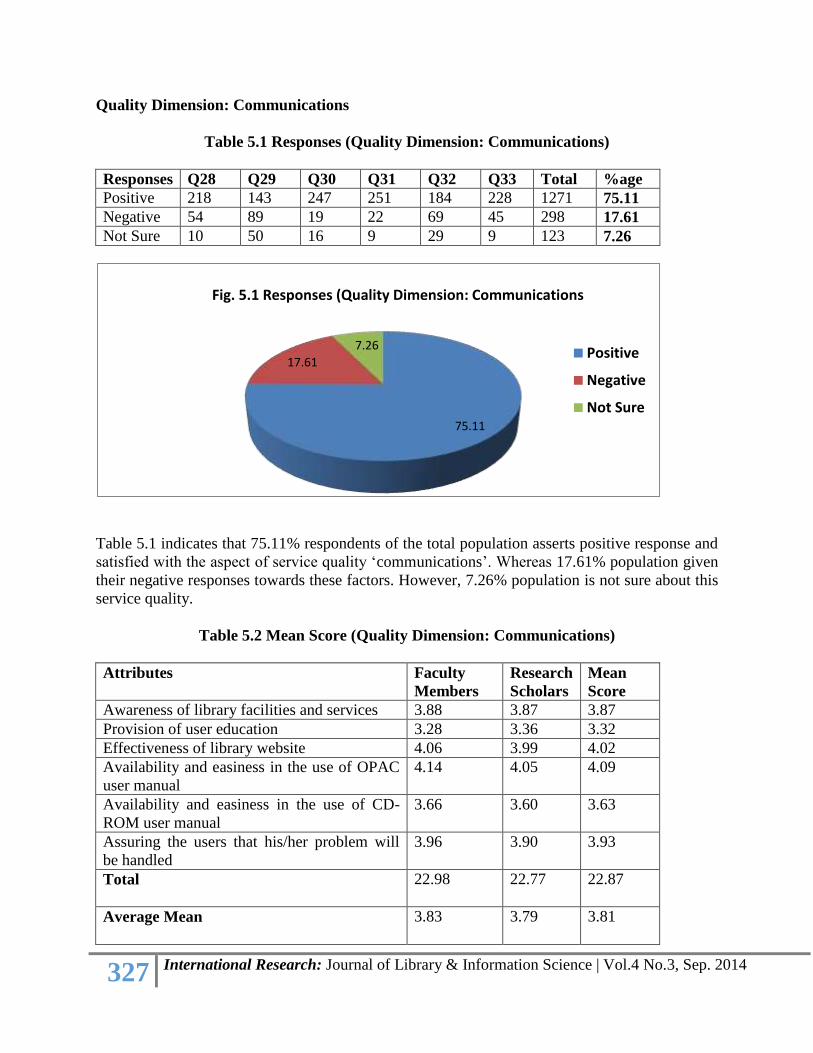
Table 5.1 indicates that 75.11% respondents of the total population asserts positive response and
satisfied with the aspect of service quality ‘communications’. Whereas 17.61% population given
their negative responses towards these factors. However, 7.26% population is not sure about this
service quality.
Table 5.2 Mean Score (Quality Dimension: Communications)
Attributes Faculty
Members
Research
Scholars
Mean
Score
Awareness of library facilities and services 3.88 3.87 3.87
Provision of user education 3.28 3.36 3.32
Effectiveness of library website 4.06 3.99 4.02
Availability and easiness in the use of OPAC
user manual
4.14 4.05 4.09
Availability and easiness in the use of CD-
ROM user manual
3.66 3.60 3.63
Assuring the users that his/her problem will
be handled
3.96 3.90 3.93
Total
22.98 22.77 22.87
Average Mean
3.83 3.79 3.81
75.11
17.61
7.26Positive
Negative
Not Sure
Fig. 5.1 Responses (Quality Dimension: Communications
328 International Research: Journal of Library & Information Science | Vol.4 No.3, Sep. 2014
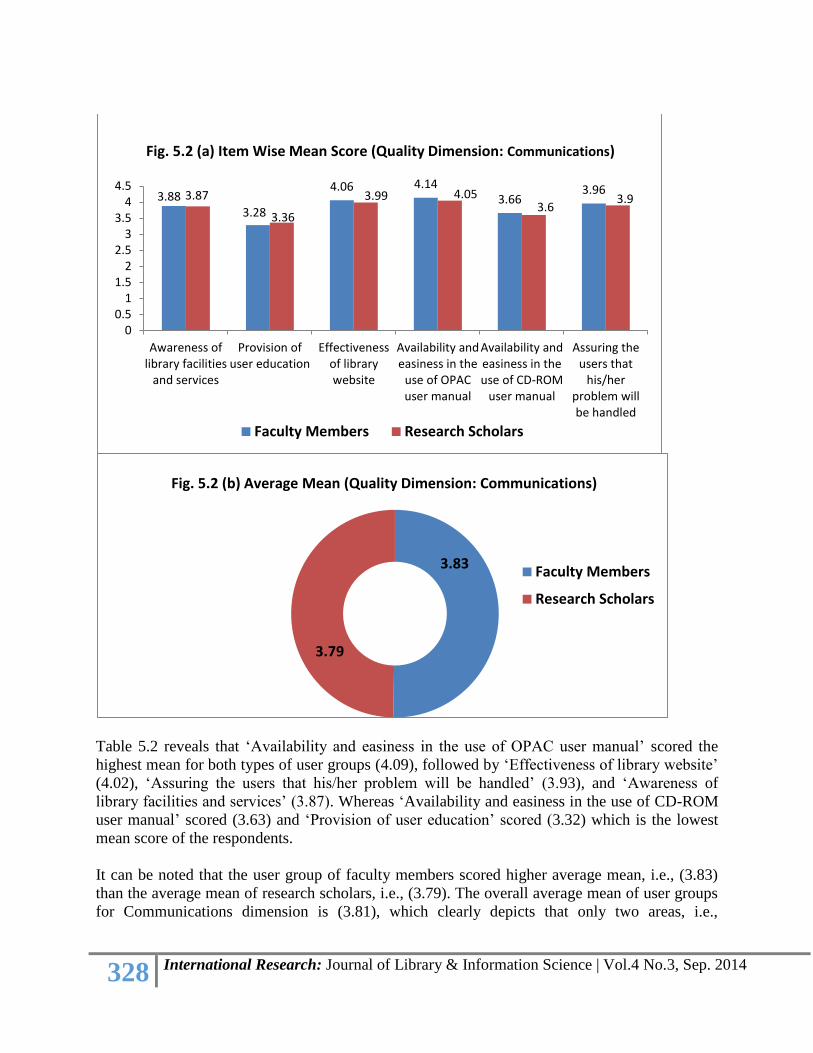
Table 5.2 reveals that ‘Availability and easiness in the use of OPAC user manual’ scored the
highest mean for both types of user groups (4.09), followed by ‘Effectiveness of library website’
(4.02), ‘Assuring the users that his/her problem will be handled’ (3.93), and ‘Awareness of
library facilities and services’ (3.87). Whereas ‘Availability and easiness in the use of CD-ROM
user manual’ scored (3.63) and ‘Provision of user education’ scored (3.32) which is the lowest
mean score of the respondents.
It can be noted that the user group of faculty members scored higher average mean, i.e., (3.83)
than the average mean of research scholars, i.e., (3.79). The overall average mean of user groups
for Communications dimension is (3.81), which clearly depicts that only two areas, i.e.,
3.883.28
4.06 4.143.66
3.963.87
3.36
3.99 4.053.6
3.9
00.5
11.5
22.5
33.5
44.5
Awareness oflibrary facilities
and services
Provision ofuser education
Effectivenessof librarywebsite
Availability andeasiness in the
use of OPACuser manual
Availability andeasiness in theuse of CD-ROM
user manual
Assuring theusers that
his/herproblem willbe handled
Faculty Members Research Scholars
Fig. 5.2 (a) Item Wise Mean Score (Quality Dimension: Communications)
3.83
3.79
Faculty Members
Research Scholars
Fig. 5.2 (b) Average Mean (Quality Dimension: Communications)
329 International Research: Journal of Library & Information Science | Vol.4 No.3, Sep. 2014
‘Provision of user education’ (3.32), and ‘Availability and easiness in the use of CD-ROM user
manual’ (3.63) scored lower than the overall average mean.
Quality Dimension: Tangibles
Table 6.1 Responses (Quality Dimension: Tangibles)
Responses Q34 Q35 Q36 Q37 Total %age
Positive 263 249 266 263 1041 92.28
Negative 14 21 11 17 63 5.58
Not Sure 5 12 5 2 24 2.12
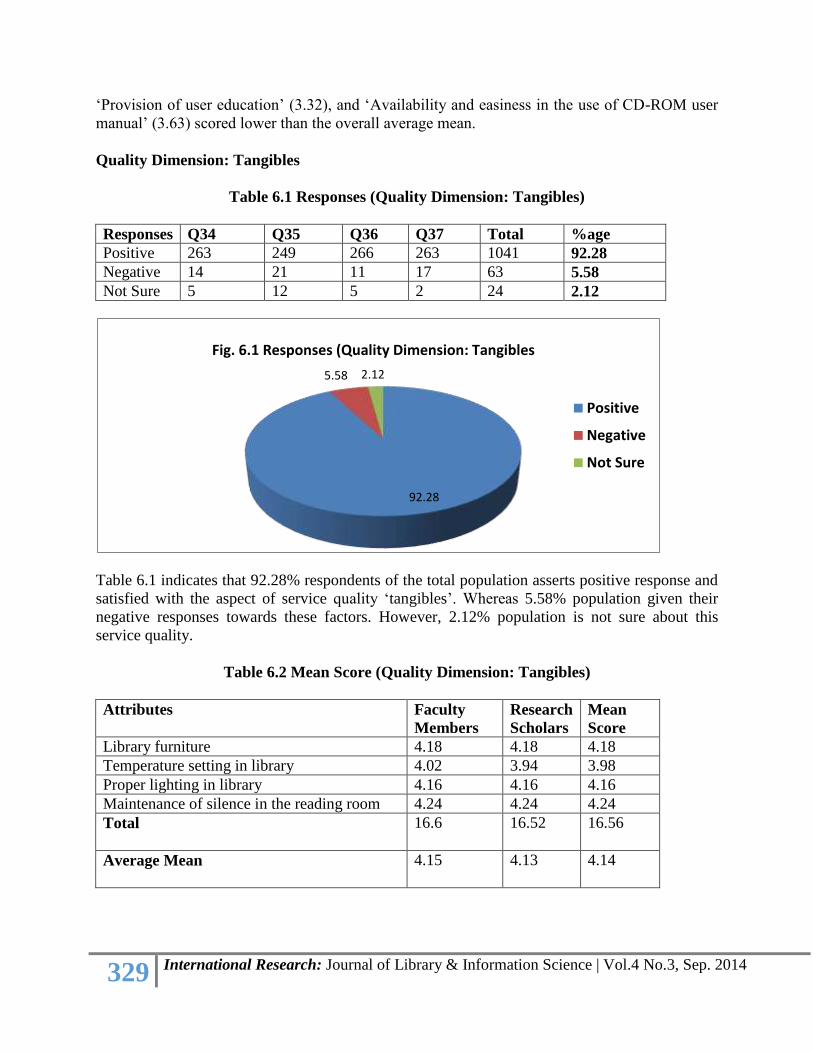
Table 6.1 indicates that 92.28% respondents of the total population asserts positive response and
satisfied with the aspect of service quality ‘tangibles’. Whereas 5.58% population given their
negative responses towards these factors. However, 2.12% population is not sure about this
service quality.
Table 6.2 Mean Score (Quality Dimension: Tangibles)
Attributes Faculty
Members
Research
Scholars
Mean
Score
Library furniture 4.18 4.18 4.18
Temperature setting in library 4.02 3.94 3.98
Proper lighting in library 4.16 4.16 4.16
Maintenance of silence in the reading room 4.24 4.24 4.24
Total
16.6 16.52 16.56
Average Mean
4.15 4.13 4.14
92.28
5.58 2.12
Positive
Negative
Not Sure
Fig. 6.1 Responses (Quality Dimension: Tangibles
330 International Research: Journal of Library & Information Science | Vol.4 No.3, Sep. 2014
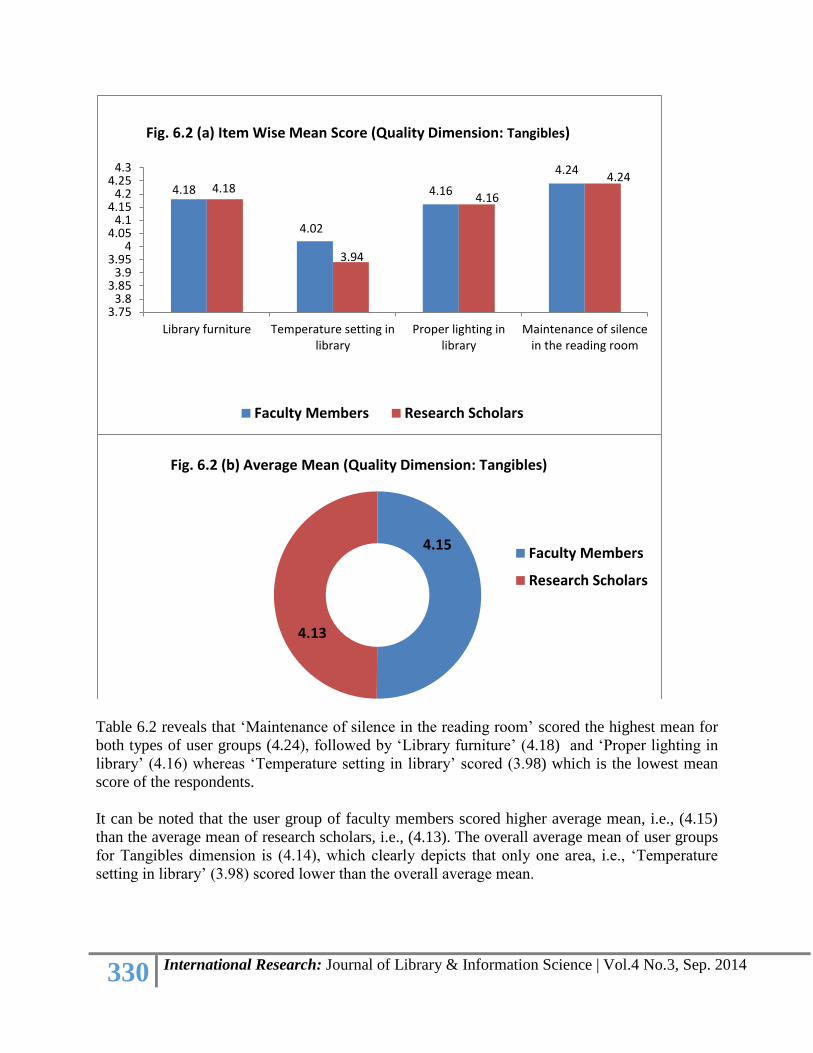
Table 6.2 reveals that ‘Maintenance of silence in the reading room’ scored the highest mean for
both types of user groups (4.24), followed by ‘Library furniture’ (4.18) and ‘Proper lighting in
library’ (4.16) whereas ‘Temperature setting in library’ scored (3.98) which is the lowest mean
score of the respondents.
It can be noted that the user group of faculty members scored higher average mean, i.e., (4.15)
than the average mean of research scholars, i.e., (4.13). The overall average mean of user groups
for Tangibles dimension is (4.14), which clearly depicts that only one area, i.e., ‘Temperature
setting in library’ (3.98) scored lower than the overall average mean.
4.18
4.02
4.16
4.24
4.18
3.94
4.16
4.24
3.753.8
3.853.9
3.954
4.054.1
4.154.2
4.254.3
Library furniture Temperature setting inlibrary
Proper lighting inlibrary
Maintenance of silencein the reading room
Faculty Members Research Scholars
Fig. 6.2 (a) Item Wise Mean Score (Quality Dimension: Tangibles)
4.15
4.13
Faculty Members
Research Scholars
Fig. 6.2 (b) Average Mean (Quality Dimension: Tangibles)
331 International Research: Journal of Library & Information Science | Vol.4 No.3, Sep. 2014
Comparative Analysis of Dimensions
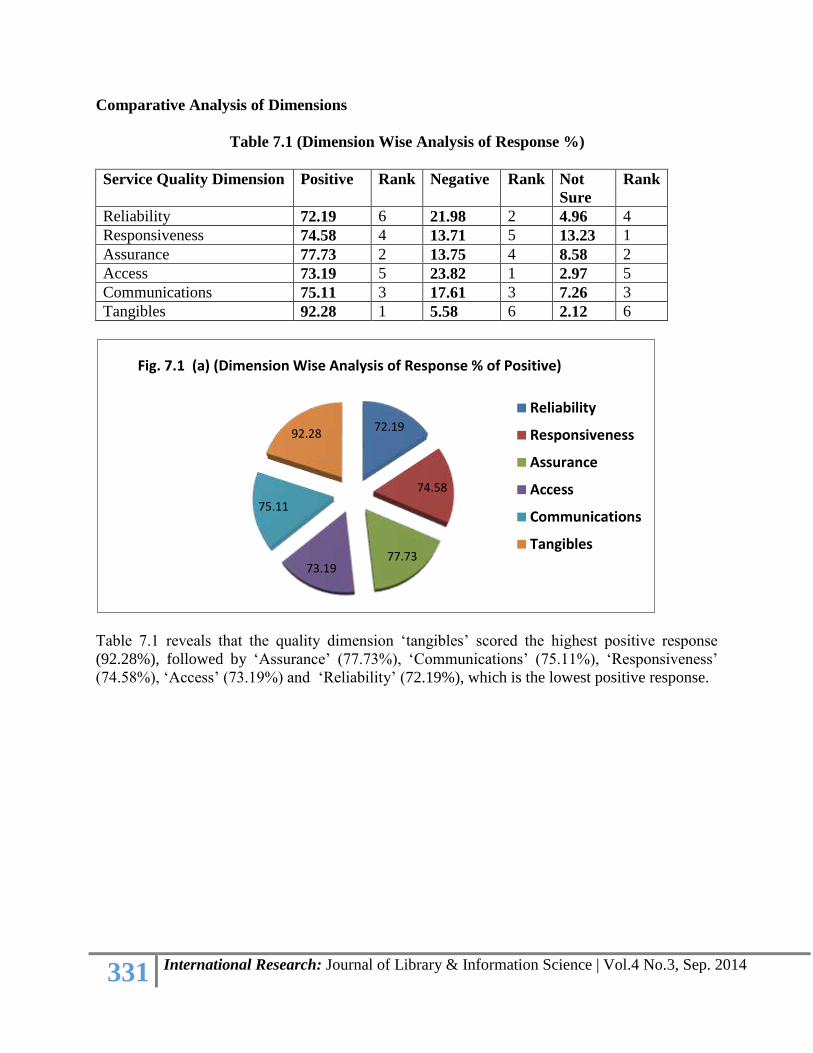
Table 7.1 (Dimension Wise Analysis of Response %)
Service Quality Dimension Positive Rank Negative Rank Not
Sure
Rank
Reliability 72.19 6 21.98 2 4.96 4
Responsiveness 74.58 4 13.71 5 13.23 1
Assurance 77.73 2 13.75 4 8.58 2
Access 73.19 5 23.82 1 2.97 5
Communications 75.11 3 17.61 3 7.26 3
Tangibles 92.28 1 5.58 6 2.12 6
Table 7.1 reveals that the quality dimension ‘tangibles’ scored the highest positive response
(92.28%), followed by ‘Assurance’ (77.73%), ‘Communications’ (75.11%), ‘Responsiveness’
(74.58%), ‘Access’ (73.19%) and ‘Reliability’ (72.19%), which is the lowest positive response.
72.19
74.58
77.7373.19
75.11
92.28
Reliability
Responsiveness
Assurance
Access
Communications
Tangibles
Fig. 7.1 (a) (Dimension Wise Analysis of Response % of Positive)
332 International Research: Journal of Library & Information Science | Vol.4 No.3, Sep. 2014
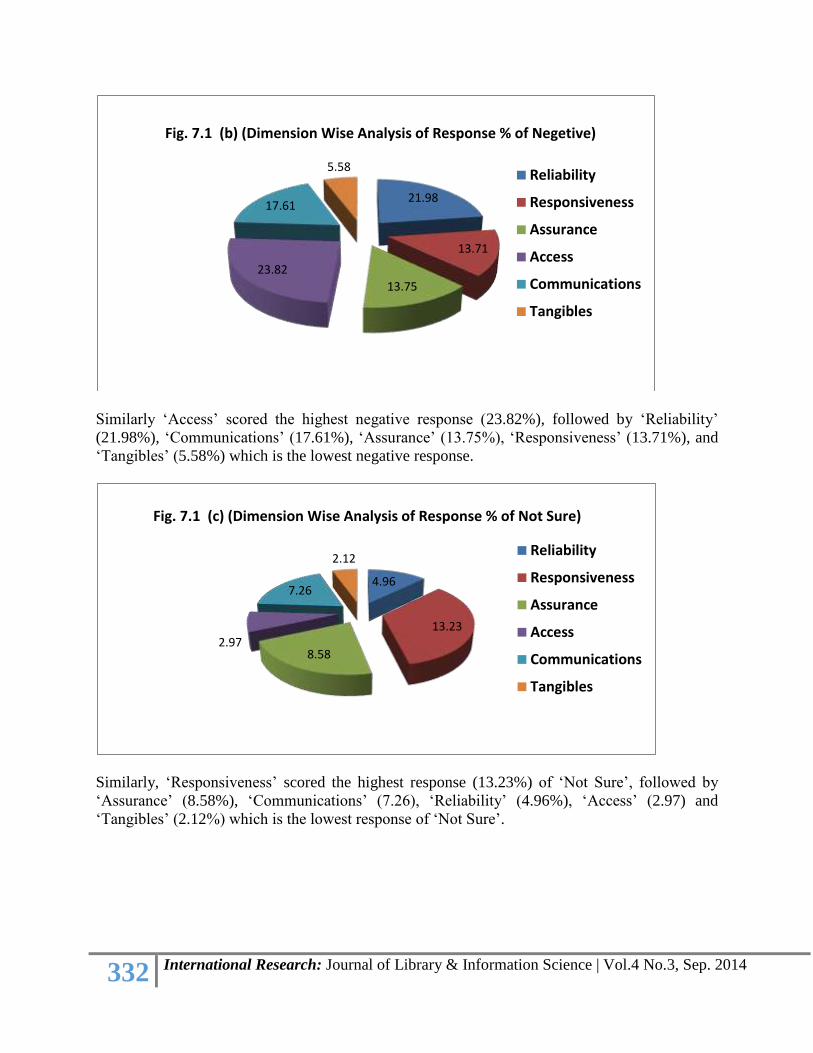
Similarly ‘Access’ scored the highest negative response (23.82%), followed by ‘Reliability’
(21.98%), ‘Communications’ (17.61%), ‘Assurance’ (13.75%), ‘Responsiveness’ (13.71%), and
‘Tangibles’ (5.58%) which is the lowest negative response.
Similarly, ‘Responsiveness’ scored the highest response (13.23%) of ‘Not Sure’, followed by
‘Assurance’ (8.58%), ‘Communications’ (7.26), ‘Reliability’ (4.96%), ‘Access’ (2.97) and
‘Tangibles’ (2.12%) which is the lowest response of ‘Not Sure’.
21.98
13.71
13.75
23.82
17.61
5.58Reliability
Responsiveness
Assurance
Access
Communications
Tangibles
Fig. 7.1 (b) (Dimension Wise Analysis of Response % of Negetive)
4.96
13.23
8.582.97
7.26
2.12Reliability
Responsiveness
Assurance
Access
Communications
Tangibles
Fig. 7.1 (c) (Dimension Wise Analysis of Response % of Not Sure)
333 International Research: Journal of Library & Information Science | Vol.4 No.3, Sep. 2014
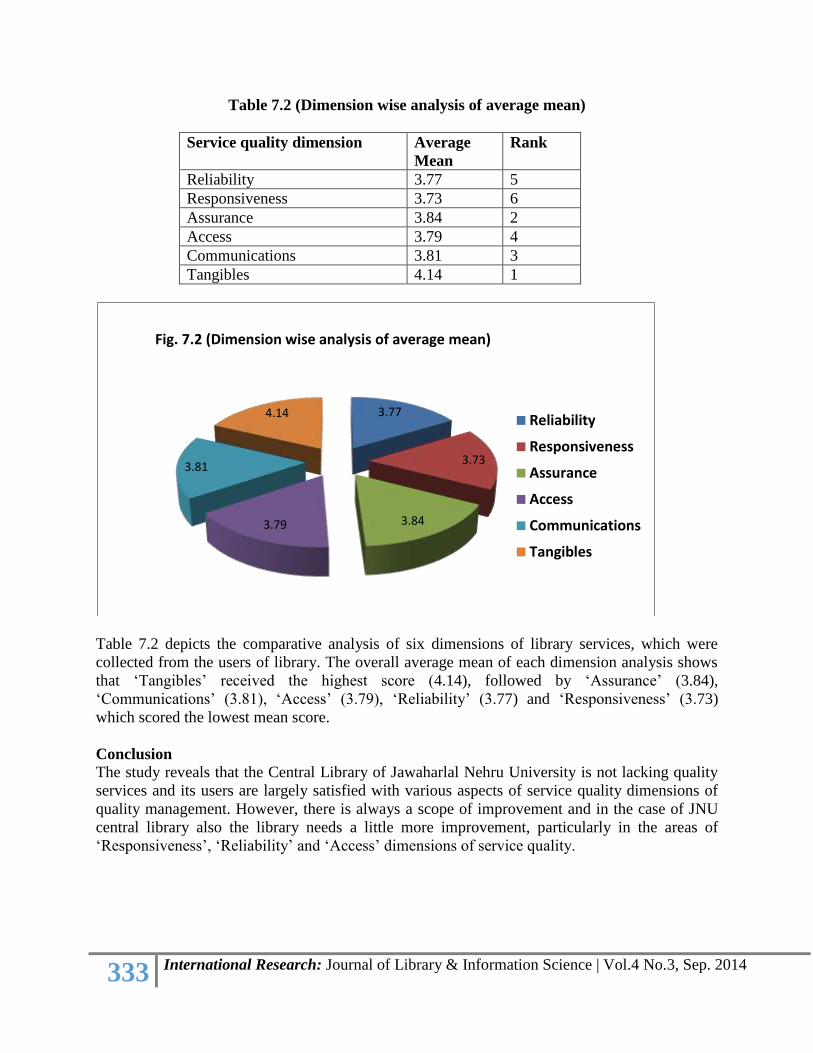
Table 7.2 (Dimension wise analysis of average mean)
Service quality dimension Average
Mean
Rank
Reliability 3.77 5
Responsiveness 3.73 6
Assurance 3.84 2
Access 3.79 4
Communications 3.81 3
Tangibles 4.14 1
Table 7.2 depicts the comparative analysis of six dimensions of library services, which were
collected from the users of library. The overall average mean of each dimension analysis shows
that ‘Tangibles’ received the highest score (4.14), followed by ‘Assurance’ (3.84),
‘Communications’ (3.81), ‘Access’ (3.79), ‘Reliability’ (3.77) and ‘Responsiveness’ (3.73)
which scored the lowest mean score.
Conclusion
The study reveals that the Central Library of Jawaharlal Nehru University is not lacking quality
services and its users are largely satisfied with various aspects of service quality dimensions of
quality management. However, there is always a scope of improvement and in the case of JNU
central library also the library needs a little more improvement, particularly in the areas of
‘Responsiveness’, ‘Reliability’ and ‘Access’ dimensions of service quality.
3.77
3.73
3.843.79
3.81
4.14Reliability
Responsiveness
Assurance
Access
Communications
Tangibles
Fig. 7.2 (Dimension wise analysis of average mean)
334 International Research: Journal of Library & Information Science | Vol.4 No.3, Sep. 2014
References
1. Eqbal, Manawwer, et al. (2011), “Application of total quality management in Central
Library of North Eastern Hill University, Shillong: a study”, Gyankosh, Vol. 2, No.
1, pp. 41-56.
2. http://www.jnu.ac.in/Library
3. Johannsen, C.G., (1992), “The use of quality control principles and methods in library
and information science: theory and practice”, Libri, Vol. 42, No. 4, pp. 283-295.
4. Parasuraman, A., et al. (1988), “SERVQUAL: a multiple item scale for measuring
consumer perceptions of service quality”, Journal of Retailing, Vol. 67, No. 4, pp.
420-450.
5. Seay, Thomas., et al. (1996), “Measuring and Improving the Quality of Public
Services: A hybrid Approach”, Library Trends, Vol. 44, No. 3, pp. 464-490.
6. Shoeb, Z.S. and Ahmed, S.M., (2009), “Individual differences in service quality
assessment: a study of a private university library system in Bangladesh”,
Performance Measurement and Metrics, Vol. 10 No. 3, pp. 193-211.
7. Sohail, Md. and Raza, M. Mazoom (2012), "Measuring service quality in Dr. Zakir
Husain Library, J.M.I, New Delhi: a survey", Library Philosophy and Practice (e-
journal). Paper 802.
8. Thapisa, A.P.N. and Gamini, Venus (1999), “Perception of quality service at the
University of Botswana Library: what Nova says”, Library Management, Vol. 20,
No. 7, pp. 373-383.
Follow us on: IRJLIS, Facebook, Twitter