Embed Size (px)
Citation preview

Eidgenössisches Departement für Umwelt, Verkehr, Energie und Kommunikation UVEK
Bundesamt für Energie BFE
Schlussbericht Juni 2011
Life Cycle Assessment of Burning Different Solid Biomass Substrates

ii
Auftraggeber: Bundesamt für Energie BFE Forschungsprogramm Forschung & Entwicklung CH-3003 Bern www.bfe.admin.ch Auftragnehmer: ESU-services Ltd. fair consulting in sustainability Kanzleistrasse 4 CH-8610 Uster www.esu-services.ch Autoren: René Itten, ESU-services Ltd., [email protected] Matthias Stucki, ESU-services Ltd., [email protected] Niels Jungbluth, ESU-services Ltd., [email protected] BFE-Bereichsleiterin: Sandra Hermle BFE-Programmleiterin: Sandra Hermle BFE-Vertrags- und Projektnummer: 154347 / 103299 Für den Inhalt und die Schlussfolgerungen sind ausschliesslich die Autoren dieses Berichts verantwortlich ..

Imprint
Title Life Cycle Assessment of Burning Different Solid Biomass Substrates Authors Rene Itten, Matthias Stucki, Niels Jungbluth
ESU-services Ltd., fair consulting in sustainability Kanzleistr. 4, CH-8610 Uster www.esu-services.ch Phone 0041 44 940 61 38, Fax +41 44 940 61 94 [email protected]
Commissioner Bundesamt für Energie
About us ESU-services Ltd. has been founded in 1998. Its core objectives are consulting, coaching, training and research in the fields of Life Cycle Assessment (LCA), carbon footprints, water footprint in the sectors energy, civil engineering, basic minerals, chemicals, packaging, telecommunication, food and lifestyles. Fairness, independence and transparency are substantial characteristics of our con-sulting philosophy. We work issue-related and accomplish our analyses without prejudice. We document our studies and work transparency and comprehensibly. We offer a fair and competent consultation, which makes it for the clients possible to control and continuously improve their envi-ronmental performance. The company worked and works for various national and international companies, associations and authorities. In some areas, team members of ESU-services per-formed pioneering work such as development and operation of web based LCA databases or quan-tifying environmental impacts of food and lifestyles.
Copyright All content provided in this report is copyrighted, except when noted otherwise. Such information must not be copied or distributed, in whole or in part, without prior written consent of ESU-services Ltd. or the customer. This report is provided on the website www.esu-services.ch and the website of the customer. A provision of this report or of files and information from this report on other web-sites is not permitted. Any other means of distribution, even in altered forms, require the written consent. Any citation naming ESU-services Ltd. or the authors of this report shall be provided to the authors before publication for verification.
Liability Statement Information contained herein have been compiled or arrived from sources believed to be reliable. Nevertheless, the authors or their organizations do not accept liability for any loss or damage aris-ing from the use thereof. Using the given information is strictly your own responsibility.
Version 321-LCA-biomass-combustion-v3.3.docx, 12/07/2011 09:40:00

iv
Table of contents
1. Introduction ................................................................................................................................. 1
2. Goal and scope of the LCA study ................................................................................................ 1
2.1. Key questions ..................................................................................................................... 1
2.2. Functional unit .................................................................................................................... 2
2.3. Geographical boundaries .................................................................................................... 2
2.4. Overview of potential biomass substrates for combustion .................................................... 2
2.4.1. Olive dry pomace ........................................................................................................ 7
2.4.2. Bagasse ...................................................................................................................... 7
2.4.3. Coffee grounds ........................................................................................................... 7
2.4.4. Horse dung ................................................................................................................. 7
2.4.5. Grass and cereals ....................................................................................................... 7
2.4.6. Poultry litter ................................................................................................................. 8
2.4.7. Slurry solids ................................................................................................................ 8
2.5. Selection of the biomass substrates .................................................................................... 8
2.6. Properties of the substrates ................................................................................................ 9
2.7. Technical specifications of the furnace ...............................................................................11
3. Life cycle inventory: summary ....................................................................................................12
3.1. Fuel-mixture preparation ....................................................................................................12
3.1.1. Drying of the olive pomace .........................................................................................12
3.1.2. Pellet production ........................................................................................................12
3.1.3. Preparation of the fuel-mixture ...................................................................................12
3.2. Combustion of the biomass substrates ...............................................................................12
3.2.1. Disposal ash from combustion ....................................................................................13
3.2.2. Particulate matter emissions.......................................................................................13
3.3. Heat generation .................................................................................................................14
3.4. Disposal of the ashes .........................................................................................................14
3.4.1. Landfarming ...............................................................................................................15
3.4.2. Municipal incineration .................................................................................................15
3.4.3. Sanitary landfill...........................................................................................................16
3.5. Coffee grounds in municipal incineration ............................................................................16
3.6. Data quality .......................................................................................................................17
3.6.1. Olive pomace .............................................................................................................17
3.6.2. Coffee grounds ..........................................................................................................17
3.6.3. Poultry litter ................................................................................................................17
3.6.4. Horse dung ................................................................................................................17
3.6.5. Pig slurry solids ..........................................................................................................18
4. Life cycle impact assessment .....................................................................................................19
4.1. Ecological Scarcity 2006 ....................................................................................................19
4.1.1. Emissions into air .......................................................................................................22
4.1.2. Emissions into soil......................................................................................................25
4.2. Greenhouse gases ............................................................................................................26
4.3. Scenario analysis...............................................................................................................28
4.3.1. Coffee grounds in municipal incineration ....................................................................28
4.3.2. Ash disposal ..............................................................................................................29
4.3.3. Pellet production ........................................................................................................30
5. Interpretation ..............................................................................................................................31
6. Conclusion and outlook ..............................................................................................................33
7. Appendix: life cycle inventory .....................................................................................................34
7.1. Fuel-mixture preparation ....................................................................................................34
7.1.1. Drying of the olive pomace .........................................................................................34
7.1.2. Pellet production ........................................................................................................34
7.1.3. Preparation of the fuel-mixture ...................................................................................35
7.2. Combustion of the biomass substrates ...............................................................................35
7.2.1. Disposal ash from combustion ....................................................................................39

v
7.2.2. Particulate matter emissions.......................................................................................39
7.3. Heat generation .................................................................................................................39
7.4. Disposal of the ashes .........................................................................................................40
7.4.1. Landfarming ...............................................................................................................41
7.4.2. Municipal incineration .................................................................................................44
7.4.3. Sanitary landfill...........................................................................................................44
7.5. Coffee grounds in municipal incineration ............................................................................44
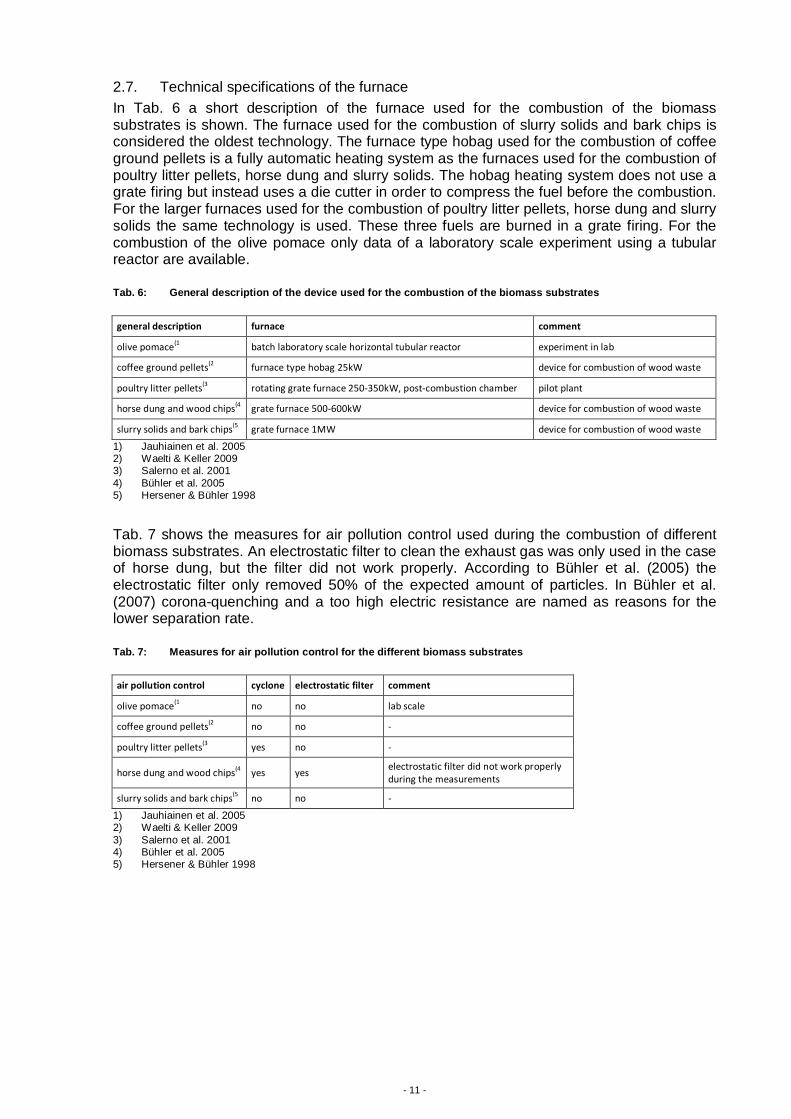
7.6. Meta information to the unit process raw data ....................................................................44
7.7. Data quality .......................................................................................................................49
7.7.1. Olive pomace .............................................................................................................49
7.7.2. Coffee grounds ..........................................................................................................49
7.7.3. Poultry litter ................................................................................................................49
7.7.4. Horse dung ................................................................................................................49
7.7.5. Pig slurry solids ..........................................................................................................50
8. References ................................................................................................................................51

vi
Abstract
Biomass from agriculture, crop residues, forestry, landscape management, and wastes from industry and households can be used for energy recovery. In order to obtain useful energy carriers from the different biomass substrates, they can be fermented for a conversion into biogas, they can be converted into biofuels or they can be burnt directly in order to receive heat or to generate electricity. In this project a life cycle assessment (LCA) of the direct combustion of different non-wood biomass substrates is performed. For that purpose the life cycle inventory (LCI) data are collected and modelled according to the present guidelines of ecoinvent data v2.2. The final product is useful heat provided by the combustion process. A survey of the potential biomass substrates for direct combustion mentioned in literature was conducted, which gave an overview of these substrates covering pomaces, kernels, shells, by-products from industry, oil from oil seeds, and other products and wastes. Based on the overview of potential biomass substrates for combustion and the availability of data, life cycle inventory data for burning the following five substrates are collected: – Olive dry pomace – Coffee ground pellets – Horse dung & wood chips co-combustion – Poultry litter pellets – Slurry solids & wood chips co-combustion The life cycle impact assessment shows that the combustion of the biomass substrates has the highest environmental impact, followed by the disposal of the ash generated by the combustion process. In general the biomass substrates perform worse compared to the combustion of wood from an environmental point of view. The burning of biomass substrates generates higher particulate and nitrogen oxide emissions than the combustion of wood or wood pellets. The combustion of coffee ground pellets, poultry litter pellets and horse dung mixed with wood chips show similar environmental impacts as the combustion of wood logs in a small furnace. The study shows the improvement potentials regarding reduction of air emissions and disposal routes for ashes. These have to be further evaluated and measurements on key pollutants are necessary in order to finally judge about the possibilities and environmental impacts of using biomass wastes in direct combustion processes.

vii
Abbreviations
C Carbon
CH Switzerland
CH4 Methane
CO Carbon monoxide
CO2 Carbon dioxide
GWP Global warming potential
H Hydrogen
IPCC Intergovernmental panel on climate change
kW Kilo watt
LCA Life cycle assessment
LCI Life cycle inventory
LCIA Life cycle impact assessment
LHV Lower heating value
MJ Mega joule
MSWI Municipal solid waste incineration
MW Mega watt
N2O Dinitrogen monoxide
NMVOC Non-methane volatile organic carbon
NOx Nitrogen oxides
O Oxygen
PM Particulate matter
S Sulphur
SOx Sulphur oxides
TSP Total suspended solids
UHV Upper heating value
VOC Volatile organic carbon

- 1 -
Life Cycle Assessment of Burning Different Solid Biomass Substrates
1. Introduction Biomass from agriculture, crop residues, forestry, landscape management, and wastes from industry and households can be used for energy recovery. In order to obtain useful energy carriers from the different biomass substrates, they can be fermented for a conversion into biogas, they can be converted into biofuels or they can be burnt directly in order to receive heat or to generate electricity. Detailed life cycle assessments (LCA) of the use of wood as energy source have been carried out by Bauer (2007), whereas the direct combustion of other biomass substrates has not yet been evaluated for the ecoinvent database. Hence, in this project an LCA of the direct combustion of different non-wood biomass substrates is performed. For that purpose the life cycle inventory (LCI) data are collected and modelled according to the ecoinvent guidelines (Frischknecht et al. 2007; Jungbluth et al. 2007a).
2. Goal and scope of the LCA study
2.1. Key questions The combustion of different types of biomass is assessed within the study. The analysis focuses on the following points. – What are the environmental impacts of biomass combustion? – How can these impacts be compared to other types of heat provision also from fossil
resources? – What are the main emissions and impacts from an environmental point of view? – Which influence has the type of substrate and the combustion technology? The data investigated in this project should facilitate others works on LCA. Examples are the labelling of renewable energy with the naturemade star label (Jungbluth et al. 2010) and a comparison of different disposal routes of such biomass wastes. Furthermore, with this evaluation we also would like to highlight possible further research questions for the investigation of such biomass substrates. In order to assess the environmental performance of burning different biomass substrates, data about different types of technology and biomass substrates are necessary. Data regarding production of the biomass substrates, heat generation, as well as regarding emissions from the combustion process have to be collected and modelled in a LCI. If the purpose of the substrate production is the generation of heat from burning the biomass, the full production process has to be allocated to the environmental impact of burning the biomass substrate. However, substrates are often by-products of multi-output processes. In such processes, the environmental impact of the production process is allocated using the price of the different products as allocation factor. If burning biomass substrates that are wastes with no economic value, no environmental impacts from the substrate production need to be allocated to the generated heat. The disposal of the ashes generated by the combustion of the biomass substrates is completely allocated to the combustion processes. The replacement of artificial fertilizer, when using the ashes of the biomass substrates instead of artificial fertilizers, is not considered. In addition to the substrate supply chain, the emissions from the combustion of the biomass have to be considered. The most important emissions are nitrogen oxides, particulates, and carbon dioxide. However, the combustion of biomass in different furnaces leads to many other specific emissions, which are dependent on the applied technology and composition of the substrate. For the accomplishment of the goals the following information is needed: – LCI data of substrate production – Actual market prices for substrates and co-substrates – Calorific value of different substrates

- 2 -
– Emission data from burning the biomass substrates
2.2. Functional unit The functional unit is one MJ useful heat for heating systems. The LCA is modelled for the situation in Switzerland with the most recent data available.
2.3. Geographical boundaries The inventory for the combustion of olive pomace is modelled for a typical production area for olives in the Lythrodontas region in Cyprus. The inventory for the disposal of the ash generated by the combustion of olive pomace is modelled for municipal incineration in Switzerland and for a sanitary landfill according to Swiss legislation built in Switzerland. The technology mix for municipal incineration corresponds to the technology mix encountered in Switzerland in the year 2000 and is comparable to modern incineration practices in Europe, North America or Japan. The sanitary landfill for the disposal of the ash includes a base seal, leachate collection and treatment of the leachate in a municipal wastewater treatment plant. The inventories for the combustion of coffee ground pellets, poultry litter pellets, horse dung and pig slurry solids are modelled for pilot plants in Switzerland. No adjustments have been made to the emission factors in order to account for the measurements in pilot plants. The inventory for the disposal of the ash generated by the combustion is modelled for the same geographical boundaries as the disposal of ash generated by the combustion of olive pomace.
2.4. Overview of potential biomass substrates for combustion As a first step a survey of the potential biomass substrates for direct combustion mentioned in literature is conducted. Tab. 1 gives an overview of these substrates covering pomaces, kernels, shells, by-products from industry, oil from oil seeds, and other products and wastes. For the green marked substrates, data that could be used for an LCI are available, such as calorific values, typical moisture or elemental composition.

- 3 -
Tab. 1 Overview of potential biomass substrates for direct combustion
English Deutsch
Pomace
Canola pomace Rapskuchen Sunflower pomace Sonnenblumenpresskuchen Olive Pomace Olivenpresslinge (Rückstände)
Castor cake Rizinuskuchen
Kernel Palm kernel Palmenkerne Oliven kernel Olivenkerne Cherry stones Kirschenkerne Plum stones Zwetschgenkerne
Grape seeds Traubenkerne
Shells Sunflower shells Sonnenblumenschalen Canola shells Rapsschalen Buckwheat shells Buchweizenschalen Nut shells Nusschalen
Peanut shells Erdnusschalen Almond shells Mandelschalen Coconut shells Kokosnusschalen Rice shells Reisschalen Soybean shells Sojaschalen
By-products By-products of cellulose factories Nebenprodukte aus Zellulosefabrik Draff (by-product from beer production) Biertreber (Nebenprodukt Bierproduktion) Residues from malt processing Rückstände aus der Malzverarbeitung Bagasse (from sugarcane processing) Bagasse (aus Zuckerrohrverarbeitung)
Oil from oil seeds
Canola oil Rapsöl Jatropha oil Jatropha-Öl Palm oil Palmöl Sunflower oil Sonnenblumenöl Castor oil Rizinusöl Soybean oil Sojaöl
Plant oils in general Pflanzenöle allg. Animal fat Tierfett

- 4 -
Other products and wastes English Deutsch
Heating cereals Heizgetreide Triticale (cereals) Triticale (Getreide) Biowaste Grüngut Paper Papier Paper fibre residues Papierfaserreststoff Textiles Textilien
Coffee grounds Coffee grounds / Waste Roasting wastes Röstereiabfälle Sugarcane Zuckerrohr Palm leaves Palmblätter Miscanthus Chinaschilf (Miscanthus) Thistle (Cynara cardunculus) Distel (Cynara cardunculus)
Other plant leaves andere Pflanzenblätter Gylcerine Glyzerin Straw Stroh Grass Gras Reed canary grass Reed canary grass Needles (spruce) Tannennadeln
Horse dung with wood shavings litter + wood chips
Pferdemist mit Hobelspäneinstreu + Holzschnitzel
Horse dung with wood shavings litter + cereal briquettes
Pferdemist mit Hobelspäneinstreu + Holzschnitzel
Horse dung with straw litter + reed cutting Pferdemist mit Stroheinstreu + Ried-flächenstreu
Poultry litter Hühnermist Corn cob Maiskolben Cotton residues Baumwollreste Beet chips Rübenschnitzel Sludge Klärschlamm Animal meal Tiermehl
Fungi mycelium / fungi compost + wood chips Pilzmyzel / Pilzkompost + Holzschnitzel Cereal briquette Getreideabgang Residues from cereal harvesting Rückstände der Getreideernte Cutting of reed areas Schnitt von Riedflächen Fermentation substrate from food wastes Gärsubstrat aus Speiseabfällen Solids from biowaste collection Feststoffe von Grüngutsammlungen
Slurry solids Güllefeststoff
In Tab. 2 the available data for an LCI of burning biomass substrates are shown.

- 5 -
Tab. 2 Data availability for LCI of burning biomass substrates (√ means that corresponding data are available)
technology calorific value
moisture density fuel com-position
emissions to air ash content
ash com-position
source
Olive dry pomace boiler furnace in oil mill
√ √ √ √ CO2, CO, CH4, C2H6, eth-ylene, 1,3-Butadiene, n-Hexane, Benzene, Naptha-lene, Anthracene
√ √ Jauhiainen et al. (2005), van Loo & Koppejan (2007)
Palm kernel - - - - - √ - van Loo & Koppejan (2007)
Sunflower shells √ - - - CO2 - - Hackl & Mauschitz (2007)
Bagasse in boiler furnace in sugar mill
√ √ - √ PM, PM10, CO2, NOx, POM, √ - EPA (1993)
Triticale (cereals) √ √ √ √ - √ √ van Loo & Koppejan (2007)
Paper fibre residues √ - - - CO2 - - Hackl & Mauschitz (2007)
Coffee grounds in 25 kW industrial furnace, in large industrial furnace, and in a open fire-place
√ √ √ √ CO, NO2, dust √ - SGS-Institut-Fresenius (2008), Waelti & Keller (2009)
Miscanthus in grate furnace, in bale furnace, in Bioflox IDDEA©
√ √ - √ CO, NOx, dust √ √ van Loo & Koppejan (2007), Schmid & Gaegauf2008, agri-cultural production investigated in Jungbluth et al. (2007b)
Thistle (Cynara car-dunculus)
- - - √ - √ - Llorente & Garcia (2006)
Straw e.g. in cigar burner or straw furnaces
√ √ √ √ NOx, dust √ √ van Loo & Koppejan (2007), Llorente & Garcia (2006), Allica et al. (2001),

- 6 -
technology calorific value
moisture density fuel com-position
emissions to air ash content
ash com-position
source
Hersener et al. (1997)
Grass in grate furnace, in bale furnace
√ √ √ √ NOx, dust - - van Loo & Koppejan (2007), Hersener et al. (1997)
Horse dung with wood shaving litter and wood chips
500-600 kW grate furnace
√ √ √ √ dust, SO2, CO, NOx, HC, NH3
-, Cl, CO2 - - Bühler et al. (2005),
Bühler et al (2007)
Horse dung with wood shaving litter and cereal briquettes
500-600 kW grate furnace
√ √ √ √ dust, SO2, CO, NOx, HC, NH3
- - Bühler et al. (2005),
Bühler et al (2007)
Horse dung with straw litter + wood chips + reed cutting
500-600 kW grate furnace
- √ - √ dust, SO2, CO, NOx, HC, NH3
- √ Bühler et al (2007)
Poultry litter 250-350 kW grate furnace
√ √ √ √ dust, SO2, CO, NOx, HC, NH3
√ (√) Salerno et al. (2001),
van Loo & Koppejan (2007),
Fungi mycelium / fungi compost + wood chips
500-600 kW grate furnace
√ √ √ (√) dust, SO2, CO, NOx, HC, NH3
- - Bühler et al. (2005)
Cereal briquette 500-600 kW grate furnace
√ √ √ (√) dust, SO2, CO, NOx, HC, NH3
- - Bühler et al. (2005)
Cutting of reed areas 500-600 kW grate furnace
- √ - √ dust, SO2, CO, NOx, HC, NH3
√ √ Bühler et al (2007)
Slurry solids 900 kW grate fur-nace
√ √ - √ dust, SO2, CO, NOx, HC, NH3
- (√) Hersener & Bühler
(1998), Hersener & Meier (2002)

- 7 -
2.4.1. Olive dry pomace Olive pomace is the solid remains of olives after pressing olive oil. It contains the skins, pulp, seeds, and stems of the fruit. In the European Union, olive pomace is burned mainly in olive oil mills in order to heat up water for the oil mills. In a demonstration project of the European Commission and the University of Cyprus detailed LCI data with regard to emissions, ash composition, calorific value etc. of the olive dry pomace are published (Avraamides & Fatta 2006, Jauhiainen et al. 2005).
2.4.2. Bagasse Bagasse is the fibrous residue remaining after sugarcane or sorghum stalks are crushed to extract their juice. Bagasse is often used as a primary fuel source for sugar mills, where it is often used in cogeneration in order to provide both heat energy, used in the mill, and electricity, which is typically sold on to the grid. The island Mauritius generates 30 % of its electricity from combustion of Bagasse. The U.S. Environmental Protection Agency (EPA 1993) reports emission factors and other useful LCI figures of the bagasse combustion in a boiler furnace in a sugar mill. The combustion of bagasse in order to generate electricity is already included in ecoinvent (Jungbluth et al. 2007a).
2.4.3. Coffee grounds The Swiss 3R Company1 sells briquettes made from coffee grounds that can be used for barbecuing, in open fire places and in wood furnaces. We made contact with Dr. Harald Jenny, the director of the 3R Company, who informed us about their activities with regard to collection of data that can be used for LCI. According to Dr. Jenny, they already measured the emissions from fuelling a 25 kW industrial furnace with coffee grounds briquettes, and further analysis with open fire places and a large industrial furnace are planned. The 3R company showed high attendance to share their data with ESU-services Ltd. in order to enable an implementation in ecoinvent. They provided us with data regarding the elemental composition of the coffee grounds fuel (SGS-Institut-Fresenius 2008) as well as regarding carbon monoxide, nitrogen dioxide and particle emissions from the combustion in a 25 kW industrial furnace (Waelti & Keller 2009).
2.4.4. Horse dung The technically feasible potential of energy from horse dung in Switzerland is about 2 PJ per year (Hersener & Meier 1999). However, as yet no horse dung is used energetically in Switzerland. Horse dung is usually mixed with litter, such as shavings or straw. Still, this combination cannot be burned by itself and needs another fuel, such as wood chips. The combustion of horse dung (with shavings or straw litter) as a co-fuel with wood chips, cereal briquettes, or reed cutting, was analysed in (Bühler et al. 2005; 2007). LCI data regarding calorific value, moisture, density, fuel composition, and emissions are published, however with a lack of data regarding the ash content and ash composition.
2.4.5. Grass and cereals Several publications report LCI data of the combustion of grass, straw, hay, cereals, miscanthus, or reed cutting. The current technically feasible potential of energy from agricultural halm crops (miscanthus, hemp etc.) in Switzerland is about 0.7 PJ per year, the one of energy from compensating areas (grass, hedges etc.) is about 3.9 PJ per year, the one of energy from cuttings from landscape conservation is about 1 PJ per year, and the one of energy from straw is 11 PJ per year (Hersener & Meier 1999). As yet, grasses and cereals are not used energetically in Switzerland. Van Loo and Koppejan (2007) report the moisture content, the calorific value and the density of high pressure grass bales, triticale, and straw, as well as elemental concentrations in straw, miscanthus, hay, triticale, and grass. They also declare the ash content of miscanthus, straw and cereals as well as the elemental composition of the ashes from cereal straw, miscanthus, and canary reed grass. However, they do not present emission factors of burning biomass substrates.
1 http://www.3rcompany.com/

- 8 -
Schmid & Gaegauf (2008) report dust, CO, and NOx emission factors of burning miscanthus pellets in an improved boiler. In addition they also declare typical elemental compositions of cereal and miscanthus pellets. The cultivation of grass, wheat, and cereals as well as the production of hay and straw is already implemented in ecoinvent.
2.4.6. Poultry litter Data of the combustion of poultry litter are presented by Salerno et al. (2001) whose study considers the combustion in a 250-350 kW grate furnace. Conventionally, poultry litter is used as a fertiliser in agriculture. Ecoinvent already contains an LCI of dried poultry manure as a commercial fertiliser covering the energy demand required for further-processing (i.e. drying and granulation), process emissions, waste production, infrastructure, and transports (Nemecek et al. 2007).
2.4.7. Slurry solids Slurry solids from liquids/solids separation of crude animal slurry can be used energetically as fuel in biomass furnaces. The technically feasible energy potential of the total slurry solids in Switzerland is about 2 PJ per year, which corresponds to 10’000 tons per year of solids from slurry separation (Hersener & Meier 1999). However, as yet slurry solids are not used energetically in Switzerland. Data of the combustion of slurry solids are reported by Hersener & Bühler (1998) and Hersener & Meier (2002).
2.5. Selection of the biomass substrates Based on the overview of potential biomass substrates for combustion and the availability of data, LCAs of the following five substrates are established: – Olive dry pomace : drying out process of pomace and combustion of dry pomace in a
small-scale boiler furnace generating heat for an olive oil mill in Cyprus. Since olive dry pomace can be considered as a waste product, no emissions from the olive cultivation need to be allocated to the pomace and therefore it is not necessary to include the olive supply chain into the LCI.
– Coffee grounds : production of coffee ground briquettes and combustion of briquettes in a 25 kW industrial furnace generating useful heat. The coffee ground in the considered briquettes is a waste product from Nespresso© capsules and therefore the coffee production and processing does not need to be considered in the LCI.
– Horse dung & wood chips : co-combustion of 67 % unmodified horse dung (including wood shaving litter) and 33 % construction residual wood chips (ecoinvent dataset) in a grate furnace with a nominal boiler heat capacity of 500-600 kW generating heat for drying fruits in a farm and heating buildings. Horse dung is a waste product with no environmental burden from its formation. However, the environmental impacts from the wood chips production need to be taken into account and can be included with ecoinvent datasets.
– Poultry litter : Production of poultry litter pellets and combustion in a 250-250 kW grate furnace generating useful heat for apartments and hen houses. Poultry litter is a waste product with no environmental burden from its formation. Production of pellets is included in the analysis.
– Slurry solids & wood chips : separation of solid components from slurry and mixing and co-combustion of 15.5 % slurry solids with 71.7 % bark (ecoinvent dataset) and 12.8 % other components (mainly wood shavings) in a 1 MW bark furnace. Slurry solids are a waste product with no environmental burden from their formation. For the bark fuel ecoinvent data sets are available and the wood shavings can be approximated with similar ecoinvent dataset.
In Fig. 1 the process chain of the combustion of the five different substrates is shown. Because the fuels are considered as waste products the process chain starts with the preparation of the fuel for the combustion. No environmental burden is allocated to the biomass substrates.

- 9 -
Fig. 1: Sketch of the process chain of the differen t biomass substrates
The five process chains in Fig. 1 are very similar. They all include four processes. The first process describes the preparation of the biomass fuel for combustion. The second process is the combustion of biomass fuel. The third process describes the heat generation and the fourth process describes the disposal of the ash generated by the combustion.
2.6. Properties of the substrates Tab. 3 shows the elemental composition of the biomass substrates. The elemental composition of the different substrates was derived from literature. The known fractions of different elements were combined with estimates of the unknown fractions to fit the higher and the lower heating values shown in Tab. 4. The formulas (1) and (2) have been used to compute the higher and the lower heating values.
Tab. 3: Elemental composition and effective moistur e of the different biomass substrates
Elemental composition Olive pomace Coffee ground
pellets
Poultry litter
pellets
Horse dung &
wood chips
Pig slurry solids
& bark chips
Unit kg/kg kg/kg kg/kg kg/kg kg/kg
Carbon C 0.470 0.512 0.400 0.480 0.465
Hydrogen H 0.057 0.055 0.065 0.055 0.055
Oxygen O 0.384 0.404 0.355 0.373 0.350
Nitrogen N 0.011 - 0.038 0.002 0.022
Sulphur S 0.001 - - - 0.004
Ash content 0.077 0.029 0.142 0.090 0.104
Total dry mass 1.000 1.000 1.000 1.000 1.000
Moisture content 0.140 0.146 0.150 0.450 0.610
If there was no data available for the elemental composition of the fuel, the formulas (1) and (2) were used to fit the elemental composition to the known heating values shown in Tab. 4. �� � 34.8 ∙ 93.9 ∙ � � 10.8 ∙ � 6.3 ∙ � � 2.44 ∙ � (1)
�� � 33.9 121.4 ∙ �� � ��� 22.6 ∙ � 10.5 ∙ � (2)
C: Carbon in kg per kg fuel H: Hydrogen in kg per kg fuel O: Oxygen in kg per kg fuel N: Nitrogen in kg per kg fuel S: Sulphur in kg per kg fuel w: Water content in kg per kg fuel
Tab. 4 shows the lower heating value, the lower heating value dry base and the higher heating value of the different substrates. The heating values calculated according to the formulas (1) and (2) are highlighted with grey colour.

- 10 -
Tab. 4: Heating values of the different biomass sub strates
Heating value Olive pomace Coffee ground
pellets
Poultry litter
pellets
Horse dung &
wood chips
Pig slurry solids
& bark chips
Unit MJ/kg MJ/kg MJ/kg MJ/kg MJ/kg
Lower heating value LHV 14.8 15.5 13.6(3
8.7(4
5.4
Lower heating value LHV dry base 17.6(1
18.6 16.4 17.9 17.8(5
Upper heating value UHV 18.4 19.1(2 17.8 18.5 18.6
1) Jauhiainen et al. 2005 2) SGS-Institut-Fresenius 2008 3) Salerno et al. 2001 4) Bühler et al. 2005 5) Hersener & Bühler 1998
Tab. 5 shows the particle density and the bulk density of the different biomass substrates. The particle and the bulk density of coffee ground pellets are assumed to be equal to the particle and bulk density of wood (Bauer 2007).
Tab. 5: Density and bulk density of the different b iomass substrates
Density Olive pomace Coffee ground
pellets
Poultry litter
pellets
Horse dung &
wood chips
Pig slurry solids
& bark chips
particle density in kg/m3 - 1100(1
850(2
- 1519(4
bulk density in kg/m3 - 650(1
500 312(3
300(4
1) Bauer 2007 2) Salerno et al. 2001 3) Bühler et al. 2005 4) Hersener & Bühler 1998
- 11 -
2.7. Technical specifications of the furnace In Tab. 6 a short description of the furnace used for the combustion of the biomass substrates is shown. The furnace used for the combustion of slurry solids and bark chips is considered the oldest technology. The furnace type hobag used for the combustion of coffee ground pellets is a fully automatic heating system as the furnaces used for the combustion of poultry litter pellets, horse dung and slurry solids. The hobag heating system does not use a grate firing but instead uses a die cutter in order to compress the fuel before the combustion. For the larger furnaces used for the combustion of poultry litter pellets, horse dung and slurry solids the same technology is used. These three fuels are burned in a grate firing. For the combustion of the olive pomace only data of a laboratory scale experiment using a tubular reactor are available.
Tab. 6: General description of the device used for the combustion of the biomass substrates
general description furnace comment
olive pomace(1
batch laboratory scale horizontal tubular reactor experiment in lab
coffee ground pellets(2
furnace type hobag 25kW device for combustion of wood waste
poultry litter pellets(3
rotating grate furnace 250-350kW, post-combustion chamber pilot plant
horse dung and wood chips(4
grate furnace 500-600kW device for combustion of wood waste
slurry solids and bark chips(5
grate furnace 1MW device for combustion of wood waste
1) Jauhiainen et al. 2005 2) Waelti & Keller 2009 3) Salerno et al. 2001 4) Bühler et al. 2005 5) Hersener & Bühler 1998
Tab. 7 shows the measures for air pollution control used during the combustion of different biomass substrates. An electrostatic filter to clean the exhaust gas was only used in the case of horse dung, but the filter did not work properly. According to Bühler et al. (2005) the electrostatic filter only removed 50% of the expected amount of particles. In Bühler et al. (2007) corona-quenching and a too high electric resistance are named as reasons for the lower separation rate.
Tab. 7: Measures for air pollution control for the different biomass substrates
air pollution control cyclone electrostatic filter comment
olive pomace(1
no no lab scale
coffee ground pellets(2
no no -
poultry litter pellets(3
yes no -
horse dung and wood chips(4
yes yes electrostatic filter did not work properly
during the measurements
slurry solids and bark chips(5
no no -
1) Jauhiainen et al. 2005 2) Waelti & Keller 2009 3) Salerno et al. 2001 4) Bühler et al. 2005 5) Hersener & Bühler 1998

- 12 -
3. Life cycle inventory: summary
3.1. Fuel-mixture preparation
3.1.1. Drying of the olive pomace The olive pomace as a residue of the olive oil production has a moisture content of about 50 w% (Vlyssides et al. 2004). In order to burn the pomace, it has to be dried. The moisture has to be reduced from 50 %w to 14 %w in order to enable the combustion of the olive pomace in a furnace. This corresponds to 0.72 kg of water per kg of dried olive pomace that has to be removed.
3.1.2. Pellet production Pellets are produced for coffee grounds and poultry litter. The LCI data for pellet production infrastructure and drying infrastructure are taken from wood pellet production (ecoinvent Centre 2010). The bulk density of the pellets is shown in Tab. 5. The moisture of the coffee grounds is reduced from 50 %w to 15 %w and the moisture of the poultry litter is reduced from 43 %w to 13 %w in order to enable the pellet production. This corresponds to 0.7 kg of water that has to be removed per kg of coffee ground pellets and 0.57 kg of water that has to be removed per kg of poultry litter pellets The energy consumption for the drying processes before the pellet production is estimated to be 3.78 MJ per kilogram water evaporated (Hässig-Schellhorn 2007). There are two possibilities to produce the pellets. Either the pellets are produced in a factory using fossil fuels for the drying process or the pellets are produced on site using heat and waste heat from the combustion processes. In addition to the savings of fossil fuels the pellets do not have to be transported, if they are produced on site. These two scenarios for the pellet production are evaluated in section 4.3.3.
3.1.3. Preparation of the fuel-mixture Two of the biomass substrates, namely horse dung and slurry solids, are mixed with wood or bark chips. These two biomass fuels have high moisture and the mixing with a dryer fuel is needed to guarantee an efficient combustion. The mixture for horse dung consists of 67 % horse dung and 33 % wood chips. The mixture for slurry solids consists of 15.5 % slurry solids and 84.5 % bark chips.
3.2. Combustion of the biomass substrates Compared to the different combustion datasets of wood in the ecoinvent database, there is only little data available for the different biomass substrates. Especially the air emissions of the combustion are not sufficiently documented in literature. In order to estimate the undocumented emissions the ecoinvent data sets for wood combustion are used. The furnace power is considered when completing the data sets. Tab. 8 shows the emission factors for air emissions from the combustion for all substrates. For the coffee ground pellets, the poultry litter pellets, the horse dung and the slurry solids there are only concentration measurements in the exhaust gas available. Based on these concentrations the total flux was calculated using the total volume of the exhaust gas derived from the elemental composition of the substrates.

- 13 -
Tab. 8: Emission factors for the air emissions of t he different biomass substrates, extrapolated emiss ion factors
are highlighted with grey colour
Emission factors Olive pomace(1
Coffee ground
pellets(2
Poultry litter
pellets(3
Horse dung &
wood chips(4
Pig slurry solids
& bark chips(5
Unit kg/MJ kg/MJ kg/MJ kg/MJ kg/MJ
Carbon dioxide CO2 1.16E-01 1.21E-01 1.08E-01 2.09E-01 3.14E-01
Carbon monoxide CO 2.12E-03 5.55E-04 5.16E-06 9.10E-05 1.41E-04
Nitrogen oxides NOx als NO2 - 3.33E-04 1.35E-04 2.39E-04 6.67E-04
Sulphur oxide SO2 - - 4.17E-04 1.71E-04 6.50E-05
Hydrocarbons HC als C - - 1.88E-06 1.71E-05 -
Hydrogen chloride - - 4.83E-05 3.18E-05 2.11E-06
Ammonia NH3 - - - 7.96E-06 -
Ash 4.47E-03 1.59E-03 8.88E-03 5.50E-03 7.46E-03
Particulates TSP - 6.34E-05 1.61E-04 2.27E-04 9.92E-04
Particulates PM <2.5um(6
- 5.70E-05 1.45E-04 2.05E-04 8.93E-04
Particulates PM 2.5 -10um(6
- 3.17E-06 8.07E-06 1.14E-05 4.96E-05
Particulates PM >10um(6
- 3.17E-06 8.07E-06 1.14E-05 4.96E-05
1) Jauhiainen et al. 2005 2) Waelti & Keller 2009 3) Salerno et al. 2001 4) Bühler et al. 2005 5) Hersener & Bühler 1998 6) extrapolated, Berdowski et al. 2001
The air emissions for the combustion of olives are taken from Jauhiainen et al. (2005) and completed with the ecoinvent data set "logs, mixed, burned in wood heater 6kW, CH". The air emissions for the combustion of coffee ground pellets are taken from Waelti & Keller (2009) and completed with the ecoinvent data set "pellets, mixed, burned in furnace 15kW, CH". The air emissions for the combustion of poultry litter pellets are taken from Salerno et al. (2001) and completed with the ecoinvent data set “wood chips, from forest, mixed, burned in furnace 300kW, CH”. The air emissions for the combustion of horse dung are taken from Bühler et al. (2005) and completed with the ecoinvent data set “wood chips, from forest, mixed, burned in furnace 1000kW, CH”. The air emissions for the combustion of slurry solids are taken from Hersener & Bühler (1998) and completed with the ecoinvent data set “wood chips, from forest, mixed, burned in furnace 1000kW, CH”. If measurements of the emissions from the combustion are available these measurements are used. For the most important pollutants like particles, nitrogen oxides and sulphur oxides measurements are documented in literature. The numbers for particles, NOx and SOx are missing for the combustion of olive pomace. For the coffee ground pellets only the SOx emissions are missing.
3.2.1. Disposal ash from combustion There are three different ways considered to dispose the ash generated by the combustion process, namely the disposal in landfarming, the disposal to municipal incineration or the disposal to a sanitary landfill For the small furnaces below a threshold of 30 kW it is assumed that 50 % of the ash are disposed in landfarming and 50 % are disposed in municipal solid waste incineration. For bigger furnaces above 30 kW it is assumed that 50 % of the ash is disposed in a sanitary land fill, 25 % of the ash is disposed in landfarming and 25 % is disposed in municipal solid waste incineration. These disposal scenarios are the same as used for disposal of wood ash in the ecoinvent data set for wood combustion (Bauer 2007).
3.2.2. Particulate matter emissions For the particulate emissions only data for the total suspended particulate matter (TSP) were available. The distribution of the size of the particles had to be estimated. It was assumed that the distribution of the size of the particles for biomass combustion corresponds to the distribution of the particles for wood combustion determined within the CEPMEIP project

- 14 -
(Berdowski et al. 2001). The distribution of the particle emissions of wood and wood waste combustion according to CEPMEIP project is shown in Tab. 9.
Tab. 9: Distribution of the total suspended partic ulate matter to the different classes of particulat es for non-
industrial combustion plants according to Berdowski et al. 2001
Emissionfactors Wood and wood
waste Low Fraction Medium Fraction
Medium-
High Fraction High Fraction
Non-industrial combustion plants Mg/PJ % Mg/PJ % Mg/PJ % Mg/PJ %
TSP 150.0 100.0% 300.0 100.0% 300.0 100.0% 300.0 100.0%
Particulates, < 2.5 um 135.0 90.0% 270.0 90.0% 270.0 90.0% 270.0 90.0%
Particulates, > 2.5 um, and <
10um 8.0 5.3% 15.0 5.0% 15.0 5.0% 15.0 5.0%
Particulates, > 10 um 7.0 4.7% 15.0 5.0% 15.0 5.0% 15.0 5.0%
3.3. Heat generation The efficiency factor of the furnace used for the combustion of the olive pomace and the efficiency factor of the furnace used for the combustion of coffee ground pellets are estimated to be equal to 0.85. The efficiency factor of the grate furnace used for the combustion of poultry litter pellets is 0.94 (Salerno et al. 2001). The efficiency factors for grate furnace and the bark furnace used for the combustion of the other substrates no information was available and an efficiency factor of 0.85 was assumed.
3.4. Disposal of the ashes The elemental composition of the ash is taken from literature and the missing values are taken from the elemental composition of wood ash documented in the ecoinvent data set "disposal, wood ash mixture, pure, 0% water, to landfarming, CH, kg". Tab. 10 shows the elemental composition of the ash of the different biomass fuels. The ash composition of the ash generated by the combustion of olive pomace is taken from Jauhiainen et al. (2005). The ash composition of the ash generated by the combustion of coffee ground pellets is taken from SGS-Institut-Fresenius (2008). The ash composition of the ash generated by the combustion of poultry litter pellets is taken from Salerno et al. (2001) and the composition of the ash generated by the combustion of horse dung is taken from Bühler et al. (2007). The ash composition of the ash generated by the combustion of slurry solids is taken from Hersener & Bühler (1998). The natural concentration of heavy metals in wood and the natural concentration in the analysed biomass substrates are similar, but the ash formation when burning biomass substrates is ten times higher compared to the ash formation when burning wood. If 90% of the heavy metals are transferred to the residual ash, the concentration of the heavy metals in the wood ash is considerably higher than the concentration of the heavy metals in the ash generated by the combustion of the biomass substrates. To account for the higher ash formation the adopted values for the concentration of heavy metals taken from wood ash are reduced by a factor of 10 in the case of olive pomace, poultry litter and horse dung and by a factor of 3 in the case of coffee ground pellets. Without this correction the heavy metal content of the ash generated by biomass combustion is assumed to be overestimated.

- 15 -
Tab. 10: Elemental composition of the ash generate d by the combustion process for the different bioma ss fuels
(kg/kg waste)
3.4.1. Landfarming One possibility to dispose the ash generated by the combustion of the biomass substrates is the disposal in landfarming. Landfarming means the spreading of the ashes on arable land. The environmental impact of the spreading of the ashes is allocated to 100 % to the combustion of the biomass. The use of ashes as fertilisers is not considered despite the high content of alkali metals and phosphorus in the ashes. The disposal of the ash in landfarming was modelled as a direct flux of the elements shown in Tab. 10 to agricultural soil.
3.4.2. Municipal incineration A second possibility to dispose the ashes is the disposal in municipal incineration. The disposal of the ash to municipal incineration was modelled according to Doka (2007). The same elemental composition of the ash, which is shown in Tab. 10, was used for the calculations. This includes the combustion of the ash in municipal incineration and the landfilling of the residual waste.
Fuel ash olive pomaceash coffee ground
pellets
ash poultry litter
pellets
ash horse dung and
wood chips
ash slurry solids and
bark chips
Water content H2O n.a. n.a. n.a. n.a. n.a.
Oxygen (without O from H2O) O 0.38554 0.4012 0.2875 0.4909 0.4909
Hydrogen (without H from H2O) H n.a. n.a. n.a. n.a. n.a.
Carbon (enter share of biogenic C below) C 0.14853 0.012 0.012 0.012 0.012
Sulfur S 0.00987 0.0092 0.0092 0.0092 0.0092
Nitrogen N n.a. n.a. n.a. n.a. n.a.
Phosphor P 0.01705 0.0098 0.112 0.00392 0.00392
Boron B n.a. n.a. n.a. n.a. n.a.
Chlorine Cl 0.00305 0.0032 0.0032 0.000204 0.000204
Bromium Br n.a. n.a. n.a. n.a. n.a.
Fluorine F n.a. n.a. n.a. n.a. n.a.
Iodine I n.a. n.a. n.a. n.a. n.a.
Silver Ag n.a. n.a. n.a. n.a. n.a.
Arsenic As n.a. 0.0000067 0.0000067 0.0000067 0.0000067
Barium Ba n.a. n.a. n.a. n.a. n.a.
Cadmium Cd n.a. 1.03448E-05 0.00000022 0.000005 0.000005
Cobalt Co n.a. 3.44828E-05 0.0000018 0.0000018 0.0000018
Chromium Cr n.a. 3.44828E-05 0.0000195 0.0000195 0.0000195
Copper Cu n.a. 0.001034483 0.000426 0.000103 0.000103
Mercury Hg n.a. 0.000000033 0.00000001 0.00000001 0.00000001
Manganese Mn n.a. 0.002172414 0.02 0.02 0.02
Molybdenum Mo n.a. 0.0000037 0.0000037 0.0000037 0.0000037
Nickel Ni n.a. 6.89655E-05 0.000059 0.00000552 0.00000552
Lead Pb n.a. 0.000172414 0.0000065 0.000016 0.000016
Antimony Sb n.a. 0.000206897 n.a. n.a. n.a.
Selenium Se n.a. n.a. n.a. n.a. n.a.
Tin Sn n.a. 0.001172414 n.a. n.a. n.a.
Vanadium V n.a. 3.44828E-05 0.0000395 0.0000395 0.0000395
Zinc Zn n.a. 0.002965517 0.00091 0.00102 0.00102
Beryllium Be n.a. n.a. n.a. n.a. n.a.
Scandium Sc n.a. n.a. n.a. n.a. n.a.
Strontium Sr n.a. n.a. n.a. n.a.
Titanium Ti 0.00065 0.00138 0.00138 0.00138 0.00138
Thallium Tl n.a. n.a. n.a. n.a. n.a.
Tungsten W n.a. n.a. n.a. n.a. n.a.
Silicon Si 0.06982 0.0826 0.0826 0.0826 0.0826
Iron (enter share of metallic iron below) Fe 0.02528 0.0228 0.0228 0.0228 0.0228
Calcium Ca 0.06675 0.284 0.284 0.284 0.284
Aluminium Al 0.0241 0.079310345 0.0208 0.0208 0.0208
Potassium K 0.21518 0.0545 0.099 0.01886 0.01886
Magnesium Mg 0.03023 0.0321 0.044 0.0321 0.0321
Sodium Na 0.00395 n.a. n.a. n.a. n.a.
sum wet mass 100.00% 100.00% 100.00% 100.00% 100.00%

- 16 -
3.4.3. Sanitary landfill The third possibility to dispose the ashes is the disposal of the ashes to a sanitary landfill. The disposal of the ashes to a sanitary landfill was modelled according to Doka (2007). The same elemental composition of the ash, which is shown in Tab. 10, was used for the calculations. This includes the construction of the sanitary landfill and the treatment of the sewage sludge from the wastewater treatment.
3.5. Coffee grounds in municipal incineration For the coffee ground a second way of energy recovery was modelled, namely the combustion of the wet coffee grounds in municipal incineration instead of the drying and pelletising of the coffee grounds. The heat and electricity generation was modelled according to Doka (2007). The same elemental composition for the moist fuel as shown in Tab. 3 was used for the calculations. For the analysis the net benefit of the combustion of coffee grounds in municipal incineration is computed. The net benefit is calculated as the difference between the avoided environmental impact of energy generation and the environmental impact of the combustion of one kilogram of coffee grounds in municipal incineration. The combustion of 1 kg of coffee grounds in municipal incineration generates 0.53 kWh electricity and 3.92 MJ of useful heat according to Doka (2007). For the substitution of the energy generation two possibilities for electricity generation and heat production are analysed resulting in a minimal net benefit and a maximal net benefit. This minimum-maximum analysis is performed to cover the range of the different technologies for energy generation (Zah et al. 2007). As substitution processes for electricity generation the process „electricity, natural gas, at combined cycle plant, best technology, RER“ is chosen for the minimal net benefit and for the maximal net benefit the electricity import mix shown in Tab. 11.
Tab. 11: Unit process raw data of the electricity i mport mix used for the calculation of the maximal n et benefit of the
electricity generation
As substitution process for heat generation the process “heat, light fuel oil, at industrial furnace 1MW, CH” is chosen for the maximal net benefit and the process “heat, natural gas, at industrial furnace >100kW, RER” for the minimal net benefit.
Name
Loca
tion
Infra
stru
ctu
reP
roce
s
Un
it electricity mix, import FR/DE/IT
Unc
erta
inty
Type
Sta
ndar
dD
evia
tion
95
% GeneralComment
Location CHInfrastructureProcess 0
Unit kWhproduct electricity mix, import FR/DE/IT CH 0 kWh 1
technosphere electricity mix FR 0 kWh 9.17E-1 1 1.05 (1,1,1,1,1,1,BU:1.05); Leuenberger M. and Frischknecht R. (2010) Life Cycle Assessment
electricity mix IT 0 kWh 1.92E-2 1 1.05
(1,1,1,1,1,1,BU:1.05); Leuenberger M. and Frischknecht R. (2010) Life Cycle Assessment of Swiss Electricity Mixes. implemented in ecoinvent data v2.3
electricity mix DE 0 kWh 6.41E-2 1 1.05
(1,1,1,1,1,1,BU:1.05); Leuenberger M. and Frischknecht R. (2010) Life Cycle Assessment of Swiss Electricity Mixes. implemented in ecoinvent data v2.4

- 17 -
3.6. Data quality All the measurements were performed in pilot plants. Therefore the measurements are not comparable to a continuous operation of the plants. No adjustments have been made to the emission factors in order to account for the measurements in pilot plants. For all substrates only the total amount of suspended particulate matter (TSP) in the flue gas was measured. The particle distribution had to be extrapolated from other measurements (Berdowski et al. 2001). This resulted in a fraction of 90% of the TSP belonging to the smallest category of the particulate matter (PM) smaller than 2.5 um. Because the combustion process of the biomass is worse compared to the combustion of wood, it is expected that the amount of small particles is smaller for the biomass fuels than for the wooden fuels, but there was no data available to prove this assumption. Therefore the same particle distribution as for the combustion of wooden fuels was used. This might lead to a higher environmental impact because the environmental impact of smaller particles is higher than the environmental impact of bigger particles. Because of the availability, the up-to-dateness and the quality of the data an inclusion in the ecoinvent data base is only recommended for the data sets for coffee ground pellets, poultry litter pellets and horse dung mixed with wood chips.
3.6.1. Olive pomace Data quality for olives pomace is debatable. The ash composition and the air emissions during the combustion are documented in Jauhiainen et al. (2005), but in the measurements of Jauhiainen et al. (2005) no heavy metals emissions, no nitrogen oxide emissions and no particle emissions into air are reported, as well as there are no heavy metals detected in the ash after combustion. Because the heavy metal emissions and the heavy metal content of the ash have a high impact on the result of the ecological scarcity method 2006 it is recommended to consider this fact when comparing the olive pomace with the other substrates, especially in case of the disposal of the ash.
3.6.2. Coffee grounds For coffee grounds there are measurements for the nitrogen oxides, carbon monoxides and particle emissions from the combustion in Waelti & Keller (2009) as well as the metal content of the fuel (SGS-Institut-Fresenius 2008). This covers the factors with the highest impact on the result of the ecological scarcity method 2006. Because of the recent measurements and the emissions measured, the air emission data quality for coffee grounds is sound. For the ash composition of the coffee grounds there was no information available, but there was detailed information on the composition of the fuel regarding metals and heavy metals in SGS-Institut-Fresenius (2008). In order to estimate the transfer of the heavy metals to the ash, the heavy metal balance of the combustion process was calculated, assuming that all heavy metals which are not emitted into air during the combustion are transferred to the ash. This calculation provides a reliable estimate for the heavy metal content in the ash.
3.6.3. Poultry litter The data quality for poultry litter is considered as sound. The measurements took place in 2001 (Salerno et al. 2001) and as for coffee grounds the key emissions into, namely nitrogen oxides, sulphur oxides, particulate matter and carbon monoxide are measured. The other emissions are again taken from the data sets for wood combustion. For the ash composition there is information on the potassium, phosphorus, magnesium, cadmium, copper, nickel and zinc content of the ash in Salerno et al. (2001). This selection covers the most important metals except of lead in case of the heavy metals.
3.6.4. Horse dung The most important air emissions generated by the combustion of horse dung regarding environmental impact are measured in Bühler et al. (2005). This includes the emissions of nitrogen oxides, sulphur oxides and particulate matter. The basis of the data regarding air emissions is considered as sound.

- 18 -
For the ash composition there is information on the content of phosphorus, potassium, lead, zinc, copper and cadmium in Bühler et al (2007). This covers most of the elements with a high environmental impact
3.6.5. Pig slurry solids For pig slurry there was only information available on the air emissions in Hersener & Bühler (1998). Again the most important air emissions are measured. For the ash composition there was no data available , but there was information on the composition of the fuel regarding metals and heavy metals in Hersener & Bühler (1998). In order to estimate the transfer of the heavy metals to the ash, the heavy metal balance of the combustion process was calculated, assuming that all heavy metals which are not emitted into air during the combustion are transferred to the ash. Because the measurements for pig slurry took place in 1998 and because of the missing data regarding ash composition the data quality for pig slurry solids is considered as the lowest among these five biomass substrates. Further the fuel mixture for slurry solids mainly consists of wood (about 85%, cf. Tab. 14) and rather represents the co-combustion of a small fraction of slurry solids with wood.

- 19 -
4. Life cycle impact assessment The five data sets for the heat generation are evaluated with the methods ecological scarcity 2006 (Frischknecht et al. 2009) and IPCC Global Warming Potential (Solomon et al. 2007) and the mass fluxes for selected substances are analysed. In addition the energy recovery from coffee grounds in municipal incineration is analysed.
4.1. Ecological Scarcity 2006 The ecological scarcity method (Frischknecht et al. 2009) evaluates the inventory results on a distance to target principle. The calculation of the eco-factors is based on one hand on the actual emissions (actual flow) and on the other hand on Swiss environmental policy and legislation (critical flow). These goals are: – Ideally mandatory or at least defined as goals by the competent authorities, – formulated by a democratic or legitimised authority, and – preferably aligned with sustainability. The weighting is based on the goals of the Swiss environmental policy; global and local impact categories are translated to Swiss conditions, i.e. normalised. Environmental impacts are shown separately for the main environmental compartments such as air, soil, surface water, ground water, waste, natural and energy resources. The method is applicable to other regions as well. Eco-factors were also developed for the Netherlands, Norway, Sweden (Nordic Council of Ministers 1995, Tab. A22 / A23), Belgium (SGP 1994) and Japan (Miyazaki et al. 2004). The ecological scarcity method allows for an optimisation within the framework of a country’s environmental goals. The environmental and political relevance is essential for the choice of substances. The environmental policy does by far not define goals for all substances. Thus the list of eco-factors is limited. This particularly applies to substances with low or unknown environmental relevance in Switzerland and Europe (e.g. sulphate emissions in water bodies). Fig. 2 shows the absolute and the relative contribution of the different stages to the result of ecological scarcity method 2006. The combustion of natural gas has the lowest environmental impact to generate 1 MJ of useful heat followed by the combustion of wood and the combustion of oil. The biomass substrates perform significantly worse than the fossil and the wooden fuels. The combustion of the biomass substrates performs even worse than a small and inefficient combustion (wood logs mixed 6 kW). Overall, the burning of biomass releases more pollutants into the environment than the combustion of wood, oil or natural gas. Especially the combustion of olive pomace and pig slurry solids causes a high environmental impact. The emissions caused by the combustion process have the highest fraction for all fuels. The supply of the fuel has a higher environmental impact in case of the fossil fuels and the pelletized fuels. The drying of the olive pomace also causes a higher environmental impact for the supply with fuel. The disposal of the ashes just has an impact to the heat generation using biomass fuels. For all the biomass substrates except olive pomace the disposal of the ash has a higher impact on the result of the ecological scarcity method than for the wooden fuels. Based on Fig. 2 one can say that the combustion process itself has the highest influence on the result, followed by the provision of the fuel and the disposal of the ashes in case of the biomass substrates. A clean and complete combustion of the fuel and an appropriate disposal of the ash have the highest priority in order to minimise the environmental impacts of the heat generation.

- 20 -
Fig. 2: Total score (top) and the relative contribu tion (bottom) to the total score calculated with th e method ecolog-
ical scarcity 2006 per MJ of heat generated by the combustion of the different fuels split into contri bution
from the provision of the fuel, the direct emission s from combustion, disposal of the ashes and the re st
Fig. 3 shows the environmental impact of the burning of biomass substrates and wooden and fossil fuels grouped according to the different environmental compartments and resources distinguished in the environmental scarcity method. The combustion of slurry solids and bark chips has the highest environmental impact regarding emissions into air, into ground water and into top soil. Further the combustion of pig slurry solids consumes the most energy resources because of the high amount of bark chips that has to be mixed with the slurry solids in order to enable the combustion (cf. 3.1.3) and causes a high depletion of natural resources. The combustion of poultry litter pellets causes the highest emissions into surface water and produces a high amount of waste that has to be deposited. The high moisture of the slurry solids demands a high amount of an additional, dryer fuel, namely bark chips, in order to enable the combustion. In case of the combustion of pig slurry solids the depletion of energy resources is even higher than in case of the fossil fuels. Without an overall weighting of the environmental impacts the ranking would differ for the different environmental compartments, but the combustion of slurry solids causes also the highest environmental impact in five of the seven categories.

- 21 -
Fig. 3: Environmental impact of the burning of the different biomass substrates, wood and fossil fuels relative to
the highest score per environmental compartment
Fig. 4 shows the absolute and the relative contribution of the different environmental compartments to the result of ecological scarcity method 2006. The highest percentage of the result is determined by the emissions into air and the emissions into top soil. The emissions in these two environmental compartments are analysed in more detail in the sections 4.1.1 and 4.1.2. For all the biomass fuels the relative contribution of the different environmental compart-ments is similar. The emissions into air and the emissions into top soil account for the highest fraction of the total results. The sum of the points for the emissions into air and the emissions into top soil cover more than 90% of the environmental impact of the biomass fuels according to the ecological scarcity method 2006. The total score is determined to a large extent by the air emissions. This shows the importance of the combustion process and the combustion technology. All the other environmental compartments have a considerably lower contribution to the result.

- 22 -
Fig. 4: Total score (top) and the relative contribu tion (bottom) to the total score calculated with th e method ecolog-
ical scarcity 2006 per MJ of heat generated by the combustion of the different fuels split into enviro nmental
compartments
4.1.1. Emissions into air Fig. 5 shows the contribution of the different air pollutants to the total score of the air emissions as absolute values and relative to the total score. The environmental impact of the air emissions is mainly caused by the emission of benzene, particles, nitrogen oxides, methane, lead, dinitrogen oxide, cadmium, dioxin, sulphur oxide, NMVOC and fossil CO2. The reported benzene emissions per MJ of heat generated by the combustion of olive pomace are about 20 times higher than the benzene emissions into air generated by the combustion of the other substrates. The composition of the olive pomace seems to boost the formation of aromatic hydrocarbons during and after the combustion. The most important airborne emissions in case of the combustion of biomass substrates are particle emissions, emissions of nitrogen oxides and emissions of benzene, but there are considerable differences in the contribution of the different air pollutants to the total score across the different fuels.

- 23 -
Fig. 5: Total score (top) and the relative contribu tion (bottom) to the total score for air emissions calculated with
the method ecological scarcity 2006 per MJ of heat generated by the combustion of the different biomas s
substrates and the combustion of wood
Between the biomass substrates and the wooden fuels there is only a small difference in the contribution of the different pollutants to the total score. For the fossil fuels the total score for the air emissions is mainly determined by the emissions of fossil carbon dioxide. Because of the high benzene emissions when burning olive pomace, the NMVOC emissions for the burning of olive pomace are higher than all other fuels (cf. figure Fig. 6). For the other fuels the NMVOC emissions are in the same order of magnitude, except for light fuel oil. The nitrogen oxide emissions are in the same range for all fuels but slightly higher for the biomass substrates. Astonishing are the low nitrogen oxide emissions for horse dung and poultry litter. For these substrates high nitrogen oxide emissions are expected because of the elemental composition of the dung like in the case of slurry solids. The particulate emissions are very high for the burning of biomass substrates (cf. Fig. 6). In the case of the burning of the slurry solids one has to say that the particle measurements are taken from a pilot plant, which does not fulfil the Swiss legislation regarding particle emissions (LRV 2009). The particle concentration of 564 mg/m3 (Hersener & Bühler 1998) in the flue gas exceeds the threshold of 20 mg/m3 by more than a factor of 25. In addition the distribution of the particle size had to be estimated for all the biomass substrates, because only the mass of the total suspended solids in the exhaust gas was measured (cf. Tab. 9). The total amount of suspended solids in the exhaust gas of the biomass combustion is higher than the total amount of suspended solids from which the distribution was extrapolated. More detailed information about the distribution of the particles emitted from the

- 24 -
combustion of the biomass substrates is needed in order to assess the environmental impact of the particle emissions.
Fig. 6: NMVOC emissions, nitrogen oxide emissions, particulate emissions and sulphur dioxide emissions caused
by the generation of 1 MJ of useful heat for differ ent substrates
When looking at Fig. 6 the high the amount of emissions compared to the other substrates is clearly visible, the total mass of particles emitted and the total mass of nitrogen oxides emissions have to be reduced by at least a factor of 2 in order to be in the same range as the emissions caused by the combustion of wooden fuels.

- 25 -
4.1.2. Emissions into soil Fig. 7 shows the environmental impacts caused by the emissions into top soil in detail. The heavy metal emissions account for the highest fraction of the environmental impact. The sum of the environmental impact of Zinc, Cadmium, Copper and Lead determines about 90% of the environmental impact assessed with the method of the ecological scarcity 2006. The combustion of pig slurry solids mixed with bark chips causes the highest heavy metal emissions into soil, followed by coffee ground pellets and poultry litter pellets. The heavy metal flux into agricultural soil per MJ of heat generated in the case of the biomass fuels is considerably higher than the heavy metal flux per MJ of heat generated in case of the wooden fuels. The disposal of the ash as fertiliser on agricultural soil has a high environmental impact. Because there are no heavy metals in the ash of burned olive pomace (cf. Tab. 10), the emissions into top soil are rated considerably lower in case of olive pomace compared to the other biomass substrates and even compared to the wooden fuels.
Fig. 7: Total score (top) and the relative contribu tion (bottom to the total score of emissions into t op soil calculat-
ed with the method ecological scarcity 2006 per MJ of heat generated by the combustion of different bi o-
mass substrates and wooden fuels
Fig. 8 shows the absolute mass fluxes of the heavy metals copper, zinc, cadmium and lead into agricultural soil. The copper emissions are very high for pig slurry solids followed by coffee ground pellets and poultry litter pellets. The zinc emissions into top soil are

- 26 -
considerably higher for the biomass substrates compared to the wooden fuels except olive pomace. Again the zinc emissions caused by the combustion of pig slurry solids are the highest. The cadmium emissions into top soil are in the same range, but again higher for the biomass substrates compared to the wooden fuels except for olive pomace and poultry litter pellets. The lead emissions into top soil are in a similar range except the emission caused by the disposal of the ash of coffee ground pellets. The lead emissions for poultry litter pellets and horse dung are between the values of wood logs and wood chips.
Fig. 8: Heavy metal flux into top soil for the heav y metals copper and zinc in mg on the left and for cadmium and
lead in ug on the right
4.2. Greenhouse gases
All substances, which contribute to climate change, are included in the global warming poten-tial (GWP) indicator according to IPCC (Solomon et al. 2007). The residence time of the sub-stances in the atmosphere and the expected immission design are considered to determine the global warming potentials. The potential impact of the emission of one kilogram of a greenhouse gas is compared to the potential impact of the emission of one kilogram CO2 resulting in kg CO2-equivalents. The global warming potentials are determined applying dif-ferent time horizons (20, 100 and 500 years). The short integration period of 20 years is rele-vant because a limitation of the gradient of change in temperature is required to secure the adaptation ability of terrestrial ecosystems. The long integration time of 500 years is about equivalent with the integration until infinity. This allows monitoring the overall change in tem-perature and thus the overall sea level rise, etc..
In this study a time horizon of 100 years is chosen, which is also used in the Kyoto protocol.

- 27 -
Fig. 9 shows the IPCC global warming potential for the different fuels. It is pointed out that the composition of the biomass substrates and the wood fuels is different to the composition of the fossil fuels. The combustion of oil and natural gas causes high emissions of fossil carbon dioxide, which results in a high global warming potential. All the biomass substrates cause a lower global warming potential than the fossil fuels. The pelletised fuels have a higher global warming potential but the GWP is still way below the GWP caused by the combustion of fossil fuels. Further the drying of the pelletised fuels is modelled with the use of fossil fuels for the heat generation. The impact on the GWP can be lowered if waste heat or heat generated by the combustion of the biomass substrate itself is used.
Fig. 9: IPCC global warming potential for the gener ation of 1 MJ of useful heating using the different biomass
substrates or wooden fuels
Fig. 10 shows the fractions of the different greenhouse gases contributing to the total global warming potential. For olive pomace the non-CO2 emissions and the emission of biogenic methane accounts for about 90% of the global warming potential. For all the other substrates the GWP is mainly caused by CO2 emissions. The GWP is considerably lower for all the biomass substrates and wooden fuels compared to the combustion of fossil fuels.

- 28 -
Fig. 10 GWP in CO 2-eq per MJ of heat generated with different substra tes in absolute values (top) and relative to
the total score (bottom)
4.3. Scenario analysis
4.3.1. Coffee grounds in municipal incineration Fig. 11 shows the net benefit (Zah et al. 2007) of the combustion of coffee grounds in municipal incineration. The combustion of coffee grounds in municipal incineration leads to a reduction of the GWP for the minimal net benefit as wells as for the maximal net benefit. This is the case because fossil fuels are replaced by the non-fossil fuel coffee ground. The combustion of the coffee grounds in form of pellets in a furnace has a minimal net benefit of 0.6 kg CO2-eq/kg and is higher than the maximal net benefit for the combustion in municipal incineration. The net benefit for the combustion of coffee grounds calculated with the ecological scarcity method 2006 reveals that the minimal and the maximal net benefit are negative. This means that the substitution processes for the minimal and the maximal net benefit have a lower environmental impact according to the ecological scarcity method 2006. The energy recovery in municipal incineration and the direct combustion of the coffee grounds are options to reduce the greenhouse gas emissions, but these options may not be environmentally friendlier, when looking at other emissions than greenhouse gases. Regarding the overall environmental impact the combustion of the coffee grounds in municipal incineration is the better solution than the direct combustion but the reduction of the GWP is slightly lower. The net benefit in Fig. 11 also shows the trade-off between the reduction of the GWP and the increase of the environmental impact according to the ecological scarcity method 2006.

- 29 -
Fig. 11 Net benefit of the combustion of coffee gro unds in a furnace and in municipal incineration per kg of material
4.3.2. Ash disposal In order to evaluate the impact of the disposal of the ash generated by the combustion different scenarios for the disposal of the ash are compared. In the reference scenario (REF) the ash is disposed to 50 % in landfarming and to 50 % in municipal incineration for olive pomace and coffee ground pellets. The ashes from poultry litter pellets, horse dung and slurry solids are disposed to 25 % in landfarming, to 25 % in municipal incineration and to 50 % to a sanitary landfill in the reference scenario (REF). The reference scenario is described in section 3.2.1. and is used for the life cycle impact assessment. In the scenario disposal in landfarming (LAND) all the ash is disposed in landfarming. The disposal in landfarming is described in section 3.4.1. In the scenario disposal to municipal incineration (MSWI) all the ash is disposed to municipal incineration and in the scenario disposal to sanitary landfill (MSWLF) all the ash is disposed to a sanitary landfill.
Fig. 12 Comparison of the different possibilities f or the disposal of the ash generated by the combust ion of the
biomass fuels for the reference scenario (REF), the disposal in landfarming (LAND), the disposal to mu nici-
pal incineration (MSWI) and the disposal to sanitar y landfill (MSWLF)
The different scenarios for the disposal evaluate the impact of the disposal strategy on the result of the ecological scarcity method 2006. For the olive pomace the disposal of the ash

- 30 -
has only a small influence on the result. Because there are no heavy metals in the ash (cf. Tab. 10) the disposal of the ash from the combustion of olive pomace in landfarming has only low environmental impacts. The different scenarios show that the disposal of the ash has a considerable influence on the result for all the biomass substrates except olive pomace. The environmental impact can be lowered when disposing the ash to municipal incineration or to a sanitary landfill.
4.3.3. Pellet production In order to evaluate the importance of the energy source for the drying of the biomass, two possibilities for the drying process are modelled here. The first scenario assumes that the biomass is dried using fossil fuels and stored in a regional storage centre after the pelletising process. This is scenario is named regional storage. This is the worst case regarding use of fossil fuels because fossil fuels are used for the heat generation in the drying process and for the transportation of the pellets to the regional storage centre. This scenario describes the situation if pellets are sold to external users. The second scenario assumes the production of the pellets on site and the direct use of the heat generated by the combustion of the pellets for the drying process. This is the best case with a minimal use of fossil fuels because of the minimised transport distances and use of non-fossil fuels to dry the biomass substrates. But, it would not allow for using the pellets at another place. Fig. 13 shows the comparison of the different scenarios for coffee ground pellets and poultry litter pellets. The environmental impact calculated with the method ecological scarcity 2006 slightly increases when using the biomass substrates in a closed loop in order to dry the wet biomass. This is mainly the case because of the high airborne emissions caused by the combustion of the biomass substrates. The GWP can be reduced by 50 % when using the biomass substrates for the drying process instead of fossil fuels and when producing the pellets on site. However, there is a trade-off between reduction of the greenhouse gas emissions and the increase of other airborne emissions like particles and nitrogen oxides. Without an improvement of the combustion technology or a treatment of the flue gas the production of the pellets on site does not have a smaller environmental impact.
Fig. 13: Total score calculated with the method eco logical scarcity 2006 on the left and GWP according to IPCC on
the right for the different scenarios for the dryin g of the biomass substrates during pelletizing proc ess

- 31 -
5. Interpretation Biomass from agriculture, forestry or landscape management as well as waste from industry or households can be used for energy recovery. In this project an LCA performed for the direct combustion of five different wastes, namely olive pomace, coffee grounds, poultry litter, horse dung and pig slurry solids. The LCA shows, that the direct emissions from combustion into air and the emissions from ash disposal into top soil turn out to cause the most important environmental impacts. The burning of olive pomace and pig slurry solids has the severest environmental impacts (cf. Fig. 3 and Fig. 4). The combustion of olive pomace causes high emissions of volatile organic carbons, mainly benzene and methane and the combustion of pig slurry solids causes high particle emissions. The benzene emissions resulting from the combustion of olive pomace are high compared to the benzene emissions resulting from the combustion of the other substrates (cf. Fig. 5). The benzene emissions are taken from Jauhiainen et al. (2005). The lowest benzene emissions reported by Jauhiainen et al. (2005) were taken for the this study. It has to be considered that even higher benzene emissions are possible for the combustion of olive pomace when the conditions for the combustions are suboptimal. Especially because Conesa et al. (2009) report even higher benzene emissions than Jauhiainen et al. (2005). However, the investigations of Jauhiainen et al. (2005) show that the combustion can be optimised in order to reduce the benzene emissions. The pelletising of the biomass substrates reduces the particle emissions. The combustion of poultry litter pellets, coffee ground pellets and wood pellets causes lower particle emissions among the different biomass substrates (cf. Fig. 5 and Fig. 6). However, the biomass substrates in general perform significantly worse compared to the particle emissions generated by the combustion of wooden fuels and even worse when compared to fossil fuels. In order to reduce the environmental impact of the combustion of the biomass substrates the combustion process has to be optimised in order to minimise the particle emissions or a treatment of the flue gas with a particle filter is necessary to reduce the particle emissions. The fuel with the highest particle emissions were the slurry solids mixed with wood chips. This fuel has high moisture of more than 60 w% (cf. Tab. 3). A drying procedure before the combustion, like in the case of the pelletised fuels could help to reduce the particle emissions. Because of the high moisture of the pig slurry, the slurry solids have to be mixed with a dryer fuel in order to enable the combustion. This mixing leads to a high use of energy resources and natural resources. Despite the mixing with a dryer fuel for co-combustion the pig slurry solids have a low heating value (cf. Tab. 4) and the combustion of pig slurry solids has the highest environmental impact among the different biomass substrates according to the ecological scarcity method 2006. The direct combustion of slurry solids as described in Hersener & Bühler (1998) is not a valuable disposal strategy. The influence of the used technology is difficult to determine, because the used technology is identical for the bigger furnaces with a high rated power (cf. Tab. 6). Procedural differences have not been investigated because the furnaces with a rated power above 250 kW all use the grate furnace technology. The used technology for the combustion of olive pomace is not comparable to the other furnaces, because the olive pomace is burned in a lab scale experiment. The fully automatic heating system type hobag used for the combustion of coffee ground pellets seems to be suitable for biomass combustion and even without treatment of the flue gas the particle emissions are low compared to the other fuels. Because of the lower rated power of only 25 kW compared to the other furnaces with a rated power of 250 kW or more, the automatic heating system type hobag is not compared to the technologies used for the other biomass substrates. For further investigations regarding combustion technology data from other furnaces using different technologies are needed Based on the results one can say that drier fuels cause less particle emissions and that a treatment of the flue gas is necessary in order to reduce the particle emissions. Heavy metal emissions are very low for olive pomace (cf. Fig. 7). The heavy metal content has to be approved with further literature research or new measurements. The high heavy metal content of the ash from the combustion of biomass substrates has severe

- 32 -
consequences for the disposal of the ash. The disposal of the ash of the biomass substrates in landfarming leads to a considerably higher flux of heavy metals into top soil than the disposal of the ash of wooden fuels. A disposal of the ash for biomass fuels to municipal incineration or to a sanitary landfill has to be considered in order to minimise the heavy metal fluxes into top soil and the environmental impacts. The low global warming potential of the burning of horse dung and slurry solids matches the expectations for biomass substrates, as there are no environmental burdens allocated to the fuel itself, the global warming potential is supposed to be low. The high global warming potential for the other biomass substrates is astonishing, especially for olive pomace, because the combustion of the fuel itself does not emit fossil CO2. The higher global warming potential of pelletised fuels originates from the preparation of the fuel. The original substrates coffee ground and poultry litter are wet and have to be dried in order to enable the pelletising process. The drying process is modelled with a heating system using fossil fuels, which leads to the higher GWP for coffee ground pellets and poultry litter pellets. The higher global warming potential of the pelletised biomass substrates is caused by the higher moisture of the biomass compared to wood. The other biomass substrates, namely horse dung and slurry solids, also have high moisture, but they do not have to be dried. Horse dung and slurry solids are mixed with a drier fuel and burnt with high moisture. In this way there is no additional energy demand as for the pelletised fuels, which results in the lower global warming potential. However the overall environmental impact is difficult to assess because the pelletising seems to lower the particle emissions during combustion but needs more energy for the preparation. The high GWP resulting from the combustion of olive pomace is caused by the high emissions of methane. These high methane emissions may be caused by the used combustion technology. In order to be able to judge energy recovery from olive pomace the combustion process and the methane emissions have to be measured in more detail

- 33 -
6. Conclusion and outlook In this project the environmental impact of the direct combustion of five different biomass substrates, namely olive pomace, coffee grounds, poultry litter, horse dung and pig slurry solids, is assessed with an LCA. The main environmental impacts of the combustion of the different biomass substrates are high particle and nitrogen oxide emissions into air and high heavy metal emissions into soil. The biomass fuels perform worse than their wooden and fossil counterparts when using the ecological scarcity method 2006. When using the IPCC GWP the biomass fuels perform better than the fossil fuels but not better than wooden fuels. For the heat generation using biomass substrates that means a trade-off between a reduction of the greenhouse gas emissions and an increase of other airborne pollutants like particles and nitrogen oxides. In the case of olive pomace the combustion process need to be optimised in order to guarantee a complete combustion of the fuel and to lower the benzene and methane emissions. The high benzene and methane emissions are responsible for the high impacts in case of the ecological scarcity 2006 and the IPCC global warming potential. For slurry solids, poultry litter pellets and horse dung a treatment of the flue gas is necessary in order to limit the particle emissions. The importance of particle emissions causes the considerably higher environmental impact for the biomass substrates compared to the wooden fuels. For all the pilots plants considered for this study only two had some kind of flue gas treatment (cf. Tab. 7). Therefore, there is a potential to reduce the air emissions, especially particles, with measures like cyclones or electro filters. Regarding electro filters the experiences from Bühler et al. (2005, 2007) should be considered. The wet biomass fuels are prone to cause high particle emissions. With adequate technology, either to avoid the particles due to a better combustion or to clean the exhaust gas, these emissions can be significantly reduced. The environmental impact of the disposal of the ash in landfarming is completely allocated to the disposal of the ashes. The replacement of the artificial fertiliser is not considered. If the environmental impact also would be allocated partly to the fertilisation of the agricultural land, the environmental impact of the disposal of the ash would be reduced. The different scenarios (cf. Fig. 12) show that environmental impact can be reduced by disposing the ash generated by the combustion to municipal incineration or to a sanitary landfill. Regarding the heavy metal content of olive pomace there is additional measurement needed to consolidate the low heavy metal content in the fuel and the ash. According to the life cycle impact assessment with the Swiss ecological scarcity method the combustion of biomass fuels is not an environmentally valuable alternative to the combustion of fossil fuels and wooden fuels, but with adjustments in the combustion technology and the disposal of the ash the combustion of biomass is able to compete with the combustion of wood. A cleaning and filtering of the exhaust gas and good conditions for a complete combustion are requirements for the energy recovery from biomass substrates. When these requirements are fulfilled these biomass substrates can be a valuable alternative to fossil and wooden fuels and with the combustion of biomass fuels instead of fossil fuels the greenhouse gas emissions can be reduced. For the improvement of the data sets, more detailed data on the air emissions, especially the particle distribution and the data regarding the heavy metal content of olive pomace is needed.

- 34 -
7. Appendix: life cycle inventory The EcoSpold files elaborated in this project can be downloaded on http://www.esu-services.ch/ourservices/lci/public-lci-reports/ or http://www.lc-inventories.ch/. They have not been validated according to the ecoinvent guidelines.
7.1. Fuel-mixture preparation
7.1.1. Drying of the olive pomace The olive pomace as a residue of the olive oil production has a moisture content of about 50 w% (Vlyssides et al. 2004). In order to burn the pomace, it has to be dried. The moisture has to be reduced from 50 %w to 14 %w in order to enable the combustion of the olive pomace in a furnace. This corresponds to 0.72 kg of water per kg of dried olive pomace that has to be removed.
Tab. 12: Unit process raw data for the drying of ol ive pomace
7.1.2. Pellet production Pellets are produced for coffee grounds and poultry litter. The LCI data for pellet production infrastructure and drying infrastructure are taken from wood pellet production (ecoinvent Centre 2010). The bulk density of the pellets is shown in Tab. 5. The moisture of the coffee grounds is reduced from 50 %w to 15 %w and the moisture of the poultry litter is reduced from 43 %w to 13 %w in order to enable the pellet production. This corresponds to 0.7 kg of water that has to be removed per kg of coffee ground pellets and 0.57 kg of water that has to be removed per kg of poultry litter pellets The energy consumption for the drying processes before the pellet production is estimated to be 3.78 MJ per kilogram water evaporated (Hässig-Schellhorn 2007). The basis of the drying process is the ecoinvent process “sawn timber, softwood, raw, kiln dried, u=10%, at plant, RER, m3”. The basis for the pellet production is the ecoinvent process “wood pellets, u=10%, at storehouse, RER, m3” (ecoinvent Centre 2010). There are two possibilities to produce the pellets. Either the pellets are produced in a factory using fossil fuels for the drying process or the pellets are produced on site using heat and waste heat from the combustion processes. In addition to the savings of fossil fuels the pellets do not have to be transported, if they are produced on site. These two scenarios for the pellet production are evaluated in section 4.3.3. The unit process raw data for pellet production is shown in Tab. 13.
Name
Loca
tion
Infr
astru
ctur
ePro
cess
Uni
t olive pomace, dried, at oil mill
Unc
erta
inty
Typ
e
Sta
nda
rdD
evia
tion9
5% GeneralComment
Location CY
InfrastructureProcess 0Unit kg
product olive pomace, dried, at oil mill CY 0 kg 1
technosphere heat, olive pomace, at boiler furnace, in oil mill CY 0 MJ 2.72E+0 1 1.33(1,3,2,1,3,5,BU:1.05); Own calculations: 3.78 MJ required for drying one kg water; 0.72 kg water removed from olive pomace

- 35 -
Tab. 13: Unit process raw data for the production o f coffee ground and poultry litter pellets
7.1.3. Preparation of the fuel-mixture Two of the biomasse substrates, namely horse dung and slurry solids, are mixed with wood or bark chips. These two biomass fuels have high moisture and the mixing with a dryer fuel is needed to guarantee an efficient combustion. The mixture horse dung and wood chips consists of 67 % horse dung and 33% wood chips (Bühler et al. 2005). This mixture has a lower heating value of 8.4 MJ/kg and bulk density of 315 kg/m3 (cf. Tab. 4 and Tab. 5). The mixture slurry solids and bark chips consists of 15.5% pig slurry solids and 84.5% bark chips (Hersener & Bühler 1998). This mixture has a lower heating value of 5.4 MJ/kg and bulk density of 300 kg/m3 (cf. Tab. 4 and Tab. 5).
Tab. 14: Unit process raw data for the mixtures “ho rse dung and wood chips” and “slurry solids and bar k chips”
7.2. Combustion of the biomass substrates Compared to the different combustion datasets of wood in the ecoinvent database, there is only little data available for the different biomass substrates. Especially the air emissions of the combustion are not
Name
Loc
atio
n
Infra
stru
ctur
ePro
cess
Un
it
coffee ground
pellets, at regional
storehouse
coffee ground pellets, on s ite
Unc
erta
inty
Typ
e
Sta
ndar
dDev
iatio
n95%
GeneralComment
poultry litter pellets, at regional
storehouse
poultry litter pellets, on
site
Unc
erta
inty
-Typ
e
Sta
ndar
d-D
evia
tion-
95%
GeneralComment
Location CH CH CH CHInfrastructureProcess 0 0 0 0
Unit m3 m3 m3 m3product coffee ground pellets, at regional storehouse CH 0 m3 1 0 0 0
poultry litter pellets, at regional storehouse CH 0 m3 0 0 1 0coffee ground pellets, on s ite CH 0 m3 0 1 0 0poultry litter pellets, on site CH 0 m3 0 0 0 1
technosphere electricity, medium voltage, at grid CH 0 kWh 1.64E+2 1.64E+2 1 1.33(1,3,3,3,3,5,BU:1.05); Based on ecoinvent dataset "wood pellets, u=10%, at storehouse, RER, [m3]"
1.64E+2 1.64E+2 1 1.33(1,3,3,3,3,5,BU:1.05); Based on ecoinvent dataset "wood pellets, u=10%, at storehouse, RER, [m3]"
heat, light fuel oil, at boiler 100kW, non-modulating
CH 0 MJ 1.72E+3 0 1 2.09
(4,5,2,3,3,5,BU:2); Own calculations: 3.78 MJ required for drying one kg water; bulk density coffee pellets 650 kg/m3; 0.7 kg water removed from coffee ground
1.00E+3 0 1 2.09
(4,5,2,3,3,5,BU:2); Own calculations: 3.78 MJ required for drying one kg water; bulk density poultry litter pellets 500 kg/m3; 0.57 kg water removed from poulty litter;
heat, coffee ground pellets, in wood furnace 25kW
CH 0 MJ 0 1.72E+3 1 2.09
(4,5,2,3,3,5,BU:2); Own calculations: 3.78 MJ required for drying one kg water; bulk density coffee pellets 650 kg/m3; 0.7 kg water removed from coffee ground
0 0 1 2.09
(4,5,2,3,3,5,BU:2); Own calculations: 3.78 MJ required for drying one kg water; bulk density poultry litter pellets 500 kg/m3; 0.57 kg water removed from poulty litter;
heat, poultry litter pellets, in rotating grate furnace 250-350kW
CH 0 MJ 0 0 1 2.09
(4,5,2,3,3,5,BU:2); Own calculations: 3.78 MJ required for drying one kg water; bulk density coffee pellets 650 kg/m3; 0.7 kg water removed from coffee ground
0 1.00E+3 1 2.09
(4,5,2,3,3,5,BU:2); Own calculations: 3.78 MJ required for drying one kg water; bulk density poultry litter pellets 500 kg/m3; 0.57 kg water removed from poulty litter;
transport, freight, rail RER 0 tkm 1.64E+2 0 1 2.09(4,5,na,na,na,na,BU:2); Based on ecoinvent dataset "wood pellets, u=10%, at storehouse, RER, [m3]"
1.64E+2 0 1 2.09(4,5,na,na,na,na,BU:2); Based on ecoinvent dataset "wood pellets, u=10%, at storehouse, RER, [m3]"
transport, lorry >16t, fleet average RER 0 tkm 3.58E+1 0 1 2.09(4,5,na,na,na,na,BU:2); Based on ecoinvent dataset "wood pellets, u=10%, at storehouse, RER, [m3]"
3.58E+1 0 1 2.09(4,5,na,na,na,na,BU:2); Based on ecoinvent dataset "wood pellets, u=10%, at storehouse, RER, [m3]"
technical wood drying, infrastructure RER 1 unit 1.83E-5 1.83E-5 1 3.36
(4,5,2,3,4,5,BU:3); Based on econinvent dataset "sawn timber, softwood, raw, kiln dried, u=10%, at plant, RER, [m3]"
1.83E-5 1.83E-5 1 3.36
(4,5,2,3,4,5,BU:3); Based on econinvent dataset "sawn timber, softwood, raw, kiln dried, u=10%, at plant, RER, [m3]"
wood pellet manufacturing, infrastructure RER 1 unit 1.00E-8 1.00E-8 1 3.36(4,5,2,3,4,5,BU:3); Based on ecoinvent dataset "wood pellets, u=10%, at storehouse, RER, [m3]"
1.00E-8 1.00E-8 1 3.36(4,5,2,3,4,5,BU:3); Based on ecoinvent dataset "wood pellets, u=10%, at storehouse, RER, [m3]"
emission air, unspecified
Heat, waste - - MJ 5.91E+2 5.91E+2 1 1.33(1,3,3,3,3,5,BU:1.05); Based on ecoinvent dataset "wood pellets, u=10%, at storehouse, RER, [m3]"
5.91E+2 5.91E+2 1 1.33(1,3,3,3,3,5,BU:1.05); Based on ecoinvent dataset "wood pellets, u=10%, at storehouse, RER, [m3]"
Name
Lo
catio
n
Infr
ast
ruct
ure
-Pro
cess
Un
it
horse dung and waste
wood chips, at farm
slurry solids and bark chips, at
farm
Un
cert
ain
tyT
ype
Sta
nd
ard
-De
via
tion
-9
5% GeneralComment
Location CH CHInfrastructureProcess 0 0
Unit m3 m3
product horse dung and waste wood chips, at farm CH 0 m3 1 0
slurry solids and bark chips, at farm CH 0 m3 0 1
technospherewaste wood chips, mixed, from industry, u=40%, at plant
CH 0 m3 3.30E-1 0 1 1.16E+0(1,4,2,1,1,4,BU:1.05); Composition: (Bühler et al., 2005)
bark chips, softwood, u=140%, at forest road RER 0 m3 0 8.45E-1 1 1.26E+0(1,4,4,1,1,4,BU:1.05); Composition: (Hersener et al., 1998)

- 36 -
sufficiently documented in literature. In order to estimate the undocumented emissions the ecoinvent data sets "logs, mixed, burned in wood heater 6kW, CH, MJ", "pellets, mixed, burned in furnace 15kW, CH, MJ”, “wood chips, from forest, mixed, burned in furnace 300kW, CH, MJ” and “wood chips, from forest, mixed, burned in furnace 1000kW” are used. The engine power is considered when completing the data sets. Tab. 15 shows the emission factors for air emissions from the combustion for all substrates. For the coffee ground pellets, the poultry litter pellets, the horse dung and the slurry solids there are only concentration measurements in the exhaust gas available. Based on these concentrations the total flux was calculated using the total volume of the exhaust gas derived from the elemental composition of the substrates.
Tab. 15: Emission factors for the air emissions of the different biomass substrates
Emission factors Olive pomace(1 Coffee ground
pellets(2
Poultry litter
pellets(3
Horse dung &
wood chips(4
Pig slurry solids
& bark chips(5
Unit kg/MJ kg/MJ kg/MJ kg/MJ kg/MJ
Carbon dioxide CO2 1.16E-01 1.21E-01 1.08E-01 2.09E-01 3.14E-01
Carbon monoxide CO 2.12E-03 5.55E-04 5.16E-06 9.10E-05 1.41E-04
Nitrogen oxides NOx als NO2 - 3.33E-04 1.35E-04 2.39E-04 6.67E-04
Sulphur oxide SO2 - - 4.17E-04 1.71E-04 6.50E-05
Hydrocarbons HC als C - - 1.88E-06 1.71E-05 -
Hydrogen chloride - - 4.83E-05 3.18E-05 2.11E-06
Ammonia NH3 - - - 7.96E-06 -
Ash 4.47E-03 1.59E-03 8.88E-03 5.50E-03 7.46E-03
Particulates TSP - 6.34E-05 1.61E-04 2.27E-04 9.92E-04
Particulates PM <2.5um - 5.70E-05 1.45E-04 2.05E-04 8.93E-04
Particulates PM 2.5 -10um - 3.17E-06 8.07E-06 1.14E-05 4.96E-05
Particulates PM >10um - 3.17E-06 8.07E-06 1.14E-05 4.96E-05
1) Jauhiainen et al. 2005 2) Waelti & Keller 2009 3) Salerno et al. 2001 4) Bühler et al. 2005 5) Hersener & Bühler 1998
If measurements of the emissions of the combustion are available these measurements are used. For the most important pollutants like particles, nitrogen oxides and sulphur oxides measurements are documented in literature. The figures for particles, NOx and SOx are missing for the combustion of olive pomace. For the coffee ground pellets only the SOx emissions are missing. In Tab. 16 and Tab. 17 the values taken from wood data sets are marked with a dark green. The unit process raw data for the combustion of olive pomace and coffee ground pellets are shown in Tab. 16 and the unit process raw data for the combustion of poultry litter pellets, horse dung and slurry solids are shown in Tab. 17. The air emissions for the combustion of olives are taken from Jauhiainen et al. (2005) and completed with the ecoinvent data set "logs, mixed, burned in wood heater 6kW, CH, MJ". The air emissions for the combustion of coffee ground pellets are taken from Waelti & Keller (2009) and completed with the ecoinvent data set "pellets, mixed, burned in furnace 15kW, CH, MJ". The air emissions for the combustion of poultry litter pellets are taken from Salerno et al. (2001) and completed with the ecoinvent data set “wood chips, from forest, mixed, burned in furnace 300kW, CH, MJ”. The air emissions for the combustion of horse dung are taken from Bühler et al. (2005) and completed with the ecoinvent data set “wood chips, from forest, mixed, burned in furnace 1000kW, CH, MJ”. The air emissions for the combustion of slurry solids are taken from Hersener & Bühler (1998) and completed with the ecoinvent data set “wood chips, from forest, mixed, burned in furnace 1000kW, CH, MJ”.

- 37 -
Tab. 16: Unit process raw data for the combustion o f olive pomace and coffee ground pellets
Name
Loc
atio
n
Infra
stru
ctu
reP
roce
ss
Uni
t
olive pomace, burned in boiler
furnace, at oil mill
Un
cert
ain
tyT
ype
Sta
nda
rdD
evia
tion9
5%
GeneralComment
coffee ground pellets, burned in wood furnace
25kW
Unc
erta
inty
-Typ
e
Sta
ndar
d-D
evia
tion-
95%
GeneralComment
Location CY Legende CH LegendeInfrastructureProcess 0 taken from ecoinvent data sets for combustion of wood 0 taken from ecoinvent data sets for combustion of wood
Unit MJ taken from literature MJ taken from literatureproduct olive pomace, burned in boiler furnace, at oil mill CY 0 MJ 1 0
coffee ground pellets, burned in wood furnace 25kW CH 0 MJ 0 1
technosphere olive pomace, dried, at oil mill CY 0 kg 6.74E-2 1 1.26(1,4,2,1,3,4,BU:1.05); heating value dry base: 17.8 MJ/kg, Jauhiainen et al. 2005
0 1 1.26 (1,4,2,1,3,4,BU:1.05);
coffee ground pellets, at regional s torehouse CH 0 m3 0 1 1.26 (1,4,1,1,3,4,BU:1.05); 8.84E-5 1 1.26
(1,4,1,1,3,4,BU:1.05); density: 650 kg/m3, assumed to be equal to wood pellets; LHW 17.3 MJ/kg, Prüfbericht 544946, SGS Institut Fresenius, 2008
furnace, pellets, 15kW CH 1 unit 0 1 3.34 (1,4,4,5,4,5,BU:3); uncertainty on lifetime 4.82E-7 1 3.34 (1,4,4,5,4,5,BU:3); uncertainty on lifetimefurnace, logs, mixed, 6kW CH 1 unit 1.74E-6 1 3.34 (1,4,4,5,4,5,BU:3); uncertainty on lifetime 0 1 3.34 (1,4,4,5,4,5,BU:3); uncertainty on lifetime
disposal, ash olive pomace, to landfarming CY 0 kg 2.23E-3 1 1.60(1,4,3,1,4,5,BU:1.05); Elemental composition: tab. 1, Jauhiainen et al. 2005
0 1 1.60 (1,4,3,1,4,5,BU:1.05);
disposal, ash olive pomace, to municipal incineration CH 0 kg 2.23E-3 1 1.60(1,4,3,1,4,5,BU:1.05); Elemental composition: tab. 1, Jauhiainen et al. 2005
0 1 1.60 (1,4,3,1,4,5,BU:1.05);
disposal, ash olive pomace, to sanitary landfil l CH 0 kg 0 1 1.60(1,4,3,1,4,5,BU:1.05); Elemental composition: tab. 1, Jauhiainen et al. 2005
0 1 1.60 (1,4,3,1,4,5,BU:1.05);
disposal, ash coffee ground pellets, to landfarming CH 0 kg 0 1 1.60 (1,4,3,1,4,5,BU:1.05); 7.97E-4 1 1.60(1,4,3,1,4,5,BU:1.05); Ash content: Prüfbericht 544946, SGS Institut Fresenius, 2008
disposal, ash coffee ground pellets, to municipal incineration CH 0 kg 0 1 1.60 (1,4,3,1,4,5,BU:1.05); 7.97E-4 1 1.60(1,4,3,1,4,5,BU:1.05); Ash content: Prüfbericht 544946, SGS Institut Fresenius, 2008
disposal, ash coffee ground pellets, to sanitary landfi ll CH 0 kg 0 1 1.60 (1,4,3,1,4,5,BU:1.05); 0 1 1.60(1,4,3,1,4,5,BU:1.05); Ash content: Prüfbericht 544946, SGS Institut Fresenius, 2008
electricity, low voltage, at grid CH 0 kWh 0 1 1.65 (1,4,4,5,4,5,BU:1.05); general assumption 4.17E-3 1 1.65 (1,4,4,5,4,5,BU:1.05); general assumptiontransport, tractor and trailer CH 0 tkm 6.44E-4 1 2.35 (1,4,4,5,4,5,BU:2); general assumption 0 1 2.35 (1,4,4,5,4,5,BU:2); general assumptiontransport, lorry 20-28t, fleet average CH 0 tkm 0 1 2.35 (1,4,4,5,4,5,BU:2); general assumption 5.87E-3 1 2.35 (1,4,4,5,4,5,BU:2); general assumption
emission air, high population density
Acetaldehyde - - kg 6.10E-8 1 1.90(1,4,4,5,4,5,BU:1.5); extrapolation, based on measuring data of other emissions
6.10E-8 1 1.90(1,4,4,5,4,5,BU:1.5); extrapolation, based on measuring data of other emissions
Ammonia - - kg 1.73E-6 1 1.70(1,4,4,5,4,5,BU:1.2); extrapolation, based on measuring data of other emissions
1.73E-6 1 1.70(1,4,4,5,4,5,BU:1.2); extrapolation, based on measuring data of other emissions
Anthracene - - kg 4.72E-6 1 3.02(1,4,2,2,1,3,BU:3); Emissions to air from tab. 2, Jauhiainen et al. 2005
0 1 3.02(1,4,2,2,1,3,BU:3); Emissions to air from tab. 2, Wälti & Keller, 2009
Arsenic - - kg 1.00E-9 1 5.39(1,4,4,5,4,5,BU:5); extrapolation, based on measuring data of other emissions
1.00E-9 1 5.39(1,4,4,5,4,5,BU:5); extrapolation, based on measuring data of other emissions
Benzene - - kg 1.89E-5 1 3.02(1,4,2,2,1,3,BU:3); Emissions to air from tab. 2, Jauhiainen et al. 2005
9.10E-7 1 3.02(1,4,2,2,1,3,BU:3); Emissions to air from tab. 2, Wälti & Keller, 2009
Benzene, ethyl- - - kg 3.00E-8 1 3.34(1,4,4,5,4,5,BU:3); extrapolation, based on measuring data of other emissions
3.00E-8 1 3.34(1,4,4,5,4,5,BU:3); extrapolation, based on measuring data of other emissions
Benzene, hexachloro- - - kg 7.20E-15 1 3.34(1,4,4,5,4,5,BU:3); extrapolation, based on measuring data of other emissions
7.20E-15 1 3.34(1,4,4,5,4,5,BU:3); extrapolation, based on measuring data of other emissions
Benzo(a)pyrene - - kg 5.00E-10 1 3.34(1,4,4,5,4,5,BU:3); extrapolation, based on measuring data of other emissions
5.00E-10 1 3.34(1,4,4,5,4,5,BU:3); extrapolation, based on measuring data of other emissions
Bromine - - kg 6.00E-8 1 5.39(1,4,4,5,4,5,BU:5); extrapolation, based on measuring data of other emissions
6.00E-8 1 5.39(1,4,4,5,4,5,BU:5); extrapolation, based on measuring data of other emissions
Butadiene - - kg 4.79E-6 1 1.52(1,4,2,2,1,3,BU:1.5); Emissions to air from tab. 2, Jauhiainen et al. 2005
0 1 1.52(1,4,2,2,1,3,BU:1.5); Emissions to air from tab. 2, Wälti & Keller, 2009
Cadmium - - kg 7.00E-10 1 5.39(1,4,4,5,4,5,BU:5); extrapolation, based on measuring data of other emissions
7.00E-10 1 5.39(1,4,4,5,4,5,BU:5); extrapolation, based on measuring data of other emissions
Calcium - - kg 5.85E-6 1 5.39(1,4,4,5,4,5,BU:5); extrapolation, based on measuring data of other emissions
5.85E-6 1 5.39(1,4,4,5,4,5,BU:5); extrapolation, based on measuring data of other emissions
Carbon dioxide, biogenic - - kg 9.78E-2 1 1.13(1,4,2,2,1,3,BU:1.05); Emissions to air from tab. 2, Jauhiainen et al. 2005
1.21E-1 1 1.13(1,4,2,2,1,3,BU:1.05); Emissions to air from tab. 2, Wälti & Keller, 2009
Carbon monoxide, biogenic - - kg 2.12E-3 1 5.02(1,4,2,2,1,3,BU:5); Emissions to air from tab. 2, Jauhiainen et al. 2005
5.55E-4 1 5.02(1,4,2,2,1,3,BU:5); Emissions to air from tab. 2, Wälti & Keller, 2009
Chlorine - - kg 1.80E-7 1 1.90(1,4,4,5,4,5,BU:1.5); extrapolation, based on measuring data of other emissions
1.80E-7 1 1.90(1,4,4,5,4,5,BU:1.5); extrapolation, based on measuring data of other emissions
Chromium - - kg 3.96E-9 1 5.39(1,4,4,5,4,5,BU:5); extrapolation, based on measuring data of other emissions
3.96E-9 1 5.39(1,4,4,5,4,5,BU:5); extrapolation, based on measuring data of other emissions
Chromium VI - - kg 4.00E-11 1 5.39 (1,4,4,5,4,5,BU:5); range of data 4.00E-11 1 5.39 (1,4,4,5,4,5,BU:5); range of data
Copper - - kg 2.20E-8 1 5.39(1,4,4,5,4,5,BU:5); extrapolation, based on measuring data of other emissions
2.20E-8 1 5.39(1,4,4,5,4,5,BU:5); extrapolation, based on measuring data of other emissions
Dinitrogen monoxide - - kg 7.00E-6 1 1.90(1,4,4,5,4,5,BU:1.5); extrapolation, based on measuring data of other emissions
3.00E-6 1 1.90(1,4,4,5,4,5,BU:1.5); extrapolation, based on measuring data of other emissions
Dioxins, measured as 2,3,7,8-tetrachlorodibenzo-p-dioxin - - kg 3.10E-14 1 3.34(1,4,4,5,4,5,BU:3); extrapolation, based on measuring data of other emissions
3.10E-14 1 3.34(1,4,4,5,4,5,BU:3); extrapolation, based on measuring data of other emissions
Ethane - - kg 1.02E-5 1 1.52(1,4,2,2,1,3,BU:1.5); Emissions to air from tab. 2, Jauhiainen et al. 2005
0 1 1.52(1,4,2,2,1,3,BU:1.5); Emissions to air from tab. 2, Wälti & Keller, 2009
Ethene - - kg 2.27E-4 1 1.52(1,4,2,2,1,3,BU:1.5); Emissions to air from tab. 2, Jauhiainen et al. 2005
0 1 1.52(1,4,2,2,1,3,BU:1.5); Emissions to air from tab. 2, Wälti & Keller, 2009
Ethyne - - kg 7.20E-5 1 1.52(1,4,2,2,1,3,BU:1.5); Emissions to air from tab. 2, Jauhiainen et al. 2005
0 1 1.52(1,4,2,2,1,3,BU:1.5); Emissions to air from tab. 2, Wälti & Keller, 2009
Fluorine - - kg 5.00E-8 1 1.90(1,4,4,5,4,5,BU:1.5); extrapolation, based on measuring data of other emissions
5.00E-8 1 1.90(1,4,4,5,4,5,BU:1.5); extrapolation, based on measuring data of other emissions
Formaldehyde - - kg 1.30E-7 1 1.90(1,4,4,5,4,5,BU:1.5); extrapolation, based on measuring data of other emissions
1.30E-7 1 1.90(1,4,4,5,4,5,BU:1.5); extrapolation, based on measuring data of other emissions
Heat, waste - - MJ 1.07E+0 1 1.65 (1,4,4,5,4,5,BU:1.05); s tandard for resources 1.08E+0 1 1.65 (1,4,4,5,4,5,BU:1.05); s tandard for resources
Hexane - - kg 4.92E-6 1 1.52(1,4,2,2,1,3,BU:1.5); Emissions to air from tab. 2, Jauhiainen et al. 2005
0 1 1.52(1,4,2,2,1,3,BU:1.5); Emissions to air from tab. 2, Wälti & Keller, 2009
Hydrocarbons, aliphatic, alkanes, unspecified - - kg 9.10E-7 1 1.90(1,4,4,5,4,5,BU:1.5); extrapolation, based on measuring data of other emissions
9.10E-7 1 1.90(1,4,4,5,4,5,BU:1.5); extrapolation, based on measuring data of other emissions
Hydrocarbons, aliphatic, unsaturated - - kg3.10E-6 1 1.90
(1,4,4,5,4,5,BU:1.5); extrapolation, based on measuring data of other emissions
3.10E-61 1.90 (1,4,4,5,4,5,BU:1.5); extrapolation, based on
measuring data of other emissions
Lead - - kg 2.50E-8 1 5.39(1,4,4,5,4,5,BU:5); extrapolation, based on measuring data of other emissions
2.50E-8 1 5.39(1,4,4,5,4,5,BU:5); extrapolation, based on measuring data of other emissions
Magnesium - - kg 3.60E-7 1 5.39(1,4,4,5,4,5,BU:5); extrapolation, based on measuring data of other emissions
3.60E-7 1 5.39(1,4,4,5,4,5,BU:5); extrapolation, based on measuring data of other emissions
Manganese - - kg 1.70E-7 1 5.39(1,4,4,5,4,5,BU:5); extrapolation, based on measuring data of other emissions
1.70E-7 1 5.39(1,4,4,5,4,5,BU:5); extrapolation, based on measuring data of other emissions
Mercury - - kg 3.00E-10 1 5.39(1,4,4,5,4,5,BU:5); extrapolation, based on measuring data of other emissions
3.00E-10 1 5.39(1,4,4,5,4,5,BU:5); extrapolation, based on measuring data of other emissions
Methane, biogenic - - kg 2.66E-4 1 1.52(1,4,2,2,1,3,BU:1.5); Emissions to air from tab. 2, Jauhiainen et al. 2005
4.00E-7 1 1.52(1,4,2,2,1,3,BU:1.5); extrapolation, based on measuring data of other emissions
m-Xylene - - kg 1.20E-7 1 1.90(1,4,4,5,4,5,BU:1.5); extrapolation, based on measuring data of other emissions
1.20E-7 1 1.90(1,4,4,5,4,5,BU:1.5); extrapolation, based on measuring data of other emissions
Naphthalene - - kg 2.42E-5 1 3.02(1,4,2,2,1,3,BU:3); Emissions to air from tab. 2, Jauhiainen et al. 2005
0 1 3.02(1,4,2,2,1,3,BU:3); extrapolation, based on measuring data of other emissions
Nickel - - kg 6.00E-9 1 5.39(1,4,4,5,4,5,BU:5); extrapolation, based on measuring data of other emissions
6.00E-9 1 5.39(1,4,4,5,4,5,BU:5); extrapolation, based on measuring data of other emissions
Nitrogen oxides - - kg 1.60E-4 1 1.52 (1,4,2,2,1,3,BU:1.5); range of measuring data 3.33E-4 1 1.52(1,4,2,2,1,3,BU:1.5); Emissions to air from tab. 2, Wälti & Keller, 2009
NMVOC, non-methane volatile organic compounds, unspecified origin
- - kg 9.70E-6 1 1.52 (1,4,2,2,1,3,BU:1.5); range of measuring data 2.30E-6 1 1.52 (1,4,2,2,1,3,BU:1.5); range of measuring data
PAH, polycyclic aromatic hydrocarbons - - kg 1.11E-8 1 3.34(1,4,4,5,4,5,BU:3); extrapolation, based on measuring data of other emissions
1.11E-8 1 3.34(1,4,4,5,4,5,BU:3); extrapolation, based on measuring data of other emissions
Particulates, < 2.5 um - - kg 1.17E-4 1 3.34 (1,4,4,5,4,5,BU:3); taken from wood data set 5.70E-5 1 3.34(1,4,4,5,4,5,BU:3); Emissions to air from tab. 2, Wälti & Keller, 2009
Particulates, > 2.5 um, and < 10um - - kg 0 1 2.35 (1,4,4,5,4,5,BU:2); taken from wood data set 3.17E-6 1 2.35(1,4,4,5,4,5,BU:2); Emissions to air from tab. 2, Wälti & Keller, 2009
Particulates, > 10 um - - kg 0 1 1.90 (1,4,4,5,4,5,BU:1.5); taken from wood data set 3.17E-6 1 1.90(1,4,4,5,4,5,BU:1.5); Emissions to air from tab. 2, Wälti & Keller, 2009
Phenol, pentachloro- - - kg 8.10E-12 1 1.90(1,4,4,5,4,5,BU:1.5); extrapolation, based on measuring data of other emissions
8.10E-12 1 1.90(1,4,4,5,4,5,BU:1.5); extrapolation, based on measuring data of other emissions
Phosphorus - - kg 3.00E-7 1 1.90(1,4,4,5,4,5,BU:1.5); extrapolation, based on measuring data of other emissions
3.00E-7 1 1.90(1,4,4,5,4,5,BU:1.5); extrapolation, based on measuring data of other emissions
Potassium - - kg 2.34E-5 1 5.39(1,4,4,5,4,5,BU:5); extrapolation, based on measuring data of other emissions
2.34E-5 1 5.39(1,4,4,5,4,5,BU:5); extrapolation, based on measuring data of other emissions
Propene - - kg 4.79E-6 1 1.52(1,4,2,2,1,3,BU:1.5); Emissions to air from tab. 2, Jauhiainen et al. 2005
0 1 1.52(1,4,2,2,1,3,BU:1.5); Emissions to air from tab. 2, Wälti & Keller, 2009
Sodium - - kg 1.30E-6 1 5.39(1,4,4,5,4,5,BU:5); extrapolation, based on measuring data of other emissions
1.30E-6 1 5.39(1,4,4,5,4,5,BU:5); extrapolation, based on measuring data of other emissions
Sulfur dioxide - - kg 2.50E-6 1 1.65(1,4,4,5,4,5,BU:1.05); extrapolation, based on measuring data of other emissions
2.50E-6 1 1.65(1,4,4,5,4,5,BU:1.05); extrapolation, based on measuring data of other emissions
Toluene - - kg 3.00E-7 1 1.90(1,4,4,5,4,5,BU:1.5); extrapolation, based on measuring data of other emissions
3.00E-7 1 1.90(1,4,4,5,4,5,BU:1.5); extrapolation, based on measuring data of other emissions
Zinc - - kg 3.00E-7 1 5.39(1,4,4,5,4,5,BU:5); extrapolation, based on measuring data of other emissions
3.00E-7 1 5.39(1,4,4,5,4,5,BU:5); extrapolation, based on measuring data of other emissions

- 38 -
Tab. 17: Unit process raw data for the combustion of poultry litter pellets and the fuel mixtures “ho rse dung and wood chips” and “slur-
ry solids and bark chips”
Name
Lo
catio
n
Infr
ast
ruct
ure
Pro
cess
Un
it
poultry litter pellets, burned in rotating grate
furnace 250-350kW U
nce
rta
inty
Typ
e
Sta
nd
ard
De
via
tion
95
%
GeneralComment
horse dung and waste wood
chips, burned in grate furnace 500-600kW U
nce
rta
inty
Typ
e
Sta
nd
ard
De
via
tion
95
%
GeneralComment
slurry solids and bark chips,
burned in bark furnace 1MW
Un
cert
ain
tyT
ype
Sta
nd
ard
De
via
tion
95
%
GeneralComment
Location CH Legende CH Legende CH Legende
InfrastructureProcess 0 taken from ecoinvent data sets for wood com bustion 0 taken from ecoinvent data sets for wood combustion 0 taken from ecoinvent data sets for wood combustionUnit MJ taken from literature MJ taken from literature MJ taken from literature
productpoultry litter pellets, burned in rotating grate furnace 250-350kW
CH 0 MJ 1 0 0
horse dung and waste wood chips, burned in grate furnace 500-600kW
CH 0 MJ 0 1 0
slurry solids and bark chips, burned in bark furnace 1MW CH 0 MJ 0 0 1
technosphere electricity, low voltage, at grid CH 0 kWh 4.17E-3 1 1.60 (1,4,3,1,4,5,BU:1.05); general assum ption 4.17E-3 1 1.60 (1,4,3,1,4,5,BU:1.05); general assumption 4.17E-3 1 1.60 (1,4,3,1,4,5,BU:1.05); general assumption
poultry litter pellets, at regional storehouse CH 0 m3 1.47E-4 1 1.26(1,4,2,1,3,4,BU:1.05); bulk density: 500 kg/m 3, estimated; LHW 13.5 MJ/kg, APOLLO II, Salerno et al., 2001
0 1 1.26 (1,4,2,1,3,4,BU:1.05); 0 1 1.26 (1,4,2,1,3,4,BU:1.05);
poultry litter pellets, on si te CH 0 m3 0 1 1.26(1,4,2,1,3,4,BU:1.05); bulk density: 500 kg/m 3, estimated; LHW 13.5 MJ/kg, APOLLO II, Salerno et al., 2001
0 1 1.26 (1,4,2,1,3,4,BU:1.05); 0 1 1.26 (1,4,2,1,3,4,BU:1.05);
horse dung and waste wood chips, at farm CH 0 m3 0 1 1.26 (1,4,1,1,3,4,BU:1.05); 3.64E-4 1 1.26
(1,4,1,1,3,4,BU:1.05); heating value: 8.61 MJ/kg; Tab.1 Thermische Nutzung von anspruchsvollen Biomassebrennstoffen, Bühler et al. 2005
0 1 1.26 (1,4,1,1,3,4,BU:1.05);
slurry solids and bark chips, at farm CH 0 m3 0 1 1.26 (1,4,1,1,3,4,BU:1.05); 0 1 1.26 (1,4,1,1,3,4,BU:1.05); 6.13E-4 1 1.26
(1,4,1,1,3,4,BU:1.05); heating value pig slurry: 17.8 MJ/kg atro; Tab 7: Energetische Nutzung landwirtschaftlicher Biomasse, Hersener & Bühler, 1998
disposal, ash poultry litter pellets, to landfarming CH 0 kg 2.22E-3 1 1.60(1,4,3,1,4,5,BU:1.05); Emissions: Tab. 3.5.1.1: APOLLO II Schlussbericht, Salerno et al., 2001
0 1 1.60 (1,4,3,1,4,5,BU:1.05); 0 1 1.595 (1,4,3,1,4,5,BU:1.05);
disposal, ash horse dung and waste wood chips, to landfarming
CH 0 kg 0 1 1.60 (1,4,3,1,4,5,BU:1.05); 1.37E-3 1 1.60
(1,4,3,1,4,5,BU:1.05); Emissions horse dung: Tab. 1+2 Thermische Nutzung von anspruchsvollen Biomassebrennstoffen, Bühler et al. 2005
0 1 1.595 (1,4,3,1,4,5,BU:1.05);
disposal, ash slurry solids and bark chips, to landfarming CH 0 kg 0 1 1.60 (1,4,3,1,4,5,BU:1.05); 0 1 1.60 (1,4,3,1,4,5,BU:1.05); 1.87E-3 1 1.60
(1,4,3,1,4,5,BU:1.05); Emissions pig slurry: Tab.7+8: Energetische Nutzung landwirtschaftlicher Biomasse, Hersener & Bühler, 1998
disposal, ash poultry litter pellets, to municipal incineration
CH 0 kg 2.22E-3 1 1.60(1,4,3,1,4,5,BU:1.05); Emissions: Tab. 3.5.1.1: APOLLO II Schlussbericht, Salerno et al., 2001
0 1 1.60 (1,4,3,1,4,5,BU:1.05); 0 1 1.595 (1,4,3,1,4,5,BU:1.05);
disposal, ash horse dung and wood chips, to municipal incineration
CH 0 kg 0 1 1.60 (1,4,3,1,4,5,BU:1.05); 1.37E-3 1 1.60
(1,4,3,1,4,5,BU:1.05); Emissions horse dung: Tab. 1+2 Thermische Nutzung von anspruchsvollen Biomassebrennstoffen, Bühler et al. 2005
0 1 1.595 (1,4,3,1,4,5,BU:1.05);
disposal, ash slurry solids and bark chips, to municipal incineration
CH 0 kg 0 1 1.60 (1,4,3,1,4,5,BU:1.05); 0 1 1.60 (1,4,3,1,4,5,BU:1.05); 1.87E-3 1 1.60
(1,4,3,1,4,5,BU:1.05); Emissions pig slurry: Tab.7+8: Energetische Nutzung landwirtschaftlicher Biomasse, Hersener & Bühler, 1998
disposal, ash poultry litter pellets, to sanitary landfill CH 0 kg 4.44E-3 1 1.60(1,4,3,1,4,5,BU:1.05); Emissions: Tab. 3.5.1.1: APOLLO II Schlussbericht, Salerno et al., 2001
0 1 1.60 (1,4,3,1,4,5,BU:1.05); 0 1 1.595 (1,4,3,1,4,5,BU:1.05);
disposal, ash horse dung and wood chips, to sanitary landfill
CH 0 kg 0 1 1.60 (1,4,3,1,4,5,BU:1.05); 2.75E-3 1 1.60
(1,4,3,1,4,5,BU:1.05); Emissions horse dung: Tab. 1+2 Thermische Nutzung von anspruchsvollen Biomassebrennstoffen, Bühler et al. 2005
0 1 1.595 (1,4,3,1,4,5,BU:1.05);
disposal, ash slurry solids and bark chips, to sanitary landfill
CH 0 kg 0 1 1.60 (1,4,3,1,4,5,BU:1.05); 0 1 1.60 (1,4,3,1,4,5,BU:1.05); 3.73E-3 1 1.60
(1,4,3,1,4,5,BU:1.05); Emissions pig slurry: Tab.7+8: Energetische Nutzung landwirtschaftlicher Biomasse, Hersener & Bühler, 1998
disposal, wood ash mixture, pure, 0% water, to municipal incineration
CH 0 kg 0 1 1.60 (1,4,3,1,4,5,BU:1.05); homogeneous fuel 0 1 1.60 (1,4,3,1,4,5,BU:1.05); homogeneous fuel 0 1 1.60 (1,4,3,1,4,5,BU:1.05); homogeneous fuel
disposal, wood ash mixture, pure, 0% water, to landfarming
CH 0 kg 0 1 1.60 (1,4,3,1,4,5,BU:1.05); homogeneous fuel 0 1 1.60 (1,4,3,1,4,5,BU:1.05); homogeneous fuel 0 1 1.60 (1,4,3,1,4,5,BU:1.05); homogeneous fuel
disposal, wood ash mixture, pure, 0% water, to sanitary landfill
CH 0 kg 0 1 1.60 (1,4,3,1,4,5,BU:1.05); homogeneous fuel 0 1 1.60 (1,4,3,1,4,5,BU:1.05); homogeneous fuel 0 1 1.60 (1,4,3,1,4,5,BU:1.05); homogeneous fuel
transport, lorry 20-28t, fleet average CH 0 tkm 2.52E-3 1 2.30 (1,4,3,1,4,5,BU:2); general assumption 3.77E-3 1 2.30 (1,4,3,1,4,5,BU:2); general assumption 3.77E-3 1 2.30 (1,4,3,1,4,5,BU:2); general ass umptionfurnace, wood chips, mixed, 1000kW CH 1 unit 0 1 3.30 (1,4,3,1,4,5,BU:3); uncertainty on lifetime 5.62E-9 1 3.30 (1,4,3,1,4,5,BU:3); uncertainty on lifetime 5.62E-9 1 3.30 (1,4,3,1,4,5,BU:3); uncertainty on lifetimefurnace, wood chips, mixed, 300kW CH 1 unit 1.81E-8 1 3.30 (1,4,3,1,4,5,BU:3); uncertainty on lifetime 0 1 3.30 (1,4,3,1,4,5,BU:3); uncertainty on lifetime 0 1 3.30 (1,4,3,1,4,5,BU:3); uncertainty on lifetime
emission air, h igh population density
Acetaldehyde - - kg 6.10E-8 1 1.79(1,4,2,2,4,3,BU:1.5); extrapolation, based on m easuring data of other emissions
6.10E-8 1 1.79(1,4,2,2,4,3,BU:1.5); extrapolation, based on measuring data of other emissions
6.10E-8 1 1.79(1,4,2,2,4,3,BU:1.5); extrapolation, based on measuring data of other emiss ions
Ammonia - - kg 1.73E-6 1 1.24 (1,4,2,2,1,3,BU:1.2); 7.96E-6 1 1.24
(1,4,2,2,1,3,BU:1.2); Emissions horse dung: Tab. 1+2 Thermische Nutzung von anspruchsvollen Biomassebrennstoffen, Bühler et al. 2005
1.73E-6 1 1.24 (1,4,2,2,1,3,BU:1.2);
Arsenic - - kg 1.00E-9 1 5.28(1,4,2,2,4,3,BU:5); extrapolation, bas ed on meas uring data of other emissions
1.00E-9 1 5.28(1,4,2,2,4,3,BU:5); extrapolation, based on measuring data of other emissions
1.00E-9 1 5.28(1,4,2,2,4,3,BU:5); extrapolation, based on measuring data of other emiss ions
Benzene - - kg 9.10E-7 1 3.24(1,4,2,2,4,3,BU:3); extrapolation, bas ed on meas uring data of other emissions
9.10E-7 1 3.24(1,4,2,2,4,3,BU:3); extrapolation, based on measuring data of other emissions
9.10E-7 1 3.24(1,4,2,2,4,3,BU:3); extrapolation, based on measuring data of other emiss ions
Benzene, ethyl- - - kg 3.00E-8 1 3.24(1,4,2,2,4,3,BU:3); extrapolation, bas ed on meas uring data of other emissions
3.00E-8 1 3.24(1,4,2,2,4,3,BU:3); extrapolation, based on measuring data of other emissions
3.00E-8 1 3.24(1,4,2,2,4,3,BU:3); extrapolation, based on measuring data of other emiss ions
Benzene, hexachloro- - - kg 7.20E-15 1 3.24(1,4,2,2,4,3,BU:3); extrapolation, bas ed on meas uring data of other emissions
7.20E-15 1 3.24(1,4,2,2,4,3,BU:3); extrapolation, based on measuring data of other emissions
7.20E-15 1 3.24(1,4,2,2,4,3,BU:3); extrapolation, based on measuring data of other emiss ions
Benzo(a)pyrene - - kg 5.00E-10 1 3.24(1,4,2,2,4,3,BU:3); extrapolation, bas ed on meas uring data of other emissions
5.00E-10 1 3.24(1,4,2,2,4,3,BU:3); extrapolation, based on measuring data of other emissions
5.00E-10 1 3.24(1,4,2,2,4,3,BU:3); extrapolation, based on measuring data of other emiss ions
Bromine - - kg 6.00E-8 1 5.28(1,4,2,2,4,3,BU:5); extrapolation, bas ed on meas uring data of other emissions
6.00E-8 1 5.28(1,4,2,2,4,3,BU:5); extrapolation, based on measuring data of other emissions
6.00E-8 1 5.28(1,4,2,2,4,3,BU:5); extrapolation, based on measuring data of other emiss ions
Cadmium - - kg 7.00E-10 1 5.28(1,4,2,2,4,3,BU:5); extrapolation, bas ed on meas uring data of other emissions
7.00E-10 1 5.28(1,4,2,2,4,3,BU:5); extrapolation, based on measuring data of other emissions
7.00E-10 1 5.28(1,4,2,2,4,3,BU:5); extrapolation, based on measuring data of other emiss ions
Calcium - - kg 5.85E-6 1 5.28(1,4,2,2,4,3,BU:5); extrapolation, bas ed on meas uring data of other emissions
5.85E-6 1 5.28(1,4,2,2,4,3,BU:5); extrapolation, based on measuring data of other emissions
5.85E-6 1 5.28(1,4,2,2,4,3,BU:5); extrapolation, based on measuring data of other emiss ions
Carbon dioxide, biogenic - - kg 1.08E-1 1 1.13(1,4,2,2,1,3,BU:1.05); Emissions: Tab. 3.5.1.1: APOLLO II Schlussbericht, Salerno et al., 2001
2.09E-1 1 1.13
(1,4,2,2,1,3,BU:1.05); Emissions horse dung: Tab. 1+2 Thermische Nutzung von anspruchsvollen Biomassebrennstoffen, Bühler et al. 2005
3.14E-1 1 1.13
(1,4,2,2,1,3,BU:1.05); Emissions pig slurry: Tab.7+8: Energetische Nutzung landwirtschaftlicher Biomasse, Hersener & Bühler, 1998
Carbon monoxide, biogenic - - kg 5.16E-6 1 5.02(1,4,2,2,1,3,BU:5); Emissions: Tab. 3.5.1.1: APOLLO II Schlussbericht, Salerno et al., 2001
9.10E-5 1 5.02(1,4,2,2,1,3,BU:5); Emissions horse dung: Tab. 1+2 Thermische Nutzung von anspruchsvollen Biomassebrennstoffen, Bühler et al. 2005
1.41E-4 1 5.02
(1,4,2,2,1,3,BU:5); Emissions pig slurry: Tab.7+8: Energetische Nutzung landwirtschaftlicher Biomasse, Hersener & Bühler, 1998
Chlorine - - kg 1.80E-7 1 1.79(1,4,2,2,4,3,BU:1.5); extrapolation, based on m easuring data of other emissions
1.80E-7 1 1.79(1,4,2,2,4,3,BU:1.5); extrapolation, based on measuring data of other emissions
1.80E-7 1 1.79(1,4,2,2,4,3,BU:1.5); extrapolation, based on measuring data of other emiss ions
Chromium - - kg 3.96E-9 1 5.28(1,4,2,2,4,3,BU:5); extrapolation, bas ed on meas uring data of other emissions
3.96E-9 1 5.28(1,4,2,2,4,3,BU:5); extrapolation, based on measuring data of other emissions
3.96E-9 1 5.28(1,4,2,2,4,3,BU:5); extrapolation, based on measuring data of other emiss ions
Chromium VI - - kg 4.00E-11 1 5.28 (1,4,2,2,4,3,BU:5); range of data 4.00E-11 1 5.28 (1,4,2,2,4,3,BU:5); range of data 4.00E-11 1 5.28 (1,4,2,2,4,3,BU:5); range of data
Copper - - kg 2.20E-8 1 5.28(1,4,2,2,4,3,BU:5); extrapolation, bas ed on meas uring data of other emissions
2.20E-8 1 5.28(1,4,2,2,4,3,BU:5); extrapolation, based on measuring data of other emissions
2.20E-8 1 5.28(1,4,2,2,4,3,BU:5); extrapolation, based on measuring data of other emiss ions
Dinitrogen monoxide - - kg 2.50E-6 1 1.79(1,4,2,2,4,3,BU:1.5); extrapolation, based on m easuring data of other emissions
2.30E-6 1 1.79(1,4,2,2,4,3,BU:1.5); extrapolation, based on measuring data of other emissions
2.30E-6 1 1.79(1,4,2,2,4,3,BU:1.5); extrapolation, based on measuring data of other emiss ions
Dioxins, measured as 2,3,7,8-tetrachlorodibenzo-p-dioxin - - kg 3.10E-14 1 3.24(1,4,2,2,4,3,BU:3); extrapolation, bas ed on meas uring data of other emissions
3.10E-14 1 3.24(1,4,2,2,4,3,BU:3); extrapolation, based on measuring data of other emissions
3.10E-14 1 3.24(1,4,2,2,4,3,BU:3); extrapolation, based on measuring data of other emiss ions
Fluorine - - kg 5.00E-8 1 1.79(1,4,2,2,4,3,BU:1.5); extrapolation, based on m easuring data of other emissions
5.00E-8 1 1.79(1,4,2,2,4,3,BU:1.5); extrapolation, based on measuring data of other emissions
5.00E-8 1 1.79(1,4,2,2,4,3,BU:1.5); extrapolation, based on measuring data of other emiss ions
Formaldehyde - - kg 1.30E-7 1 1.79(1,4,2,2,4,3,BU:1.5); extrapolation, based on m easuring data of other emissions
1.30E-7 1 1.79(1,4,2,2,4,3,BU:1.5); extrapolation, based on measuring data of other emissions
1.30E-7 1 1.79(1,4,2,2,4,3,BU:1.5); extrapolation, based on measuring data of other emiss ions
Heat, waste - - MJ 1.08E+0 1 1.53(1,4,2,2,4,3,BU:1.05); standard for resources
1.08E+0 1 1.53 (1,4,2,2,4,3,BU:1.05); standard for resources 1.08E+0 1 1.53 (1,4,2,2,4,3,BU:1.05); standard for resources
Hydrocarbons, aliphatic, alkanes, unspecified - - kg 1.88E-6 1 1.52(1,4,2,2,1,3,BU:1.5); Emissions: Tab. 3.5.1.1: APOLLO II Schlussbericht, Salerno et al., 2001
1.71E-5 1 1.52
(1,4,2,2,1,3,BU:1.5); Emissions horse dung: Tab. 1+2 Thermische Nutzung von anspruchsvollen Biomassebrennstoffen, Bühler et al. 2005
9.10E-7 1 1.52 (1,4,2,2,1,3,BU:1.5);
Hydrocarbons, aliphatic, unsaturated - - kg 3.10E-6 1 1.79(1,4,2,2,4,3,BU:1.5); extrapolation, based on m easuring data of other emissions
3.10E-6 1 1.79(1,4,2,2,4,3,BU:1.5); extrapolation, based on measuring data of other emissions
3.10E-6 1 1.79(1,4,2,2,4,3,BU:1.5); extrapolation, based on measuring data of other emiss ions
Lead - - kg 2.50E-8 1 5.28(1,4,2,2,4,3,BU:5); extrapolation, bas ed on meas uring data of other emissions
2.50E-8 1 5.28(1,4,2,2,4,3,BU:5); extrapolation, based on measuring data of other emissions
2.50E-8 1 5.28(1,4,2,2,4,3,BU:5); extrapolation, based on measuring data of other emiss ions
Magnesium - - kg 3.60E-7 1 5.28(1,4,2,2,4,3,BU:5); extrapolation, bas ed on meas uring data of other emissions
3.60E-7 1 5.28(1,4,2,2,4,3,BU:5); extrapolation, based on measuring data of other emissions
3.60E-7 1 5.28(1,4,2,2,4,3,BU:5); extrapolation, based on measuring data of other emiss ions
Manganese - - kg 1.70E-7 1 5.28(1,4,2,2,4,3,BU:5); extrapolation, bas ed on meas uring data of other emissions
1.70E-7 1 5.28(1,4,2,2,4,3,BU:5); extrapolation, based on measuring data of other emissions
1.70E-7 1 5.28(1,4,2,2,4,3,BU:5); extrapolation, based on measuring data of other emiss ions
Mercury - - kg 3.00E-10 1 5.28(1,4,2,2,4,3,BU:5); extrapolation, bas ed on meas uring data of other emissions
3.00E-10 1 5.28(1,4,2,2,4,3,BU:5); extrapolation, based on measuring data of other emissions
3.00E-10 1 5.28(1,4,2,2,4,3,BU:5); extrapolation, based on measuring data of other emiss ions
Methane, biogenic - - kg 4.00E-7 1 1.79(1,4,2,2,4,3,BU:1.5); extrapolation, based on m easuring data of other emissions
4.00E-7 1 1.79(1,4,2,2,4,3,BU:1.5); extrapolation, based on measuring data of other emissions
4.00E-7 1 1.79(1,4,2,2,4,3,BU:1.5); extrapolation, based on measuring data of other emiss ions
m-Xylene - - kg 1.20E-7 1 1.79(1,4,2,2,4,3,BU:1.5); extrapolation, based on m easuring data of other emissions
1.20E-7 1 1.79(1,4,2,2,4,3,BU:1.5); extrapolation, based on measuring data of other emissions
1.20E-7 1 1.79(1,4,2,2,4,3,BU:1.5); extrapolation, based on measuring data of other emiss ions
Nickel - - kg 6.00E-9 1 5.28(1,4,2,2,4,3,BU:5); extrapolation, bas ed on meas uring data of other emissions
6.00E-9 1 5.28(1,4,2,2,4,3,BU:5); extrapolation, based on measuring data of other emissions
6.00E-9 1 5.28(1,4,2,2,4,3,BU:5); extrapolation, based on measuring data of other emiss ions
Nitrogen oxides - - kg 1.35E-4 1 1.52(1,4,2,2,1,3,BU:1.5); Emissions: Tab. 3.5.1.1: APOLLO II Schlussbericht, Salerno et al., 2001
2.39E-4 1 1.52
(1,4,2,2,1,3,BU:1.5); Emissions horse dung: Tab. 1+2 Thermische Nutzung von anspruchsvollen Biomassebrennstoffen, Bühler et al. 2005
6.67E-4 1 1.52
(1,4,2,2,1,3,BU:1.5); Emissions pig slurry: Tab.7+8: Energetische Nutzung landwirtschaftlicher Biomasse, Hersener & Bühler, 1998
NMVOC, non-methane volatile organic compounds, unspecified origin
- - kg 6.00E-7 1 1.79(1,4,2,2,4,3,BU:1.5); range of measuring data
6.00E-7 1 1.79 (1,4,2,2,4,3,BU:1.5); range of measuring data 6.00E-7 1 1.79 (1,4,2,2,4,3,BU:1.5); range of m easuring data
PAH, polycyclic aromatic hydrocarbons - - kg 1.11E-8 1 3.24(1,4,2,2,4,3,BU:3); extrapolation, bas ed on meas uring data of other emissions
1.11E-8 1 3.24(1,4,2,2,4,3,BU:3); extrapolation, based on measuring data of other emissions
1.11E-8 1 3.24(1,4,2,2,4,3,BU:3); extrapolation, based on measuring data of other emiss ions
Particulates, < 2.5 um - - kg 1.45E-4 1 3.02(1,4,2,2,1,3,BU:3); Emissions: Tab. 3.5.1.1: APOLLO II Schlussbericht, Salerno et al., 2001
2.05E-4 1 3.02(1,4,2,2,1,3,BU:3); Emissions horse dung: Tab. 1+2 Thermische Nutzung von anspruchsvollen Biomassebrennstoffen, Bühler et al. 2005
8.93E-4 1 3.02
(1,4,2,2,1,3,BU:3); Emissions pig slurry: Tab.7+8: Energetische Nutzung landwirtschaftlicher Biomasse, Hersener & Bühler, 1998
Particulates, > 2.5 um, and < 10um - - kg 8.07E-6 1 2.02(1,4,2,2,1,3,BU:2); Emissions: Tab. 3.5.1.1: APOLLO II Schlussbericht, Salerno et al., 2001
1.14E-5 1 2.02(1,4,2,2,1,3,BU:2); Emissions horse dung: Tab. 1+2 Thermische Nutzung von anspruchsvollen Biomassebrennstoffen, Bühler et al. 2005
4.96E-5 1 2.02
(1,4,2,2,1,3,BU:2); Emissions pig slurry: Tab.7+8: Energetische Nutzung landwirtschaftlicher Biomasse, Hersener & Bühler, 1998
Particulates, > 10 um - - kg 8.07E-6 1 1.52(1,4,2,2,1,3,BU:1.5); Emissions: Tab. 3.5.1.1: APOLLO II Schlussbericht, Salerno et al., 2001
1.14E-5 1 1.52
(1,4,2,2,1,3,BU:1.5); Emissions horse dung: Tab. 1+2 Thermische Nutzung von anspruchsvollen Biomassebrennstoffen, Bühler et al. 2005
4.96E-5 1 1.52
(1,4,2,2,1,3,BU:1.5); Emissions pig slurry: Tab.7+8: Energetische Nutzung landwirtschaftlicher Biomasse, Hersener & Bühler, 1998
Phenol, pentachloro- - - kg 8.10E-12 1 1.79(1,4,2,2,4,3,BU:1.5); extrapolation, based on m easuring data of other emissions
8.10E-12 1 1.79(1,4,2,2,4,3,BU:1.5); extrapolation, based on measuring data of other emissions
8.10E-12 1 1.79(1,4,2,2,4,3,BU:1.5); extrapolation, based on measuring data of other emiss ions
Phosphorus - - kg 3.00E-7 1 1.79(1,4,2,2,4,3,BU:1.5); extrapolation, based on m easuring data of other emissions
3.00E-7 1 1.79(1,4,2,2,4,3,BU:1.5); extrapolation, based on measuring data of other emissions
3.00E-7 1 1.79(1,4,2,2,4,3,BU:1.5); extrapolation, based on measuring data of other emiss ions
Potassium - - kg 2.34E-5 1 5.28(1,4,2,2,4,3,BU:5); extrapolation, bas ed on meas uring data of other emissions
2.34E-5 1 5.28(1,4,2,2,4,3,BU:5); extrapolation, based on measuring data of other emissions
2.34E-5 1 5.28(1,4,2,2,4,3,BU:5); extrapolation, based on measuring data of other emiss ions
Sodium - - kg 1.30E-6 1 5.28(1,4,2,2,4,3,BU:5); extrapolation, bas ed on meas uring data of other emissions
1.30E-6 1 5.28(1,4,2,2,4,3,BU:5); extrapolation, based on measuring data of other emissions
1.30E-6 1 5.28(1,4,2,2,4,3,BU:5); extrapolation, based on measuring data of other emiss ions
Sulfur dioxide - - kg 4.17E-4 1 1.13(1,4,2,2,1,3,BU:1.05); Emissions: Tab. 3.5.1.1: APOLLO II Schlussbericht, Salerno et al., 2001
1.71E-4 1 1.13
(1,4,2,2,1,3,BU:1.05); Emissions horse dung: Tab. 1+2 Thermische Nutzung von anspruchsvollen Biomassebrennstoffen, Bühler et al. 2005
6.50E-5 1 1.13
(1,4,2,2,1,3,BU:1.05); Emissions pig slurry: Tab.7+8: Energetische Nutzung landwirtschaftlicher Biomasse, Hersener & Bühler, 1998
Toluene - - kg 3.00E-7 1 1.79(1,4,2,2,4,3,BU:1.5); extrapolation, based on m easuring data of other emissions
3.00E-7 1 1.79(1,4,2,2,4,3,BU:1.5); extrapolation, based on measuring data of other emissions
3.00E-7 1 1.79(1,4,2,2,4,3,BU:1.5); extrapolation, based on measuring data of other emiss ions
Zinc - - kg 3.00E-7 1 5.28(1,4,2,2,4,3,BU:5); extrapolation, bas ed on meas uring data of other emissions
3.00E-7 1 5.28(1,4,2,2,4,3,BU:5); extrapolation, based on measuring data of other emissions
3.00E-7 1 5.28(1,4,2,2,4,3,BU:5); extrapolation, based on measuring data of other emiss ions

- 39 -
7.2.1. Disposal ash from combustion There are three different ways considered to dispose the ash generated by the combustion process, namely the disposal in landfarming, the disposal to municipal incineration or the disposal to a sanitary landfill. Landfarming means that the ashes are spread as fertilizer on agricultural land. For the small furnaces below a threshold of 30 kW it is assumed that 50 % of the ash is disposed in landfarming and 50 % is disposed in municipal solid waste incineration. For bigger furnaces above 30 kW it is assumed that 50 % of the ash is disposed in a sanitary land fill, 25 % of the ash is disposed in landfarming and 25 % is disposed in municipal solid waste incineration. These fractions for the different disposal scenarios are the same as used for disposal of wood ash in the ecoinvent data set for wood combustion (Bauer 2007).
7.2.2. Particulate matter emissions For the particulate emissions only data for the total suspended particulate matter (TSP) were available. The distribution of the size of the particles had to be estimated. It was assumed that the distribution of the size of the particles for biomass combustion corresponds to the distribution of the particles for wood combustion determined within the CEPMEIP project (Berdowski et al. 2001).
Tab. 18: Distribution of the total suspended parti culate matter to the different classes of particula tes for non-industrial combustion
plants according to Berdowski et al. 2001
Emission factors Wood and wood waste Low Fraction Medium Fraction Medium-
High Fraction High Fraction
Non-industrial combustion plants Mg/PJ % Mg/PJ % Mg/PJ % Mg/PJ %
TSP 150.0 100.0% 300.0 100.0% 300.0 100.0% 300.0 100.0%
Particulates, < 2.5 um 135.0 90.0% 270.0 90.0% 270.0 90.0% 270.0 90.0%
Particulates, > 2.5 um, and < 10um 8.0 5.3% 15.0 5.0% 15.0 5.0% 15.0 5.0%
Particulates, > 10 um 7.0 4.7% 15.0 5.0% 15.0 5.0% 15.0 5.0%
7.3. Heat generation Tab. 19 shows the unit process raw data for the heat generation for olive pomace and coffee ground pellets. The efficiency factor of the furnace used for the combustion of the olive pomace and the efficiency factor of the furnace used for the combustion of coffee ground pellets are estimated to be equal to 0.85.
Tab. 19: Unit process raw data for the heat generat ion of olive pomace and coffee ground pellets
Tab. 20 shows the unit process raw data for the heat generations of the biomass substrates poultry litter pellets, horse dung and wood chips and slurry solids and bark chips. The efficiency factor of the grate furnace used for the combustion of poultry litter pellets is 0.94 (Salerno et al. 2001). The efficiency factors for grate furnace and the bark furnace used for the combustion of the other substrates no information was available and an efficiency factor of 0.85 was assumed.
Name
Lo
catio
n
Infr
ast
ruct
ure
-P
roce
ss
Un
it
heat, olive pomace, at
boiler furnace, in oil mill
heat, coffee ground pellets, in wood furnace
25kW Un
certa
inty
-T
ype
Sta
nd
ard
-D
evi
atio
n-9
5%
GeneralComment
Location CY CH
InfrastructureProcess 0 0Unit MJ MJ
product heat, olive pomace, at boiler furnace, in oil mill CY 0 MJ 1 0
heat, coffee ground pellets, in wood furnace 25kW CH 0 MJ 0 1
technosphere olive pomace, burned in boiler furnace, at oil mill CY 0 MJ 1.18E+0 0 1 2.34(1,5,5,5,5,5,BU:1.05); Estimated efficiency factor 0.85
coffee ground pellets, burned in wood furnace 25kW CH 0 MJ 0 1.18E+0 1 2.34(1,5,5,5,5,5,BU:1.05); Estimated efficiency factor 0.85

- 40 -
Tab. 20: Unit process raw data for the heat generat ion of the mixtures “horse dung and wood chips” and “slurry solids and bark chips”
7.4. Disposal of the ashes The elemental composition of the ash is taken from literature and the missing values are taken from the elemental composition of wood ash documented in the ecoinvent data set "disposal, wood ash mixture, pure, 0% water, to landfarming, CH, kg". Tab. 10 shows the elemental composition of the ash of the different biomass fuels. The ash composition of the ash generated by the combustion of olive pomace is taken from Jauhiainen et al. (2005). The ash composition of the ash generated by the combustion of coffee ground pellets is taken from SGS-Institut-Fresenius (2008). The ash composition of the ash generated by the combustion of poultry litter pellets is taken from Salerno et al. (2001) and the composition of the ash generated by the combustion of horse dung is taken from Bühler et al. (2007). The ash composition of the ash generated by the combustion of slurry solids is taken from Hersener & Bühler (1998). The natural concentration of heavy metals in wood and the natural concentration in the analysed biomass substrates are similar, but the ash formation when burning biomass substrates is ten times higher compared to the ash formation when burning wood. If 90% of the heavy metals are transferred to the residual ash, the concentration of the heavy metals in the wood ash is considerably higher than the concentration of the heavy metals in the ash generated by the combustion of the biomass substrates. To account for the higher ash formation the adopted values for the concentration of heavy metals taken from wood ash are reduced by a factor of 10 in the case of olive pomace, poultry litter and horse dung and by a factor of 3 in the case of coffee ground pellets. Without this correction the heavy metal content of the ash generated by biomass combustion is assumed to be overestimated.
Name
Loca
tion
Infra
stru
ctu
reP
roc
ess
Un
it
heat, poultry litter pellets, in rotating grate furnace 250-
350kW
heat, horse dung and waste wood chips, in grate furnace 500-
600kW
heat, slurry solids and bark chips, in bark furnace 1MW
Un
cert
ain
tyT
ype
Sta
nd
ardD
evia
tion
95% GeneralComment
Location CH CH CHInfrastructureProcess 0 0 0
Unit MJ MJ MJ
product heat, poultry litter pellets, in rotating grate furnace 250-350kW CH 0 MJ 1 0 0
heat, horse dung and waste wood chips, in grate furnace 500-600kW
CH 0 MJ 0 1 0
heat, slurry solids and bark chips, in bark furnace 1MW CH 0 MJ 0 0 1
technospherepoultry litter pellets, burned in rotating grate furnace 250-350kW
CH 0 MJ 1.06E+0 0 0 1 1.20(1,4,4,3,1,3,BU:1.05); Efficiency factor 0.94, APOLLO II, Salerno et al., 2001
horse dung and waste wood chips, burned in grate furnace 500-600kW
CH 0 MJ 0 1.18E+0 0 1 1.50(1,5,5,5,5,5,BU:1.05); Estimated efficiency factor 0.85
slurry solids and bark chips, burned in bark furnace 1MW CH 0 MJ 0 0 1.18E+0 1 1.50(1,5,5,5,5,5,BU:1.05); Estimated efficiency factor 0.85

- 41 -
Tab. 21: Elemental composition of the ash generate d by the combustion process for the different bioma ss fuels
7.4.1. Landfarming One possibility to dispose the ash generated by the combustion of the biomass substrates is the disposal in landfarming. Landfarming means the spreading of the ashes on arable land. The environmental impact of the spreading of the ashes is allocated to 100 % to the combustion of the biomass. The use of ashes as fertilisers is not considered although the high content of alkali metals and phosphorus in the ashes. The disposal of the ash in landfarming was modelled as a direct flux of the elements shown in Tab. 10 to agricultural soil. The sum of the elements listed in Tab. 22 and Tab. 23 is no equal to 1 kg. The missing mass corresponds to the oxygen in the ash as in Tab. 21. Tab. 22 shows the unit process raw data of the disposal of the ash generated by the combustion of olive pomace and coffee ground pellets in landfarming. The elemental composition of the ash is taken from literature and the missing values are taken from the elemental composition of wood ash documented in the ecoinvent data set "disposal, wood ash mixture, pure, 0% water, to landfarming CH, kg". The completed values are highlighted with a dark green.
Fuel ash olive pomaceash coffee ground
pellets
ash poultry litter
pellets
ash horse dung and
wood chips
ash slurry solids and
bark chips
Water content H2O n.a. n.a. n.a. n.a. n.a.
Oxygen (without O from H2O) O 0.38554 0.4012 0.2875 0.4909 0.4909
Hydrogen (without H from H2O) H n.a. n.a. n.a. n.a. n.a.
Carbon (enter share of biogenic C below) C 0.14853 0.012 0.012 0.012 0.012
Sulfur S 0.00987 0.0092 0.0092 0.0092 0.0092
Nitrogen N n.a. n.a. n.a. n.a. n.a.
Phosphor P 0.01705 0.0098 0.112 0.00392 0.00392
Boron B n.a. n.a. n.a. n.a. n.a.
Chlorine Cl 0.00305 0.0032 0.0032 0.000204 0.000204
Bromium Br n.a. n.a. n.a. n.a. n.a.
Fluorine F n.a. n.a. n.a. n.a. n.a.
Iodine I n.a. n.a. n.a. n.a. n.a.
Silver Ag n.a. n.a. n.a. n.a. n.a.
Arsenic As n.a. 0.0000067 0.0000067 0.0000067 0.0000067
Barium Ba n.a. n.a. n.a. n.a. n.a.
Cadmium Cd n.a. 1.03448E-05 0.00000022 0.000005 0.000005
Cobalt Co n.a. 3.44828E-05 0.0000018 0.0000018 0.0000018
Chromium Cr n.a. 3.44828E-05 0.0000195 0.0000195 0.0000195
Copper Cu n.a. 0.001034483 0.000426 0.000103 0.000103
Mercury Hg n.a. 0.000000033 0.00000001 0.00000001 0.00000001
Manganese Mn n.a. 0.002172414 0.02 0.02 0.02
Molybdenum Mo n.a. 0.0000037 0.0000037 0.0000037 0.0000037
Nickel Ni n.a. 6.89655E-05 0.000059 0.00000552 0.00000552
Lead Pb n.a. 0.000172414 0.0000065 0.000016 0.000016
Antimony Sb n.a. 0.000206897 n.a. n.a. n.a.
Selenium Se n.a. n.a. n.a. n.a. n.a.
Tin Sn n.a. 0.001172414 n.a. n.a. n.a.
Vanadium V n.a. 3.44828E-05 0.0000395 0.0000395 0.0000395
Zinc Zn n.a. 0.002965517 0.00091 0.00102 0.00102
Beryllium Be n.a. n.a. n.a. n.a. n.a.
Scandium Sc n.a. n.a. n.a. n.a. n.a.
Strontium Sr n.a. n.a. n.a. n.a.
Titanium Ti 0.00065 0.00138 0.00138 0.00138 0.00138
Thallium Tl n.a. n.a. n.a. n.a. n.a.
Tungsten W n.a. n.a. n.a. n.a. n.a.
Silicon Si 0.06982 0.0826 0.0826 0.0826 0.0826
Iron (enter share of metallic iron below) Fe 0.02528 0.0228 0.0228 0.0228 0.0228
Calcium Ca 0.06675 0.284 0.284 0.284 0.284
Aluminium Al 0.0241 0.079310345 0.0208 0.0208 0.0208
Potassium K 0.21518 0.0545 0.099 0.01886 0.01886
Magnesium Mg 0.03023 0.0321 0.044 0.0321 0.0321
Sodium Na 0.00395 n.a. n.a. n.a. n.a.
sum wet mass 100.00% 100.00% 100.00% 100.00% 100.00%

- 42 -
Tab. 22 Unit process raw data for the disposal of t he ash of olive pomace and coffee ground pellets to landfarming
Name
Lo
catio
n
Infr
ast
ruct
ure
-P
roce
ss
Un
it
disposal, ash olive pomace, to landfarming
Un
cert
ain
tyT
ype
Sta
nd
ard
De
via
tion
95
% GeneralComment
disposal, ash coffee ground
pellets , to landfarming
Un
cert
ain
ty-T
ype
Sta
nd
ard
-D
evi
atio
n9
5%
GeneralComment
Location CY Legende CH LegendeInfrastructureProcess 0 taken from ecoinvent data set for combustion of wood0 taken from ecoinvent data set for combustion of wood
Unit kg taken from literature kg taken from literature
productdisposal, ash olive pomace, to landfarming
CY 0 kg 1 0
disposal, ash coffee ground pellets, to landfarming
CH 0 kg 0 1
disposal, wood ash mixture, pure, 0% water, to landfarming
CH 0 kg 0 0
technospheresolid manure loading and spreading, by hydraulic loader and spreader
CH 0 kg 1.00E+0 1 1.62(4,5,na,1,4,na,BU:1.05); Assumption for spreading 1.00E+0 1 1.62
(4,5,na,1,4,na,BU:1.05); Assumption for spreading
emission soil, agricultural Aluminium - - kg 2.41E-2 1 1.26(1,4,2,1,1,5,BU:1.1); Ash composition: Tab. 4, Jauhiainen et al. 2005 7.93E-2 1 1.26
(1,4,2,1,1,5,BU:1.1); Ash composition: Prüfbericht 544946, SGS Institut Fresenius, 2008;
Antimony - - kg 0 1 1.26(1,4,2,1,1,5,BU:1.1); Ash composition: Tab. 4, Jauhiainen et al. 2005 2.07E-4 1 1.26
(1,4,2,1,1,5,BU:1.1); Ash composition: Prüfbericht 544946, SGS Institut Fresenius, 2008;
Arsenic - - kg 0 1 1.34(1,4,2,3,3,5,BU:1.1); Ash composition: Tab. 4, Jauhiainen et al. 2005 6.70E-6 1 1.34
(1,4,2,3,3,5,BU:1.1); direct emission from landfarming process. Uncertainty from uncertainty in waste composition.
Cadmium - - kg 0 1 1.26(1,4,2,1,1,5,BU:1.1); Ash composition: Tab. 4, Jauhiainen et al. 2005 1.03E-5 1 1.26
(1,4,2,1,1,5,BU:1.1); Ash composition: Prüfbericht 544946, SGS Institut Fresenius, 2008;
Calcium - - kg 6.68E-2 1 1.26(1,4,2,1,1,5,BU:1.1); Ash composition: Tab. 4, Jauhiainen et al. 2005 2.84E-1 1 1.26
(1,4,2,1,1,5,BU:1.1); direct emission from landfarming process. Uncertainty from uncertainty in waste composition.
Carbon - - kg 1.49E-1 1 1.58(1,4,2,1,1,5,BU:1.5); Ash composition: Tab. 4, Jauhiainen et al. 2005 1.20E-2 1 1.58
(1,4,2,1,1,5,BU:1.5); direct emission from landfarming process. Uncertainty from uncertainty in waste composition.
Chloride - - kg 3.05E-3 1 1.58(1,4,2,1,1,5,BU:1.5); Ash composition: Tab. 4, Jauhiainen et al. 2005 3.20E-3 1 1.58
(1,4,2,1,1,5,BU:1.5); direct emission from landfarming process. Uncertainty from uncertainty in waste composition.
Chromium - - kg 0 1 1.26(1,4,2,1,1,5,BU:1.1); Ash composition: Tab. 4, Jauhiainen et al. 2005 3.45E-5 1 1.26
(1,4,2,1,1,5,BU:1.1); Ash composition: Prüfbericht 544946, SGS Institut Fresenius, 2008;
Cobalt - - kg 0 1 1.26(1,4,2,1,1,5,BU:1.1); Ash composition: Tab. 4, Jauhiainen et al. 2005 3.45E-5 1 1.26
(1,4,2,1,1,5,BU:1.1); Ash composition: Prüfbericht 544946, SGS Institut Fresenius, 2008;
Copper - - kg 0 1 1.26(1,4,2,1,1,5,BU:1.1); Ash composition: Tab. 4, Jauhiainen et al. 2005 1.03E-3 1 1.26
(1,4,2,1,1,5,BU:1.1); Ash composition: Prüfbericht 544946, SGS Institut Fresenius, 2008;
Iron - - kg 2.53E-2 1 1.26(1,4,2,1,1,5,BU:1.1); Ash composition: Tab. 4, Jauhiainen et al. 2005 2.28E-2 1 1.26
(1,4,2,1,1,5,BU:1.1); direct emission from landfarming process. Uncertainty from uncertainty in waste composition.
Lead - - kg 0 1 1.26(1,4,2,1,1,5,BU:1.1); Ash composition: Tab. 4, Jauhiainen et al. 2005 1.72E-4 1 1.26
(1,4,2,1,1,5,BU:1.1); Ash composition: Prüfbericht 544946, SGS Institut Fresenius, 2008;
Magnesium - - kg 3.02E-2 1 1.26(1,4,2,1,1,5,BU:1.1); Ash composition: Tab. 4, Jauhiainen et al. 2005 3.21E-2 1 1.26
(1,4,2,1,1,5,BU:1.1); direct emission from landfarming process. Uncertainty from uncertainty in waste composition.
Manganese - - kg 0 1 1.26(1,4,2,1,1,5,BU:1.1); Ash composition: Tab. 4, Jauhiainen et al. 2005 2.17E-3 1 1.26
(1,4,2,1,1,5,BU:1.1); Ash composition: Prüfbericht 544946, SGS Institut Fresenius, 2008;
Mercury - - kg 0 1 1.34(1,4,2,3,3,5,BU:1.1); Ash composition: Tab. 4, Jauhiainen et al. 2005 3.30E-8 1 1.34
(1,4,2,3,3,5,BU:1.1); direct emission from landfarming process. Uncertainty from uncertainty in waste composition.
Molybdenum - - kg 0 1 1.34(1,4,2,3,3,5,BU:1.1); Ash composition: Tab. 4, Jauhiainen et al. 2005 3.70E-6 1 1.34
(1,4,2,3,3,5,BU:1.1); direct emission from landfarming process. Uncertainty from uncertainty in waste composition.
Nickel - - kg 0 1 1.26(1,4,2,1,1,5,BU:1.1); Ash composition: Tab. 4, Jauhiainen et al. 2005 6.90E-5 1 1.26
(1,4,2,1,1,5,BU:1.1); Ash composition: Prüfbericht 544946, SGS Institut Fresenius, 2008;
Phosphorus - - kg 1.71E-2 1 1.58(1,4,2,1,1,5,BU:1.5); Ash composition: Tab. 4, Jauhiainen et al. 2005 9.80E-3 1 1.58
(1,4,2,1,1,5,BU:1.5); direct emission from landfarming process. Uncertainty from uncertainty in waste composition.
Potass ium - - kg 2.15E-1 1 1.26(1,4,2,1,1,5,BU:1.1); Ash composition: Tab. 4, Jauhiainen et al. 2005 5.45E-2 1 1.26
(1,4,2,1,1,5,BU:1.1); direct emission from landfarming process. Uncertainty from uncertainty in waste composition.
Silicon - - kg 6.98E-2 1 1.26(1,4,2,1,1,5,BU:1.1); Ash composition: Tab. 4, Jauhiainen et al. 2005 8.26E-2 1 1.26
(1,4,2,1,1,5,BU:1.1); direct emission from landfarming process. Uncertainty from uncertainty in waste composition.
Sodium - - kg 3.95E-3 1 1.58(1,4,2,1,1,5,BU:1.5); Ash composition: Tab. 4, Jauhiainen et al. 2005 0 1 1.58
(1,4,2,1,1,5,BU:1.5); direct emission from landfarming process. Uncertainty from uncertainty in waste composition.
Sulfur - - kg 9.87E-3 1 1.58(1,4,2,1,1,5,BU:1.5); Ash composition: Tab. 4, Jauhiainen et al. 2005 9.20E-3 1 1.58
(1,4,2,1,1,5,BU:1.5); direct emission from landfarming process. Uncertainty from uncertainty in waste composition.
Tin - - kg 0 1 1.26(1,4,2,1,1,5,BU:1.1); Ash composition: Tab. 4, Jauhiainen et al. 2005 1.17E-3 1 1.26
(1,4,2,1,1,5,BU:1.1); Ash composition: Prüfbericht 544946, SGS Institut Fresenius, 2008;
Titanium - - kg 6.50E-4 1 1.26(1,4,2,1,1,5,BU:1.1); Ash composition: Tab. 4, Jauhiainen et al. 2005 1.38E-3 1 1.26
(1,4,2,1,1,5,BU:1.1); direct emission from landfarming process. Uncertainty from uncertainty in waste composition.
Vanadium - - kg 0 1 1.26(1,4,2,1,1,5,BU:1.1); Ash composition: Tab. 4, Jauhiainen et al. 2005 3.45E-5 1 1.26
(1,4,2,1,1,5,BU:1.1); Ash composition: Prüfbericht 544946, SGS Institut Fresenius, 2008;
Zinc - - kg 0 1 1.26(1,4,2,1,1,5,BU:1.1); Ash composition: Tab. 4, Jauhiainen et al. 2005 2.97E-3 1 1.26
(1,4,2,1,1,5,BU:1.1); Ash composition: Prüfbericht 544946, SGS Institut Fresenius, 2008;

- 43 -
Tab. 23 shows the unit process raw data of the disposal of the ash generated by the combustion of poultry litter pellets, horse dung and slurry solids in landfarming. The elemental composition of the ash is taken from literature and the missing values are taken from the elemental composition of wood ash documented in the ecoinvent data set "disposal, wood ash mixture, pure, 0% water, to landfarming CH, kg". The completed values are highlighted with a dark green.
Tab. 23: Unit process raw data for disposal of the ash of the mixtures “horse dung and wood chips” and “slurry solids and bark chips” to
landfarming
Name
Loca
tion
Infra
stru
ctur
ePro
ces
s
Uni
t
disposal, ash poultry litter pellets , to
landfarming
Un
certa
inty
Typ
e
Sta
nda
rdD
evia
tion
95% GeneralComment
disposal, ash horse dung and
waste wood chips, to
landfarming
Un
certa
inty
Typ
e
Sta
nda
rdD
evia
tion
95% GeneralComment
disposal, ash s lurry solids and
bark chips, to landfarming
Un
certa
inty
Typ
e
Sta
nda
rdD
evia
tion
95% GeneralComment
Location CH Legende CH Legende CH LegendeInfras tructureProcess 0 taken from ecoinvent data sets for combustion of wood0 taken from ecoinvent data sets for combustion of wood 0 taken from ecoinvent data sets for combus tion of wood
Unit kg taken from literature kg taken from literature kg taken from literature
productdisposal, ash poultry litter pellets , to landfarming
CH 0 kg 1 0 0
disposal, ash horse dung and waste wood chips, to landfarming
CH 0 kg 0 1 0
disposal, ash slurry solids and bark chips, to landfarming
CH 0 kg 0 0 1
technosphere solid manure loading and spreading, by hydraulic loader and spreader
CH 0 kg 1.00E+0 1 1.24 (1,4,2,1,1,5,BU:1.05); approximate burden for spreading. (n.a.,n.a.,1,1,4,n.a.) & basic uncertainty of 1.05; solid manure spreadingfor landfarming of waste
1.00E+0 1 1.24 (1,4,2,1,1,5,BU:1.05); approximate burden for spreading. (n.a.,n.a.,1,1,4,n.a.) & basic uncertainty of 1.05; solid manure spreadingfor landfarming of waste
1.00E+0 1 1.24 (1,4,2,1,1,5,BU:1.05); approximate burden for spreading. (n.a.,n.a.,1,1,4,n.a.) & basic uncertainty of 1.05; solid manure spreadingfor landfarming of waste
emission soil, agricultural
Aluminium - - kg 2.08E-2 1 1.61 (1,4,2,5,4,5,BU:1.1); direct emission from landfarming process. Uncertainty from uncertainty in was te composition.
2.08E-2 1 1.61 (1,4,2,5,4,5,BU:1.1); direct emiss ion from landfarming process. Uncertainty from uncertainty in waste composition.
2.08E-2 1 1.61 (1,4,2,5,4,5,BU:1.1); direct emission from landfarming process . Uncertainty from uncertainty in waste composition.
Arsenic - - kg 6.70E-6 1 1.61 (1,4,2,5,4,5,BU:1.1); direct emission from landfarming process. Uncertainty from uncertainty in was te composition.
6.70E-6 1 1.61 (1,4,2,5,4,5,BU:1.1); direct emiss ion from landfarming process. Uncertainty from uncertainty in waste composition.
6.70E-6 1 1.61 (1,4,2,5,4,5,BU:1.1); direct emission from landfarming process . Uncertainty from uncertainty in waste composition.
Cadmium - - kg 2.20E-7 1 1.26 (1,4,2,1,1,5,BU:1.1); Ash compos ition Tab. 3.6.1: APOLLO II Schlussbericht, Salerno et al., 2001
5.00E-6 1 1.26 (1,4,2,1,1,5,BU:1.1); Ash composition Tab. 3 Thermische Nutzung von anspruchsvollen Biomassebrennstoffen, Bühler et al. 2007
8.68E-7 1 1.26 (1,4,2,1,1,5,BU:1.1); Ash composition: no information available, modelled equal to horse dung
Calcium - - kg 2.84E-1 1 1.61 (1,4,2,5,4,5,BU:1.1); direct emission from landfarming process. Uncertainty from uncertainty in was te composition.
2.84E-1 1 1.61 (1,4,2,5,4,5,BU:1.1); direct emiss ion from landfarming process. Uncertainty from uncertainty in waste composition.
2.84E-3 1 1.61 (1,4,2,5,4,5,BU:1.1); direct emission from landfarming process . Uncertainty from uncertainty in waste composition.
Carbon - - kg 1.20E-2 1 1.85 (1,4,2,5,4,5,BU:1.5); direct emission from landfarming process. Uncertainty from uncertainty in was te composition.
1.20E-2 1 1.85 (1,4,2,5,4,5,BU:1.5); direct emiss ion from landfarming process. Uncertainty from uncertainty in waste composition.
1.20E-2 1 1.85 (1,4,2,5,4,5,BU:1.5); direct emission from landfarming process . Uncertainty from uncertainty in waste composition.
Chloride - - kg 3.20E-3 1 1.58 (1,4,2,1,1,5,BU:1.5); Ash compos ition Tab. 3.6.1: APOLLO II Schlussbericht, Salerno et al., 2001
2.04E-4 1 1.58 (1,4,2,1,1,5,BU:1.5); Ash composition Tab. 3 Thermische Nutzung von anspruchsvollen Biomassebrennstoffen, Bühler et al. 2007
3.20E-3 1 1.58 (1,4,2,1,1,5,BU:1.5); Ash composition: no information available, modelled equal to horse dung
Chromium - - kg 1.95E-5 1 1.61 (1,4,2,5,4,5,BU:1.1); direct emission from landfarming process. Uncertainty from uncertainty in was te composition.
1.95E-5 1 1.61 (1,4,2,5,4,5,BU:1.1); direct emiss ion from landfarming process. Uncertainty from uncertainty in waste composition.
1.95E-4 1 1.61 (1,4,2,5,4,5,BU:1.1); direct emission from landfarming process . Uncertainty from uncertainty in waste composition.
Cobalt - - kg 1.80E-6 1 1.61 (1,4,2,5,4,5,BU:1.1); direct emission from landfarming process. Uncertainty from uncertainty in was te composition.
1.80E-6 1 1.61 (1,4,2,5,4,5,BU:1.1); direct emiss ion from landfarming process. Uncertainty from uncertainty in waste composition.
1.80E-5 1 1.61 (1,4,2,5,4,5,BU:1.1); direct emission from landfarming process . Uncertainty from uncertainty in waste composition.
Copper - - kg 4.26E-4 1 1.26 (1,4,2,1,1,5,BU:1.1); Ash compos ition Tab. 3.6.1: APOLLO II Schlussbericht, Salerno et al., 2001
1.03E-4 1 1.26 (1,4,2,1,1,5,BU:1.1); Ash composition Tab. 3 Thermische Nutzung von anspruchsvollen Biomassebrennstoffen, Bühler et al. 2007
8.34E-4 1 1.26 (1,4,2,1,1,5,BU:1.1); Ash composition: no information available, modelled equal to horse dung
Iron - - kg 2.28E-2 1 1.61 (1,4,2,5,4,5,BU:1.1); direct emission from landfarming process. Uncertainty from uncertainty in was te composition.
2.28E-2 1 1.61 (1,4,2,5,4,5,BU:1.1); direct emiss ion from landfarming process. Uncertainty from uncertainty in waste composition.
2.28E-2 1 1.61 (1,4,2,5,4,5,BU:1.1); direct emission from landfarming process . Uncertainty from uncertainty in waste composition.
Lead - - kg 6.50E-6 1 1.26 (1,4,2,1,1,5,BU:1.1); Ash compos ition Tab. 3.6.1: APOLLO II Schlussbericht, Salerno et al., 2001
1.60E-5 1 1.26 (1,4,2,1,1,5,BU:1.1); Ash composition Tab. 3 Thermische Nutzung von anspruchsvollen Biomassebrennstoffen, Bühler et al. 2007
1.27E-5 1 1.26 (1,4,2,1,1,5,BU:1.1); Ash composition: no information available, modelled equal to horse dung
Magnesium - - kg 4.40E-2 1 1.26 (1,4,2,1,1,5,BU:1.1); Ash compos ition Tab. 3.6.1: APOLLO II Schlussbericht, Salerno et al., 2001
3.21E-2 1 1.26 (1,4,2,1,1,5,BU:1.1); Ash composition Tab. 3 Thermische Nutzung von anspruchsvollen Biomassebrennstoffen, Bühler et al. 2007
3.21E-2 1 1.26 (1,4,2,1,1,5,BU:1.1); Ash composition: no information available, modelled equal to horse dung
Manganese - - kg 2.00E-2 1 1.61 (1,4,2,5,4,5,BU:1.1); direct emission from landfarming process. Uncertainty from uncertainty in was te composition.
2.00E-2 1 1.61 (1,4,2,5,4,5,BU:1.1); direct emiss ion from landfarming process. Uncertainty from uncertainty in waste composition.
2.00E-2 1 1.61 (1,4,2,5,4,5,BU:1.1); direct emission from landfarming process . Uncertainty from uncertainty in waste composition.
Mercury - - kg 1.00E-8 1 1.61 (1,4,2,5,4,5,BU:1.1); direct emission from landfarming process. Uncertainty from uncertainty in was te composition.
1.00E-8 1 1.61 (1,4,2,5,4,5,BU:1.1); direct emiss ion from landfarming process. Uncertainty from uncertainty in waste composition.
1.00E-7 1 1.61 (1,4,2,5,4,5,BU:1.1); direct emission from landfarming process . Uncertainty from uncertainty in waste composition.
Molybdenum - - kg 3.70E-6 1 1.61 (1,4,2,5,4,5,BU:1.1); direct emission from landfarming process. Uncertainty from uncertainty in was te composition.
3.70E-6 1 1.61 (1,4,2,5,4,5,BU:1.1); direct emiss ion from landfarming process. Uncertainty from uncertainty in waste composition.
3.70E-6 1 1.61 (1,4,2,5,4,5,BU:1.1); direct emission from landfarming process . Uncertainty from uncertainty in waste composition.
Nickel - - kg 5.90E-5 1 1.26 (1,4,2,1,1,5,BU:1.1); Ash compos ition Tab. 3.6.1: APOLLO II Schlussbericht, Salerno et al., 2001
5.52E-6 1 1.26 (1,4,2,1,1,5,BU:1.1); Ash composition Tab. 3 Thermische Nutzung von anspruchsvollen Biomassebrennstoffen, Bühler et al. 2007
5.52E-5 1 1.26 (1,4,2,1,1,5,BU:1.1); Ash composition: no information available, modelled equal to horse dung
Phosphorus - - kg 1.12E-1 1 1.58 (1,4,2,1,1,5,BU:1.5); Ash compos ition Tab. 3.6.1: APOLLO II Schlussbericht, Salerno et al., 2001
3.92E-3 1 1.58 (1,4,2,1,1,5,BU:1.5); Ash composition Tab. 3 Thermische Nutzung von anspruchsvollen Biomassebrennstoffen, Bühler et al. 2007
8.37E-2 1 1.58 (1,4,2,1,1,5,BU:1.5); Ash composition: no information available, modelled equal to horse dung
Potassium - - kg 9.90E-2 1 1.26 (1,4,2,1,1,5,BU:1.1); Ash compos ition Tab. 3.6.1: APOLLO II Schlussbericht, Salerno et al., 2001
1.89E-2 1 1.26 (1,4,2,1,1,5,BU:1.1); Ash composition Tab. 3 Thermische Nutzung von anspruchsvollen Biomassebrennstoffen, Bühler et al. 2007
1.47E-1 1 1.26 (1,4,2,1,1,5,BU:1.1); Ash composition: no information available, modelled equal to horse dung
Silicon - - kg 8.26E-2 1 1.61 (1,4,2,5,4,5,BU:1.1); direct emission from landfarming process. Uncertainty from uncertainty in was te composition.
8.26E-2 1 1.61 (1,4,2,5,4,5,BU:1.1); direct emiss ion from landfarming process. Uncertainty from uncertainty in waste composition.
8.26E-2 1 1.61 (1,4,2,5,4,5,BU:1.1); direct emission from landfarming process . Uncertainty from uncertainty in waste composition.
Sodium - - kg 0 1 1.58 (1,4,2,1,1,5,BU:1.5); direct emission from landfarming process. Uncertainty from uncertainty in was te composition.
0 1 1.58 (1,4,2,1,1,5,BU:1.5); direct emiss ion from landfarming process. Uncertainty from uncertainty in waste composition.
2.01E-1 1 1.58 (1,4,2,1,1,5,BU:1.5); direct emission from landfarming process . Uncertainty from uncertainty in waste composition.
Sulfur - - kg 9.20E-3 1 1.85 (1,4,2,5,4,5,BU:1.5); direct emission from landfarming process. Uncertainty from uncertainty in was te composition.
9.20E-3 1 1.85 (1,4,2,5,4,5,BU:1.5); direct emiss ion from landfarming process. Uncertainty from uncertainty in waste composition.
9.20E-3 1 1.85 (1,4,2,5,4,5,BU:1.5); direct emission from landfarming process . Uncertainty from uncertainty in waste composition.
Tin - - kg 0 1 1.59 (1,4,2,1,4,5,BU:1.1); direct emission from landfarming process. Uncertainty from uncertainty in was te composition.
0 1 1.59 (1,4,2,1,4,5,BU:1.1); direct emiss ion from landfarming process. Uncertainty from uncertainty in waste composition.
0 1 1.59 (1,4,2,1,4,5,BU:1.1); direct emission from landfarming process . Uncertainty from uncertainty in waste composition.
Titanium - - kg 1.38E-3 1 1.61 (1,4,2,5,4,5,BU:1.1); direct emission from landfarming process. Uncertainty from uncertainty in was te composition.
1.38E-3 1 1.61 (1,4,2,5,4,5,BU:1.1); direct emiss ion from landfarming process. Uncertainty from uncertainty in waste composition.
1.38E-3 1 1.61 (1,4,2,5,4,5,BU:1.1); direct emission from landfarming process . Uncertainty from uncertainty in waste composition.
Vanadium - - kg 3.95E-5 1 1.61 (1,4,2,5,4,5,BU:1.1); direct emission from landfarming process. Uncertainty from uncertainty in was te composition.
3.95E-5 1 1.61 (1,4,2,5,4,5,BU:1.1); direct emiss ion from landfarming process. Uncertainty from uncertainty in waste composition.
3.95E-5 1 1.61 (1,4,2,5,4,5,BU:1.1); direct emission from landfarming process . Uncertainty from uncertainty in waste composition.
Zinc - - kg 9.10E-4 1 1.26 (1,4,2,1,1,5,BU:1.1); Ash compos ition Tab. 3.6.1: APOLLO II Schlussbericht, Salerno et al., 2001
1.02E-3 1 1.26 (1,4,2,1,1,5,BU:1.1); Ash composition Tab. 3 Thermische Nutzung von anspruchsvollen Biomassebrennstoffen, Bühler et al. 2007
2.92E-3 1 1.26 (1,4,2,1,1,5,BU:1.1); Ash composition: no information available, modelled equal to horse dung

- 44 -
7.4.2. Municipal incineration A second possibility to dispose the ashes is the disposal in municipal incineration. The disposal of the ash to municipal incineration was modelled according to Doka (2007). The same elemental composition of the ash, which is shown in Tab. 10, was used for the calculations. This includes the combustion of the ash in municipal incineration and the landfilling of the residual waste.
7.4.3. Sanitary landfill The third possibility to dispose the ashes is the disposal of the ashes to a sanitary landfill. The disposal of the ashes to a sanitary landfill was modelled according to Doka (2007). The same elemental composition of the ash, which is shown in Tab. 10, was used for the calculations. This includes the construction of the sanitary landfill and the treatment of the sewage sludge from the wastewater treatment.
7.5. Coffee grounds in municipal incineration For the coffee ground a second way of energy recovery was modelled, namely the combustion of the wet coffee grounds in municipal incineration instead of the drying and pelletising of the coffee grounds. The heat and electricity generation was modelled according to Doka (2007). The same elemental composition for the moist fuel as shown in Tab. 3 was used for the calculations. For the analysis the net benefit of the combustion of coffee grounds in municipal incineration is calculated. The net benefit is calculated as the difference between the avoided environmental impact of energy generation and the environmental impact of the combustion of one kilogram of coffee grounds in municipal. The combustion of 1 kg of coffee grounds in municipal incineration generates 0.53 kWh electricity and 3.92 MJ of useful heat according to Doka (2007). For the substitution of the energy generation two possibilities for electricity generation and heat production are analysed resulting in a minimal net benefit and a maximal net benefit. This minimum maximum analysis is performed to cover the range of the different technologies for energy generation. As substitution processes for electricity generation the process „electricity, natural gas, at combined cycle plant, best technology, RER“ is chosen for the minimal net benefit and for the maximal net benefit the electricity import mix shown in Tab. 11.
Tab. 24: Unit process raw data of the electricity i mport mix used for the calculation of the maximal n et benefit of the electricity genera-
tion
As substitution process for heat generation the process “heat, light fuel oil, at industrial furnace 1MW, CH” is chosen for the maximal net benefit and the process “heat, natural gas, at industrial furnace >100kW, RER” for the minimal net benefit.
7.6. Meta information to the unit process raw data Tab. 25, Tab. 26 , Tab. 27 and Tab. 28 show the meta information to all the unit process raw data for biomass combustion presented in this report.
Name
Loca
tion
Infr
ast
ruct
ure
Pro
ces
Uni
t electricity mix, import FR/DE/IT
Un
certa
inty
Type
Sta
ndar
dD
evi
atio
n95% GeneralComment
Location CHInfrastructureProcess 0
Unit kWhproduct electricity mix, import FR/DE/IT CH 0 kWh 1
technosphere electricity mix FR 0 kWh 9.17E-1 1 1.05
(1,1,1,1,1,1,BU:1.05); Leuenberger M. and Frischknecht R. (2010) Life Cycle Assessment of Swiss Electricity Mixes. implemented in ecoinvent data v2.2
electricity mix IT 0 kWh 1.92E-2 1 1.05
(1,1,1,1,1,1,BU:1.05); Leuenberger M. and Frischknecht R. (2010) Life Cycle Assessment of Swiss Electricity Mixes. implemented in ecoinvent data v2.2
electricity mix DE 0 kWh 6.41E-2 1 1.05
(1,1,1,1,1,1,BU:1.05); Leuenberger M. and Frischknecht R. (2010) Life Cycle Assessment of Swiss Electricity Mixes. implemented in ecoinvent data v2.2

- 45 -
Tab. 25: Meta information to the unit process raw d ata of the biomass substrates coffee grounds and ol ive pomace
Tab. 26: Meta information to the unit process raw d ata of the mixtures “horse dung and wood chips”, “s lurry solids and bark chips”
ReferenceFunction Namecoffee ground pellets, at
regional storehousepoultry litter pellets, at regional storehouse
olive pomace, burned in boiler furnace, at oil mill
coffee ground pellets, burned in wood furnace
25kW
heat, olive pomace, at boiler furnace, in oil mill
heat, coffee ground pellets, in wood furnace
25kW
disposal, ash olive pomace, to landfarming
disposal, ash coffee ground pellets, to
landfarming
olive pomace, dried, at oil mill
coffee ground pellets, on site
poultry litter pellets, on site
coffee ground pellets, burned in furnace, produced on site
heat, coffee ground pellets, burned in
furnace, produced on site
Geography Location CH CH CY CH CY CH CY CH CY CH CH CH CHReferenceFunction InfrastructureProcess 0 0 0 0 0 0 0 0 0 0 0 0 0ReferenceFunction Unit m3 m3 MJ MJ MJ MJ kg kg kg m3 m3 MJ MJ
IncludedProcesses
This data set includes the production of the pellets and the transport to the regional storage centre
This data set includes the production of the pellets and the transport to the regional storage centre
This data set describes the emission into air caused by the combustion, infrastructure, fuel input and transport are included
This data set describes the emission into air caused by the combustion, infrastructure, fuel input and transport are included
This data set describes the efficiency of the combustion
This data set describes the efficiency of the combustion
This data set describes the disposal of the ash, only spreading of the ash is included (no transport)
This data set describes the disposal of the ash, only spreading of the ash is included (no transport)
This data set includes the drying process of the olive pomace on site (without transport)
This data set includes the production of the pellets on site (without transport)
This data set includes the production of the pellets on site (without transport)
This data set describes the emission into air caused by the combustion, infrastructure, fuel input and transport are included
This data set describes the efficiency of the combustion
LocalNameKaffeesatzpellets, ab Regionallager
Hühnermistpellets, ab Regionallager
Oliventrester, in Kesselfeuerung, in Ölmühle
Kaffeesatzpellets, in Holzkessel 25kW
Nutzwärme, Oliventrester, ab Kesselfeuerung, in Ölmühle
Nutzwärme, Kaffeesatzpellets, in Holzkessel 25kW
Entsorgung, Asche Oliventrester, in Landfarming
Entsorgung, Asche Kaffeesatzpellets, in Landfarming
Oliventrester, getrocknet, in Ölmühle
Kaffeesatzpellets, am Standort
Hühnermistpellets, am Standort
Kaffeesatzpellets, in Feuerung, produziert am Standort
Nutzwärme, Kaffeesatzpellets, in Feuerung, produziert am Standort
Synonyms 0 0 0 0 0 0 0 0 0 0 0 0 0
GeneralComment
Based on ecoinvent dataset "wood pellets, u=10%, at storehouse, RER, [m3]"; own calculations: 3.78 MJ required for drying one kg water; bulk density coffee pellets 650 kg/m3; 0.7 kg water/kg fuel removed from coffee ground
Based on ecoinvent dataset "wood pellets, u=10%, at storehouse, RER, [m3]"; own calculations: 3.78 MJ required for drying one kg water; bulk density poultry litter pellets 500 kg/m3; 0.57 kg water/kg fuel removed from poultry litter
Air emission from combustion data completed with ecoinvent inventory of "logs, mixed, burned in wood heater 6kW"; LHW 14.82 MJ/kg; Disposal ash: 50% landfarming, 50% municipal incineration
Air emission coffee ground data completed with ecoinvent inventory of "pellets, mixed, burned in furnace 15kW"; LHW: 17.4 MJ/kg; bulk density 650 kg/m3; Disposal ash: 50% landfarming, 50% municipal incineration
Provision of heat with efficiency factor 0.85 (estimated)
Provision of heat with efficiency factor 0.85 (estimated)
Ash composition data completed with the ecoinvent inventory of "disposal, wood ash mixture, pure, 0% water, to landfarming"
Ash composition data completed with the ecoinvent inventory of "disposal, wood ash mixture, pure, 0% water, to landfarming"
Own calculations: 3.78 MJ required for drying one kg water; 0.72 kg water/kg fuel removed from olive pomace
Based on ecoinvent dataset "wood pellets, u=10%, at storehouse, RER, [m3]"; own calculations: 3.78 MJ required for drying one kg water; bulk density coffee pellets 650 kg/m3; 0.7 kg water/kg fuel removed from coffee ground
Based on ecoinvent dataset "wood pellets, u=10%, at storehouse, RER, [m3]"; own calculations: 3.78 MJ required for drying one kg water; bulk density poultry litter pellets 500 kg/m3; 0.57 kg water/kg fuel removed from poultry litter
Air emission coffee ground data completed with ecoinvent inventory of "pellets, mixed, burned in furnace 15kW"; LHW: 17.4 MJ/kg; bulk density 650 kg/m3; Disposal ash: 50% landfarming, 50% municipal incineration
Provision of heat with efficiency factor 0.85 (estimated); Disposal ash: 50% landfarming, 50% municipal incineration
InfrastructureIncluded 1 1 1 1 1 1 1 1 1 1 1 1 1Category biomass biomass biomass biomass biomass biomass waste management waste management biomass biomass biomass biomass biomassSubCategory fuels fuels heating systems heating systems heating systems heating systems landfarming landfarming fuels fuels fuels heating systems heating systemsLocalCategory Biomasse Biomasse Biomasse Biomasse Biomasse Biomasse Entsorgungssysteme Entsorgungssysteme Biomasse Biomasse Biomasse Biomasse BiomasseLocalSubCategory Brenn- und Treibstoffe Brenn- und Treibstoffe Heizungssysteme Heizungssysteme Heizungssysteme Heizungssysteme Landfarming Landfarming Brenn- und Treibstoffe Brenn- und Treibstoffe Brenn- und Treibstoffe Heizungssysteme HeizungssystemeFormulaStatisticalClassificationCASNumber
TimePeriod StartDate 2008 2001 2006 2009 2006 2009 2006 2008 2006 2008 2001 2009 2009EndDate 2008 2001 2006 2009 2006 2009 2006 2008 2006 2008 2001 2009 2009DataValidForEntirePerio 1 1 1 1 1 1 1 1 1 1 1 1 1
OtherPeriodTextCollection of data and publication.
Collection of data and publication.
Collection of data and publication.
Collection of data and publication.
Collection of data and publication.
Collection of data and publication.
Collection of data and publication.
Collection of data and publication.
Collection of data and publication.
Collection of data and publication.
Collection of data and publication.
Collection of data and publication.
Collection of data and publication.
Geography Text
The inventory is modelled for pellet production in Switzerland
The inventory is modelled for pellet production in Switzerland
The inventory is modelled for a typical production area for olives in the Lythrodontas region in Cyprus.
The inventory is modelled for a pilot plant in Switzerland
The inventory is modelled for a typical production area for olives in the Lythrodontas region in Cyprus.
The inventory is modelled for a pilot plant in Switzerland
The inventory is modelled for a typical production area for olives in the Lythrodontas region in Cyprus.
The inventory is modelled for a pilot plant in Switzerland
The inventory is modelled for a typical production area for olives in the Lythrodontas region in Cyprus.
The inventory is modelled for pellet production in Switzerland
The inventory is modelled for pellet production in Switzerland
The inventory is modelled for a pilot plant in Switzerland
The inventory is modelled for a pilot plant in Switzerland
Technology Text none none Boiler Furnace Furnace 25kW Boiler Furnace Furnace 25kW none none none none none Furnace 25kW Furnace 25kWRepresentativeness Percent 0 0 0 0 0 0 0 0 0 0 0 0 0
ProductionVolume unknown unknown unknown unknown unknown unknown unknown unknown unknown unknown unknown unknown unknownSamplingProcedure Literature Literature Literature Literature Literature Literature Literature Literature Literature Literature Literature Literature Literature
Extrapolations
Drying and pellet manufacturing process estimated with data for wood drying and wood pellet production
Drying and pellet manufacturing process estimated with data for wood drying and wood pellet production
Several air emissions estimated with data for wood combustion.
Several air emissions estimated with data for wood combustion.
none noneash composition estimated with data for wood ash
ash composition estimated with data for wood ash
none
Drying and pellet manufacturing process estimated with data for wood drying and wood pellet production
Drying and pellet manufacturing process estimated with data for wood drying and wood pellet production
Several air emissions estimated with data for wood combustion.
none
UncertaintyAdjustments none none none none none none none none none none none none none
Details 29.04.2011 29.04.2011 29.04.2011 29.04.2011 29.04.2011 29.04.2011 29.04.2011 29.04.2011 29.04.2011 29.04.2011 29.04.2011 29.04.2011 29.04.2011
OtherDetails
Z:\ESU-Docs\Projekte laufend\321 FP Biomasse Verbrennung Feste Substrate\EcoSpold\[321_Biomasse_6-30kW-v1.0.xlsx]X-Process
Z:\ESU-Docs\Projekte laufend\321 FP Biomasse Verbrennung Feste Substrate\EcoSpold\[321_Biomasse_6-30kW-v1.0.xlsx]X-Process
Z:\ESU-Docs\Projekte laufend\321 FP Biomasse Verbrennung Feste Substrate\EcoSpold\[321_Biomasse_6-30kW-v1.0.xlsx]X-Process
Z:\ESU-Docs\Projekte laufend\321 FP Biomasse Verbrennung Feste Substrate\EcoSpold\[321_Biomasse_6-30kW-v1.0.xlsx]X-Process
Z:\ESU-Docs\Projekte laufend\321 FP Biomasse Verbrennung Feste Substrate\EcoSpold\[321_Biomasse_6-30kW-v1.0.xlsx]X-Process
Z:\ESU-Docs\Projekte laufend\321 FP Biomasse Verbrennung Feste Substrate\EcoSpold\[321_Biomasse_6-30kW-v1.0.xlsx]X-Process
Z:\ESU-Docs\Projekte laufend\321 FP Biomasse Verbrennung Feste Substrate\EcoSpold\[321_Biomasse_6-30kW-v1.0.xlsx]X-Process
Z:\ESU-Docs\Projekte laufend\321 FP Biomasse Verbrennung Feste Substrate\EcoSpold\[321_Biomasse_6-30kW-v1.0.xlsx]X-Process
Z:\ESU-Docs\Projekte laufend\321 FP Biomasse Verbrennung Feste Substrate\EcoSpold\[321_Biomasse_6-30kW-v1.0.xlsx]X-Process
Z:\ESU-Docs\Projekte laufend\321 FP Biomasse Verbrennung Feste Substrate\EcoSpold\[321_Biomasse_6-30kW-v1.0.xlsx]X-Process
Z:\ESU-Docs\Projekte laufend\321 FP Biomasse Verbrennung Feste Substrate\EcoSpold\[321_Biomasse_6-30kW-v1.0.xlsx]X-Process
Z:\ESU-Docs\Projekte laufend\321 FP Biomasse Verbrennung Feste Substrate\EcoSpold\[321_Biomasse_6-30kW-v1.0.xlsx]X-Process
Z:\ESU-Docs\Projekte laufend\321 FP Biomasse Verbrennung Feste Substrate\EcoSpold\[321_Biomasse_6-30kW-v1.0.xlsx]X-Process
- 46 -
ReferenceFunction Namehorse dung and waste wood
chips, at farmslurry solids and bark chips,
at farm
poultry litter pellets, burned in rotating grate furnace 250-
350kW
horse dung and waste wood chips, burned in grate furnace
500-600kW
slurry solids and bark chips, burned in bark furnace 1MW
heat, poultry litter pellets, in rotating grate furnace 250-
350kW
heat, horse dung and waste wood chips, in grate furnace
500-600kW
heat, slurry solids and bark chips, in bark furnace 1MW
disposal, ash poultry litter pellets, to landfarming
disposal, ash horse dung and waste wood chips, to
landfarming
disposal, ash slurry solids and bark chips, to
landfarming
poultry litter pellets, burned in furnace, produced on site
heat, poultry litter pellets, burned in furnace, produced
on siteGeography Location CH CH CH CH CH CH CH CH CH CH CH CH CHReferenceFunction InfrastructureProcess 0 0 0 0 0 0 0 0 0 0 0 0 0ReferenceFunction Unit m3 m3 MJ MJ MJ MJ MJ MJ kg kg kg MJ MJ
IncludedProcesses
This data set includes the wood chips. Horse dung as a waste is assumed to be used with zero burden from its production.
This data set includes the bark chips. Slurry as a waste is assumed to be used with zero burden from its production.
This data set includes fuel, infrastructure, ash disposal and air emissions.
This data set includes fuel, infrastructure, ash disposal and air emissions.
This data set includes fuel, infrastructure, ash disposal and air emissions.
This data set includes the efficiency of the combustion
This data set includes the efficiency of the combustion
This data set includes the efficiency of the combustion
This data set includes emissions to agricultural soil due to the land farming of ash
This data set includes emissions to agricultural soil due to the land farming of ash
This data set includes the wood chips. Horse dung as a waste is assumed to be used with zero burden from its production.
This data set includes fuel, infrastructure, ash disposal and air emissions.
This data set includes the efficiency of the combustion
LocalNamePferdemist und Abfallholzschnitzel, ab Bauernhof
Güllefeststoffe und Rindenschnitzel, ab Bauernhof
Hühnermistpellets, in rotierender Rostfeuerung 250-350kW
Pferdemist und Abfallholzschnitzel, in Rostfeuerung 500-600kW
Güllefeststoffe und Rindenschnitzel, in Feuerung 1MW
Nutzwärme, Hühnermistpellets, in rotierender Rostfeuerung 250-350kW
Nutzwärme, Pferdemist und Abfallholzschnitzel, in Rostfeuerung 500-600kW
Nutzwärme, Güllefeststoffe und Rindenschnitzel, in Rindenfeuerung 1MW
Entsorgung, Asche Hühnermistpellets, in Landfarming
Entsorgung, Asche Pferdemist und Abfallholzschnitzel, Landfarming
Entsorgung, Asche Güllefeststoffe und Rindenschnitzel, in Landfarming
Hühnermistpellets, in Feuerung, produziert am Standort
Nutzwärme, Hühnermistpellets, in Feuerung, produziert am Standort
Synonyms 0 0 0 0 0 0 0 0 0 0 0 0 0
GeneralComment
Mixture horse dung (67%) and waste wood (33%); lower heating value: 8.4 MJ/kg; bulk density 315 kg/m3
Mixture slurry solids (15.5%) and bark chips (84.5%); lower heating value: 5.4 MJ/kg; bulk density: 300 kg/m3
Air emission data completed with the inventory of wood chips, from forest, mixed, burned in furnace 300kW; lower heating value 13.5 MJ/kg; bulk density: 500kg/m3; Disposal Ash: 25% landfarming, 25% MSWI, 50% sanitary landfill
Air emission data completed with the inventory of wood chips, from forest, mixed, burned in furnace 1000kW; lower heating value: 8.4 MJ/kg; bulk density 315 kg/m3; Disposal Ash: 25% landfarming, 25% MSWI, 50% sanitary landfill
Air emission data completed with the inventory of wood chips, from forest, mixed, burned in furnace 1000kW; lower heating value: 5.4 MJ/kg; bulk density: 300 kg/m3; Disposal Ash: 25% landfarming, 25% MSWI, 50% sanitary landfill
Provision of heat with efficiency factor 0.94
Provision of heat with efficiency factor 0.85 (estimated)
Provision of heat with efficiency factor 0.85 (estimated)
Ash composition data completed with the inventory of disposal, wood ash mixture, pure, 0% water, to landfarming
Ash composition data completed with the inventory of disposal, wood ash mixture, pure, 0% water, to landfarming
Ash composition pig slurry: no information available, modelled equal to horse dung; data completed with the inventory of disposal, wood ash mixture, pure, 0% water, to landfarming;
Air emission data completed with the inventory of wood chips, from forest, mixed, burned in furnace 300kW; lower heating value 13.5 MJ/kg; bulk density: 500kg/m3; Disposal Ash: 25% landfarming, 25% MSWI, 50% sanitary landfill
Provision of heat with efficiency factor 0.94
InfrastructureIncluded 1 1 1 1 1 1 1 1 1 1 1 1 1Category biomass biomass biomass biomass biomass biomass biomass biomass waste management waste management waste management biomass biomassSubCategory fuels fuels heating systems heating systems heating systems heating systems heating systems heating systems landfarming landfarming landfarming heating systems heating systemsLocalCategory Biomasse Biomasse Biomasse Biomasse Biomasse Biomasse Biomasse Biomasse Entsorgungssysteme Entsorgungssysteme Entsorgungssysteme Biomasse BiomasseLocalSubCategory Brenn- und Treibstoffe Brenn- und Treibstoffe Heizungssysteme Heizungssysteme Heizungssysteme Heizungssysteme Heizungssysteme Heizungssysteme Landfarming Landfarming Landfarming Heizungssysteme HeizungssystemeFormulaStatisticalClassificationCASNumber
TimePeriod StartDate 2005 1998 2001 2005 1998 2001 2005 1998 2001 2005 1998 2001 2001EndDate 2005 1998 2001 2005 1998 2001 2005 1998 2001 2005 1998 2001 2001DataValidForEntirePeriod 1 1 1 1 1 1 1 1 1 1 1 1 1
OtherPeriodTextCollection of data and publication.
Collection of data and publication.
Collection of data and publication.
Collection of data and publication.
Collection of data and publication.
Collection of data and publication.
Collection of data and publication.
Collection of data and publication.
Collection of data and publication.
Collection of data and publication.
Collection of data and publication.
Collection of data and publication.
Collection of data and publication.
Geography TextThe inventory is modelled for a pilot plant in Switzerland
The inventory is modelled for a pilot plant in Switzerland
The inventory is modelled for a pilot plant in Switzerland
The inventory is modelled for a pilot plant in Switzerland
The inventory is modelled for a pilot plant in Switzerland
The inventory is modelled for a pilot plant in Switzerland
The inventory is modelled for a pilot plant in Switzerland
The inventory is modelled for a pilot plant in Switzerland
The inventory is modelled for a pilot plant in Switzerland
The inventory is modelled for a pilot plant in Switzerland
The inventory is modelled for a pilot plant in Switzerland
The inventory is modelled for a pilot plant in Switzerland
The inventory is modelled for a pilot plant in Switzerland
Technology TextPreparation of fuel for grate firing 500-600 kW
bark furnace 1MW grate furnace 300kW grate firing 500-600 kW bark furnace 1MW grate furnace 300kW grate firing 500-600 kW bark furnace 1MW grate furnace 300kW grate firing 500-600 kW bark furnace 1MW grate furnace 300kW grate furnace 300kW
Representativeness Percent 0 0 0 0 0 0 0 0 0 0 0 0 0ProductionVolume unknown unknown unknown unknown unknown unknown unknown unknown unknown unknown unknown unknown unknownSamplingProcedure Literature Literature Literature Literature Literature Literature Literature Literature Literature Literature Literature Literature Literature
Extrapolations none noneSeveral air emissions estimated with data for wood combustion.
Several air emissions estimated with data for wood combustion.
Several air emissions estimated with data for wood combustion.
none none none none none noneSeveral air emissions estimated with data for wood combustion.
none
UncertaintyAdjustments none none none none none none none none none none none none noneDetails 29.04.2011 29.04.2011 29.04.2011 29.04.2011 29.04.2011 29.04.2011 29.04.2011 29.04.2011 29.04.2011 29.04.2011 29.04.2011 29.04.2011 29.04.2011
OtherDetails
Z:\ESU-Docs\Projekte laufend\321 FP Biomasse Verbrennung Feste Substrate\EcoSpold\[321_Biomasse_300-1000kW-1.0.xlsx]X-Process
Z:\ESU-Docs\Projekte laufend\321 FP Biomasse Verbrennung Feste Substrate\EcoSpold\[321_Biomasse_300-1000kW-1.0.xlsx]X-Process
Z:\ESU-Docs\Projekte laufend\321 FP Biomasse Verbrennung Feste Substrate\EcoSpold\[321_Biomasse_300-1000kW-1.0.xlsx]X-Process
Z:\ESU-Docs\Projekte laufend\321 FP Biomasse Verbrennung Feste Substrate\EcoSpold\[321_Biomasse_300-1000kW-1.0.xlsx]X-Process
Z:\ESU-Docs\Projekte laufend\321 FP Biomasse Verbrennung Feste Substrate\EcoSpold\[321_Biomasse_300-1000kW-1.0.xlsx]X-Process
Z:\ESU-Docs\Projekte laufend\321 FP Biomasse Verbrennung Feste Substrate\EcoSpold\[321_Biomasse_300-1000kW-1.0.xlsx]X-Process
Z:\ESU-Docs\Projekte laufend\321 FP Biomasse Verbrennung Feste Substrate\EcoSpold\[321_Biomasse_300-1000kW-1.0.xlsx]X-Process
Z:\ESU-Docs\Projekte laufend\321 FP Biomasse Verbrennung Feste Substrate\EcoSpold\[321_Biomasse_300-1000kW-1.0.xlsx]X-Process
Z:\ESU-Docs\Projekte laufend\321 FP Biomasse Verbrennung Feste Substrate\EcoSpold\[321_Biomasse_300-1000kW-1.0.xlsx]X-Process
Z:\ESU-Docs\Projekte laufend\321 FP Biomasse Verbrennung Feste Substrate\EcoSpold\[321_Biomasse_300-1000kW-1.0.xlsx]X-Process
Z:\ESU-Docs\Projekte laufend\321 FP Biomasse Verbrennung Feste Substrate\EcoSpold\[321_Biomasse_300-1000kW-1.0.xlsx]X-Process
Z:\ESU-Docs\Projekte laufend\321 FP Biomasse Verbrennung Feste Substrate\EcoSpold\[321_Biomasse_300-1000kW-1.0.xlsx]X-Process
Z:\ESU-Docs\Projekte laufend\321 FP Biomasse Verbrennung Feste Substrate\EcoSpold\[321_Biomasse_300-1000kW-1.0.xlsx]X-Process

- 47 -
Tab. 27: Meta information to the unit process raw d ata of disposal of the ash to municipal incineratio n
ReferenceFunction
Name disposal, ash olive pomace, to municipal incinerationdisposal, ash coffee ground pellets, to municipal
incinerationdisposal, ash poultry litter pellets, to municipal
incinerationdisposal, ash horse dung and waste wood chips, to
municipal incinerationdisposal, ash slurry solids and bark chips, to municipal
incineration
Geography Location CH CH CH CH CH
ReferenceFunction InfrastructureProcess 0 0 0 0 0
ReferenceFunction Unit kg kg kg kg kg
ReferenceFunction IncludedProcesses
waste-specific air and water emisions from incineration, auxiliary material consumption for flue gas cleaning. Short-term emissions to river water and long-term emisisons to ground water from slag compartment (from bottom slag) and residual material landfill (from solidified fly ashes and scrubber s lugde). Process energy demands for MSWI.
waste-specific air and water emisions from incineration, auxiliary material consumption for flue gas cleaning. Short-term emissions to river water and long-term emisisons to ground water from slag compartment (from bottom slag) and residual material landfill (from solidified fly ashes and scrubber slugde). Process energy demands for MSWI.
waste-specific air and water emisions from incineration, auxiliary material consumption for flue gas cleaning. Short-term emissions to river water and long-term emisisons to ground water from slag compartment (from bottom slag) and residual material landfill (from solidified fly ashes and scrubber slugde). Process energy demands for MSWI.
waste-specific air and water emisions from incineration, auxiliary material consumption for flue gas cleaning. Short-term emissions to river water and long-term emisisons to ground water from slag compartment (from bottom slag) and residual material landfill (from solidified fly ashes and scrubber s lugde). Process energy demands for MSWI.
waste-specific air and water emisions from incineration, auxiliary material consumption for flue gas cleaning. Short-term emissions to river water and long-term emisisons to ground water from slag compartment (from bottom slag) and residual material landfill (from solidified fly ashes and scrubber slugde). Process energy demands for MSWI.
ReferenceFunction LocalNameEntsorgung, Asche Oliventrester, in Kehrichtverbrennung
Entsorgung, Asche Kaffeesatzpellets, in Kehrichtverbrennung
Entsorgung, Asche Hühnermistpellets, in Kehrichtverbrennung
Entsorgung, Asche Pferdemist und Holzschnitzel, in Kehrichtverbrennung
Entsorgung, Asche Güllefeststoffe und Rindenschnitzel, in Kehrichtverbrennung
ReferenceFunction Synonyms
ReferenceFunction GeneralComment
Inventoried waste contains .waste composition (wet, in ppm): H2O n.a.; O 385540; H n.a.; C 148530; S 9870; N n.a.; P 17050; B n.a.; Cl 3050; Br n.a.; F n.a.; I n.a.; Ag n.a.; As n.a.; Ba n.a.; Cd n.a.; Co n.a.; Cr n.a.; Cu n.a.; Hg n.a.; Mn n.a.; Mo n.a.; Ni n.a.; Pb n.a.; Sb n.a.; Se n.a.; Sn n.a.; V n.a.; Zn n.a.; Be n.a.; Sc n.a.; Sr n.a.; Ti 650; Tl n.a.; W n.a.; Si 69820; Fe 25280; Ca 66750; Al 24100; K
215180; Mg 30230; Na 3950; Share of carbon in waste that is biogenic 100%.Share of iron in waste that is
metallic/recyclable 0%. Net energy produced in MSWI: 0MJ/kg waste electric energy and 0MJ/kg waste thermal
energyAllocation of energy production: no substitution or expansion. Total burden allocated to waste disposal
function of MSWI.One kg of this waste produces 0.5558 kg of s lag and 0.1405 kg of residues, which are landfilled. Additional solidification with 0.0562 kg of cement.
Inventoried waste contains .waste composition (wet, in ppm): H2O n.a.; O 401500; H n.a.; C 12000; S 9200; N n.a.; P 9800; B n.a.; Cl 3200; Br n.a.; F n.a.; I n.a.; Ag n.a.; As 6.7; Ba n.a.; Cd 9.9055; Co 34.483; Cr 31.997; Cu 1020.7; Hg n.a.; Mn 2172.4; Mo 3.7; Ni 65.2; Pb 156.72; Sb 206.9; Se n.a.; Sn 1172.4; V 34.483; Zn 2777.2; Be n.a.; Sc n.a.; Sr n.a.; Ti 1380; Tl n.a.; W n.a.; Si 82600; Fe 22800; Ca 284000; Al 79310; K 54500; Mg
32100; Na n.a.; Share of carbon in waste that is biogenic 100%.Share of iron in waste that is
metallic/recyclable 0%. Net energy produced in MSWI: 0MJ/kg waste electric energy and 0MJ/kg waste thermal
energyAllocation of energy production: no substitution or expansion. Total burden allocated to waste disposal
function of MSWI.One kg of this waste produces 0.7736 kg of slag and 0.1359 kg of residues, which are landfilled. Additional solidification with 0.05436 kg of cement.
Inventoried waste contains .waste composition (wet, in ppm): H2O n.a.; O 287500; H n.a.; C 12000; S 9200; N n.a.; P 112000; B n.a.; Cl 3200; Br n.a.; F n.a.; I n.a.; Ag n.a.; As 6.7; Ba n.a.; Cd 0.22; Co 1.8; Cr 19.5; Cu 426; Hg 0.01; Mn 20000; Mo 3.7; Ni 59; Pb 6.5; Sb n.a.; Se n.a.; Sn n.a.; V 39.5; Zn 910; Be n.a.; Sc n.a.; Sr n.a.; Ti 1380; Tl n.a.; W n.a.; Si 82600; Fe 22800; Ca 284000; Al
20800; K 99000; Mg 44000; Na n.a.; Share of carbon in waste that is biogenic 100%.Share of iron in waste
that is metallic/recyclable 0%. Net energy produced in MSWI: 0MJ/kg waste electric energy and 0MJ/kg waste
thermal energyAllocation of energy production: no substitution or expansion. Total burden allocated to
waste disposal function of MSWI.One kg of this waste produces 0.9728 kg of slag and 0.1665 kg of residues, which are landfilled. Additional solidification with 0.0666 kg of cement.
Inventoried waste contains .waste composition (wet, in ppm): H2O n.a.; O 490900; H n.a.; C 12000; S 9200; N n.a.; P 3920; B n.a.; Cl 204; Br n.a.; F n.a.; I n.a.; Ag n.a.; As 6.7; Ba n.a.; Cd 5; Co 1.8; Cr 19.5; Cu 103; Hg 0.01; Mn 20000; Mo 3.7; Ni 5.52; Pb 16; Sb n.a.; Se n.a.; Sn n.a.; V 39.5; Zn 1020; Be n.a.; Sc n.a.; Sr n.a.; Ti 1380; Tl n.a.; W n.a.; Si 82600; Fe 22800; Ca 284000; Al
20800; K 18860; Mg 32100; Na n.a.; Share of carbon in waste that is biogenic 100%.Share of iron in waste
that is metallic/recyclable 0%. Net energy produced in MSWI: 0MJ/kg waste electric energy and 0MJ/kg waste
thermal energyAllocation of energy production: no substitution or expansion. Total burden allocated to
waste disposal function of MSWI.One kg of this waste produces 0.6717 kg of s lag and 0.1037 kg of residues, which are landfilled. Additional solidification with 0.04149 kg of cement.
Inventoried waste contains .waste composition (wet, in ppm): H2O n.a.; O 363500; H n.a.; C 12000; S 9200; N n.a.; P 83654; B n.a.; Cl n.a.; Br n.a.; F n.a.; I n.a.; Ag n.a.; As 6.7; Ba n.a.; Cd 0.86775; Co 1.8; Cr 18.969; Cu 833.59; Hg -0.030194; Mn 20000; Mo 3.7; Ni 4.7161; Pb 12.651; Sb n.a.; Se n.a.; Sn n.a.; V 39.5; Zn 2921.3; Be n.a.; Sc n.a.; Sr n.a.; Ti 1380; Tl n.a.; W n.a.; Si 82600; Fe 22800; Ca n.a.; Al 20800; K 147120; Mg 32100; Na
200960; Share of carbon in waste that is biogenic 100%.Share of iron in waste that is metallic/recyclable
0%. Net energy produced in MSWI: 0MJ/kg waste electric energy and 0MJ/kg waste thermal
energyAllocation of energy production: no substitution or expansion. Total burden allocated to waste disposal
function of MSWI.One kg of this waste produces 0.7604 kg of slag and 0.2264 kg of residues, which are landfilled. Additional solidification with 0.09055 kg of cement.
ReferenceFunction InfrastructureIncluded
ReferenceFunction Category waste management waste management waste management waste management waste management
ReferenceFunction SubCategory municipal incineration municipal incineration municipal incineration municipal incineration municipal incineration
ReferenceFunction LocalCategory Entsorgungssysteme Entsorgungssysteme Entsorgungssysteme Entsorgungssysteme Entsorgungssysteme
ReferenceFunction LocalSubCategory Kehrichtverbrennung Kehrichtverbrennung Kehrichtverbrennung Kehrichtverbrennung Kehrichtverbrennung
ReferenceFunction Formula
ReferenceFunctionStatisticalClassification
ReferenceFunction CASNumber
TimePeriod StartDate 1994 1994 1994 1994 1994
TimePeriod EndDate 2000 2000 2000 2000 2000
TimePeriodDataValidForEntirePeriod
1 1 1 1 1
TimePeriod OtherPeriodText
Waste composition as given in literature reference, theoretical data or other source. Transfer coefficients for modern Swiss MSWI. Emission speciation based on early 90ies data.
Waste composition as given in literature reference, theoretical data or other source. Transfer coefficients for modern Swiss MSWI. Emission speciation based on early 90ies data.
Waste composition as given in literature reference, theoretical data or other source. Transfer coefficients for modern Swiss MSWI. Emission speciation based on early 90ies data.
Waste composition as given in literature reference, theoretical data or other source. Transfer coefficients for modern Swiss MSWI. Emission speciation based on early 90ies data.
Waste composition as given in literature reference, theoretical data or other source. Transfer coefficients for modern Swiss MSWI. Emission speciation based on early 90ies data.
Geography Text
Specific to the technology mix encountered in Switzerland in 2000. Well applicable to modern incineration practices in Europe, North America or Japan.
Specific to the technology mix encountered in Switzerland in 2000. Well applicable to modern incineration practices in Europe, North America or Japan.
Specific to the technology mix encountered in Switzerland in 2000. Well applicable to modern incineration practices in Europe, North America or Japan.
Specific to the technology mix encountered in Switzerland in 2000. Well applicable to modern incineration practices in Europe, North America or Japan.
Specific to the technology mix encountered in Switzerland in 2000. Well applicable to modern incineration practices in Europe, North America or Japan.
Technology Text
average Swiss MSWI plants in 2000 (grate incinerators) with electrostatic precipitator for fly ash (ESP), wet flue gas scrubber and 29.4% SNCR , 32.2% SCR-high dust , 24.6% SCR-low dust -DeNOx facilities and 13.8% without Denox (by burnt waste, according to Swiss average). Share of waste incinerated in plants with magnetic scrap separation from slag : 50%. Gross electric efficiency technology mix 12.997% and Gross thermal efficiency technology mix 25.57%
average Swiss MSWI plants in 2000 (grate incinerators) with electrostatic precipitator for fly ash (ESP), wet flue gas scrubber and 29.4% SNCR , 32.2% SCR-high dust , 24.6% SCR-low dust -DeNOx facilities and 13.8% without Denox (by burnt waste, according to Swiss average). Share of waste incinerated in plants with magnetic scrap separation from slag : 50%. Gross electric efficiency technology mix 12.997% and Gross thermal efficiency technology mix 25.57%
average Swiss MSWI plants in 2000 (grate incinerators) with electrostatic precipitator for fly ash (ESP), wet flue gas scrubber and 29.4% SNCR , 32.2% SCR-high dust , 24.6% SCR-low dust -DeNOx facilities and 13.8% without Denox (by burnt waste, according to Swiss average). Share of waste incinerated in plants with magnetic scrap separation from slag : 50%. Gross electric efficiency technology mix 12.997% and Gross thermal efficiency technology mix 25.57%
average Swiss MSWI plants in 2000 (grate incinerators) with electrostatic precipitator for fly ash (ESP), wet flue gas scrubber and 29.4% SNCR , 32.2% SCR-high dust , 24.6% SCR-low dust -DeNOx facilities and 13.8% without Denox (by burnt waste, according to Swiss average). Share of waste incinerated in plants with magnetic scrap separation from slag : 50%. Gross electric efficiency technology mix 12.997% and Gross thermal efficiency technology mix 25.57%
average Swiss MSWI plants in 2000 (grate incinerators) with electrostatic precipitator for fly ash (ESP), wet flue gas scrubber and 29.4% SNCR , 32.2% SCR-high dust , 24.6% SCR-low dust -DeNOx facilities and 13.8% without Denox (by burnt waste, according to Swiss average). Share of waste incinerated in plants with magnetic scrap separation from slag : 50%. Gross electric efficiency technology mix 12.997% and Gross thermal efficiency technology mix 25.57%
RepresentativenessPercent
RepresentativenessProductionVolume
RepresentativenessSamplingProcedure waste-specific calculation based on literature data waste-specific calculation based on literature data waste-specific calculation based on literature data waste-specific calculation based on literature data waste-specific calculation based on literature data
RepresentativenessExtrapolations
Typical elemental transfer coefficients from current studies for modern MSWI, completed with data from coal power plants and estimates, adapted for inert/burnable waste.
Typical elemental transfer coefficients from current studies for modern MSWI, completed with data from coal power plants and estimates, adapted for inert/burnable waste.
Typical elemental transfer coefficients from current studies for modern MSWI, completed with data from coal power plants and estimates, adapted for inert/burnable waste.
Typical elemental transfer coefficients from current studies for modern MSWI, completed with data from coal power plants and estimates, adapted for inert/burnable waste.
Typical elemental transfer coefficients from current studies for modern MSWI, completed with data from coal power plants and estimates, adapted for inert/burnable waste.
RepresentativenessUncertaintyAdjustments
uncertainty of waste input composition data derived from generic formula GSD(c) = N*ln(c)+1
uncertainty of waste input composition data derived from generic formula GSD(c) = N*ln(c)+1
uncertainty of waste input composition data derived from generic formula GSD(c) = N*ln(c)+1
uncertainty of waste input composition data derived from generic formula GSD(c) = N*ln(c)+1
uncertainty of waste input composition data derived from generic formula GSD(c) = N*ln(c)+1
Details automatic validation automatic validation automatic validation automatic validation automatic validation
OtherDetails none none none none none

- 48 -
Tab. 28: Meta information to the unit process raw d ata of disposal of the ash to sanitary landfill
Type Field name, IndexNumber for MSW landfill for MSW landfill for MSW landfill for MSW landfill for MSW landfill
ReferenceFunction Name disposal, ash olive pomace, to sanitary landfill disposal, ash coffee ground pellets, to sanitary landfill disposal, ash poultry litter pellets, to sanitary landfill disposal, ash horse dung and waste wood chips, to sanitary landfilldisposal, ash slurry solids and bark chips, to sanitary landfill
Geography Location CH CH CH CH CH
ReferenceFunction InfrastructureProcess 0 0 0 0 0
ReferenceFunction Unit kg kg kg kg kg
ReferenceFunction IncludedProcesses
Waste-specific short-term emissions to air via landfill gas incineration and landfill leachate. Burdens from treatment of short-term leachate (0-100a) in wastewater treatment plant (including WWTP sludge disposal in municipal incinerator). Long-term emissions from landfill to groundwater (after base lining failure).
Waste-specific short-term emissions to air via landfill gas incineration and landfill leachate. Burdens from treatment of short-term leachate (0-100a) in wastewater treatment plant (including WWTP sludge disposal in municipal incinerator). Long-term emissions from landfill to groundwater (after base lining failure).
Waste-specific short-term emissions to air via landfill gas incineration and landfill leachate. Burdens from treatment of short-term leachate (0-100a) in wastewater treatment plant (including WWTP sludge disposal in municipal incinerator). Long-term emissions from landfill to groundwater (after base lining failure).
Was te-specific short-term emissions to air via landfill gas incineration and landfill leachate. Burdens from treatment of short-term leachate (0-100a) in wastewater treatment plant (including WWTP s ludge disposal in municipal incinerator). Long-term emiss ions from landfill to groundwater (after base lining failure).
Waste-specific short-term emissions to air via landfill gas incineration and landfill leachate. Burdens from treatment of short-term leachate (0-100a) in wastewater treatment plant (including WWTP sludge disposal in municipal incinerator). Long-term emissions from landfill to groundwater (after base lining failure).
ReferenceFunction LocalName Entsorgung, Asche Oliventrester, in Reaktordeponie Entsorgung, Asche Kaffeesatzpellets, in Reaktordeponie Entsorgung, Asche Hühnermistpellets, in Reaktordeponie Entsorgung, Asche Pferdemist und Holzschnitzel, in ReaktordeponieEntsorgung, Asche Güllefeststoffe und Rindenschnitzel, in Reaktordeponie
ReferenceFunction Synonyms
ReferenceFunction GeneralComment
Inventoried waste contains .was te composition (wet, in ppm): H2O n.a.; O 385540; H n.a.; C 148530; S 9870; N n.a.; P 17050; B n.a.; Cl 3050; Br n.a.; F n.a.; I n.a.; Ag n.a.; As n.a.; Ba n.a.; Cd n.a.; Co n.a.; Cr n.a.; Cu n.a.; Hg n.a.; Mn n.a.; Mo n.a.; Ni n.a.; Pb n.a.; Sb n.a.; Se n.a.; Sn n.a.; V n.a.; Zn n.a.; Be n.a.; Sc n.a.; Sr n.a.; Ti 650; Tl n.a.; W n.a.; Si 69820; Fe 25280; Ca 66750; Al
24100; K 215180; Mg 30230; Na 3950; Share of carbon in waste that is biogenic 100%.Overall degradability of waste
during 100 years: 5%.
Inventoried waste contains .waste composition (wet, in ppm): H2O n.a.; O 401500; H n.a.; C 12000; S 9200; N n.a.; P 9800; B n.a.; Cl 3200; Br n.a.; F n.a.; I n.a.; Ag n.a.; As 6.7; Ba n.a.; Cd 9.9055; Co 34.483; Cr 31.997; Cu 1020.7; Hg n.a.; Mn 2172.4; Mo 3.7; Ni 65.2; Pb 156.72; Sb 206.9; Se n.a.; Sn 1172.4; V 34.483; Zn 2777.2; Be n.a.; Sc n.a.; Sr n.a.; Ti 1380; Tl n.a.; W n.a.; Si 82600; Fe 22800; Ca 284000; Al 79310; K 54500; Mg
32100; Na n.a.; Share of carbon in was te that is biogenic 100%.Overall degradability of was te during 100 years: 5%.
Inventoried waste contains .was te composition (wet, in ppm): H2O n.a.; O 287500; H n.a.; C 12000; S 9200; N n.a.; P 112000; B n.a.; Cl 3200; Br n.a.; F n.a.; I n.a.; Ag n.a.; As 6.7; Ba n.a.; Cd 0.22; Co 1.8; Cr 19.5; Cu 426; Hg 0.01; Mn 20000; Mo 3.7; Ni 59; Pb 6.5; Sb n.a.; Se n.a.; Sn n.a.; V 39.5; Zn 910; Be n.a.; Sc n.a.; Sr n.a.; Ti 1380; Tl n.a.; W n.a.; Si 82600; Fe 22800; Ca 284000;
Al 20800; K 99000; Mg 44000; Na n.a.; Share of carbon in waste that is biogenic 100%.Overall degradability of waste
during 100 years: 5%.
Inventoried was te contains .waste composition (wet, in ppm): H2O n.a.; O 490900; H n.a.; C 12000; S 9200; N n.a.; P 3920; B n.a.; Cl 204; Br n.a.; F n.a.; I n.a.; Ag n.a.; As 6.7; Ba n.a.; Cd 5; Co 1.8; Cr 19.5; Cu 103; Hg 0.01; Mn 20000; Mo 3.7; Ni 5.52; Pb 16; Sb n.a.; Se n.a.; Sn n.a.; V 39.5; Zn 1020; Be n.a.; Sc n.a.; Sr n.a.; Ti 1380; Tl n.a.; W n.a.; Si 82600; Fe 22800; Ca 284000; Al
20800; K 18860; Mg 32100; Na n.a.; Share of carbon in waste that is biogenic 100%.Overall degradability of was te during
100 years: 5%.
Inventoried waste contains .was te composition (wet, in ppm): H2O n.a.; O 363500; H n.a.; C 12000; S 9200; N n.a.; P 83654; B n.a.; Cl n.a.; Br n.a.; F n.a.; I n.a.; Ag n.a.; As 6.7; Ba n.a.; Cd 0.86775; Co 1.8; Cr 18.969; Cu 833.59; Hg -0.030194; Mn 20000; Mo 3.7; Ni 4.7161; Pb 12.651; Sb n.a.; Se n.a.; Sn n.a.; V 39.5; Zn 2921.3; Be n.a.; Sc n.a.; Sr n.a.; Ti 1380; Tl n.a.; W n.a.; Si 82600; Fe 22800; Ca n.a.; Al 20800; K 147120; Mg 32100; Na 200960; Share of carbon in waste that is biogenic 100%.Overall degradability of waste during 100 years: 5%.
ReferenceFunction InfrastructureIncluded
ReferenceFunction Category waste management waste management waste management waste management waste management
ReferenceFunction SubCategory sanitary landfill sanitary landfill sanitary landfill sanitary landfill sanitary landfill
ReferenceFunction LocalCategory Entsorgungssysteme Entsorgungssysteme Entsorgungssysteme Entsorgungssysteme Entsorgungssysteme
ReferenceFunction LocalSubCategory Reaktordeponie Reaktordeponie Reaktordeponie Reaktordeponie Reaktordeponie
ReferenceFunction Formula
ReferenceFunction StatisticalClassification
ReferenceFunction CASNumber
TimePeriod StartDate 1994 1994 1994 1994 1994
TimePeriod EndDate 2000 2000 2000 2000 2000
TimePeriod DataValidForEntirePeriod 1 1 1 1 1
TimePeriod OtherPeriodText
Geography TextTechnology encountered in Switzerland in 2000. Landfill includes base seal, leachate collection system, treatment of leachate in municipal wastewater treatment plant.
Technology encountered in Switzerland in 2000. Landfill includes base seal, leachate collection system, treatment of leachate in municipal wastewater treatment plant.
Technology encountered in Switzerland in 2000. Landfill includes base seal, leachate collection system, treatment of leachate in municipal wastewater treatment plant.
Technology encountered in Switzerland in 2000. Landfill includes base seal, leachate collection system, treatment of leachate in municipal wastewater treatment plant.
Technology encountered in Switzerland in 2000. Landfill includes base seal, leachate collection system, treatment of leachate in municipal wastewater treatment plant.
Technology Text
Swiss municipal sanitary landfill for biogenic or untreated municipal waste ('reactive organic landfill'). Landfill gas and leachate collection system. Recultivation and monitoring for 150 years after closure.
Swiss municipal sanitary landfill for biogenic or untreated municipal waste ('reactive organic landfill'). Landfill gas and leachate collection system. Recultivation and monitoring for 150 years after closure.
Swiss municipal sanitary landfill for biogenic or untreated municipal waste ('reactive organic landfill'). Landfill gas and leachate collection system. Recultivation and monitoring for 150 years after closure.
Swiss municipal sanitary landfill for biogenic or untreated municipal waste ('reactive organic landfill'). Landfill gas and leachate collection system. Recultivation and monitoring for 150 years after closure.
Swiss municipal sanitary landfill for biogenic or untreated municipal waste ('reactive organic landfill'). Landfill gas and leachate collection system. Recultivation and monitoring for 150 years after closure.
Representativeness Percent
Representativeness ProductionVolume
Representativeness SamplingProcedure
Landfill model based on observed leachate concentrations in literature. Extrapolated to 60'000 years heeding chemical characteristics. Initial was te composition from various literature sources.
Landfill model based on observed leachate concentrations in literature. Extrapolated to 60'000 years heeding chemical characteris tics. Initial waste composition from various literature sources.
Landfill model based on observed leachate concentrations in literature. Extrapolated to 60'000 years heeding chemical characteristics. Initial waste composition from various literature sources.
Representativeness Extrapolations
Representativeness UncertaintyAdjustments
uncertainty of waste input composition data derived from generic formula GSD(c) = N*ln(c)+1. Mean long-term emissions are the emissions until the next glacial period occurs (in 60'000a) and the landfill is eroded. Maximal long-term emiss ions are the complete emissions of all landfilled material (except Cr). Minimal long-term emiss ions are derived implicitly from the mean and maximal values assuming a lognormal dis tribution.
uncertainty of waste input composition data derived from generic formula GSD(c) = N*ln(c)+1. Mean long-term emissions are the emissions until the next glacial period occurs (in 60'000a) and the landfill is eroded. Maximal long-term emissions are the complete emissions of all landfilled material (except Cr). Minimal long-term emissions are derived implicitly from the mean and maximal values assuming a lognormal distribution.
uncertainty of waste input composition data derived from generic formula GSD(c) = N*ln(c)+1. Mean long-term emiss ions are the emissions until the next glacial period occurs (in 60'000a) and the landfill is eroded. Maximal long-term emissions are the complete emissions of all landfilled material (except Cr). Minimal long-term emiss ions are derived implicitly from the mean and maximal values assuming a lognormal dis tribution.
uncertainty of waste input composition data derived from generic formula GSD(c) = N*ln(c)+1. Mean long-term emissions are the emissions until the next glacial period occurs (in 60'000a) and the landfill is eroded. Maximal long-term emissions are the complete emiss ions of all landfilled material (except Cr). Minimal long-term emissions are derived implicitly from the mean and maximal values assuming a lognormal distribution.
uncertainty of waste input composition data derived from generic formula GSD(c) = N*ln(c)+1. Mean long-term emissions are the emissions until the next glacial period occurs (in 60'000a) and the landfill is eroded. Maximal long-term emissions are the complete emissions of all landfilled material (except Cr). Minimal long-term emiss ions are derived implicitly from the mean and maximal values assuming a lognormal distribution.
- 49 -
7.7. Data quality All the measurements were performed in pilot plants. Therefore the measurements are not comparable to a continuous operation of the plants. No adjustments have been made to the emission factors in order to account for the measurements in pilot plants. For all substrates only the total amount of suspended particulate matter (TSP) in the flue gas was measured. The particle distribution had to be extrapolated from other measurements (Berdowski et al. 2001). This resulted in a fraction of 90% of the TSP belonging to the smallest category of the particulate matter (PM) smaller than 2.5 um. Because the combustion process of the biomass is worse compared to the combustion of wood, it is expected that the amount of small particles is smaller for the biomass fuels than for the wooden fuels, but there was no data available to prove this assumption. Therefore the same particle distribution as for the combustion of wooden fuels was used. This might lead to a higher environmental impact because the environmental impact of smaller particles is higher than the environmental impact of bigger particles. Because of the availability, the up-to-dateness and the quality of the data an inclusion in the ecoinvent data base is only recommended for the data sets for coffee ground pellets, poultry litter pellets and horse dung mixed with wood chips.
7.7.1. Olive pomace Data quality for olives pomace is debatable. The ash composition and the air emissions during the combustion are documented in Jauhiainen et al. (2005), but in the measurements of Jauhiainen et al. (2005) no heavy metals emissions, no nitrogen oxide emissions and no particle emissions into air are reported, as well as there are no heavy metals detected in the ash after combustion. Because the heavy metal emissions and the heavy metal content of the ash have a high impact on the result of the ecological scarcity method 2006 it is recommended to consider this fact when comparing the olive pomace with the other substrates, especially in case of the disposal of the ash.
7.7.2. Coffee grounds For coffee grounds there are measurements for the nitrogen oxides, carbon monoxides and particle emissions from the combustion in Waelti & Keller (2009) as well as the metal content of the fuel (SGS-Institut-Fresenius 2008). This covers the factors with the highest impact on the result of the ecological scarcity method 2006. Because of the recent measurements and the emissions measured, the air emission data quality for coffee grounds is sound. For the ash composition of the coffee grounds there was no information available, but there was detailed information on the composition of the fuel regarding metals and heavy metals in SGS-Institut-Fresenius (2008). In order to estimate the transfer of the heavy metals to the ash, the heavy metal balance of the combustion process was calculated, assuming that all heavy metals which are not emitted into air during the combustion are transferred to the ash. This calculation provides a reliable estimate for the heavy metal content in the ash.
7.7.3. Poultry litter The data quality for poultry litter is considered as sound. The measurements took place in 2001 (Salerno et al. 2001) and as for coffee grounds the key emissions into, namely nitrogen oxides, sulphur oxides, particulate matter and carbon monoxide are measured. The other emissions are again taken from the data sets for wood combustion. For the ash composition there is information on the potassium, phosphorus, magnesium, cadmium, copper, nickel and zinc content of the ash in Salerno et al. (2001). This selection covers the most important metals except of lead in case of the heavy metals.
7.7.4. Horse dung The most important air emissions generated by the combustion of horse dung regarding environmental impact are measured in Bühler et al. (2005). This includes the emissions of nitrogen oxides, sulphur oxides and particulate matter. The basis of the data regarding air emissions is considered as sound.

- 50 -
For the ash composition there is information on the content of phosphorus, potassium, lead, zinc, copper and cadmium in Bühler et al (2007). This covers most of the elements with a high environmental impact
7.7.5. Pig slurry solids For pig slurry there was only information available on the air emissions in Hersener & Bühler (1998). Again the most important air emissions are measured. For the ash composition there was no data available , but there was information on the composition of the fuel regarding metals and heavy metals in Hersener & Bühler (1998). In order to estimate the transfer of the heavy metals to the ash, the heavy metal balance of the combustion process was calculated, assuming that all heavy metals which are not emitted into air during the combustion are transferred to the ash. Because the measurements for pig slurry took place in 1998 and because of the missing data regarding ash composition the data quality for pig slurry solids is considered as the lowest among these five biomass substrates. Further the fuel mixture for slurry solids mainly consists of wood (about 85%, cf. Tab. 14) and rather represents the co-combustion of a small fraction of slurry solids with wood.
- 51 -
8. References
Allica et al. 2001 Allica J. H., Mitre A. J., Bustamante J. A. G., Itoiz C., Blanco F., Alkorta I. and Garbisu C. (2001) Straw quality for its combustion in a straw-fired power plant. In: Biomass and Bioenergy(21), pp. 249-258.
Avraamides & Fatta 2006 Avraamides M. and Fatta D. (2006) Life Cycle Assessment (LCA) as a Decision Support Tool (DST) for the ecoproduction of olive oil", Imple-mentation of Life Cycle Inventory in Lythrodontas region of Cyprus, Task 3.2. University of Cyprus, Nicosia.
Bauer 2007 Bauer C. (2007) Holzenergie. In: Sachbilanzen von Energiesystemen: Grundlagen für den ökologischen Vergleich von Energiesystemen und den Einbezug von Energiesystemen in Ökobilanzen für die Schweiz, Vol. ecoinvent report No. 6-IX, v2.0 (Ed. Dones R.). Paul Scherrer Institut Vil-ligen, Swiss Centre for Life Cycle Inventories, Dübendorf, CH retrieved from: www.ecoinvent.org.
Berdowski et al. 2001 Berdowski J., Visschedijk A., Creemers E., Pulles T., Pacyna J., Fudala J. and Querreveld D. (2001) The Co-ordindate European Programme on Particulate Matter Emission Inventories, Projections and Guidance (CEPMEIP) Database, retrieved from: http://www.air.sk/tno/cepmeip/downloads.php.
Bühler et al. 2005 Bühler R., Hersener J.-L. and Jenni A. (2005) Thermische Nutzung von anspruchsvollen Biomassebrennstoffen - Verbrennungsversuche Frühjahr 2005. Bundesamt für Energie BFE, Bern.
Bühler et al. 2007 Bühler R., Hersener J.-L., Jenni A. and Klippel N. (2007) Thermische Nutzung von anspruchsvollen Biomassebrennstoffen - Versuche Herbst 2006. Bundesamt für Energie, Bern.
Conesa et al. 2009 Conesa J. A., Font R., Fullana A., Martin-Gullon I., Aracil I., Galvez A., Molto J. and Gomez-Rico M. F. (2009) Comparison between emissions from the pyrolysis and combustion of different wastes. In: Journal of Ana-lytical and Applied Pyrolysis(84), pp. 95-102.
Doka 2007 Doka G. (2007) Life Cycle Inventories of Waste Treatment Services. ecoinvent report No. 13, v2.0. EMPA St. Gallen, Swiss Centre for Life Cycle Inventories, Dübendorf, CH, retrieved from: www.ecoinvent.org.
ecoinvent Centre 2010 ecoinvent Centre (2010) ecoinvent data v2.2, ecoinvent reports No. 1-25. Swiss Centre for Life Cycle Inventories, Duebendorf, Switzerland, re-trieved from: www.ecoinvent.org.
EPA 1993 EPA (1993) Emission factor documentation for AP-42 Section 1.8 ba-gasse combustion in sugar mills. United States Environmental Protection Agency, Research Triangle Park.
Frischknecht et al. 2007 Frischknecht R., Jungbluth N., Althaus H.-J., Doka G., Dones R., Heck T., Hellweg S., Hischier R., Nemecek T., Rebitzer G. and Spielmann M. (2007) Overview and Methodology. ecoinvent report No. 1, v2.0. Swiss Centre for Life Cycle Inventories, Dübendorf, CH, retrieved from: www.ecoinvent.org.
Frischknecht et al. 2009 Frischknecht R., Steiner R. and Jungbluth N. (2009) The Ecological Scarcity Method - Eco-Factors 2006: A method for impact assessment in LCA. Federal Office for the Environment FOEN, Zürich und Bern, re-trieved from: www.bafu.admin.ch/publikationen/publikation/01031/index.html?lang=en.
Hackl & Mauschitz 2007 Hackl A. and Mauschitz G. (2007) Emissionen aus Anlagen der öster-reichischen Zementindustrie V, Weitra / Wien, A.
Hässig-Schellhorn 2007 Hässig-Schellhorn J. (2007) Analyse der ökologischen Leistungsfähigkeit der Pelletsproduktion aus Wald- und Restholz. ETH Zürich, Zürich.

- 52 -
Hersener et al. 1997 Hersener J.-L., Meister E., Mediavilla V., Lips A., Rüegg J., Nussbaumer T., Baserga U., Müller D., Dinkel F., Waldeck B., Trauboth-Müller T. and Hirs B. (1997) Schlussbericht Projekt Energiegras/Feldholz. Bundesamt für Energie BfE, Tänikon, CH.
Hersener & Bühler 1998 Hersener J.-L. and Bühler R. (1998) Energetische Nutzung land-wirtschaftlicher Biomasse Band 2 - Energetische Nutzung von Hofdü-ngerfeststoffen. Bundesamt für Energie, Bern.
Hersener & Meier 1999 Hersener J.-L. and Meier U. (1999) Energetisch nutzbares Biomassepo-tential in der Schweiz sowie Stand der Nutzung in ausgewählten EU-Staaten und den USA. Im Auftrag des Bundesamtes für Energie. Bun-desamt für Energie, Bern.
Hersener & Meier 2002 Hersener J.-L. and Meier U. (2002) Vergleich von Energieumwand-lungsverfahren für Gülle (ENKON). Bundesamt für Energie, Bern.
Jauhiainen et al. 2005 Jauhiainen J., Martin-Gullon I., Conesa J. A. and Font R. (2005) Emis-sions from pyrolysis and combustion of olive oil solid waste. In: Journal of Analytical and Applied Pyrolysis(74), pp. 512-517.
Jungbluth et al. 2007a Jungbluth N., Chudacoff M., Dauriat A., Dinkel F., Doka G., Faist Em-menegger M., Gnansounou E., Kljun N., Schleiss K., Spielmann M., Stet-tler C. and Sutter J. (2007a) Life Cycle Inventories of Bioenergy. ecoin-vent report No. 17, v2.0. ESU-services, Uster, CH, retrieved from: www.ecoinvent.org.
Jungbluth et al. 2007b Jungbluth N., Frischknecht R., Faist Emmenegger M., Steiner R. and Tuchschmid M. (2007b) Life Cycle Assessment of BTL-fuel production: Inventory Analysis. RENEW - Renewable Fuels for Advanced Power-trains, Sixth Framework Programme: Sustainable Energy Systems, De-liverable: D 5.2.7. ESU-services, Uster, retrieved from: www.esu-services.ch/projects/renew/.
Jungbluth et al. 2010 Jungbluth N., Frischknecht R., Orthlieb A., Büsser S. and Leuenberger M. (2010) Aktualisierung und Ergänzung der naturemade Kennwertmodelle: Ökobilanzen für die Prüfung des globalen Kriteriums von Energieproduk-ten (Zwischenbericht Juli 2010). ESU-services im Auftrag vom Verein für umweltgerechte Energie (VUE), Uster, retrieved from: www.esu-services.ch/projects/naturemade/.
Llorente & Garcia 2006 Llorente M. J. F. and Garcia J. E. C. (2006) Concentration of elements in woody and herbaceous biomass as a function of the dry ashing tempera-ture. In: Fuel(85), pp. 1273-1279.
LRV 2009 LRV (2009) Luftreinhalte-Verordnung vom 16. Dezember 1985 (LRV): (Stand am 1.1.2009). 814.318.142.1. Schweizerischer Bundesrat, re-trieved from: www.admin.ch/ch/d/sr/c814_318_142_1.html.
Miyazaki et al. 2004 Miyazaki N., Siegenthaler C., Schoenbaum T. and Azuma K. (2004) Ja-pan Environmental Policy Priorities Index (JEPIX) - Calculation of Ecofac-tors for Japan: Method for Environmental Accounting based on the EcoScarcity Principle. 7. International Christian University Social Science Research Institute, Tokyo.
Nemecek et al. 2007 Nemecek T., Heil A., Huguenin O., Meier S., Erzinger S., Blaser S., Dux. D. and Zimmermann A. (2007) Life Cycle Inventories of Agricultural Pro-duction Systems. ecoinvent report No. 15, v2.0. Agroscope FAL Reckenholz and FAT Taenikon, Swiss Centre for Life Cycle Inventories, Dübendorf, CH, retrieved from: www.ecoinvent.org.
Nordic Council of Ministers 1995 Nordic Council of Ministers (1995) LCA-NORDIC technical report no. 10 and special reports no. 1-2., Kopenhagen.
Salerno et al. 2001 Salerno B., Hersener J.-L. and Dinkel F. (2001) APOLLO II - Thermische Nutzung von Hühnermist Phase II. Bundesamt für Energie, Bern.

- 53 -
Schmid & Gaegauf 2008 Schmid M. and Gaegauf C. (2008) Saubere Pelletfeuerung für dezentrale Wärmeerzeugung mit Nicht-Holz-Biomasse-Ressourcen - Zusammenfas-sung Schlussbericht EUREKATI-Projekt. Bundesamt für Energie, Bern.
SGP 1994 SGP (1994) Etude relative à la normalisation écologique des emballages en Belgique, raport final au ministre belge de la santé publique, de l'in-tégration sociale et de l'environnement, Liège.
SGS-Institut-Fresenius 2008 SGS-Institut-Fresenius (2008) Abfalluntersuchung. 544946. SGS INSTI-TUT FRESENIUS GmbH, D-78333 Stockach.
Solomon et al. 2007 Solomon S., Qin D., Manning M., Alley R. B., Berntsen T., Bindoff N. L., Chen Z., Chidthaisong A., Gregory J. M., Hegerl G. C., Heimann M., Hewitson B., Hoskins B. J., Joos F., Jouzel J., Kattsov V., Lohmann U., Matsuno T., Molina M., Nicholls N., Overpeck J., Raga G., Ramaswamy V., Ren J., Rusticucci M., Somerville R., Stocker T. F., Whetton P., Wood R. A. and Wratt D. (2007) Technical Summary. In: Climate Change 2007: The Physical Science Basis. Contribution of Working Group I to the Fourth Assessment Report of the Intergovernemental Panel on Climate Change (IPCC), Cambridge University Press, Cambridge, United King-dom and New York, NY, USA.
van Loo & Koppejan 2007 van Loo S. and Koppejan J. (2007) Handbook of Biomass Combustion and Co-Firing. Earthscan.
Vlyssides et al. 2004 Vlyssides A. G., Loizides M. and Karlis P. K. (2004) Integrated strategic approach for reusing olive oil extraction by-products. In: Journal of Cleaner Production(12), pp. 603-611.
Waelti & Keller 2009 Waelti K. and Keller P. (2009) Emissionsmessungen beim Verbrennen von Biomasse aus Kaffeesatz in Hobag-Holzkessel 25 kW bei Firma Lei-bacher AG, Stein am Rhein. 19-69. UCW Umwelt Controlling + Consult-ing Waelti, Rafz, CH.
Zah et al. 2007 Zah R., Böni H., Gauch M., Hischier R., Lehmann M. and Wäger P. (2007) Ökobilanz von Energieprodukten: Ökologische Bewertung von Bi-otreibstoffen. Schlussbericht. Abteilung Technologie und Gesellschaft, Empa im Auftrag des Bundesamtes für Energie, des Bundesamtes für Umwelt und des Bundesamtes für Landwirtschaft, Bern, retrieved from: www.bfe.admin.ch/energie/00588/00589/00644/index.html?lang=de&msg-id=12653.