Embed Size (px)
Citation preview
Life Cycle Assessment of the treatment of MSW in “the average“ European Waste-to-Energy plant
Jan MandersDeputy President CEWEP
Director AVR van Gansewinkel, The Netherlands
Bordeaux, 12th June 2008
LCA of Waste-to-Energy plants
Why has CEWEP done a Life Cycle Assessment ?
• Contribution to the European Reference Life Cycle Data System (ELCD)
The European Commission is addressing the use of LCA in regulations and directives and one can expect that the data sets will be used for various LCA studies e.g. end-of-life options or product LCAs.
The involvement of CEWEP in this work will enable CEWEP to have influence on the generation of this data set and to improve the existing ones.
ELCD is implemented on a website of the European Commission about Life Cycle Assessment (LCA) which will provide public stakeholders with LCA data.
• LCA type of information can support the communication from our industry to the society and stakeholders in an objective way
LCA of Waste-to-Energy plants
How does LCA work?
• LCA analyses the potential environmental burden of a product or service in its production, use phase and end-of-life.
• All emissions and consumed resources related to the entire life cycle of a product or service (in our case the treatment of waste) are summarized in a Life Cycle Inventory.
• The Life Cycle Inventory is used for an Impact assessment expressed in a set of 10 environmental aspects e.g. Global Warming or Eutrophication.
• The results of an LCA can be used for a multitude of applications:
- Identification of relevant steps in the complete life cycle of products
- Development of sustainable products based on environmental information
- Communication with politics and authorities
- Decision support for the choice of several options
LCA of Waste-to-Energy plants
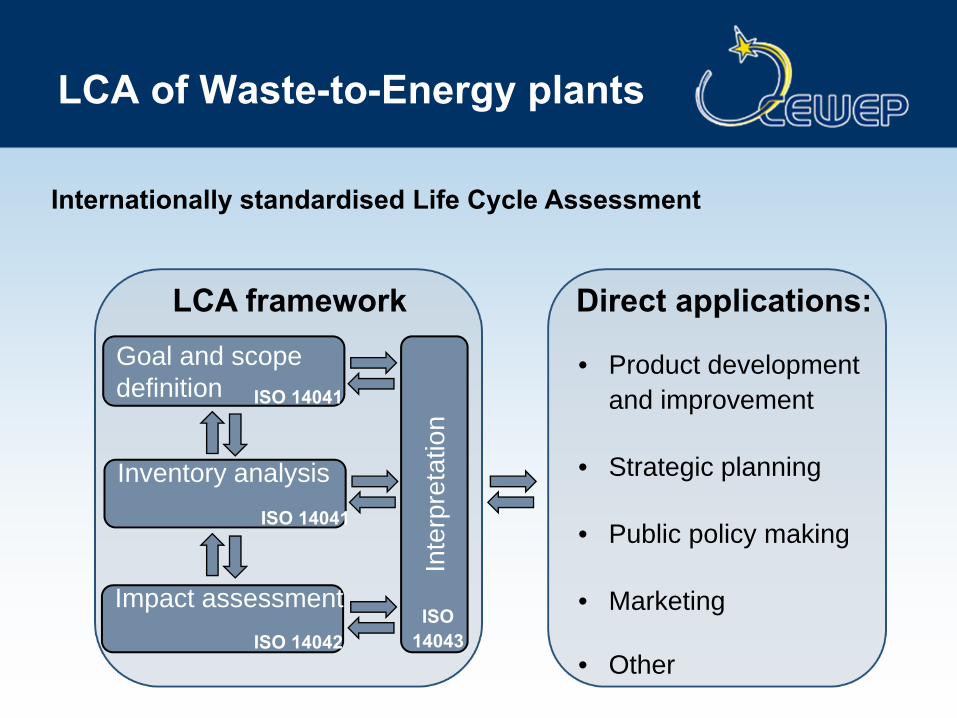
Internationally standardised Life Cycle Assessment
Goal and scope definition
Inventory analysis
Impact assessment
Inte
rpre
tatio
n
LCA framework Direct applications:
• Product development and improvement
• Strategic planning
• Public policy making
• Marketing
• Other
ISO14043
ISO 14041
ISO 14041
ISO 14042
LCA of Waste-to-Energy plants
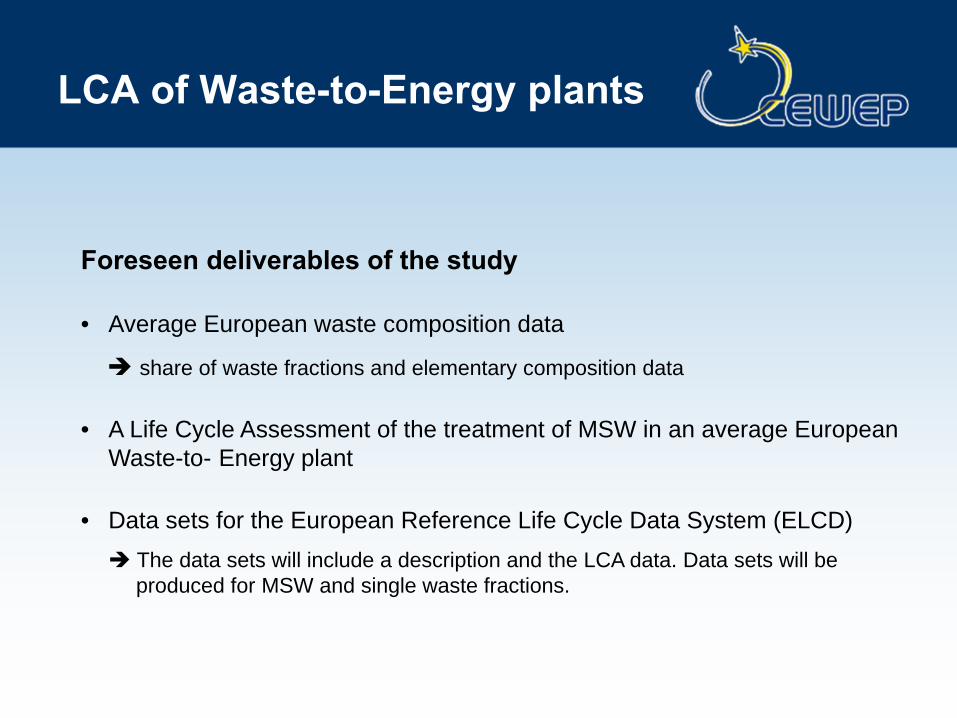
Foreseen deliverables of the study
• Average European waste composition data
share of waste fractions and elementary composition data
• A Life Cycle Assessment of the treatment of MSW in an average European Waste-to- Energy plant
• Data sets for the European Reference Life Cycle Data System (ELCD)The data sets will include a description and the LCA data. Data sets will be produced for MSW and single waste fractions.
LCA of Waste-to-Energy plants
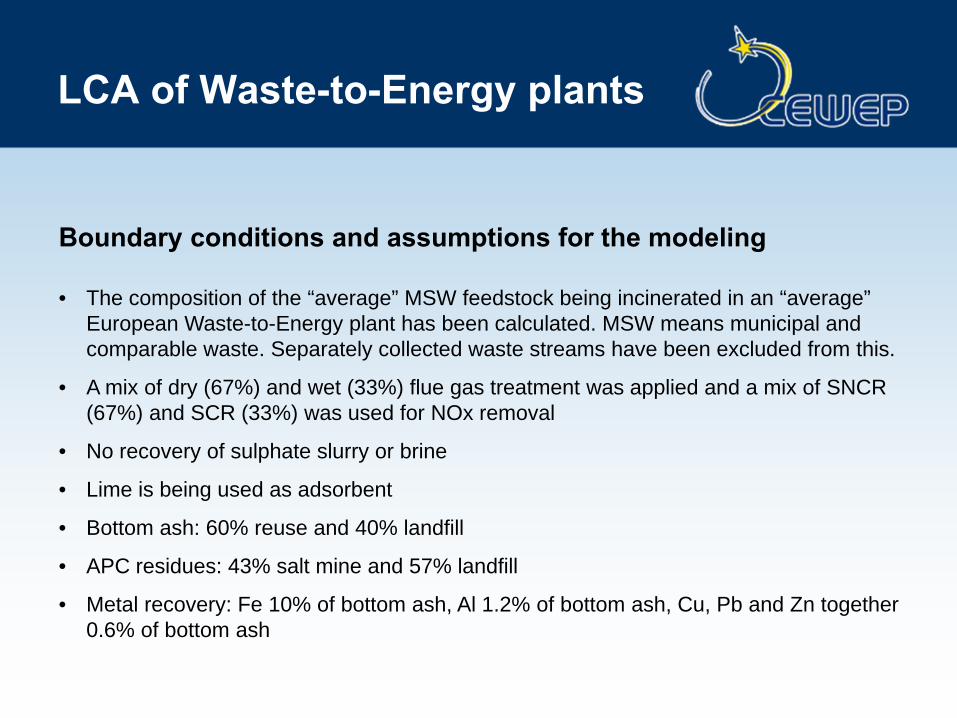
Boundary conditions and assumptions for the modeling
• The composition of the “average” MSW feedstock being incinerated in an “average” European Waste-to-Energy plant has been calculated. MSW means municipal and comparable waste. Separately collected waste streams have been excluded from this.
• A mix of dry (67%) and wet (33%) flue gas treatment was applied and a mix of SNCR (67%) and SCR (33%) was used for NOx removal
• No recovery of sulphate slurry or brine
• Lime is being used as adsorbent
• Bottom ash: 60% reuse and 40% landfill
• APC residues: 43% salt mine and 57% landfill
• Metal recovery: Fe 10% of bottom ash, Al 1.2% of bottom ash, Cu, Pb and Zn together 0.6% of bottom ash
LCA of Waste-to-Energy plants
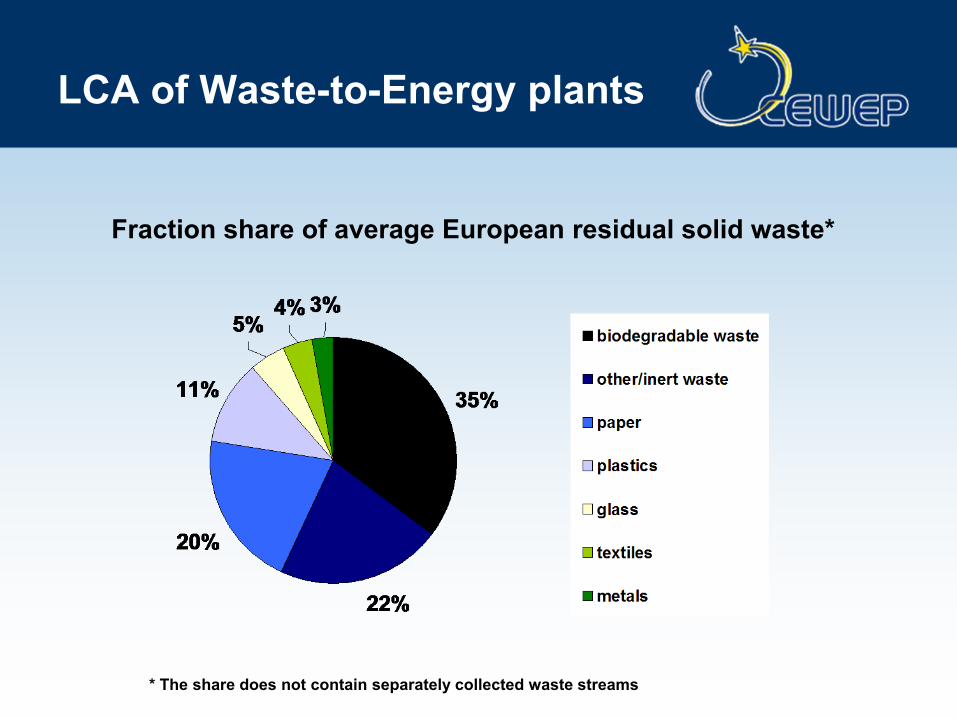
Fraction share of average European residual solid waste*
* The share does not contain separately collected waste streams
LCA of Waste-to-Energy plants
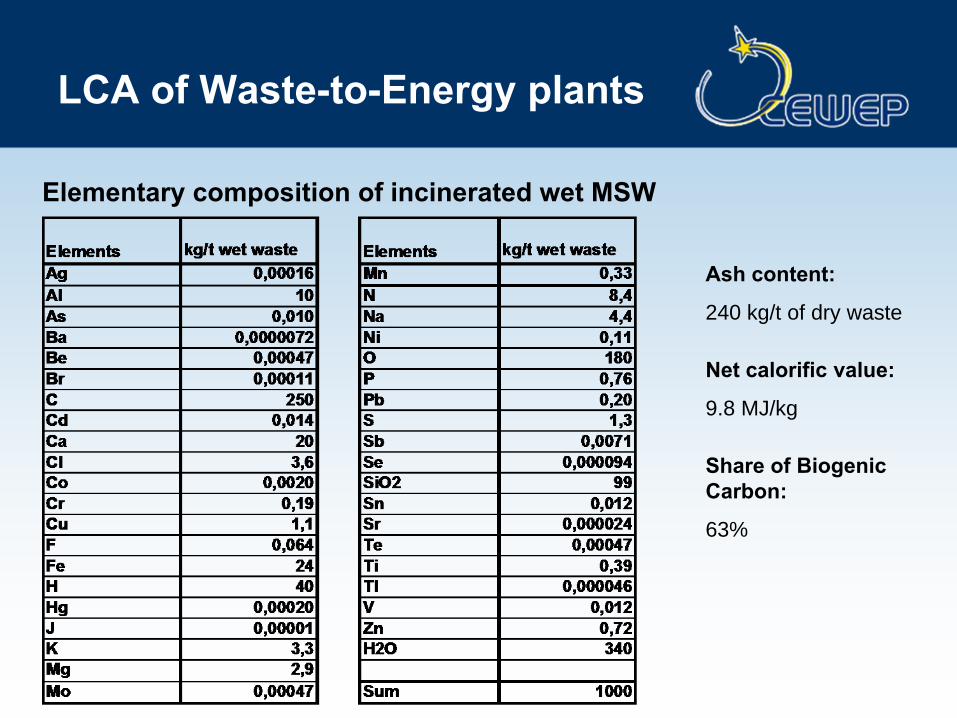
Ash content:
240 kg/t of dry waste
Net calorific value:
9.8 MJ/kg
Share of Biogenic Carbon:
63%
Elementary composition of incinerated wet MSW
LCA of Waste-to-Energy plants
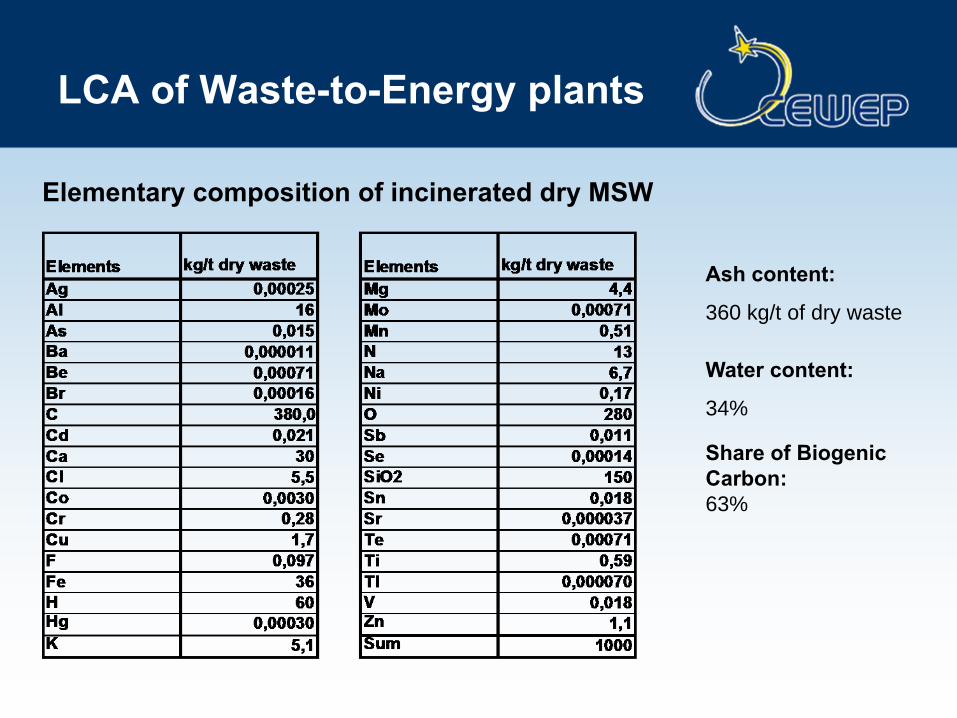
Ash content:
360 kg/t of dry waste
Water content:
34%
Share of Biogenic Carbon:63%
Elementary composition of incinerated dry MSW
LCA of Waste-to-Energy plants
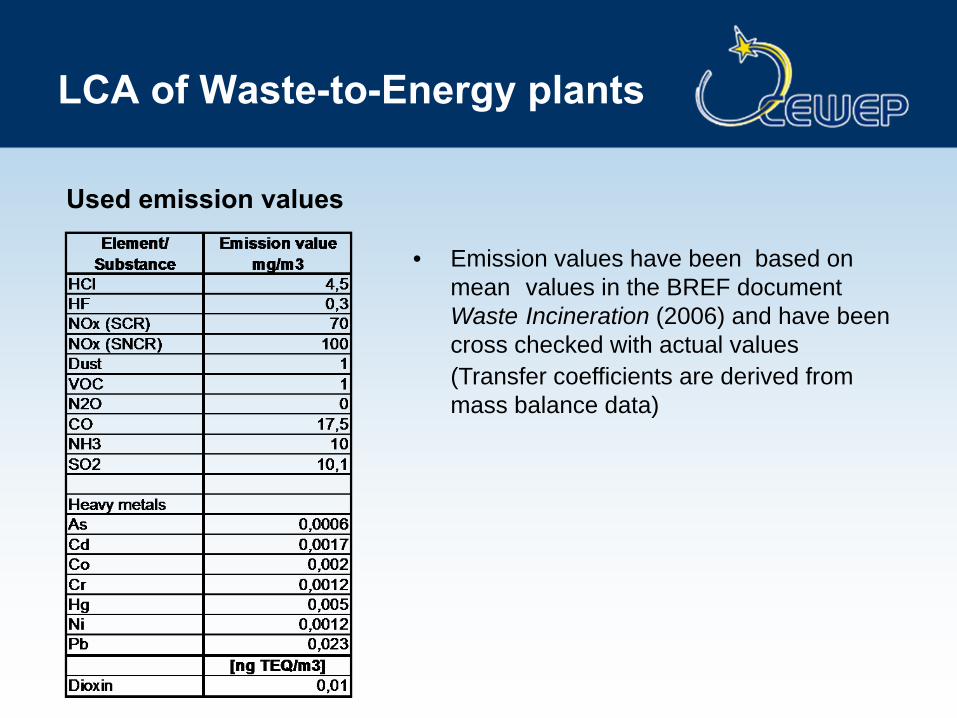
Used emission values
• Emission values have been based on mean values in the BREF document Waste Incineration (2006) and have been cross checked with actual values(Transfer coefficients are derived from mass balance data)
LCA of Waste-to-Energy plants
Life Cycle Impact Assessment
• The idea of the impact assessment is to quantify the impacts on all environmental aspects related to the thermal treatment of 1t MSW (including incineration, supply of auxiliaries, treatment of residues , export of electricity, heat and metals).
• Each input (resource) and output (emission) contributing to an environmental aspect has a characterization factor depending on the severity of its impact.
• Each emitted greenhouse gas has been multiplied by the characterization factor and summed to a so called Global Warming Potential. Avoided emissions due to the export of electricity or metals have been subtracted as credits.
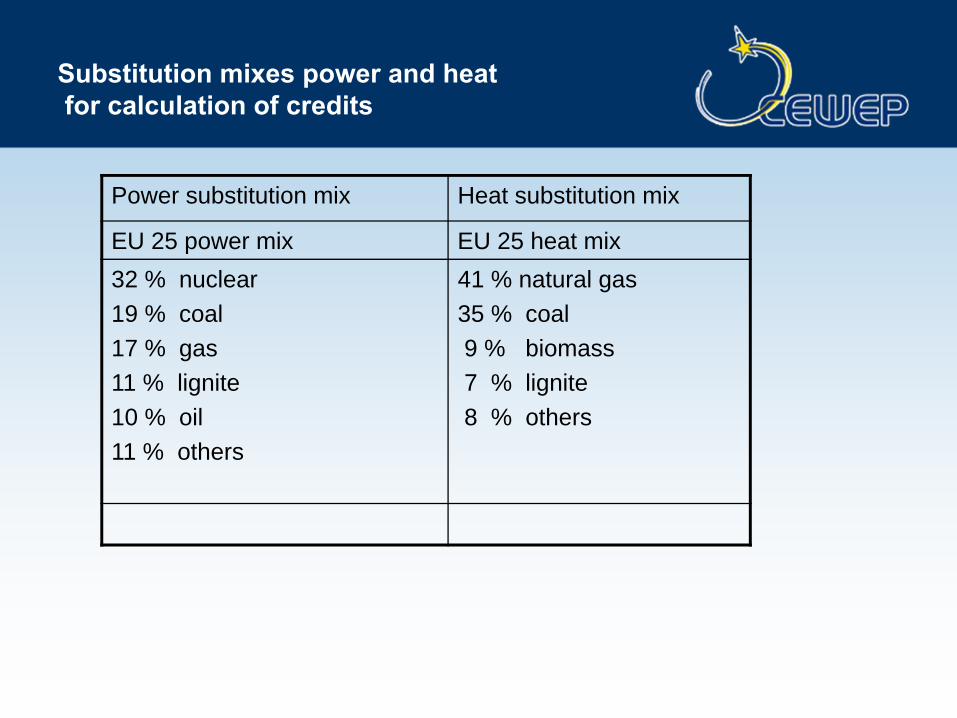
Substitution mixes power and heatfor calculation of credits
Power substitution mix Heat substitution mix
EU 25 power mix EU 25 heat mix32 % nuclear19 % coal17 % gas11 % lignite10 % oil11 % others
41 % natural gas35 % coal9 % biomass7 % lignite8 % others
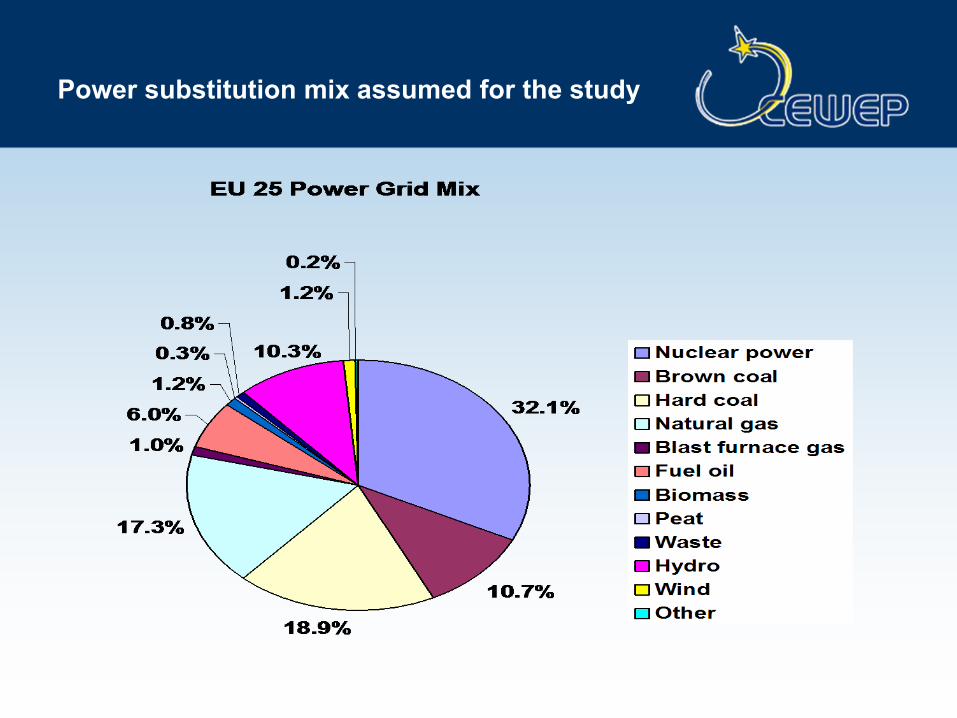
Power substitution mix assumed for the study
LCA of Waste-to-Energy plants
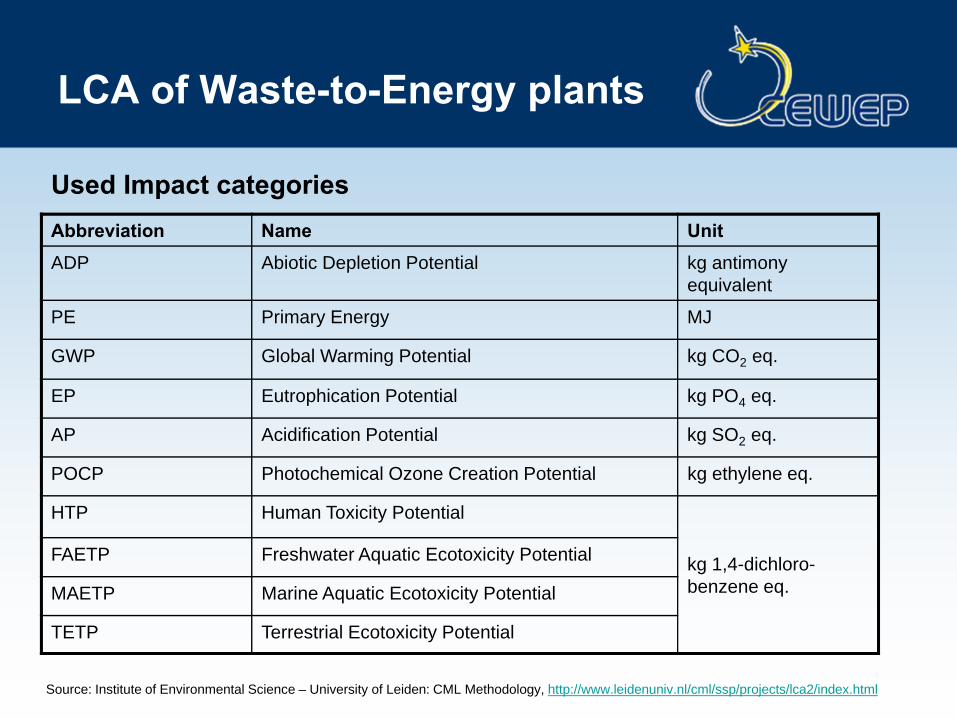
Abbreviation Name UnitADP Abiotic Depletion Potential kg antimony
equivalent
PE Primary Energy MJ
GWP Global Warming Potential kg CO2 eq.
EP Eutrophication Potential kg PO4 eq.
AP Acidification Potential kg SO2 eq.
POCP Photochemical Ozone Creation Potential kg ethylene eq.
HTP Human Toxicity Potential
kg 1,4-dichloro-benzene eq.
FAETP Freshwater Aquatic Ecotoxicity Potential
MAETP Marine Aquatic Ecotoxicity Potential
TETP Terrestrial Ecotoxicity Potential
Source: Institute of Environmental Science – University of Leiden: CML Methodology, http://www.leidenuniv.nl/cml/ssp/projects/lca2/index.html
Used Impact categories
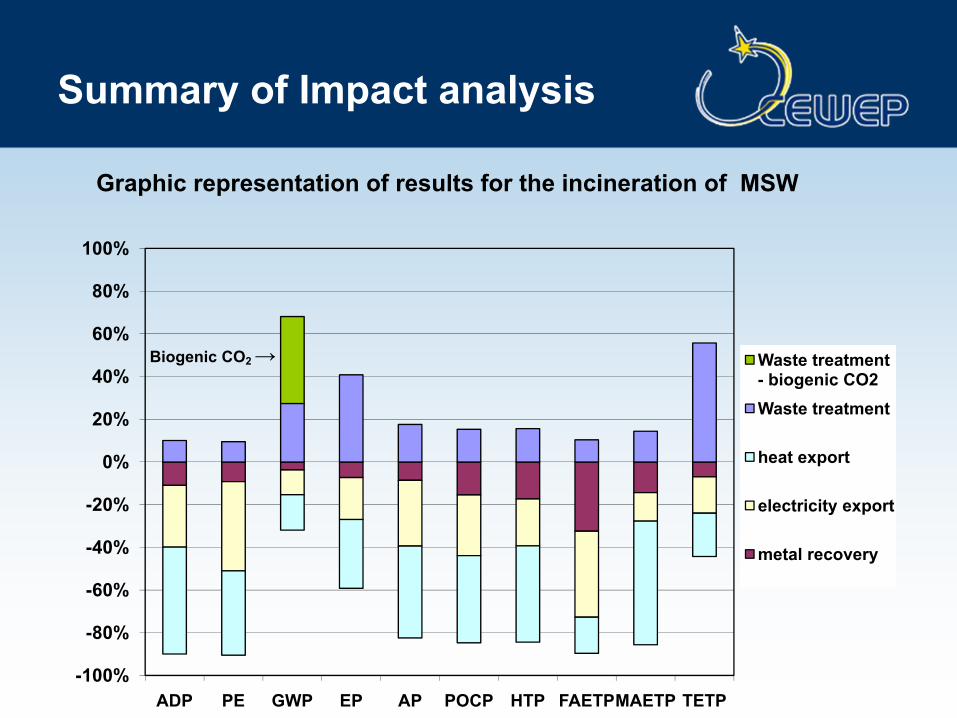
Summary of Impact analysis
Graphic representation of results for the incineration of MSW
Biogenic CO2 →
-100%
-80%
-60%
-40%
-20%
0%
20%
40%
60%
80%
100%
ADP PE GWP EP AP POCP HTP FAETPMAETP TETP
Waste treatment - biogenic CO2Waste treatment
heat export
electricity export
metal recovery
LCA of Waste-to-Energy plants
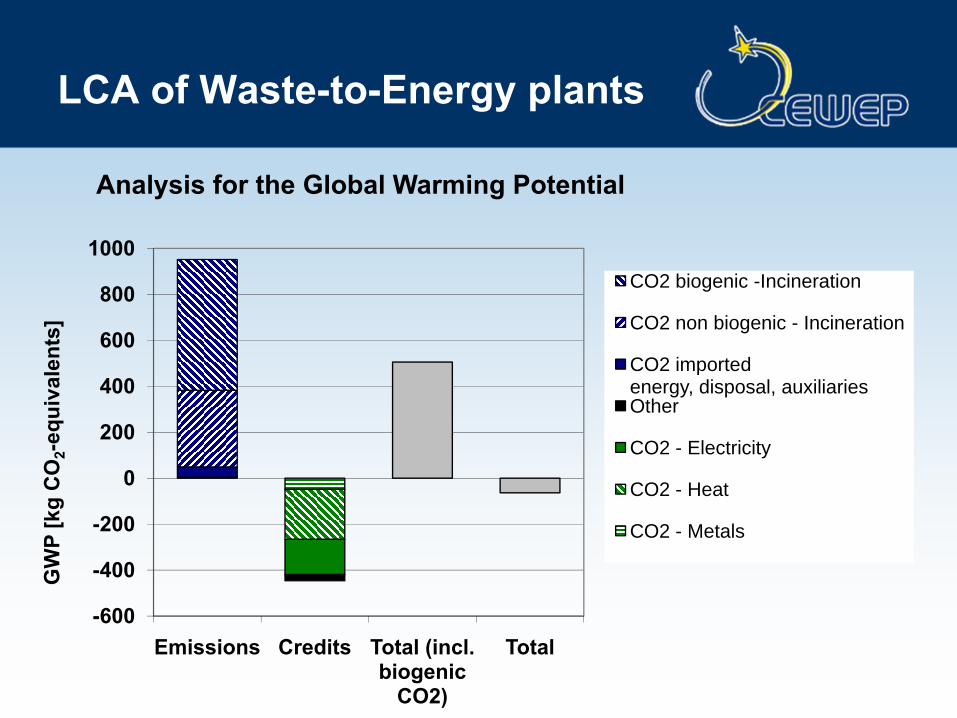
Analysis for the Global Warming Potential
-600
-400
-200
0
200
400
600
800
1000
Emissions Credits Total (incl. biogenic
CO2)
Total
GW
P [k
g C
O2-
equi
vale
nts]
CO2 biogenic -Incineration
CO2 non biogenic - Incineration
CO2 imported energy, disposal, auxiliariesOther
CO2 - Electricity
CO2 - Heat
CO2 - Metals
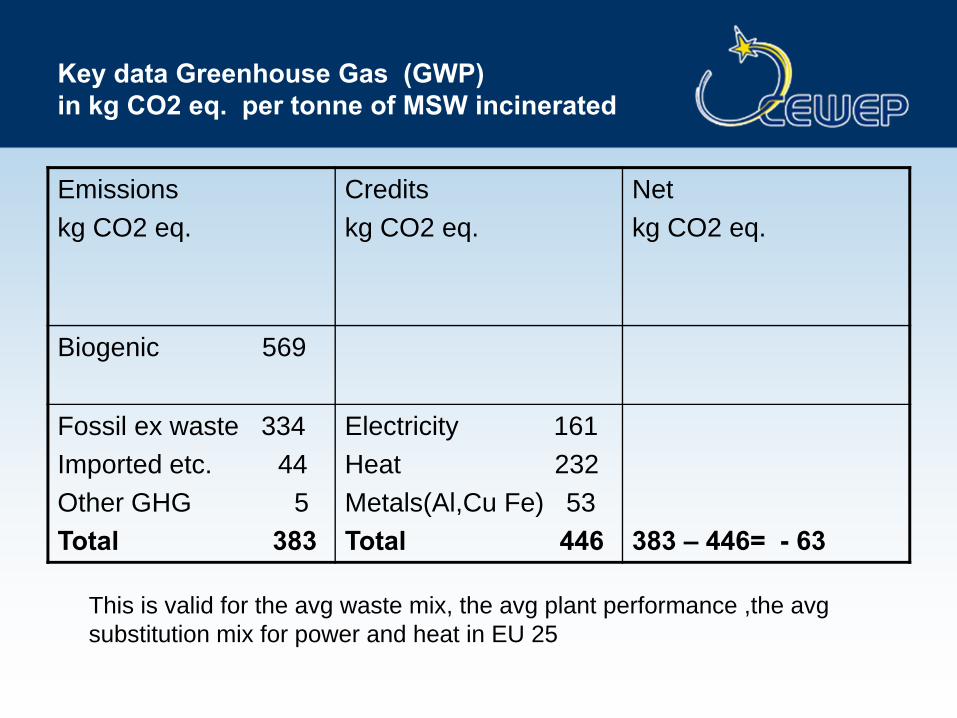
Key data Greenhouse Gas (GWP) in kg CO2 eq. per tonne of MSW incinerated
Emissionskg CO2 eq.
Creditskg CO2 eq.
Net kg CO2 eq.
Biogenic 569
Fossil ex waste 334Imported etc. 44Other GHG 5Total 383
Electricity 161Heat 232Metals(Al,Cu Fe) 53Total 446 383 – 446= - 63
This is valid for the avg waste mix, the avg plant performance ,the avg substitution mix for power and heat in EU 25
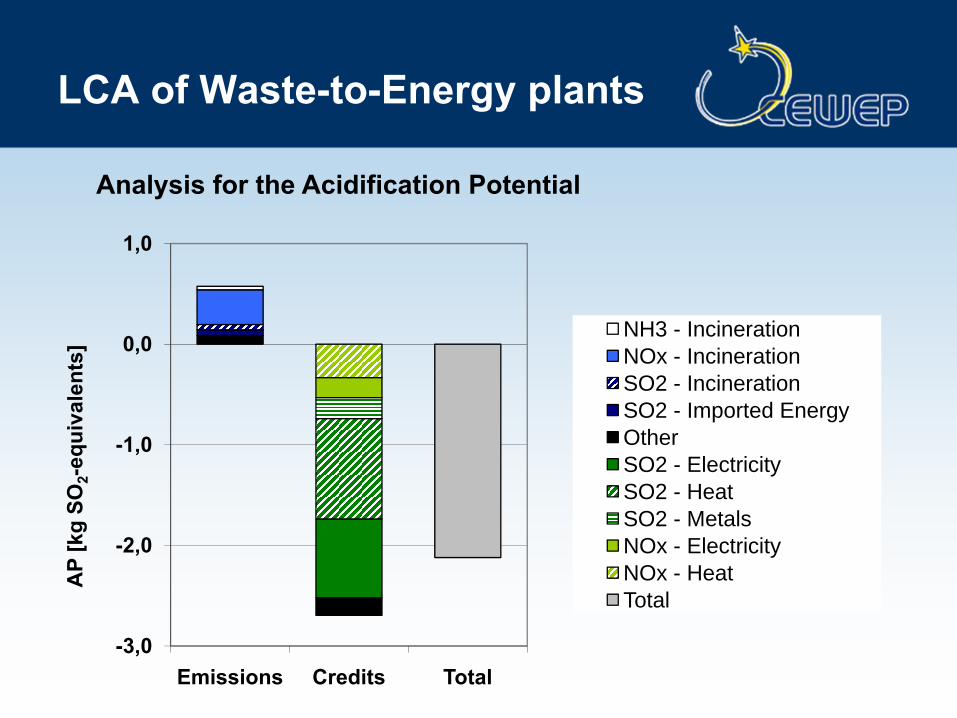
LCA of Waste-to-Energy plants
Analysis for the Acidification Potential
-3,0
-2,0
-1,0
0,0
1,0
Emissions Credits Total
AP
[kg
SO2-
equi
vale
nts]
NH3 - IncinerationNOx - IncinerationSO2 - IncinerationSO2 - Imported EnergyOther SO2 - ElectricitySO2 - HeatSO2 - MetalsNOx - ElectricityNOx - HeatTotal
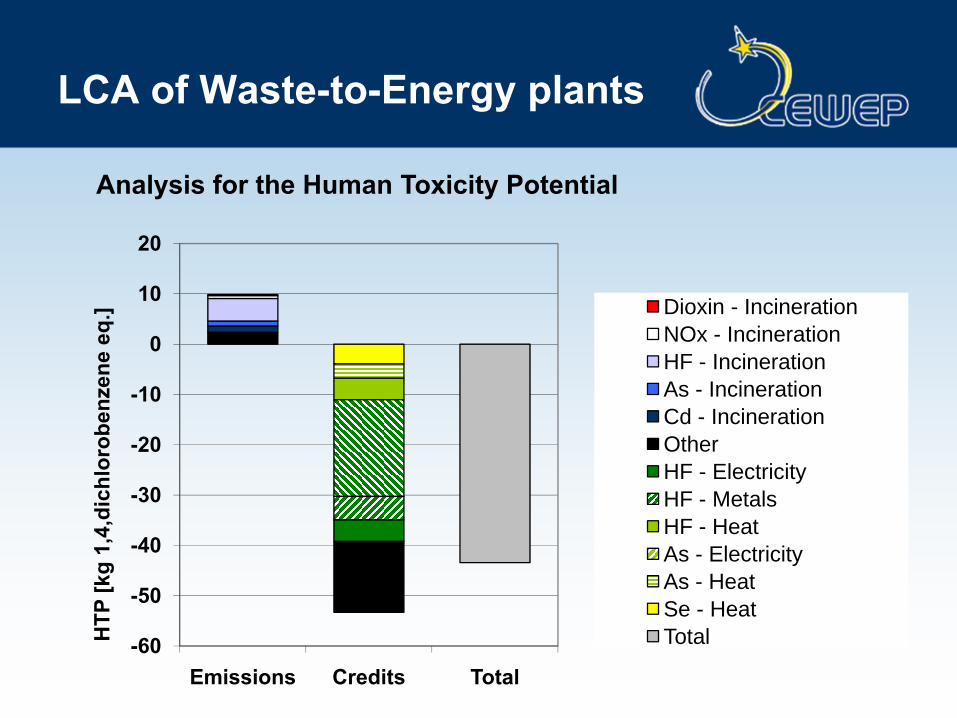
LCA of Waste-to-Energy plants
Analysis for the Human Toxicity Potential
-60
-50
-40
-30
-20
-10
0
10
20
Emissions Credits Total
HTP
[kg
1,4,
dich
loro
benz
ene
eq.] Dioxin - Incineration
NOx - IncinerationHF - IncinerationAs - IncinerationCd - IncinerationOtherHF - ElectricityHF - MetalsHF - HeatAs - ElectricityAs - Heat Se - HeatTotal
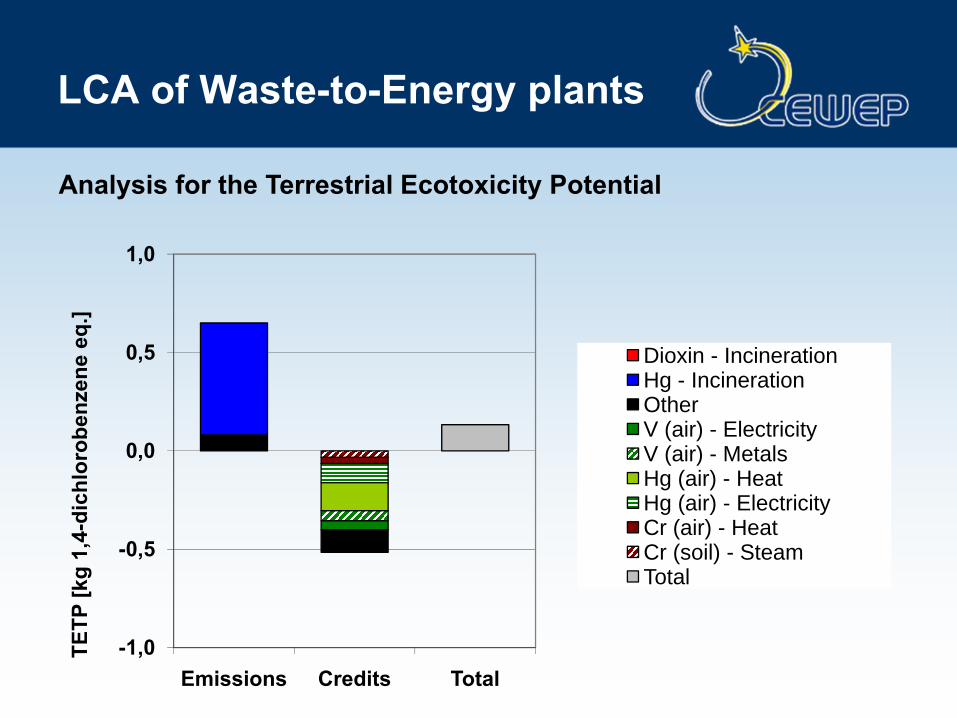
LCA of Waste-to-Energy plants
Analysis for the Terrestrial Ecotoxicity Potential
-1,0
-0,5
0,0
0,5
1,0
Emissions Credits Total
TETP
[kg
1,4-
dich
loro
benz
ene
eq.]
Dioxin - Incineration Hg - IncinerationOtherV (air) - ElectricityV (air) - MetalsHg (air) - HeatHg (air) - ElectricityCr (air) - HeatCr (soil) - SteamTotal
LCA of Waste-to-Energy plants
Sensitivity studies carried out
-Effect of variation of % biogenic carbon in waste on GWP
-Effect of mercury content in waste on TETP
-Effect of variation of waste composition
LCA of Waste-to-Energy plants
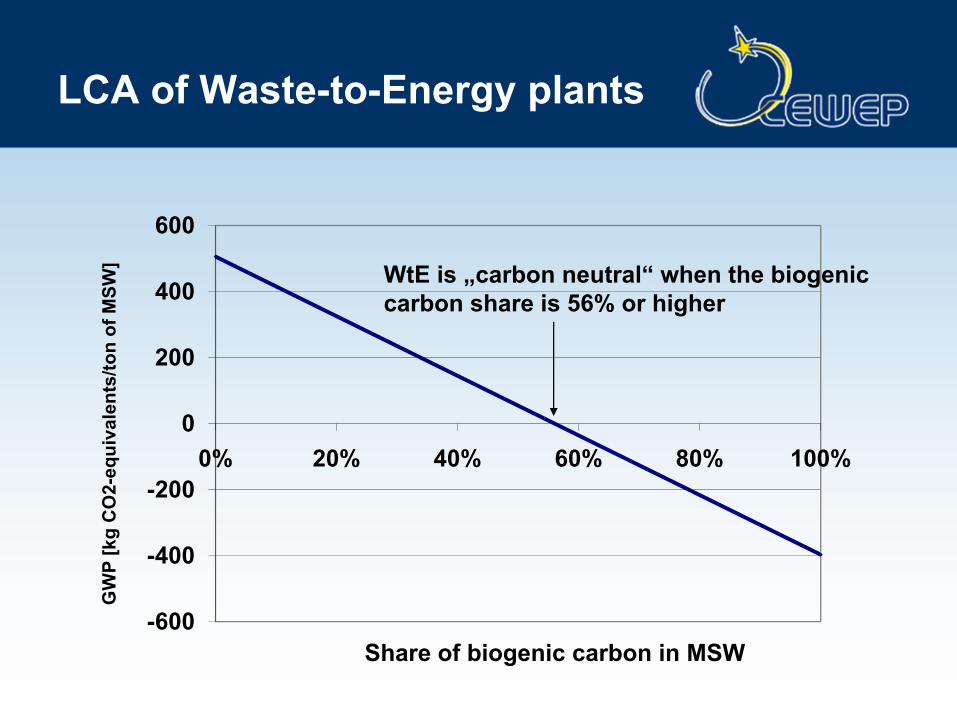
WtE is „carbon neutral“ when the biogenic carbon share is 56% or higher
-600
-400
-200
0
200
400
600
0% 20% 40% 60% 80% 100%
GW
P [k
g C
O2-
equi
vale
nts/
ton
of M
SW]
Share of biogenic carbon in MSW
LCA of Waste-to-Energy plants
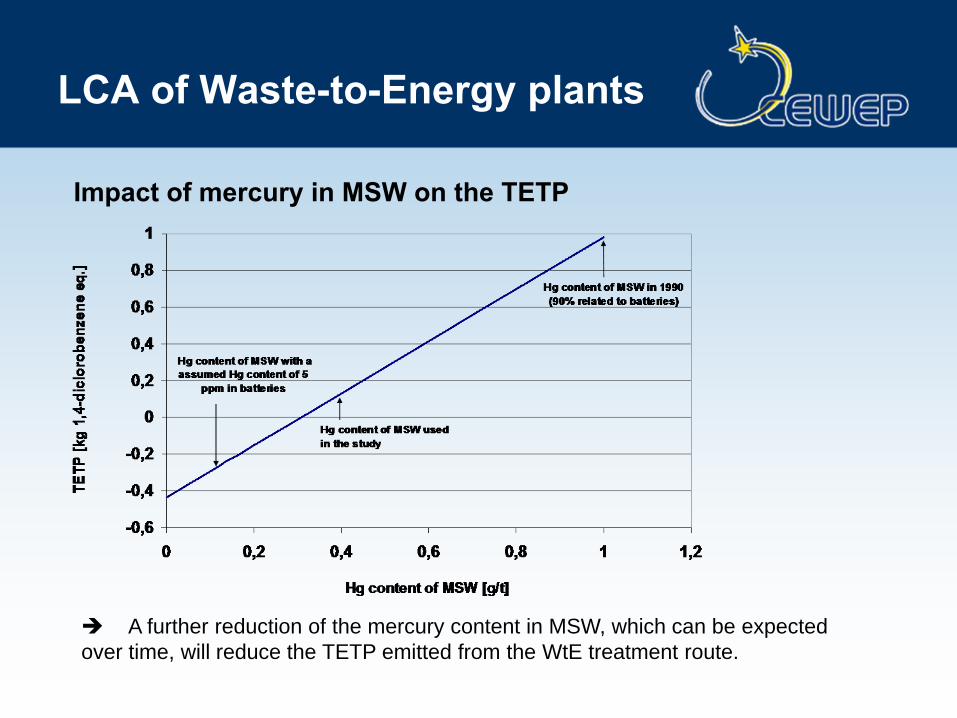
Impact of mercury in MSW on the TETP
A further reduction of the mercury content in MSW, which can be expected over time, will reduce the TETP emitted from the WtE treatment route.
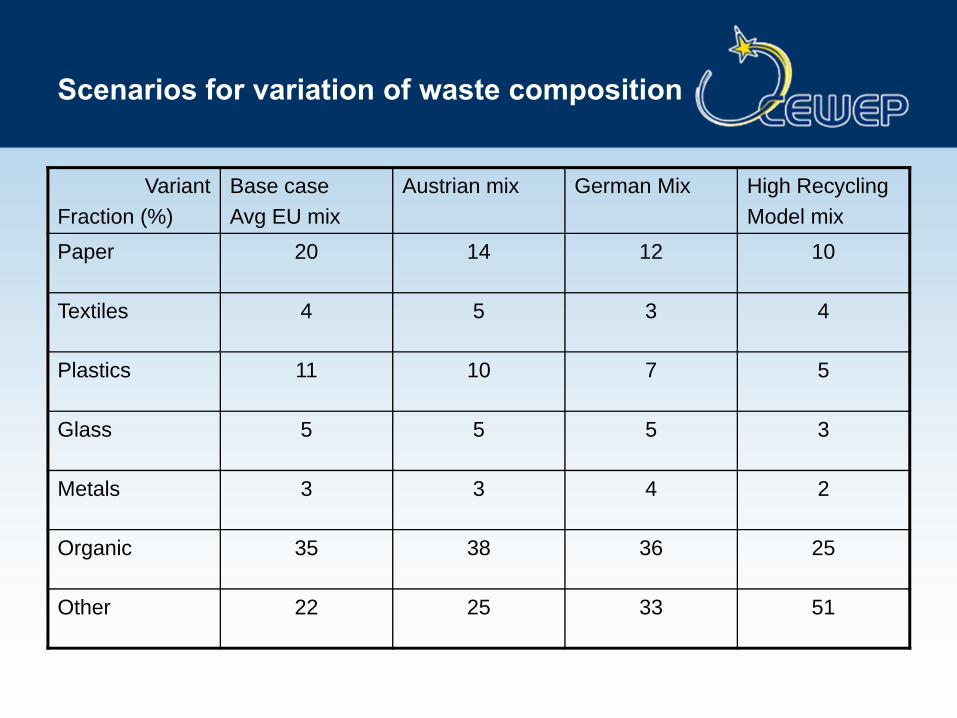
Scenarios for variation of waste composition
VariantFraction (%)
Base caseAvg EU mix
Austrian mix German Mix High RecyclingModel mix
Paper 20 14 12 10
Textiles 4 5 3 4
Plastics 11 10 7 5
Glass 5 5 5 3
Metals 3 3 4 2
Organic 35 38 36 25
Other 22 25 33 51
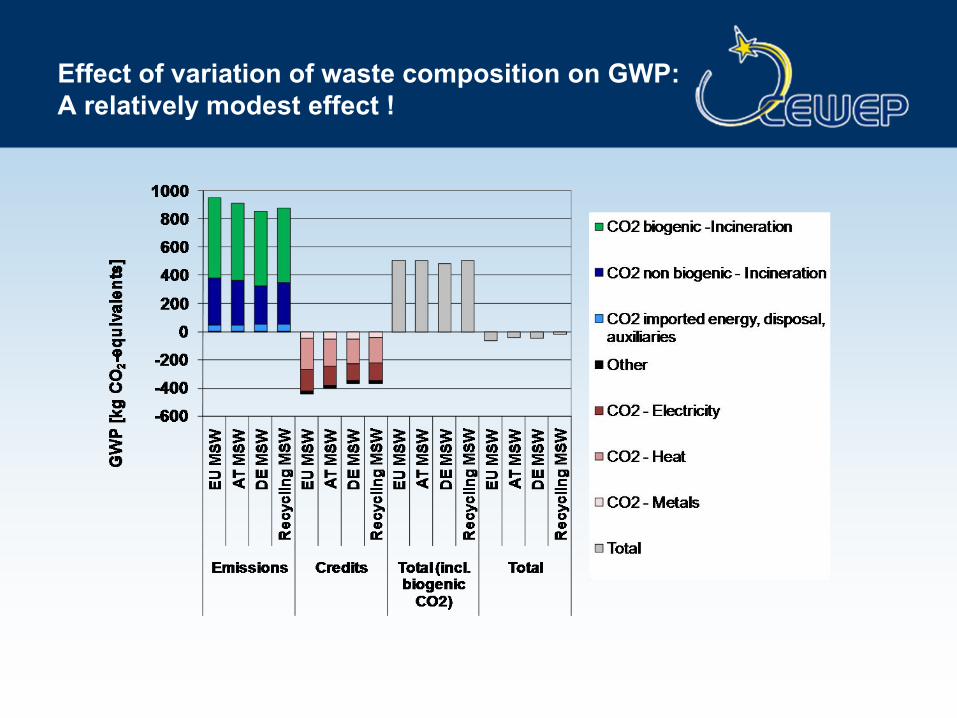
Effect of variation of waste composition on GWP:A relatively modest effect !
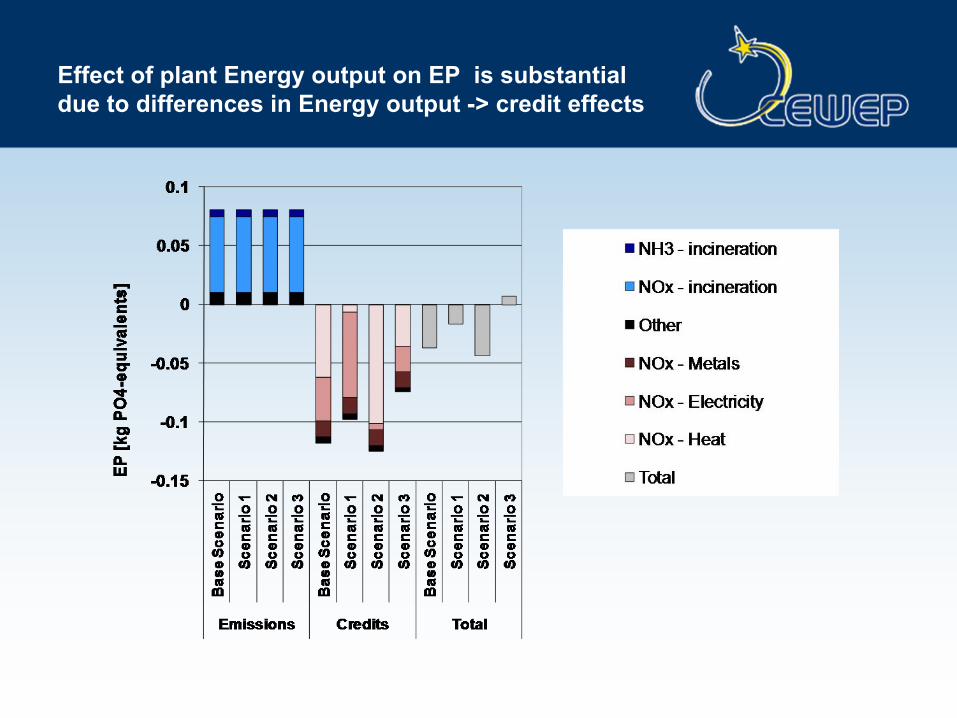
Effect of plant Energy output on EP is substantial due to differences in Energy output -> credit effects
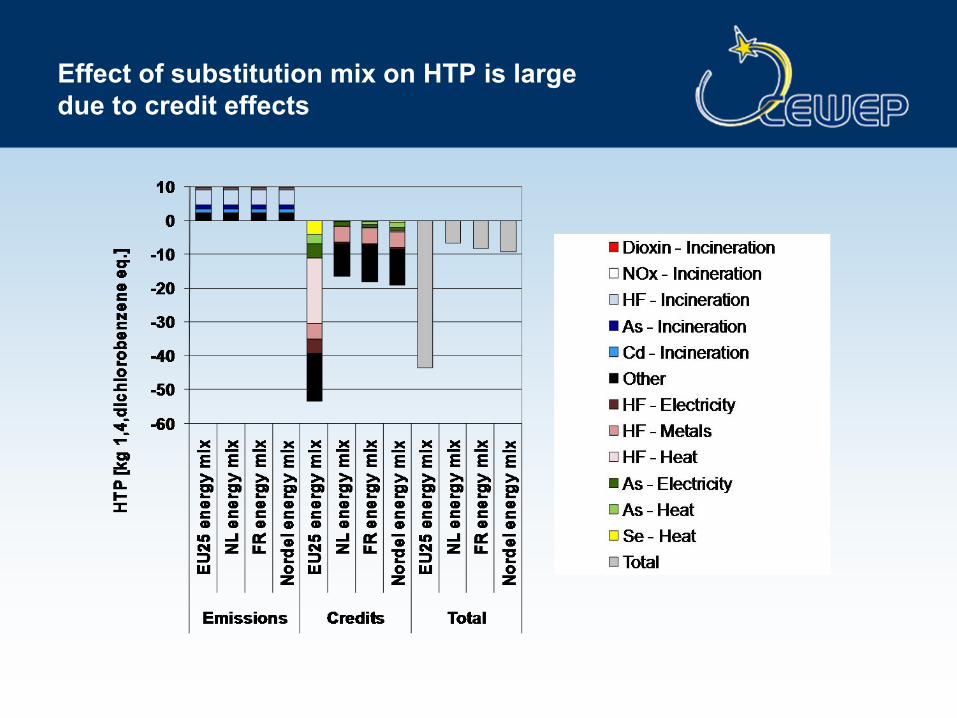
Effect of substitution mix on HTP is large due to credit effects
LCA of Waste-to-Energy plants
Conclusions• The most impact categories show net benefits for Waste-to-Energy of
MSW over the whole life cycle with the exception of TETP
• The results on TETP are highly dependent on data from the mercury balance and assumptions on Hg content of the MSW. A sensitivity study indicates that the rapidly decreasing content of Hg in MSW will resolve the TETP issue.
• The carbon balance of the waste treatment in an average European Waste-to-Energy plant is carbon neutral as long as the biogenic carbon share of MSW is 56 % or higher. (For the average base case the % biogenic is 63)
• The effects of changing waste mix are modest except for effects on TETP due to the assumed accumulation of heavy metals and the like in the waste as the result of the high Others fraction.
Other observations
• GWP thinking and analysis is becoming very widespread in the world. This is being Used and MisUsed for many purposes !
• LCA is becoming a « conditio sine qua non » for doing business. Demand from customers, authorities, …
• CEWEP has made a professional contribution which is available for review and debate.
• CEWEP will participate in similar exercises comparing WtE with other treatment routes and recycling.
Acknowledgment
• This Study was carried out for CEWEP by A. Stoffregen and J.Kreissig of PE International, Germany.
• The study was directed and monitored by a CEWEP team consisting of (among others) :• Oliver Keserue & Laurence Toffoletto, France• Inge Johannson, Sweden• Ella Stengler and Dieter Reimann CEWEP• Jan Manders, chairman


![EMISSION OF POLYCHLORINATED DIBENZO-P … · municipal waste incineration plants, steel plants, cement kilns ... the regulation approved by the BREF document [BREF 2013], the threshold](https://img.pdfslide.net/doc/110x75/5ace447e7f8b9ab10a8ea360/emission-of-polychlorinated-dibenzo-p-waste-incineration-plants-steel-plants.jpg)