Embed Size (px)
Citation preview

CSIRO CLIMATE ADAPTATION FLAGSHIP
Life and house loss database
description and analysis
Final report
Raphaele Blanchi1, Justin Leonard1, Katharine Haynes2, Kimberley Opie3, Melissa James1, Musa Kilinc4,
Felipe Dimer de Oliveira2, Rob van den Honert2
Project Title: Life and house loss data aggregation and analysis project
CSIRO EP-129645
Milestone final report
December 2012
1 CSIRO Ecosystem Sciences, and Bushfire CRC
2 Risk Frontiers Macquarie University
3 CSIRO Land and Water
4 Monash University, Bushfire CRC

ii
Citation
Blanchi R, Leonard J, Haynes K, Opie K, James M, Kilinc M, Dimer de Oliveira F, Van den Hornet R (2012).
Life and house loss database description and analysis. CSIRO, Bushfire CRC report to the Attorney-General's
Department. CSIRO EP-129645
Copyright and disclaimer
© 2012 CSIRO To the extent permitted by law, all rights are reserved and no part of this publication
covered by copyright may be reproduced or copied in any form or by any means except with the written
permission of CSIRO.
Important disclaimers
CSIRO advises that the information contained in this publication comprises general statements based on
scientific research. The reader is advised and needs to be aware that such information may be incomplete
or unable to be used in any specific situation. No reliance or actions must therefore be made on that
information without seeking prior expert professional, scientific and technical advice. To the extent
permitted by law, CSIRO (including its employees and consultants) excludes all liability to any person for
any consequences, including but not limited to all losses, damages, costs, expenses and any other
compensation, arising directly or indirectly from using this publication (in part or in whole) and any
information or material contained in it.
This material was produced with funding provided by the Attorney-General's Department through the
National Emergency Management program. The Bushfire CRC, Attorney-General's Department and the
Australian Government make no representations about the suitability of the information contained in this
document or any material related to this document for any purpose. The document is provided ‘as is’
without warranty of any kind to the extent permitted by law. The Bushfire CRC, Attorney-Generals
Department and the Australian Government hereby disclaim all warranties and conditions with regard to
this information, including all implied warranties and conditions of merchantability, fitness for particular
purpose, title and non-infringement. In no event shall the Bushfire CRC, Attorney-Generals Department or
the Australian Government be liable for any special, indirect or consequential damages or any damages
whatsoever resulting from the loss of use, data or profits, whether in an action of contract, negligence or
other tortious action, arising out of or in connection with the use of information available in this document.
The document or material related to this document could include technical inaccuracies or typographical
errors.

1
Contents
1 Executive Summary ............................................................................................................................... 6
2 Introduction .......................................................................................................................................... 7
3 Background ........................................................................................................................................... 9
4 Database description .......................................................................................................................... 11
4.1 Database structure ................................................................................................................... 11
4.2 Data sources.............................................................................................................................. 13
4.3 Data collection and aggregation approaches ........................................................................... 14
4.4 Dataset example ....................................................................................................................... 19
5 Data analysis methodology ................................................................................................................. 22
5.1 Spatial analysis .......................................................................................................................... 22
5.2 Statistical analysis ..................................................................................................................... 25
6 Results and discussion ......................................................................................................................... 26
6.1 Demographics ........................................................................................................................... 27
6.2 Distributions of fatalities and house loss .................................................................................. 28
6.3 Loss per Fire events .................................................................................................................. 33
6.4 Location of fatal exposure ........................................................................................................ 37
6.5 Activity and decision making .................................................................................................... 43
6.6 Fire weather context ................................................................................................................. 49
6.7 Fire Weather index for fatalities ............................................................................................... 55
6.8 Distance to forest ...................................................................................................................... 57
6.9 Results from the Victorian 2009 bushfires ............................................................................... 59
7 Conclusions ......................................................................................................................................... 66
8 Acknowledgements ............................................................................................................................. 69
9 References ........................................................................................................................................... 70
Appendix 1 – Database Structure ..................................................................................................................... 74
Appendix 2 - Data category tables and their contents ..................................................................................... 79
Appendix 3 – Coding Scheme 2009 Victorian bushfires ................................................................................... 89

2
List of Figures
Figure 1 Database structure diagram ............................................................................................................... 12
Figure 2 Example of spatial data collected on the Cockatoo 1983 fire (red point: fatality, white square:
houses and other structure, Aerial photography from CFA) ............................................................................ 21
Figure 3 Representation of fraction of forest (green) and distance to forest used in the analysis ................. 23
Figure 4 Extent and availability of NCAS imagery............................................................................................. 24
Figure 5 Number of fatalities by gender between the period 1901-1964 and the period 1965-2011
(distinction between civilian and firefighters) ................................................................................................. 28
Figure 6 Distribution of number of fatalities over the time period (1901-2011) including civilian and
firefighters ........................................................................................................................................................ 28
Figure 7 Distribution of number of house burnt (destroyed) over the time period (1901-2011) ................... 29
Figure 8 Distribution of fatalities by State (all fatalities – civilians, firefighters and non-directly related
fatalities) on population density map June 2010 (From 3218.0 - Regional Population Growth, Australia -
Year book Australia 2011 - http://www.abs.gov.au/ausstats/[email protected]/mf/3218.0 - accessed
07/01/2013) ...................................................................................................................................................... 30
Figure 9 Number of fatalities per months (including civilian and firefighters) ................................................ 31
Figure 10 Bushfire season across Australia (from
http://www.csiro.au/en/Outcomes/Environment/Australian-Landscapes/Fire-Season-Months.aspx) ......... 31
Figure 11 Hour of civilian and firefighter fatal exposure for all directly related deaths (each category is
from 0:00 to 0:59)............................................................................................................................................. 32
Figure 12 Hour of civilian fatal exposure for each location type (directly related to bushfire) ....................... 32
Figure 13 Number of fire events as a function of the number of fatalities class in a fire event (all
fatalities) ........................................................................................................................................................... 33
Figure 14 Aggregated fatalities function of fatalities class (fire event have been classified according to
the number of fatalities in an event) ................................................................................................................ 34
Figure 15 House and life loss correlation per fire day ...................................................................................... 36
Figure 16 House and life loss correlation per fire event with additional house loss data included ................ 36
Figure 17 Error precision for each fatal exposure location (presented in categories) ..................................... 37
Figure 18 Location of all fatalities in Australia (background map from Google Earth) .................................... 38
Figure 19 Location categories of fatal exposure compared with role and sex................................................. 39
Figure 20 Distance between residential address and fatal exposure location (civilian) .................................. 40
Figure 21 Distance between vehicle and fatal exposure location (civilian) ..................................................... 40
Figure 22 Tridimensional probability visualisation of the following variable Decision making, Activity and
FFDI ((a) FFDI (at 12 different values of FFDI) .................................................................................................. 48
Figure 23 Comparison FFDI at 3pm and at time of exposure for civilians (before wind change, after wind
change and no or unknown wind change) - 430 observations at 3pm and time of exposure (TOE) ............... 50
Figure 24 Relationships between the number of houses lost (logarithmic scale) and FFDI at 3pm,
temperature, wind speed and RH .................................................................................................................... 51

3
Figure 25 Number of civilian fatalities by gender and FFDI (3pm value) ......................................................... 53
Figure 26 Number of fatalities by gender and 3pm temperature (degree Celsius) ......................................... 53
Figure 27 Number of fatalities by gender and wind speed (3pm value) .......................................................... 54
Figure 28 Number of fatalities by gender and 3pm relative humidity (%) ....................................................... 54
Figure 29 FFDI at 3pm and location of fatality ................................................................................................. 55
Figure 30 Correlation plots for events with more than three fatalities; show the observed loss vs the
estimated loss for both a first and second order correlation .......................................................................... 56
Figure 31 Cumulative loss profile of fatalities distance to forest ..................................................................... 57
Figure 32 Cumulative loss profile of fatalities distance to forest (per location categories) ............................ 58

4
List of table
Table 1 Description of data collected for the Cockatoo 1983 fire event ......................................................... 20
Table 2 Weather conditions collected for the Cockatoo 1983 fire .................................................................. 20
Table 3 Data collected on vehicle object .......................................................................................................... 21
Table 4 Age and gender for the three time periods (all fatalities – civilians, firefighters and non-directly
related fatalities) .............................................................................................................................................. 27
Table 5 Total fatalities by jurisdiction for the three time periods (all fatalities – civilians, firefighters and
non-directly related fatalities) .......................................................................................................................... 29
Table 6 Ten major fire days in Australia involving fatalities ............................................................................. 34
Table 7 Number of fatalities per incident (all fatalities – civilians, firefighters and non-directly related
fatalities) ........................................................................................................................................................... 35
Table 8 Location of fatal exposure and location of death ................................................................................ 37
Table 9 Fatal exposure location categories over the three time periods (civilian) .......................................... 38
Table 10 Known fatality locations inside structure detailed location .............................................................. 41
Table 11 Known fatality locations inside residential structures detailed location .......................................... 41
Table 12 Comparison age group between fatalities inside structure and all civilian ....................................... 42
Table 13 Activities of civilian fatalities over the three time periods (percentage of civilian fatalities data) ... 44
Table 14 Comparison of the five major bushfires (civilian fatalities) ............................................................... 45
Table 15 Activity at the time of fatality for firefighters .................................................................................... 46
Table 16 Decision making over the three time periods (civilian fatalities) ...................................................... 46
Table 17 Gender and decision making ............................................................................................................. 47
Table 18 Correlation coefficients (activity, gender and FFDI) .......................................................................... 49
Table 19 Correlation of logarithmically (log-10) transformed number of fatalities under different
weather variables ............................................................................................................................................. 52
Table 20 Correlation values for a novel regression based Life Loss Index ....................................................... 56
Table 21 Relationship between fire plan and location of fatality .................................................................... 60
Table 22 Relationship between fire plan and preparation prior to February 7th ............................................. 60
Table 23 Relationship between preparation prior to and on 7th of February 2009 ......................................... 61
Table 24 Relationship between preparation prior to February 7th and activities in the lead up to death ...... 61
Table 25 Relationship between preparation prior to February 7th and activities at the time of death ........... 62
Table 26 Relationship between activities in the hours leading up to death and activities at the time of
death ................................................................................................................................................................. 62
Table 27 Location at the time of death of fatalities that were considered highly prepared ........................... 64
Table 28 Activities leading up to and at the time of death for those considered highly prepared ................. 64
Table 29 Details of those who were considered well prepared on Black Saturday ......................................... 65

5

6
1 Executive Summary
This report describes the development and analysis of a dataset containing bushfire related life loss in
Australia over the past 110 years (1901-2011). Over this time period 260 bushfires have been associated
with a total of 825 known civilian and firefighter fatalities. This dataset encompasses the spatial, temporal
and localised context in which the fatalities have occurred (known as the Attorney General Department’s
(AGD) NFDRS Life Loss database). This database was developed to provide a firm evidence base for which
an Australian National fire danger rating system can be developed. It represents the most complete set of
known bushfire fatalities and the most comprehensive spatially and temporally correlated dataset of these
fatalities ever assembled.
The analysis phase of the project has focused on the characterisation of the relationship between fatal
exposure location, fire arrival, weather conditions (using the McArthur Forest Fire Danger Index (FFDI) and
its individual components), proximity to fuel, and fatality activity and decision making leading up to the
death.
From this analysis it is evident that fire weather and proximity to forest are very strong contextual drivers
for defining the potential for fatalities to occur. With over 78% of all fatalities occurring within 30m of the
forest and 50% of all fatalities occurring on days exceeding an FFDI of 100 (the current threshold for
declaring a day as ‘catastrophic’). In fact 15 major bushfire events involving 9 or more fatalities per event
represent 51% of all civilian fatalities. These bushfire events occurred during 10 fire days. The total number
of fatalities during those days account for 65% of all civilian fatalities. The analysis shows that the losses are
dominated by a several iconic events that have occurred under very severe weather conditions (such as Ash
Wednesday 1983, Black Saturday 2009)
The location of fatal exposure provides a useful context with 58% occurring out in the open and 28%
occurring inside structures, of particular interest is the fact that for bushfires occurring under weather
conditions exceeding an FFDI value of 100, fatalities within structures represents over 75% of all fatalities.
These are associated with people dying while attempting to shelter mainly in their place of residence.
Conversely lower values of FFDI are associated with people caught outside who are engaged in defending.
The Civilian fatalities also tended to occur close to or within their place of residence, with 82% of the ‘in
structure’ fatalities being in their place of residence, and 61% of other fatalities were with 100m of their
residence. Of the fatalities which occurred inside structure in a location that was specifically known, 41%
occurred in rooms with reduced visibility to the outside conditions.
The gender analysis shows a higher proportion of males dying in earlier fires when compared to more
recent fires. The gender role could demonstrate an evolution of behaviour in the different roles of men and
women over the century. A greater number of male civilian fatalities have occurred in open air than in any
other location, particularly earlier in the century. A greater proportion of female fatalities have occurred
inside structures.
Preliminary work has been performed to explore the use of a weather based life lose index which has
demonstrate significantly strong correlations than using FFDI, hence with some additional effort in this are
a new index can be derived. This index could either be based in weather parameters alone or be a
combination of weather and spatial variables.

7
2 Introduction
This project was commissioned as a foundation component of the National Fire Danger Rating System
(NFDRS) project. The NFDRS project is focused on the development of a fire danger rating system for
agency and community awareness and warnings. A wide variety of related spin off products are also
included to support other agency activities. The existing Fire Danger Rating System has been historically
based on the Fire Danger Index (FDI). The FDI relates the expected fire behaviour and rate of spread in
common fuel types in eastern Australia (McArthur 1967; Luke 1978) to the large-scale weather conditions
and was originally developed for fire suppression. There is a need for the fire danger rating system to also
reflect the potential for damage to a community. A detailed spatial categorisation of the circumstances of
fatalities is necessary to underpin the assumptions and processes employed within the broader fire danger
rating system. This report details how this requirement was met and delivered in the form of a database
associated with spatial files. Preliminary analysis of the data is also provided in the report.
The database, known as the Attorney General Department’s (AGD) NFDRS Life Loss database (Life Loss
database), is a dataset containing past life-loss in relation to the spatial, temporal and the localised context
in which the life had been lost as a result of a bushfire. The spatial nature of the dataset will allow a wide
range of future analysis to be undertaken.
The Life Loss database was developed by collating different available data on bushfire related life loss in
Australia over the past 110 years (1901-2011). A range of circumstances leading up to the fatal exposure
was also captured, including:
• fire arrival and severity,
• weather conditions,
• proximity to fuels, and
• activity defined by the decisions made up to the time of fatal exposure.
The circumstantial qualifiers and parameters used were limited to those deemed relevant to the broader
NFDRS project and developed through consultation with the NFDRS – Science Subgroup (see Appendix 1 –
Database Structure). Civilian fatalities are the key focus of this project, however efforts were also made to
collate and partially analyse firefighter fatalities.
This report details the Life Loss database development process and statistical analysis performed. The
analysis focuses principally on understanding the strength of correlations between the activity leading up to
fatality, fire weather severity, proximity to fuel and other objects (houses and/or vehicles).
The statistical analysis sought to quantify minimum thresholds, potential surrogate qualifiers (including
house loss), and the specific role houses play in contributing to the causality of fatality. The analysis
attempts to answer the following questions:
• What is the type and prevalence of activities leading up to the fatalities and how are these linked to
qualified against other circumstantial drivers?
• What is the minimum weather threshold for the potential for life loss to occur?
• Is there a correlation between fire weather severity and historic life loss?
• Is house loss or other alternatives such as fire severity, a potential surrogate indicator for predicting
life losses if a number of key qualifiers are incorporated?
• How are life loss and the proximity to and prevalence of fuels related?
• Does multivariable analysis improve the statistical correlation between circumstance and life loss?
• Can a working classification of life loss risk be developed for use in the fire danger rating system?
The database is as comprehensive and as complete as practicable within the time frame and resources
available to the project. There is an ongoing need to maintain the database with future losses and to
integrate the knowledge and data from future analysis and data collection initiatives.

8
In parallel to this project the “Fire Severity Rating Project1” is focusing in community losses in relation to
fire severity. This project seeks to conceptualise a fire severity scale based upon transitions between levels
of fire severity. The two projects use an evidence based approach that draws upon data from past fire
impacts on the wildland/urban interface. Both projects work in unison to provide a better understanding
and quantifiable measures of improving the fire danger rating system.
1 Victorian Department of Sustainability and Environment (DSE) and Bushfire CRC project

9
3 Background
The first known study of community safety at the urban interface occurred in Australia in 1945 consisting of
a post bushfire survey and subsequent analysis to better understand the mechanisms of bushfire attack at
the urban interface (Barrow 1945). Following this survey several studies have been conducted after each
major bushfire involving house loss (e.g. Ramsay 1987; Leonard and McArthur 1999). The important points
of consideration in those studies were on the building design, the immediate landscape, the type of urban
interface and human activity and how they significantly influence the risk of loss (e.g. Barrow 1945; Ramsay
1987; Leonard 2003; Blanchi and Leonard 2008).
The study of human activities during bushfire have suggested that people sheltering in their house and
implementing different protection strategies have a better chance of survival than people evacuating late
(McArthur and Cheney 1967; Wilson and Ferguson 1984; Krusel and Petris 1999). Also it has been shown
that active defence by residents or brigade members significantly increases the chances of house survival
(Wilson and Ferguson 1986; Leonard 2003; Blanchi et al. 2006).
These findings have formed the basis of the Bushfire and Community Safety Position developed by the
Australasian Fire and Emergency Service Authorities Council (AFAC) before the 2009 Victorian fires. This
position was translated into the prepare, stay and defend or leave early policy in most jurisdictions. Also
referred to as the ‘Stay or Go’ policy The policy recommended that either actively defending a well-
prepared home or evacuating/relocating well in advance of a fire threat are the best survival options during
a bushfire2.
Some studies have been performed on the behaviour of civilian fatalities during bushfires in Australia
(Tibbits et al. 2006; Handmer and Haynes 2008; Haynes et al. 2008; Haynes et al. 2010; O'Neill et al. 2010;
O'Neill and Handmer 2012). The studies are mainly conducted within the context of the ‘Stay or Go’ policy.
Tibbits and Handmer have discussed the ‘Stay or Go’ policy approaches in Australia and described the
history of policy development in this area (Handmer and Tibbets 2005; Tibbits et al. 2008). Haynes et al
(2010) completed a study of civilian fatalities in bushfires over the last century (up until 2008). The study
explored the context of bushfire related fatality and focused on the activities, behaviour and decision
making carried out at the time of fatality. The details of 552 civilian fatalities were collected and this study
was able to verify and emphasise the danger of being caught outside during the passage of a bushfire. It
also demonstrated a clear gender bias, with male fatalities most often occurring outside trying to protect
assets and females inside sheltering or trying to flee (Haynes et al. 2010). O’Neil and Handmer (2010, 2012)
have also performed a detailed study of the circumstances surrounding the deaths of 172 civilians during
the 2009 Victorian bushfires; one of the findings was that most of the people could not respond
appropriately to the risk the bushfire presented on 7th of February 2009.
While these studies on civilian fatalities have mainly focused on the behaviour of the victims, they have not
included the spatial and environmental circumstances of their death, meanwhile other studies have
focused on the influence of environmental circumstance on house loss for individual events (e.g. McArthur
and Cheney 1967; Ramsay 1987; Leonard and Blanchi 2005) and across multiple events (e.g. Ahern and
Chladil 1999; Chen and McAneney 2004; Blanchi et al. 2010; Harris et al. 2011). Several studies have shown
that the number of houses destroyed decline as a function of the distance to wildland vegetation (Ahern
and Chladil 1999; Chen and McAneney 2004; Crompton et al. 2011; Newnham et al. 2012). However, theses
studies have some limitations. For example, they only looked into house loss and their distance from the
wildland vegetation. They made no attempt to describe the fire behaviour. They also made no attempt to
describe the characteristics of the houses burnt compared to those not burnt. Blanchi et al. looked at
meteorological conditions and related houses loss in Australia (Blanchi et al. 2010). Crompton et al
2 AFAC (2005) Position Paper on Bushfires and Community Safety. AFAC Limited, Victoria, Australia

10
(Crompton et al. 2010) studied the history of building damage and loss of life since 1925, and normalised
the historical records to 2008/09 to look at the influence of climate change. Harris et al have studied
community losses from 79 fires (49 fires with fatalities, and 47 fires with house loss) in relation to fire
power, fire weather and fuel load (Harris et al. 2012). The study found a relationship between the power of
the fire and community losses when houses and population density were added to the statistical model
(Harris et al. 2011).
Recent studies on house loss during post fire surveys have been conducted internationally (Cohen 2000;
Cohen and Statton 2008; Manzello et al. 2010; Maranghides and Mell 2011). Other studies have
investigated the circumstances of firefighter fatalities involving entrapment and burnovers (e.g. Butler and
Cohen 1998; Cheney et al. 2001; Viegas et al. 2008).
Only a few datasets exist on bushfire events in Australia and their related fatalities, and these datasets only
cover a partial amount of constituent data about the bushfire (e.g. losses, or cost, weather). There have
been initiatives to aggregate information from historic bushfires such as:
• EMA database3,
• COAG report (Ellis et al. 2004),
• Risk Frontier database Peril AUS (Crompton et al. 2010; Haynes et al. 2010),
• Romsey4,
• Bushfire CRC dataset (Blanchi et al. 2010).
A variety of information is also contained in post bushfires survey studies conducted after a range of
historic fires. However, these are related to a specific bushfire and focus on some aspect like losses,
building design, fire behaviour (e.g. Barrow 1945; Cheney 1979; Country Fire Authority 1983; Wilson and
Ferguson 1984; Ramsay and McArthur 1995; Leonard and McArthur 1999; Leonard and Blanchi 2005).
There is a need for the development of comprehensive datasets including specification of spatial extent and
circumstances descriptions to suit the needs of the NFDRS project. The lack of a standard to collect data
across Australia on bushfires or the existence of a central repository for this data has lead to the
commission of this project.
3 http://www.disasters.ema.gov.au/ (accessed 31/10/2012)
4 http://home.iprimus.com.au/foo7/firesum.html (accessed 31/10/2012)

11
4 Database description
This section presents the Life Loss database structure, data sources, and the processes employed to collect,
aggregate and code the data. The development of the parameters and the structure of the database were
presented to and discussed with the NFDRS – Science Subgroup, the result of these discussions are detailed
in Appendix 1 – Database Structure. A database structure and set of aspirational parameters were agreed
upon and pursued in the database aggregation process.
4.1 Database structure
4.1.1 STRUCTURE DEVELOPMENT
The AGD NFDRS Life Loss database is a spatial dataset of bushfire related fatalities and related losses and
circumstances (such as house loss, weather context, fire severity, and distance to forest) in Australia for the
past 110 years (1901-2011). Two data typologies were collected, tabular and spatial. Tabular data was
stored in a Microsoft Access database and associated spatial data stored in ArcGIS and Google Earth
compatible files. The data agreed upon with the NFDRS – Science Subgroup was collected within the limits
of data and time availability (see Appendix 1 – Database Structure).
The database structure was developed with consideration of the potential interrelationships between the
agreed parameters culminating in the linked data structure shown in Figure 1 below. The structure consists
of a number of hierarchical tables. A hierarchical table means that each line item in a table is linked to the
one listed directly below it. Tables are linked to each other where common line items existing in different
tables, these are most often data tags such as an Object ID, Fire ID or a GIS Object code.
The final database structure varies only slightly from the one originally proposed with a change that
merged the vegetation and fire front tables into a single table. Hence, each fire event was recorded with a
specific ID and within each of these fire events various incidents were identified. An incident is a single
fatality or a multiple fatality scene where individuals were sheltering or interacting as a collective group.
This allowed collection of all relevant information specific to an incident and also to one or more fatalities.
4.1.2 STRUCTURE DESCRIPTION SUMMARY
The database structure diagram including tables is presented in Figure 1.
The spatial features contain location of fatalities and objects such as houses, vehicles, other objects
associated with an incident. Spatial features are delivered in Shapefile (Environmental Systems Research
Institute, 1998) and Keyhole Mark-up Language (KML) Zipped (KMZ)5 file formats as these are the most
commonly used.
Spatial Information on house loss was included for houses that were associated to a fatalities incident, but
was not collected for an entire fire event as they are part of the data collected for the ‘Fire Severity Rating
Project’6.
5 https://developers.google.com/kml/documentation/ (accessed 30/10/2012)
6 Victorian Department of Sustainability and Environment (DSE) and Bushfire CRC project

12
Figure 1 Database structure diagram

13
The main tables that form the database are provided in the following list (for further details of these tables
and parameters please refer to Appendix 2 - Data category):
Fire Contains information about a fire in which one or more incident occurred.
Incident The incident table associates fires with fatalities and related objects. An incident can
refer to more than one fatality where individuals were sheltering or behaving as a
collective group.
Fatality Contains information about the fatalities that occurred during an incident.
Fire Weather Contains information about the weather conditions associated with the fatalities and/or
proximal weather station records.
Object Contains general information about the objects that are associated with an incident.
These objects may be houses, vehicles, or other objects.
House Contains information about houses associated with an incident.
Vehicle Contains information about vehicles associated with an incident.
Other Object Contains information about other objects associated with an incident. This may include
sheds, fences, dams, trees, etc.
GIS Object
Inventory
Contains information about Geographical Information System (GIS) objects that are
associated with the database.
2009 Vic
bushfires
Contains information on civilian fatalities for the 2009 Victorian bushfires (see Appendix
3 – Coding Scheme 2009 Victorian bushfires)
4.2 Data sources
A number of different data sources were accessed in order to assemble the Life Loss database. This
includes coronial inquest records, royal commission reports, journal papers, books, post bushfire study
reports, fire agency review documents of major fires, newspaper articles and collated datasets on past
bushfire fatalities.
The most comprehensive listing of past fatalities provided was the Risk Frontiers / AFAC Landscape Fire
Fatalities Database 2011 (covers fatalities Australia-wide). This dataset was initially developed by Risk
Frontiers as part of PerilAus, a unique database on the incidence and consequences of Australian natural
hazards (Crompton et al. 2010). The bushfire component of PerilAus was used by Haynes to develop a
dataset of fatalities up until 2008 for the Bushfire CRC (Haynes et al. 2010,). The Risk Frontiers dataset
included information on fatality’s name, date of fatality, activity and behaviour prior to fatality (for further
details see Haynes et al. 2010). AFAC augmented the Haynes et al. (2010) dataset to cover a total of 773
fatalities consisting of 723 civilians and 50 firefighters. This project originally intended to focus on
populating the details of these 773 fatalities. However, through the process of collecting the data a number
of additional civilian and firefighter fatalities were discovered and incorporated. For this report and analysis
the Life Loss database covers a total of 825 fatalities involving 733 civilians and 92 firefighters.
Where possible, information about fatalities was obtained from official inquest documents. These were
obtained either from the relevant state coroner’s courts, or in the case of older records, from the state
public records offices. An inquest is a court hearing into a single fatality, multiple fatalities and/or a fire,
and is heard by a coroner. The coroner's role is to identify the person(s) whom died and to find out how
their fatality occurred, including the cause and circumstances. Inquest documents may include police
reports, witness statements, photographs, expert reports, medical examination reports, and the coroner's
finding. However, there has not been an inquest held for every bushfire related fatality in Australia’s
history, and the amount of information recorded and retained for each inquest varies considerably.
In addition, information was obtained from Royal Commission reports and post fires inquiries for specific
bushfires (e.g. McArthur and Cheney 1967; Ellis et al. 2004). For the 2009 Victorian bushfires no inquests

14
have been held yet, hence the information was obtained from the main Royal Commission 2009 report
(Teague et al. 2010) 7 and from case documents provided by the Coroners Courts of Victoria via a special
permissions process.
Various other sources of information were used such as journal papers (e.g. Wilson and Ferguson 1984;
Ramsay 1987; Cheney et al. 2001), books (e.g. Cheney 1979; Collins 2009), reports on post bushfire studies
(including fire behaviour, surveys, etc.), fire management and fire service reviews of major bushfires (e.g.
Country Fire Authority 1983; Krusel and Petris 1999; NSW Rural Fire Service 2000), the World Wide Web,
newspapers articles sourced from libraries and state public records offices, memorials, discussions with
various state-based fire agencies and personal communications with various fire agency personnel.
The location of spatial features was derived using Aerial imagery (Google Earth and other available aerial
photography) and is detailed in the section on spatial features (see section 4.3.3).
The meteorological data compiled in the dataset and used in the analysis came from various reports and
from standard synoptic observations made by the Bureau of Meteorology (detailed in section 4.3.5). No
standard exists for the recording of meteorological data in reporting or analysing bushfire events and
accommodations needed to be made to capture all the collected data.
Various other sources of data used in the analysis such as the forest layer, isochrones and intensity layers
are described in the analysis methodology section (see section 5.1).
4.3 Data collection and aggregation approaches
This section describes the mechanisms and processes employed to collect and aggregate the data. It also
describes the data elements and the uncertainty and variability associated with them.
Different types of data have been compiled in the dataset: quantitative variables (e.g. weather
information), and categorisation variables (e.g. location of fatality). Some information was categorised
(coded) to facilitate spatial and statistical analysis. Other potentially useful information has been collected
and left as open text such as addresses, and descriptions.
Coding systems used in this project have built upon the coding scheme developed by Haynes et al. (2008) in
the study of all Australian bushfire fatalities before 2008 and the study of 2009 Victorian bushfire fatalities
(O'Neill and Handmer 2010). The additional coding developed for this project relates to the location,
activity of fatality, fire behaviour and fire events. The coding includes both nominal variables (e.g. location
of fatality) and dichotomous variables (yes/no answer). The data were coded by three researchers and the
methods used were discussed and agreed upon during the data entry process.
The dataset also contains some derived variables such as distance to forest which has resulted from
analysis of various database variables and other spatial datasets.
In total 825 fatalities were examined, including 733 civilians and 92 firefighters. The fatalities are unevenly
spread over 260 Australian bushfire events.
4.3.1 FATALITIES
Information was collected on the fatality location, time and circumstances of death. The name, date of
fatality and inquest number (if known) in the Risk Frontiers/AFAC dataset were used to identify the relevant
documents. Our main objective was to determine the location and time of fatal exposure in order to
spatially locate the fatality and to correlate them with other variables. The data collected is detailed in
Appendix 2 - Data category tables and their contents.
7 http://www.royalcommission.vic.gov.au/commission-reports/final-report (accessed 30/10/2012)

15
The level of detail available regarding the location of fatal exposure varied substantially. In some cases the
only information available was the name of the bushfire in which the fatalities occurred. If no information
was available ‘unknown’ was entered. For some cases ’not applicable’ was entered where there is not a
clear or direct link between the fatality and the bushfire event. Rather than removing these from the
dataset they have been included for completeness as they may be useful for other analyses (e.g. still born
baby, drowning, natural causes, and aircraft accident during or after bushfire events).
A variety of sources of information were used to determine the location of fatal exposure. Most locations
were determined from Coroner’s reports and associated maps and sketches. Some fatality locations could
not be spatially determined and have been attributed ‘NA’ (not available).
The time at which the fatal exposure occurred was estimated from reports and other documents. In
addition the isochrones of fire spread were used to determine the time of fire front arrival at the location
of the fatality. However in the cases of people sheltering in their house, this time could vary depending on
the time the house ignited and how long it took for it to lose its tenability.
The location of fatal exposure was coded in four categories:
• inside structure,
• inside vehicle,
• open air, and
• unknown.
A detailed description of the location of the fatal exposure was described for each fatality where sufficient
information was available (e.g. the room where fatalities occurred, position in vehicle, precise distance
from vehicle, or other relevant information). Some of the fatalities coded as ’open air’ were exiting a car or
evacuating a house and were found a distance from a structure or a vehicle. This information was kept in
the detail description to allow further analysis of the distance from structure or vehicle. When possible a
spatial object that the person was in or near when fatal exposure occurred was created.
The analysis is focused on fatalities that have occurred as a direct result of bushfire impact. Two categories
were created to indicate whether a fatality was due directly to a fire mechanism during the bushfire
(smoke, radiant heat flux, convection, flame, heat stress) or of a more indirect nature (natural causes, shock
after the bushfire, drowning). This segregation was to improve the statistical relevance of how proximity
and severity of fire mechanisms influence the life loss. It should be noted that for some fatalities that
suffered from heat stroke or heart attack while fire fighting were included in the analyses due to the direct
nature of their exposure around the time of death hence relevance to the nature of the local fire
mechanisms. As there are many possible definitions that could be developed to define what direct or
indirect loss is, it is suggested that these should be re-derived from the database to suit other specific
purposes.
Other categories included in the Risk frontiers/ AFAC (Haynes et al. 2008) dataset were used (for details see
Appendix 2 - Data category tables and their contents):
• Sex: categories indicating gender of person (male, female, unknown),
• Role class: categories indicating whether person was a firefighter or a civilian,
• Age class: categories indicating age group of person,
• Factors: categories indicating factors that contributed to fatality (e.g. flames, radiant heat, etc.),
• Transport: categories indicating the transport mode at the time of fatality (e.g. on foot, in car, etc),
• Activity prior to fatality: categories indicating the activity prior to death (e.g. sheltering, defending,
evacuating), and
• Decision making: categories indicating the fire plan and decisions taken by a fatality.
The Risk Frontiers / AFAC dataset was quite comprehensive, however the transport activity and decision
making categories were not coded for the 2009 Victorian fires fatalities and for additional fatalities
discovered through the data collection process. These fatalities were coded according to the coding scheme
developed by Haynes et al (2008). One classification category was added to the ‘activity prior to fatality’
field and that is: ‘passively sheltering as a group, or separate families gathering at a ‘community refuge’.

16
In addition, and because of the detailed information available on the 2009 Victorian bushfires, the coding
scheme was expanded. This new coding describes the preparedness; intention and action of the fatality for
this bushfire (see Appendix 3 – Coding Scheme 2009 Victorian bushfires). The new coding includes the
following categories (taking into account the study done by O’Neil and Handmer 2010):
• Preparation prior to the 7th of February 2009 (well, some, none, unknown),
• Preparation on the day (well, some, none, unknown),
• Activity in the last few hours before fatality,
• Time when people carried out their first action,
• Intended fire plan.
4.3.2 OBJECTS (HOUSE, VEHICLE & OTHERS)
Three types of objects, which are directly related to the fatality, were recorded in the dataset: houses,
vehicle and other objects. Objects were considered related to a fatality if they were in or near the object
(e.g. house or vehicle fatality shelter in, house or vehicle fatality evacuated). For each object that could be
located, the status of the object was identified and if it was used as a shelter or not. The status may be
damaged, destroyed, untouched or unknown. All the objects that could be located are identified in the GIS
Object Inventory table, including the precision error associated with them. Few objects could not be
located but still hold interesting information (e.g. material and description of house, or context of
entrapment of the vehicle) and were recorded in the database.
The House, Vehicle, Other Object tables are described in Appendix 2 - Data category tables and their
contents.
4.3.3 SPATIAL FEATURES
Different sources of information were used to determine a person’s location of fatal exposure and other
features (houses, vehicle and other objects). In some cases an aerial photograph with the precise position
of the fatality and objects were available (e.g. the 2009 Victorian bushfire fatalities). In other cases
sketches, without scale or description were the only sources of information. In addition to ground photos,
the description and indication of the location of a fatality from inquests or reports were used to find the
location using Google Earth or other available aerial imagery. When no information on fatalities was
available, the name of the fire was used to determine the approximate location of fatal exposure.
For the 2009 Victorian bushfires, the fatalities and house locations were obtained from aerial photography
and sketches supplied by the Coroners court of Victoria (from Victoria Police forensic analysis). Additional
spatial information collected during post bushfire surveys done by Victorian Fire Research Task Force
(Bushfire CRC) were included (Leonard 2009).
The locations of fatalities were recorded using Google Earth and utilising GIS software (ESRI ArcGIS) to view
the available geo-registered aerial photography. In each case an error precision was associated with the
location: for high precision records a minimum of 5 metres error was attributed, and for the lowest
precision record a maximum error of 100 km was given. This is recorded in the GIS Object Inventory table.
The variability on reported bushfire events and fatalities has an impact on the location of fatal exposure
and other objects. Major Bushfires that have been the subject of detailed inquiries generally have more
spatial information available on fatalities (including description, sketches or photos) independently of when
the fire occurred. Conversely, some historical and even recent cases do not have precise information on the
location of fatal exposure or incident related objects.

17
4.3.4 BUSHFIRE EVENT
A fire event is a fire resulting from a particular origin. Information on fire events came primarily from post
bushfire reports (e.g. Cheney 1979; Leonard and McArthur 1999; Ellis et al. 2004; Blanchi et al. 2010).
Information contained in the EMA Database, and in Risk Frontiers’ database Peril Aus8 were also used. The
Peril Aus dataset was created using Sydney Morning Herald newspapers and various government reports
and includes information on the physical characteristics of the bushfire event where available (Haynes et al.
2008). The data collected and recorded in the Fire table are described in Appendix 2 - Data category tables
and their contents.
The date of the fire was set as the date of fatal exposure, for fires that have started earlier than the date of
fatal exposure the date of origin was also recorded when available. The objective was to record information
on the weather context before the fire and the broad changes of weather context during the day. For
example indications of wind change were listed with time and direction of wind change. For some fire
events there is only a mention of wind change during the day without the specific time or wind direction
provided.
Information on the broad type of unmanaged vegetation that the fire travelled through was categorised as:
• forest,
• grassland,
• scrub, and
• combination (more than one type of vegetation, e.g. forest and grassland).
In this report the term ‘unmanaged’ is used to describe the typical vegetation types that supported the fire.
Unmanaged is a common term to describe fuel that is not heavily modified or maintained e.g. an old
growth forest is unmanaged and a cultivated garden is managed.
The number of houses lost for each fire event was compiled from different sources of information: various
reports on post bushfire surveys (e.g. Cole 1983; Country Fire Authority 1983; Ramsay 1987, Ellis et al.
2004, specific studies on house loss (e.g. Leonard 1999, Blanchi 2010, Harris et al. 2011), and specific
databases (e.g. EMA database9).
An attempt was made to record information on reported intensity of fire, rate of spread and direction of
fire. However, since this was only available for a small number of fires, the data was not used for the
analysis. In contrast, fire severity and fire direction have been calculated for a large number of individual
fatalities and were used in the analysis phase (described in the section 5.1).
4.3.5 WEATHER CONTEXT
Meteorological data was obtained from information contained in fire behaviour reports, inquests, and
other relevant reports (e.g. Foley 1947; McArthur and Cheney 1967; McArthur 1982), the Bureau of
Meteorology’s significant weather summaries10 and standard synoptic observations. The intent was to
choose data from the closest available weather station to the fatality, depending on whether the station
data was available and captured the required time period.
Information from pre 1945 fires was obtained from Foley’s report (Foley 1947). This report is an extensive
study of the meteorological conditions of bush and grass fires from 1912 to 1945 in Australia. However, the
report provides limited data on each fire day; either maximum temperature of the day or a combination of
different climatic variables at different times of the day. Due to the inconsistency of early weather records,
it was decided to record weather condition from 1926 (being the date of a major bushfire event in Victoria).
8 Information received October 2012
9 http://www.disasters.ema.gov.au/ (accessed 31/10/2012)
10 http://www.bom.gov.au/inside/services_policy/public/sigwxsum/sigwmenu.shtml (accessed 30/10/2012)

18
One fire may have a number of fire weather records associated with it. The number of and type of
meteorological records for each fire was dependant on the availability of data. Meteorological data was
recorded at different times throughout the day or recorded at different nearby weather stations. The two
sources of data used were:
- The weather station observations. The set of observations11 used in this project include a number
of weather stations across Australia. Few stations have a complete unbroken record of climatic
data; some sites have been closed, reopened or upgraded. Variations occur in the number of
variables recorded and in the frequency of recordings each day (product from the Bureau of
Meteorology11), and
- The historical fire weather dataset described by Lucas (Lucas 2007; Blanchi et al. 2010; Lucas 2010).
Several observations were recorded for each fire when possible and each record was given a name
depending on the type and time of the observations. ‘3pm’ were observations at 3PM, ‘TOE’ were
observations at time of exposure, ‘Max’ were maximum of the variable recorded, and ‘CLucas’ were records
from Lucas historical datasets (Lucas 2010).
Eighteen variables were recorded in the Fire Weather table. These include the date of the weather record,
the time of weather record, the weather station name, station number, drought factor (from report or
calculated from Griffiths, 1999), temperature (C), relative humidity (%),wind speed (km/h) average over 10
mins, wind speed (km/h) over 3 second gusts, wind direction, curing percentage, Forest Fire Danger Index
(FFDI) reported, Grassland Fire Danger Index (GFDI) reported, FFDI calculated using wind speed average,
FFDI calculated using wind gust, GFDI calculated using wind speed average, and description of the record or
reference (for details see Appendix 2 - Data category tables and their contents). In total 320 records of
weather information were captured for 146 bushfires.
The FFDI and GFDI calculation were based on the McArthur Forest Fire Danger Index meter Mark5 and
Grassland Fire Danger Index meter Mark4 (McArthur 1967). The basic equations (see equation 1 and 2)
come from Noble et al and Purton (Noble et al. 1980; Purton 1982), i.e.
( )RHVTDFFFDI 0345.00234.00338.0ln987.045.0exp2 −+++−= (1)
where DF is a drought factor (using Griffiths 1999), T is temperature (ºC), V is wind speed (km/h) and RH is
relative humidity (%).
)RH0.09577-V0.2789+0.01201TC))-000.004096(1-(0.00925410^ 1.536 +=GFDI (2)
where C is percentage of grass curing and other variables hold the same definition as in equation (1).
The FFDI was originally developed for fire management purposes and relates the expected fire behaviour
and rate of spread in common fuel types in eastern Australia (McArthur 1967; Luke and McArthur 1978). It
is also used to provide a basis for forecasts, community warnings and setting of design fire intensity for
urban design in Australia (Standards Australia 2009).
In this study the FFDI is used to characterise the fire weather intensity and its potential for destruction, and
has been used in other studies for precisely that purpose (Bradstock and Gill 2001; Blanchi et al. 2010;
Harris et al. 2011).
4.3.6 UNCERTAINTY AND VARIABILITY
The uncertainty and variability in the data is often due to the different sources and quality of data available
and the processes used to generate the data.
The data collected in relation to bushfire events, fatalities and house losses are affected by the variability in
source. The main causes are lack of evidence or information to locate a fatality or categorise some of the
11 Product IDCJHCO1.200806 from the Bureau of Meteorology

19
information associated with it. Information was discussed amongst the researchers involved in the coding
and data entry to ensure consistency where interpretation was required to categorise the data (e.g.
variation in the reported information from different sources).
In regards to the precision of a fatality location, a lot of effort has been made to accurately determine the
position of fatal exposure and related features. In some cases a variety of sources of information were
used. In other cases, the lack of information (in particular for small fires or fires with a low number of
fatalities) made it difficult to determine locations. To inform users, an error precision was assigned for
every location to indicate its spatial accuracy. However, in some cases, locations and circumstances could
not be determined. This mostly occurred for historical minor events which were often aggregated for the
fire season or not reported.
The nature of the source information will undoubtedly have an influence in the results of the analysis.
Generally there was a large quantity of information associated with large bushfires and missing data or
highly inaccurate information for small events with a low number of fatalities. Another significant influence
on data collection and the results of the analysis is the period the fire occurred, with older fires having less
detail or little information available.
4.4 Dataset example
The example of the Cockatoo fire in 1983 is given to show an example of the data collected. The example of
the data collected for the fire event is given in the Table 1. The weather conditions collected on the day are
given in the Table 2. An example of information collected on vehicles is given in the Table 3. Finally an
example of spatial information is shown in Figure 2.

20
Table 1 Description of data collected for the Cockatoo 1983 fire event
Variables Data collected
Fire Code 2981
Fire name Cockatoo, February 1983
Weather context before fire Extremely hot conditions prevailed in February (analysed in BOM report)
Wind change yes
Time of Wind change 17/02/1983 21:05
Wind direction after change SW
Unmanaged Vegetation type Forest
Direction of fire spread S-SE to NE
Location of origin of fire Wright road and Dalziell Road
House loss 307
Time of origin of fire 17/02/1983 19:30
Description Ignition near Wright road and Dalzell road (Avonsleigh) spread through
South to south east to the vicinity of Bailey road Cockatoo. This fire
commenced around 7:30pm upon wind change at 9:07pm, fire swept
north East. After the change it progressed in a series of spots,
developing very quickly, crowning and fire storms, defoliation of canopy
indicated high fire intensity. Deaths occurred after wind changes
(between 9-10pm). Forest and undergrowth of sword grass, wire grass,
bracken.
Associated documents CFA, BOM
Table 2 Weather conditions collected for the Cockatoo 1983 fire
Variable Data collected Data collected Data collected
Time 15:00 21:00 21:30
Weather qualifier 3pm TOE* 9pm TOE* 9:30pm
Date 16/02/1983 16/02/1983 16/02/1983
State VIC VIC VIC
Station Mel Airport Mel Airport Mel Airport
Station number 86282 86282 86282
Drought factor 10 10 10
Temperature (C) 41.2 29 27
Relative humidity (%) 7 37 42
Wind (km/h) avg 10 mins 44.6 70 52
Wind direction 360 250 250
FFDI Calculated 111 47 24
*TOE: time of exposure

21
Table 3 Data collected on vehicle object
Vehicle
Object
Code
Vehicle
detail Context of entrapment
vehicle
journey
origin
vehicle
journey
intended
destination
Description of
vehicle and
surrounds
V0055 Honda
Accord Reversed into street sign and was
driving in a panicked way they then
confronted with a wall of flames and
one fatality told all to exit & lie in
gutter.
Fatality
house Not known Scattered eucalyptus
V0056 Van
support
vehicle
Van failed to turn and struck a stump,
driver escape with burns. Passenger
(fatality) trapped in vehicle when it
was engulfed in flames.
Unknown Unknown Heavy forested area.
In a support vehicle
when it was trapped
by flames after the
wind change
Figure 2 Example of spatial data collected on the Cockatoo 1983 fire (red point: fatality, white square: houses and
other structure, Aerial photography from CFA)

22
5 Data analysis methodology
Two main approaches have been utilised to understand the circumstances surrounding each fatality:
- Spatial analysis was used to derive proximity information in relation to a fatality,
- Statistical analysis was performed on the dataset compiled on the fatalities and the relevant
environmental circumstances.
The results of these analyses were used to provide a preliminary perspective of the relationships between
one or more variables, and they were used to identify the role a variable or a group of variables may have
played in understanding the circumstance of the fatality.
5.1 Spatial analysis
A collection of spatial information was used to determine the environmental circumstances such as the
location and extent of objects directly related to an incident, vegetation layers, isochrones and fire severity
layers. For consistency, accuracy and ease of comparison, distances between features were measured in a
straight line and were only derived where proximal objects were able to be accurately geo-referenced.
• The spatial analyses were conducted in relation to: The distance to residence (where available)
o The straight line distance from a fatal exposure location to their place of residence. Analysis
included also the straight line distance from a fatal exposure location to the main structure
with which the fatality interacted with (as for a small number of cases an alternative house
than the residential house was the main house they interact with).
• The distance to an exited vehicle (where available and pertinent).
o The straight line distance from a fatal exposure location to a vehicle which had been exited
(noting that in some cases some partial exposure in the vehicle may have contributed to
the death).
• The distance to forest (further explained in Figure 3)
o The straight line distance from the fatal exposure location to the closest forest, and the
straight line distance from the fatal exposure location to the forest in the direction of the
approaching fire front, and
o Calculation of the fraction of forest within 100 meters of the fatal exposure location. The
arbitrary figure of 100 meters was determined to be the appropriate due to its use as a
definitive distance in building regulations (Standards Australia 2009).
• The fire severity
o Rate of spread obtained from isochrones,
o Main direction of fire front from isochrones, and
o Fire severity at the location of fatality.

23
Figure 3 Representation of fraction of forest (green) and distance to forest used in the analysis
5.1.1 DISTANCE TO FOREST
The National Carbon Accounting System (NCAS) forest/non-forest (FNF) dataset and Lidar data were used
to determine the distance to forest and surrounding forest density from a fatal exposure location where
data was available.
The forest analysis does not inform us of grass or short vegetation fuel (less than 2 meters in height) or
forests covering less than 0.2 hectares.
National Carbon Accounting System (NCAS) forest/non-forest layer (FNF)
The NCAS FNF products are binary images developed for the purposes of tracking forest extent and
monitoring deforestation and reafforestation. Forest is defined according to the National Forest Inventory
as vegetation with a minimum 20% canopy cover, potentially reaching 2 meters high and a minimum area
of 0.2 hectares. The product is based on satellite imagery from Landsat sensors12. Candidate pixels for a
yearly Australian mosaic are selected to minimise cloud cover and maximise the natural discrimination
between forest and non-forest classes. A discriminate process is applied with localised training for each
class. This effectively provides a probability of forest for each Landsat pixel. Based on a threshold of
probability, a binary image of forest extent is produced. Much of the processing is conducted by
contractors external to the federal government, with auditing conducted by the Department of Climate
Change and Energy Efficiency (DCCEE). The processing methodology is described in detail in Furby (2002).
The FNF product consists of 37 tiles of varying extent with a spatial resolution of 0.0025 degrees
(approximately 25 meters).
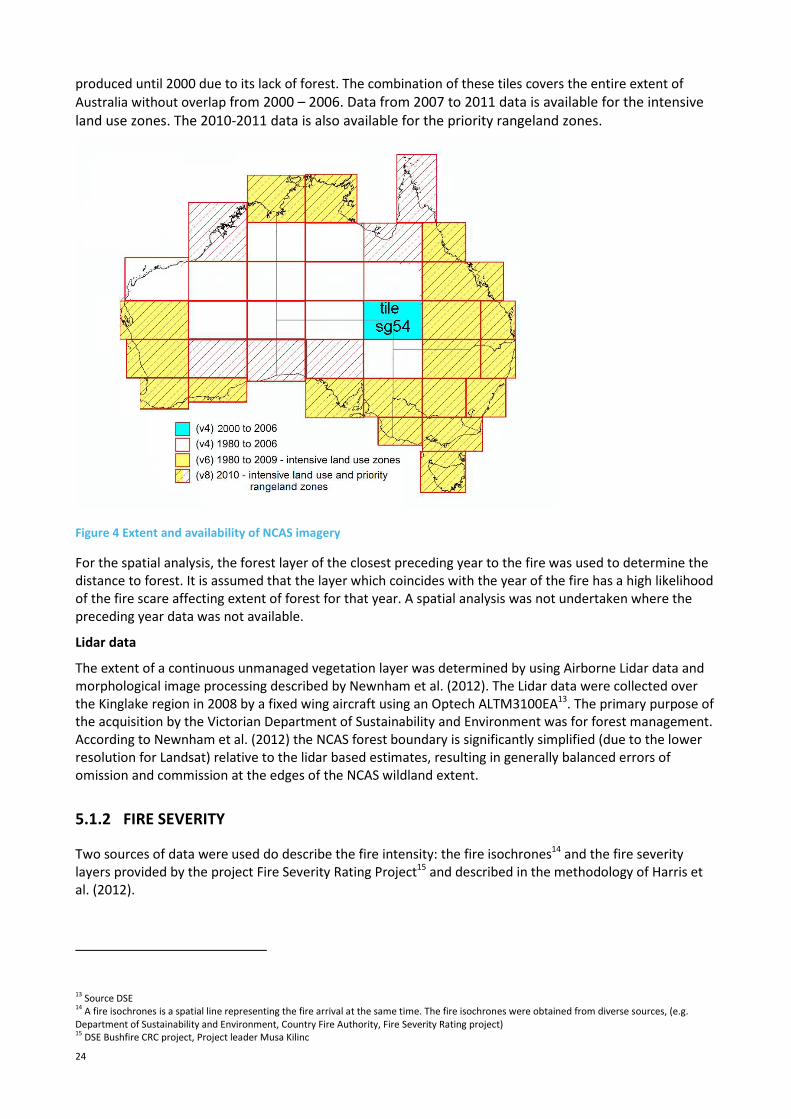
The NCAS product tiles are classified in two categories; the intensive and non-intensive land use zone. The
spatial coverage of each tile (outlined in red) and each of these zones can be seen in Figure 4. In general,
this follows the relative population density for each tile and it is assumed that deforestation and
reafforestation will occur more rapidly in areas of high human habitation. For this reason, processing of the
intensive land use zone tiles is given priority over those that cover the non-intensive zone. Tile sg54 was not
12 Namely, Landsat Multispectral scanner (MSS), Thematic Mapper (TM) and Enhanced Thematic Mapper (ETM).
24
produced until 2000 due to its lack of forest. The combination of these tiles covers the entire extent of
Australia without overlap from 2000 – 2006. Data from 2007 to 2011 data is available for the intensive
land use zones. The 2010-2011 data is also available for the priority rangeland zones.
Figure 4 Extent and availability of NCAS imagery
For the spatial analysis, the forest layer of the closest preceding year to the fire was used to determine the
distance to forest. It is assumed that the layer which coincides with the year of the fire has a high likelihood
of the fire scare affecting extent of forest for that year. A spatial analysis was not undertaken where the
preceding year data was not available.
Lidar data
The extent of a continuous unmanaged vegetation layer was determined by using Airborne Lidar data and
morphological image processing described by Newnham et al. (2012). The Lidar data were collected over
the Kinglake region in 2008 by a fixed wing aircraft using an Optech ALTM3100EA13. The primary purpose of
the acquisition by the Victorian Department of Sustainability and Environment was for forest management.
According to Newnham et al. (2012) the NCAS forest boundary is significantly simplified (due to the lower
resolution for Landsat) relative to the lidar based estimates, resulting in generally balanced errors of
omission and commission at the edges of the NCAS wildland extent.
5.1.2 FIRE SEVERITY
Two sources of data were used do describe the fire intensity: the fire isochrones14 and the fire severity
layers provided by the project Fire Severity Rating Project15 and described in the methodology of Harris et
al. (2012).
13 Source DSE
14 A fire isochrones is a spatial line representing the fire arrival at the same time. The fire isochrones were obtained from diverse sources, (e.g.
Department of Sustainability and Environment, Country Fire Authority, Fire Severity Rating project) 15
DSE Bushfire CRC project, Project leader Musa Kilinc

25
The calculation of rate of spread of fire was completed between the two closest isochrones around the
fatality location if it was available. However some of the high fire severity values need to be interpreted
with caution due to the fact that they are based on improbably high rates of spread due to long distance
spotting. Discrepancies between calculated time of fire arrival from isochrones and time of death are
assumed to be due to the inaccuracies inherent in both data. Isochrones are primarily affected by temporal
inaccuracies in climatic data.
The Byram (Byram 1959) fire intensity and power calculations were made by using estimates of: grass,
surface, fine fuel load, near surface fuel load, elevated fuel load, bark fuel load and canopy fuel load. An
assumption was made that all fuel was consumed at the flame front. In calculating fire intensity and power,
the heat of combustion (H) was assumed to be 15,000 KJ/kg (Harris et al. 2012).
Fire intensity calculations were derived using the assumption that fire front progressed steadily from one
fire isochrones to the next, this assumption becomes flawed when the fire progression rates become
dominated by forward spotting. Under these conditions new fire fronts form well ahead of existing fire
fronts which later fill in the gap between the two, hence the fuel would not consumed at a rate or intensity
as high as would be assumed by the above assumption.
5.2 Statistical analysis
A range of statistical analyses were performed using the data extracted from official reports:
- Frequency analysis is used to describe the data collected (on fatality, fire events),
- Contingency table analyses (cross-tabulation analysis) have been used to understand the
relationship between two (or more) variables (e.g. location of a fatality and forest fire danger
index). A cross-tabulation is a two (or more) dimensional table that records the number (frequency)
of responses that have the specific characteristics described in the cells of the table.
- Regression analysis, and
- Tri-dimensional probability density visualisation.
Data queried from the Life Loss database developed for this project and the data extracted from the spatial
analysis were used for the statistical analysis.
The following categories are considered in the analysis:
- The demographics: the analysis takes into account the two types of fatality (civilian and firefighter),
the gender, the cause of fatality (directly related to the fire or not),
- The geographic distribution by state and time distribution of fatal exposure,
- The distribution of number of fatalities for each fire event are examined, the analysis includes the
number of houses lost and fatalities for each year,
- The spatial locations of all fatalities in Australia are presented. The fatalities location categories
(inside structure, inside vehicle, open air, unknown, describe in section 4.3.1) is examined to
determined if there is any relationship with other variables (activity, decision making and weather
context),
- Fatality activity and decision making are presented for the three time period and also for 5 major
bushfires. The activity and decision making was also examined in relation to other circumstances
such as the location of fatal exposure and weather context using multivariable analysis,
- The relationships between the fatalities, the location of fatal exposure and the fire weather
conditions under which the event occurred was examined using the McArthur FFDI and its
components at 3pm and at time of exposure (Luke and McArthur 1978, Noble et al. 1980). Other
aspects such as wind changes and the consequences on fatalities are also covered,
- The relationships between the fatalities, the location of fatal exposure, the distance to forest, and
fire severity are examined. The fatality locations with a precision confidence greater than 100m are
removed from the analysis, and
- The Victorian 2009 bushfire was the object of a specific coding. The results from the coding are
presented in a separate section (see 6.9 Results from the Victorian 2009 bushfires).

26
6 Results and discussion
The results of analysis in this section seek to qualify minimum thresholds, potential surrogate qualifiers,
and the specific role houses play in contributing to the causality of fatality. In doing so the analysis attempts
to answer the following questions:
• What is the type and prevalence of activities leading up to the fatalities and how are these qualified
against other circumstantial drivers?
• What is the minimum weather threshold for the potential for life loss to occur?
• Is there a strong correlation between fire weather severity and historic life loss?
• Is house loss or other alternatives such as fire severity, a potential surrogate indicator for predicting
life losses if a number of key qualifiers are incorporated?
• How are life loss and the proximity to and prevalence of fuels related?
• Does multivariable analysis improve the statistical correlation between circumstance and life loss?
• Can a working classification of life loss risk be developed for use in the fire danger rating system?
The results and discussion section is focused on the data and categories analysis in order to answer those
questions. Each subsection will provide some relevant information to parts of these questions, a conclusive
summary of these questions is later provided in conclusions.
The Life Loss database contains 825 fatalities, 733 are civilian and 92 are listed as firefighters. The data
refers to fatalities between 1901 and 2011 inclusive during which time the average rate of civilian deaths
was 6.6 per year. Of fatalities contains in the database 741 were directly related to the fire itself (674
civilians and 67 firefighters). Fifty fatalities are indirectly related to a fire event and the specific cause of
death for 34 persons is unknown or unclear. The analysis of fatalities that were directly related to the fire
mechanisms is a useful subset to describe fire severity and fire weather severity related factors
The results are first presented for all fatalities for the entire period, and then categorised into civilians and
firefighters. The study analysis focused mainly on civilian fatalities as this is useful to describe issues of
warnings and life loss locations that are not biased by the nature of firefighter related fatalities.
Some of the results are presented in two time periods. The separation of the data was explored in Haynes
et al. (2010), with results presented before 1955 and after 1955. For this project the data was arbitrary split
according to the density of data available. The first time period includes data from 1901 to 1964, for which
less information is available. The second time period has been defined from 1965 to 2011 and represents
the period where significantly more data was available on the fire events. This segregation of data also
happens to be useful in distinguishing some patterns over the years, and provides an opportunity to
compare demographic context relating to social behaviour and prevalence of technologies such as
automobiles.
As stated in the original project description the analysis is limited to fatalities contained in the Life Loss
database and does not attempt to study these as a proportion of the total population affected in the fires
(unless it is specifically stated).
Fatalities were analysed with regard to their location. Categories of fatalities were used to explore the
relationship with fire weather and distance to forest.
The following subsections draw on various subsets of this data focusing on the data’s relevance to the
variables being considered.
Significance tests have been performed on various variables to estimate the correlation between variables.
To determine if the correlation is statistically significant the sample size and the critical value of the
correlation coefficient is used with a minimum significance level of 0.05 (unless stated differently in the
results).

27
6.1 Demographics
The gender, age and distribution of all fatalities (civilians and firefighters) were studied to help inform
specific trends relating to assumed behaviours or activities. Data was grouped into three time periods; for
the entire time period of data, pre 1965, and post 1965. The gender role could demonstrate an evolution of
behaviour in the different roles of men and women over the century. Various other comparisons with
gender, age and role are also provided in subsequent sections.
Table 4 shows the distribution of fatalities by gender and by age over the entire period and for the two sub-
periods considered. The proportion of males dying in earlier fires (79%) is significantly greater than the
proportion dying in recent fires (62.3%) (z=5.19, p<0.001). Conversely, the proportion of females that died
in earlier fires (14.9%) is significantly less than the proportion that have died in the recent fires (35.8%)
(z=6.65, p<0.001).
Table 4 Age and gender for the three time periods (all fatalities – civilians, firefighters and non-directly related
fatalities)
1901-1964 1965-2011 1901-2011
(total)
z p
Total number
killed
343 482 825
Male 272 (79%) 300(62.3%) 572 (69.3%) 5.19 <0.001
Female 51 (14.9%) 173 (35.8%) 224 (27.2%) -6.65 <0.001
Unknown 20 (5.8%) 9 (1.9%) 29 (3.5%)
Age
0-9 32 (9.4%) 29 (6%) 61 (7.4%) 1.81 <0.1
10-19 31 (9.1%) 36 (7.5%) 67 (8.1%) 0.83 >0.1
20-29 33 (9.6%) 50 (10.4%) 83 (10.1%) -0.33 >0.1
30-39 29 (8.5%) 54 (11.2%) 83 (10.1%) -1.27 >0.1
40-49 34(9.9%) 54 (11.2%) 88 (10.7%) -0.57 >0.1
50-59 24 (7.0%) 74 (15.3%) 98 (11.9%) -3.63 <0.001
60-69 27 (7.9%) 68 (14.1%) 95 (11.5%) -2.74 <0.01
70-79 20 (5.8%) 34 (7.0%) 54 (6.5%) -0.68 >0.1
80 and above 6 (1.8%) 31 (6.4%) 37 (4.5%) -3.19 <0.005
Unknown 107 (31%) 52 (11%) 159 (19.3%)
With regards to the differences in proportion of fatalities between earlier and later fires by age, significant
differences were observed in the:
• 0-9 age group (significantly more deaths in the earlier fires)
• 50-59 age group (significantly more deaths in the later fires)
• 60-69 age group (significantly more deaths in the later fires)
• 80 and above age group (significantly more deaths in the later fires)
Z-values and p-values for these tests are displayed in Table 4 and are the results of a statistical test to
compare the proportions dying in period 1901-1964 vs. period 1965-2011.
In summary, in earlier fires a higher proportion of the lives claimed were of young children, and more
recent fires have claimed the lives of a higher proportion of older people. The distinction between civilians
(further broken into gender) and firefighters is shown in Figure 5 for the two periods considered and for all
known genders (29 unknown). This figure highlights the significant increase of female civilian fatalities in
recent fires.

28
Figure 5 Number of fatalities by gender between the period 1901-1964 and the period 1965-2011 (distinction
between civilian and firefighters)
6.2 Distributions of fatalities and house loss
The distribution of fatalities by year and by state is presented in this section to show the dominance of
iconic events in the loss profile and the concentration of losses spatially across the continent. The losses
per event and spatial distribution of loss is strongly influenced by fire weather severity which is not
considered specifically in this section, refer to section 6.6 for a detailed review of fire weather related
influences.
6.2.1 DISTRIBUTION BY YEAR
Figure 6 and Figure 7 indicate that the number of fatalities is dominated by a few major events resulting in
large number of the fatalities. This is in accordance with the finding of Haynes et al (2010).
Figure 6 Distribution of number of fatalities over the time period (1901-2011) including civilian and firefighters
0%
10%
20%
30%
40%
50%
60%
1901-1964 Civilian 1965-2011 Civilian 1901-1964 Firefighters 1965-2011 Firefighters
Pe
rce
nta
ge
of
fata
liti
tes
Male
Male
Male
FemaleFemale
MaleMale
Female
0
20
40
60
80
100
120
140
160
180
19
01
19
04
19
07
19
10
19
13
19
16
19
19
19
22
19
25
19
28
19
31
19
34
19
37
19
40
19
43
19
46
19
49
19
52
19
55
19
58
19
61
19
64
19
67
19
70
19
73
19
76
19
79
19
82
19
85
19
88
19
91
19
94
19
97
20
00
20
03
20
06
20
09
Ag
gre
ga
ted
Fa
tali
tie
s
Male Female

29
While the graph shows no consistent trend there is an increase in the loss per year rate when comparing
the two time period categories (1901-1964 and 1965-2011). For the period 1901-1964, 5.1 civilian fatalities
occurred per year and for 1965-2011, 8.6 fatalities occurred per year.
The number of houses lost for the period 1901-2011 shows a similar pattern (see Figure 7) and is
dominated by the same iconic events (Blanchi et al 2010). There is a more noticeable bias toward losses in
more recent years. This is in part due to the lack of house loss data in the 1901-1926 time period and also
due to better record of house losses in recent years. Keeping this in mind the 1901-1964 house loss average
is 44 per year and the 1965-2011 average is 168 per year. The correlation between house and life loss is
explored in detail in section 6.3.2.
Figure 7 Distribution of number of house burnt (destroyed) over the time period (1901-2011)
6.2.2 DISTRIBUTION BY STATE
Each state of Australia has unique fire weather severity characteristics, policies, building stock, population
sizes and vegetation characteristics. The Life Loss database allocates fatalities to the state in which they
occurred. In considering the relative importance and stringency on a state-by-state basis it may be relevant
to consider the historic loss as a breakdown into categories by state. The Table 5 and Figure 8 show the
number of fatalities for each state over the entire time period and the two sub-time periods.
Table 5 Total fatalities by jurisdiction for the three time periods (all fatalities – civilians, firefighters and non-directly
related fatalities)
1901-1964 1965-2011 1901-2011
(total)
ACT 1 (.3%) 4 (.8%) 5 (0.6%)
NSW 74 (21.6%) 65 (13.4%) 139 (16.8%)
NT 0 (0.0%) 5 (1.0%) 5 (0.6%)
QLD 16 (4.7%) 9 (1.9%) 25 (3.0%)
SA 19 (5.6%) 38 (7.9%) 57 (6.9%)
TAS 2 (0.6%) 66 (13.7%) 68 (8.2%)
VIC 222 (64.0%) 284 (58.8%) 506(61.3%)
WA 9 (2.6%) 11 (2.3%) 20 (2.4%)
Total 342 483 825
0
500
1000
1500
2000
2500
19
01
19
04
19
07
19
10
19
13
19
16
19
19
19
22
19
25
19
28
19
31
19
34
19
37
19
40
19
43
19
46
19
49
19
52
19
55
19
58
19
61
19
64
19
67
19
70
19
73
19
76
19
79
19
82
19
85
19
88
19
91
19
94
19
97
20
00
20
03
20
06
20
09
Nu
mb
er
of
ho
use
s d
est
roy
ed

30
Figure 8 Distribution of fatalities by State (all fatalities – civilians, firefighters and non-directly related fatalities) on
population density map June 2010 (From 3218.0 - Regional Population Growth, Australia -Year book Australia 2011 -
http://www.abs.gov.au/ausstats/[email protected]/mf/3218.0 - accessed 07/01/2013)
The number of fatalities varies greatly in each state with more than 60% of all fatalities having occurred in
Victoria. Five major events represent 66% of the losses in Victoria, Black Friday 1939 (64 fatalities), the
January 1944 fire (33 fatalities), Lara fire in 1969 (18 fatalities), Ash Wednesday in February 1983 (46
fatalities) and the Victorian bushfires in 2009 (173 fatalities). Interestingly, 60% of house loss also occurred
in Victoria during the same five major events (Blanchi et al 2010). To provide some qualification of the
influence of population density on the spatial distribution of fatalities, Figure 8 provides a population
density map (the data is from June 2010).
There is a clear trend for fatality rates to decrease when moving further north into the more tropical
climate zones as climate conditions are less favourable to severe fire and population density reduce.
Figure 8 also shows the distribution of firefighters by State, the majority of the losses occurred in New
South Wales (40) and Victoria (32).
6.2.3 DISTRIBUTION BY MONTH OF FATALITY
Fire weather seasonality can be highly influential in providing the necessary conditions for loss, hence it
may be useful to profile fatalities with respect to the month that they occurred. Figure 9 shows the
distribution of fatalities by month, 81% of all fatalities have occurred during the months of January and
February which represent the peak of the fire season in the southern states (see Figure 10 bushfire season
3
2
23
2 18
2
43
14
99
40
5 474 32
67
1
Civilians - 733
Firefighters - 92
Total fatalities - 825

31
across Australia). There is not a representative profile for the fire season in the far north as losses occurred
in a comparatively mild fire climate.
Figure 9 Number of fatalities per months (including civilian and firefighters)
Figure 10 Bushfire season across Australia (from http://www.csiro.au/en/Outcomes/Environment/Australian-
Landscapes/Fire-Season-Months.aspx16
)
16 Accessed 17/12/2012
0
50
100
150
200
250
300
350
400
450
Nu
mb
er
of
fata
liti
es

32
6.2.4 DISTRIBUTION BY HOUR OF FATALITY
Understanding the timing implications for evacuation of areas forecast to receive severe fire weather is a
key consideration for future bushfire risk management policy. Figure 11 profiles the time of fatal exposure
(when known) for both firefighters (n44) and civilians (n397). This figure shows a clustering of civilian
fatalities from 10am through to 11pm with one peak at 10am. This peak is mainly due to a single loss event,
where 17 motorists lost their lives on the Princes Highway between 10am and 11am in the Victorian Lara
fire in 1969. Without this anomaly, the civilian fatalities exhibit a normal distribution around 6pm.
Firefighter fatalities have a similar fatality time distribution to civilians, however there is a very distinctive
dip during the peak of civilian fatalities.
Figure 11 Hour of civilian and firefighter fatal exposure for all directly related deaths (each category is from 0:00 to
0:59)
Figure 12 also shows the distribution of civilian fatalities (n397) but is broken further into location
categories (148 inside structure, 43 inside vehicle, 206 open air). The Lara fire is prominent as open air
losses as all of the motorists were caught in the open after fleeing their vehicles. Fatalities in houses show
than a large proportion of fatalities occurred around 6pm due to the 2009 black Saturday bushfires. The
peak around 9pm is largely attributed to the Ash Wednesday 1983 fires in Victoria.
Figure 12 Hour of civilian fatal exposure for each location type (directly related to bushfire)
0
10
20
30
40
50
60
70
80
1 2 3 4 5 6 7 8 9 10 11 12 13 14 15 16 17 18 19 20 21 22 23 24
Nu
mb
er
of
fata
liti
es
Hour of fatal exposure (24hr time) Civilians Fire Fighters
0
10
20
30
40
50
60
1 2 3 4 5 6 7 8 9 10 11 12 13 14 15 16 17 18 19 20 21 22 23 24
Nu
mb
er
of
civ
ilia
ns
Hour of fatal exposure (24hr time) In structure In vehicle Open air

33
6.3 Loss per Fire events
The Life Loss database captures 825 fatalities occurring over 260 fire events. For some of these fire events
the house loss levels are also known and have been added to the dataset. An analysis of the levels of loss
within each event has been performed to understand the distribution of life loss number per event and to
then examine any potential correlation between life and house loss levels per event. This understanding
may be useful in broadening the understanding of future risk profiling methods that focus on either house
or life loss specifically. Inquiry processes such as the Teague Royal Commission set out classification
guidelines for defining a fire event17. Using these classifications there is, for example, Black Saturday 2009
as a single fire day that involved five separate fire events resulting in fatalities (Kilmore fire, Churchill Fire,
Murrindindi fire, Maiden Gully fire, Beechworth fire).
6.3.1 LIFE LOSS PER FIRE EVENT AND INCIDENT
Figure 13 shows a breakdown of all 260 fire events in terms of the number of fatalities per event. Fire
events have been classified according to the number of fatalities in an event. The figure shows an obvious
exponential decline in the number of fatalities; significantly more fire events have a low number of
fatalities per event. Both civilian and firefighter fatalities track with a similar trend.
Figure 13 Number of fire events as a function of the number of fatalities class in a fire event (all fatalities)
Figure 14 emphasises the relative balance between many fire events with few losses compared to few
events with many losses. Fifteen major fire events involving 9 or more fatalities per event represent 51% of
all civilian fatalities. These events have occurred during 10 fire days and are detailed in the Table 6. The
total number of fatalities during those days account for 65% of all civilian fatalities.
17 http://www.royalcommission.vic.gov.au/commission-reports/final-report (accessed 30/10/2012)
0
20
40
60
80
100
120
140
160
1 2 3 4 5 6 7 8 9 10-19 20-29 30-39 40-49 >60
Nu
mb
er
of
fire
ev
en
ts i
n e
ach
cla
ss
Number of fatalities class according to the number of fatalities occuring in a fire event
Civilian Firefighter

34
Figure 14 Aggregated fatalities function of fatalities class (fire event have been classified according to the number of
fatalities in an event)
Table 6 Ten major fire days in Australia involving fatalities
Date of fire Total number
of civilian
fatalities
Number
of events
Number of
house loss*
Major fire event >9 civilian
fatalities (number in bracket)
Weather context
14/02/1926 31 7 550 (number
varies)
Gippsland – VIC - Gilderoy &
Powelltown (16)
FFDI 67. Described as “hot
North wind’
10/01/1939 19 2 650 houses
reported for
all 1939 fire
Black Friday bushfires - VIC –
Rubicon 12)
FFDI 72.These bushfires
affected a large area of
Victoria (during heatwave).
Described as a very hot day,
“wind blowing as hurricane”
13/01/1939 47 12 Around 650
houses
reported for
all 1939 fires
Black Friday bushfires - VIC–
Matlock (22), Tanjil (9)
FFDI 72.These bushfires
affected a large area of
Victoria (during heatwave).
Described as “a very hot day
with strong wind”
14/01/1944 35 11 Around 700
for all 1944
fire
Linton – VIC (12) FFDI around 100-150.
Described as “very hot day
and strong wind”
14/02/1944 13 2 Around 700
for all 1944
fire
Morwell bushfires - VIC (9) FFDI 66
7/02/1967 64 1 1257 Black Tuesday, Hobart - TAS
(64)
FFDI 95 (reported 85).
8/01/1969 20 3 230 Lara (18) FFDI 134
16/02/1983 27 2 383 Ash Wednesday - SA -
Narraweena (14),
Adelaide Hills (13)
FFDI 130
16/02/1983 46 5 2060 Ash Wednesday – VIC -
Beaconsfield (9),
Warrnambool (9)
FFDI 145
7/02/2009 172 5 2021 Black Saturday – VIC –
Kilmore East (120),
Murrindindi (39), Churchill
(11)
FFDI 155
*Number of house loss could vary depending on the source of information
0
20
40
60
80
100
120
140
160
180
200
1 2 3 4 5 6 7 8 9 10-19 20-29 30-39 40-49 >60
Nu
mb
er
of
fata
liti
es
in e
ach
cla
ss
Number of fatalities class according to the number of fatalities occuring in a fire event
Civilians Firefighters

35
A fire event includes incidents which relate fatality and related objects to a fire. An incident can refer to
more than one fatality where individuals were sheltering or behaving as a collective group. The number of
fatality per incident shows many incidents with one loss compared to fewer incidents with 2 or more
fatalities behaving as a group. The incident with the most civilian fatalities was the death of 17 motorists
during the Lara bushfire (1969). The most firefighters lost in an incident occurred when 12 people were
trapped in their tankers during the Ash Wednesday Beaconsfield bushfire in 1983). The highest number of
fatalities found inside a structure occurred during the Black Saturday fire 2009, where 9 civilians (3 families)
sheltered together at a neighbour’s house.
Table 7 Number of fatalities per incident (all fatalities – civilians, firefighters and non-directly related fatalities)
Number of fatalities
per incident
Civilian (733) Firefighter (92) Total(825)
1 314 38 352
2 67 4 71
3 30 4 34
4 17 1 18
5 4 2 6
6 5 0 5
7 2 0 2
8 1 1 2
9 1 0 1
12 0 1 1
14 1 0 1
15 1 0 1
17 1 0 1
6.3.2 LIFE AND HOUSE LOSS COMPARISON PER FIRE EVENT AND FIRE DAY
Bushfire risk assessment has traditionally focused on house loss as a metric for comparing the relative loss
of various historic bushfires (Blanchi et al. 2010, Harris et al. 2012), hence it could be useful to determine
the extent to which house loss levels can act as a surrogate indicator of expected life loss levels on a given
fire day or fire event. Figure 15 is derived from 110 fire events with either life loss, house loss or both.
Figure 15 shows a correlation between these two factors with a coefficient of determination R2 value of
0.67. The only word of caution with the R2 value is the consideration of the level of dependency between
life and house loss events as in a proportion of cases the life loss occurs in direct association with house
loss, see section 6.4.

36
Figure 15 House and life loss correlation per fire day
As an alternative approach a correlation based on aggregated fire days rather than fire events as is the case
for Figure 15 was performed. Figure 16 below shows the correlation per fire day with a R2 of 0.83.
Figure 16 House and life loss correlation per fire event with additional house loss data included
The comparative correlation is so close that there is no key learning to be gained from the relative benefit
of using fire days or fire events to establish the relationship. Given that fire danger forecasting tends to
relate to regions of fire weather influence in which there can be multiple fires, it may be more appropriate
to use the slightly stronger correlated approach of fire days.
y = 0.054x
R² = 0.6734
0
20
40
60
80
100
120
140
0 200 400 600 800 1000 1200 1400
Nu
mb
er
of
fata
liti
es
pe
r fi
re e
ve
nt
Number of house loss per fire event
y = 0.0606x
R² = 0.8378
0
20
40
60
80
100
120
140
160
180
200
0 500 1000 1500 2000 2500
Nu
mb
er
of
fata
liti
es
pe
r fi
re e
ve
nt
Number of house loss per fire day

37
6.4 Location of fatal exposure
To better understand the circumstances of fatalities this section explores the spatial location of the fatality
and its relationship to surrounding elements such as the location of the deceased’s residence. Analysis of
the spatial accuracy recorded in the Life Loss database shows a larger spatial error exists for the early part
of the century. This in part can be attributed to the advanced in mapping and recording of locations for
recent bushfires. Figure 17 shows the distribution of spatial error associated with the fatal exposures. Fifty
percent of locations have a spatial error greater than 1km. This occurs most often when little information
was available (e.g. only the name of a bushfire event, the fatality occurred on a farm or on a large area),
37% of fatalities have a spatial error less than 100m and these were considered in the following spatial
analyses.
Figure 17 Error precision for each fatal exposure location (presented in categories)
6.4.1 SPATIAL LOCATION IN AUSTRALIA
A description of the location of fatal exposure for 806 fatalities was recorded in the Life Loss database (18
were either unknown or considered not applicable). For 111 cases the death occurred after the fire event at
a distant location (e.g. in hospital). For these cases both a location of fatal exposure and a location of death
are recorded. The locations and time of fatal exposure are used later to correlate circumstances such as
weather and proximity. Table 8 summarises the location of death with respect to the location of fatal
exposure.
Table 8 Location of fatal exposure and location of death
Civilian Firefighter Total
Same location 614 (83.8%) 82 (89.1%) 696 (84.4%)
Different location 101 (13.8%) 10 (10.9%) 111 (13.5%)
Unknown 17 (2.3%) 0 17 (2.1%)
NA 1 (0.1%) 0 1 (0.1%)
Total 733 (100%) 92 (100%) 825
Each of the 795 known locations of fatal exposure can be seen in Figure 18. This figure shows a larger
number of fatalities in more populated regions of Australia (see also Figure 8).
0
50
100
150
200
250
300
<10m 10-100m 100-1000m 1-10km 10-100km >100km
Nu
mb
er
of
fata
liti
es
precision distance

38
Figure 18 Location of all fatalities in Australia (background map from Google Earth)
6.4.2 LOCATION OF FATAL EXPOSURE CATEGORIES
The location of fatalities were categorised into ‘In structure’, ‘In vehicle’ & ‘Open air’ to better understand
the specific level of shelter a person had when they died. The summary Table 9 shows the location
categories of fatal exposure for the three time periods (1901-2011; 1901-1964; and 1965-2011). A
significantly greater proportion of fatalities occurred inside structures or inside vehicles in recent fires,
compared to earlier fires. The higher proportion of fatalities inside vehicles in the time period 1965-2011 is
explained by higher prevalence of cars and their use during this period. This summary also highlights that a
significantly greater proportion of fatalities occurred in earlier fires in the open air, compared to more
recent fires.
Table 9 Fatal exposure location categories over the three time periods (civilian)
1901-1964 1965-2011 1901-2011
(total)
Inside structure 21 (7.1%) 167 (44.4%) 188 (27.9%)
Inside vehicle 11 (3.7%) 45 (12.0%) 56 (8.3%)
Open air 232 (77.8%) 158 (42.0%) 390 (57.8%)
Unknown 34 (11.4%) 6 (1.6%) 40 (5.9%)
Total 298 (100 %) 376 (100%) 674 (100%)

39
Figure 19 shows the same data summary presented in Table 9 further broken into civilian gender and
firefighter fatalities. A greater number of male civilian fatalities have occurred in open air than in any other
location, particularly earlier in the century. This is possibly related to job profiles that involve remote
location work such as timber felling where shelter is not easily sort or farmers attempting to save livestock.
Firefighter fatalities occurred either in open air or inside vehicles in fire fighting vehicle burn-over incidents
or involved with falling trees. Sheltering within a structure is a relatively rare and often unavailable strategy
for firefighters.
Figure 19 Location categories of fatal exposure compared with role and sex
6.4.3 DISTANCE FROM RESIDENCE
The distance of a fatality to the location of their residence can help qualify the prevalence of behaviours in
relation to last minute evacuation or alternative shelter and defence strategies. A sample set of 116
fatalities was queried from the Life Loss database in which residential address and fatal exposure locations
were both accurately known. This sample involves 79 fatalities that occurred in open air, 18 that occurred
inside vehicle and 19 inside structure (other than their residence, e.g. a neighbouring house, bunker etc).
These cases have been plotted as cumulative graph in Figure 20.
inside structure inside vehicle open air Unknown
civilian male 95 39 291 31
civilian female 93 17 98 3
fire fighter 0 28 38 1
0
50
100
150
200
250
300
350
Nu
mb
er
of
fata
liti
es

40
Figure 20 Distance between residential address and fatal exposure location (civilian)
The Figure 20 shows a close association with the place of residence, with 61% of fatalities occurring within
100m of their location of residence and 84% occurring within 1km. Of the locations of residence of the
deceased considered, 10 houses were not damaged and were not used as a shelter. 89 houses were
completely destroyed and of these 20 houses were used as a place of refuge during the event. The main
activity of the fatalities considered in the analyses is late evacuation (48.3%), then outside saving livestock,
livelihood or defending wider property (20.7%), and people sheltering as a group (11.2%).
6.4.4 DISTANCE FROM VEHICLE
A set of 54 fatalities were studied where both the fatal exposure location and the vehicle location were
accurately known. These cases involved situations where the vehicle was left and fatalities occurred in the
open air. Forty-eight cases involved completely burnt out vehicles, 3 were untouched and 4 damaged. Of
the 3 cases of untouched vehicles, 2 cases involved an attempt to shelter together 100m away from the
same vehicle under synthetic blankets and 1 case 270m away with no protection in an area were heavy
smoke was present during the fire’s passage. Figure 21 below shows a logarithmic profile with 40% of
fatalities occurring within 10m of the vehicle and 67% within 100m of the vehicle. The context of
entrapment of vehicle was captured in the data collection phase; information was available for 18 fatalities
(33%). In 14 cases the car was bogged or trapped by fallen tree, and for the remaining 4 the vehicle ran off
the road due to poor visibility.
Figure 21 Distance between vehicle and fatal exposure location (civilian)
0
10
20
30
40
50
60
70
80
90
100
0.1 1 10 100 1000 10000 100000 1000000
Cu
mu
lati
ve
pe
rce
nta
ge
of
fata
liti
es
Distance from residence (m)
0
10
20
30
40
50
60
70
80
90
100
0.1 1 10 100 1000
Cu
mu
lati
ve
pe
rce
nta
ge
of
fata
liti
es
Distance from vehicle (m)

41
6.4.5 LOCATION WITHIN STRUCTURE
For the fatalities that occurred inside structures it is useful to understand the location within the structure
in which the fatal exposure occurred, as this will help to understand the behaviour adopted and the modes
in which the house may have lost its tenability. Table 10 details the location of the fatality inside the
structure in which the specific location of body was known.
The study of the 1983 Ash Wednesday fire in Victoria (Krusel and Petris 1999) and the study of the 1967
Hobart fire (McArthur 1967) showed that a small number of fatalities occurred inside a house and mainly
involved occupants sheltering in a closed room (e.g. bathroom) with no clear view of the circumstances
outside of the structure. The detailed study of the location of fatalities inside a structure (n188) shows that
37% of the fatalities with known locations occurred in a room with reduced visibility to outside conditions
(bathroom, enclosure, laundry, study, toilet block, bunker), the location of 34% is unknown (see Table 10).
Table 10 Known fatality locations inside structure detailed location
Table 10 shows that 10% of cases where fatalities occurred in buildings that were not their main residence,
these have been highlighted in blue. By removing the non-residential structure cases we can derive Table
11 including 109 fatalities occurring inside residential structure with known locations.
Table 11 Known fatality locations inside residential structures detailed location
Detail inside structure Number of fatalities Percentage of known
Bathroom 36 33%
Kitchen 26 23%
Bedroom 17 16%
Study 10 9%
Enclosure under house 9 8%
Entrance 5 5%
Lounge 4 4%
Laundry 3 3%
Total 109 100%
Detail inside structure Number of fatalities Percentage of known
Unknown 64 34%
Bathroom 36 19%
Kitchen 25 13%
Bedroom 17 9%
Study 10 8%
Under house enclosure 9 5%
Entrance 5 3%
Lounge 4 2%
Cool-room 3 2%
Laundry 3 2%
Outdoor spa 3 2%
Toilet block 3 2%
Bunker 2 1%
Shed 2 1%
Independent garage 1 1%
Shack 1 1%
Total 188 100%

42
Of these cases 33% of the fatalities occurred in bathrooms which typically have no clear visual cues to
outside conditions. All other cases either involve an opportunity to monitor outside conditions or be
adjacent to an exit to facilitate egress when the house approaches untenable conditions. Eight percent of
cases were in either the entrance or laundry: both typically are adjacent to an exit door providing an option
to egress if conditions allowed.
Fifty-eight percent involved fatalities in the bathroom, bedroom or study which all typically have only one
point of exit to the rest of the house. Twenty-seven percent of cases involving kitchens and lounge areas
which usually have opportunities for viewing outside conditions and multiple options to progress through
the house towards an exit if it is recognised that the house is losing tenability.
In summary, for 59% of the fatalities there was the opportunity to effectively monitor both the internal and
external conditions and make decision to move towards and exit as the house lost tenability. So either
people were not aware of this strategy (or the need to leave) or the houses lost tenability at a rate in which
safe passage from these locations to an exit door was not possible.
Also to consider are the air toxic species emitted and exposure concentrations inhaled by residents both
indoors and outdoors. Reisen et al. have shown that during prescribed burning firefighters are exposed to a
range of hazardous pollutants in particular fine particles, carbon monoxide (CO), formaldehyde and volatile
organic compounds (VOCs) (Reisen and Brown 2009; Reisen et al. 2011). At the urban or rural urban
interface additional air pollutants resulting from the combustion of the structural material are a concern
such as asphyxiants (CO and hydrogen cyanide) and other irritants (e.g. formaldehyde, acrolein, hydrogen
chloride). Some of those pollutants could potentially impair the judgement and behaviour of residents if
present at elevated concentration (Reisen 2011).
Regarding the demographic of fatalities found inside structure 51% were male and 49% were female. This
represents a higher proportion of female fatalities compared to other locations; 70% male and 30% female
were found inside vehicle; 75% male and 25% female were caught in the open air (see Figure 19). Some
studies have also found that people dying in houses were old or suffered from disability (McArthur 1967,
Hobart fire). The analysis of age categories shows a prevalence of elderly (over 70) fatalities, particularly
when observing the subset of fatalities that occurred inside a structure to the entire sample (21.3% inside
structure compare to 12.1% for all locations; see Table 12). Eleven percent of fatalities inside structures
were physically or mentally incapable of implementing survival strategy (21 people) compared to 5% of all
civilian fatalities (32 people).
Table 12 Comparison age group between fatalities inside structure and all civilian
Age All civilian Inside structure
0-9 57 (8.5%) 11 (5.9%)
10-19 61 (9.1%) 13 (6.9%)
20-29 67 (9.9%) 17 (9.0%)
30-39 69 (10.2%) 23 (12.2%)
40-49 67 (9.9%) 17(9.0%)
50-59 88 (13.1%) 33 (17.6%)
60-69 86 (12.8%) 30 (16.0%)
70-79 48 (7.1%) 21 (11.2%)
80 and above 34 (5.0%) 19 (10.1%)
Missing 97 (14.4%) 4 (2.1%)
Total 674 (100%) 188 (100%)
43
6.5 Activity and decision making
The influence of human behaviour by their activity and decision making plays an important role in their
chance of survival and the survival of their assets (e.g. McArthur and Cheney 1967; Wilson and Ferguson
1984; Krusel and Petris 1999; Blanchi and Leonard 2008; Haynes et al. 2010). This section reviews the
activities and decision making using the coding scheme developed by Haynes et al. (2010) in her study of
the 1900-2008 fatalities. To explore the relationship between activity and other variables, two types of
multivariable analysis were performed:
- Exploration of the relationship between activity, decision making and the FFDI (Forest Fire Danger
Index) at 3pm
- Linear regression to characterise the activity undertaken immediately prior to death as a function
of other variables
6.5.1 FREQUENCY ANALYSIS OF ACTIVITY AND DECISION MAKING
The activities of the person immediately prior to their death are shown in Table 13 below. When
considering the total time period, late evacuation is the most common activity (30.4%), followed by
sheltering inside a structure (24.8%) and defending a property outside (22.4%). Late evacuation is the most
common activity for the 1901 - 1964 time period (37.2%), followed by defending property outside (30.2%).
In comparison, the most common activity for the 1965-2011 time period is sheltering inside a structure
(40.2%). Sheltering is not a common activity for the 1901 - 1964 time period and the difference between
the two time periods for this activity is significantly different at the <0.001 level. The second most common
activity for the most recent time period is late evacuation (24.8%) followed by defending property outside
(16.3%). The proportion of those engaged in a late evacuation and defending wider property outside at the
time of their death has significantly decreased between the two time periods (<0.005 level). During the
former part of the last century a slight majority of those evacuating were doing so from a place of work
outside as well as from a place of shelter. Whereas, in more recent time periods almost all the fatalities
attempting to evacuate were doing so from a place of shelter.
Late evacuation was also the most common activity found in Haynes study (2010), however the percentage
of people dying inside a structure has greatly increased from 8.3% in Haynes study to 24.8% in this study.
This can be mostly attributed to 2009 Victorian bushfire where 118 fatalities died inside structures.

44
Table 13 Activities of civilian fatalities over the three time periods (percentage of civilian fatalities data)
1901-1964 1965-2011 1901-2011
(total)
z p
Late evacuation
Of these:
111 (37.2%) 93 (24.8%) 204 (30.4%) 3.94 <0.005
from shelter 46 87 133
from a place of work outside 51 2 53
destination or origin unknown 14 4 18
from an un-defendable shelter (dugout, culvert,
shed)
0 0 0
Defending property outside 90 (30.2%) 61 (16.3%) 151 (22.4%) 4.30 <0.005
Inside property
Of these:
18 (6.0%) 152 (40.2%) 168 (24.8%) -10.41 <0.001
Actively defending 3 27 30
Engaged in some defence before sheltering 3 45 48
Passively sheltering 9 56 65
Passively sheltering as a group (3 or more
people from separate families or any
number of separate families gathering at a
‘community refuge’)
-
17 17
Activities unknown 1 7 8
Travelling through the area unaware
Of these:
22 (7.4%) 44 (11.8%) 66 (9.8%) -1.89 <0.1
Travelling for work 2 4 6
Travelling for pleasure (picnic, camping) 9 27 36
En route to defend or rescue 11 13 24
Waiting rescue 1 (0.3%) 6 (1.6%) 7 (1%) -1.61 >0.1
Assisting fire fighting operations 6 (2%) 2 (0.5%) 8 (1.2%) 1.76 <0.1
Returned into burning building 2(0.7%) 6 (1.6%) 8 (1.2%) -1.10 >0.1
In an un-defendable shelter (dugout, shed) 8 (2.7%) 3 (0.8%) 11 (1.6%) 1.92 <0.1
Activity unknown at time of fatality 42 (14.1%) 9 (0.8%) 51 (7.6%)
Total 298 (100%) 376 (100%) 674 (100%)

45
Table 14 Comparison of the five major bushfires (civilian fatalities)
1926 1939 1967 1983 2009
Total fatalities 39 79 64 60 172
Men 32
(82.1%)
68
(86.1%)
32
(50%)
36
(60%)
99
(57.6%)
Women 6
(15.4%)
11
(13.9%)
32
(50%)
24
(40%)
73
(42.4%)
Unknown 1
Late evacuation
Of these:
23
(59%)
37
(50.6%)
19
(29.7%)
18
(30%)
35
(22.1%)
from shelter 5 9 17 18 35
from a place of work outside 18 24 2 0 0
destination or origin unknown 0 4 0 0 0
from an un-defendable shelter (dugout, culvert, shed) 0 0 0 0 0
Saving livestock or defending property outside. Caught
outside their home, friend’s home, local community etc.
3
(7.7%)
23
(29.1%)
17
(26.6%)
18
(30%)
7
(4.1%)
Inside property
Of these:
0 4
(5.1%)
12
(18.8%)
11
(18.3%)
118
(68.6%)
Actively defending 0 0 1 0 26
Engaged in some defence before sheltering 0 0 4 0 37
Passively sheltering 0 3 6 9 35
Passively sheltering as a group (3 or more people from
separate families or any number of separate families
gathering at a ‘community refuge’)
0 0 0 0 17
Activities unknown 0 1 1 2 3
Travelling through the area unaware
Of these:
3
(7.7%)
4
(5.1%)
0 11
(18.3%)
9
(5.2%)
Travelling for work 0 0 0 1 0
Travelling for pleasure (picnic, camping) 1 3 0 2 6
En route to defend or rescue 2 1 0 8 3
Waiting rescue
0
0
4
2
0
Assisting fire fighting operations 0 2 2 0 0
Returned into burning building 0 0 4 0 0
In an un-defendable shelter 1 3 0 0 3
Activity unknown at time of fatality 9 6 6 0 0
Table 14 explores the activity at the time of death over five fires where significant losses occurred. Here the
relationships seen in Table 13 are examined in greater detail. For all fires, apart from the 1967 Hobart fires,
men die in higher numbers. However, the fires in the first time period are characterised by men dying in far
greater numbers than women. Late evacuation was the most common activity and decreases almost
linearly from 1926 to 2009. In comparison the proportion of those who are dying inside a structure has
increased from 0% in 1926 to 68.6% in 2009. Saving livestock or defending property outside was a fairly
common activity in the 1939, 1967 and 1983 fires, engaged in by over a quarter, to one third of the
fatalities. However, this was an activity only undertaken by 4% of fatalities during the 2009 fires.

46
As would be expected the majority of firefighters have been killed while undertaking official fire fighting
activities (see Table 15).
Table 15 Activity at the time of fatality for firefighters
Late evacuation from shelter 2
Saving livestock, livelihood or defending wider property or 1
Undertaking official firefighting activities for a control
agency.
77
Travelling to and from official firefighting or supporting
activities.
8
Unknown 4
Total 92
For the most recent time period, a slightly greater proportion of fatalities were aware of the fire with
enough time to save their lives and were following a plan (41.9%) compared to those who were unaware or
were not following a plan (combined total of 27.7%). In the first half of the last century the split between
those who were following a plan and those who were unaware or not following a plan is roughly equal
(28.2% and a combined total of 24.8% respectively, see Table 16). However, having a plan and actually
making long term preparation in order to enact that plan are very different. This issue will be explored
further in the detailed analysis of the 2009 fatalities (see section 6.9).
Table 16 Decision making over the three time periods (civilian fatalities)
1901-1964 1965-2011 1901-2011
(total)
Were aware of fire with enough time to save their lives. Had
a fire plan and were following intended actions which were
ineffective
84 (28.2%) 157 (41.9%) 241 (35.8%)
Were aware of the fire with enough time to save their lives.
Either had no fire plan, plan was unclear or didn’t follow
their plan. Includes people were ‘waiting to see’
59 (19.8%) 82 (21.8%) 141 (20.9%)
Were unaware there was a fire and only realised when it
was too late to implement an effective survival strategy
28 (9.4%) 41 (10.9%) 69 (10.2%)
Unknown 71 (23.8%) 25 (6.7%) 96 (14.3%)
Extenuating circumstances affected plans (heart attack) 10 (3.4%) 8 (2.1%) 18 (2.7%)
Children or adults who followed the instructions of another
person
37 (12.4%) 40 (10.7%) 77 (11.4%)
Physically or mentally incapable of implementing an
effective survival strategy (shock, drugs etc)
9 (3.0%) 23 (6.1%) 32 (4.8%)
Total 298 (100%) 376 (100%) 674 (100%)
Table 17 shows the relationship between decision making and gender over five of the most significant fires.
A chi-square test of association was conducted to compare the combined 1926, 1939, 1967 and 1983
deaths against the 2009 deaths. Only the variables "Had a plan" and "Didn't have or follow a plan" were
examined. For females the results produced a indicating a highly significant difference. The analysis
indicates that in 2009 significantly more females than previous fires were following a fire plan (Chi-square
of 28.66 (1 degree of freedom), p<0.0001). For males the result is similar (Chi-square = 7.32 (1 degree of
freedom), p<0.01) and in 2009 significantly more males than previous fires were following a fire plan.
However, the result is not as significant, and the difference in terms of fire planning between previous fires
and the 2009 fires is not as great for men as it is for women.

47
Table 17 Gender and decision making
Decision making 2009 1983 1967 1939 1926
men women men women men women men women men women
Following plan 59 39 17 2 12 5 15 0 4 0
Didn’t have plan, a
clear plan or didn’t
follow plan
16 14 7 12 6 13 12 4 9 4
Unaware 9 6 1 1 3 2 18 1 4 1
Following others
decisions (children) 7 7 3 4 5 5 9 0
Physically unable 5 3 4 4 2 5 2 0 0 0
Total 96 69 32 23 23 25 52 10 26 5
6.5.2 RELATIONSHIP BETWEEN ACTIVITY DECISION MAKING AND FFDI
The relationship between activity decision making and Forest Fire Danger Index (FFDI) at 3pm has been
studied using a tridimensional probability visualisation. The probability distribution of the three variables of
interest: activity, decision making and FFDI was determined by applying a kernel smoothening technique
that transforms each point in the event space into a “cloud” and adds them together. In this way, regions
with larger number of points have more “clouds” superimposed, resulting in a larger value for the
probability mass.
This probability distribution can be visualized by performing tomography, that is, by plotting cross sections
of this distribution. In this case, the probability in a plane perpendicular to the “upward” variable (FFDI) was
cut (which are represented for visualisation by the 12 tiles in Figure 22). Each plane in Figure 22
corresponds to a constant value of FFDI, for which the probability is encoded in the colour scheme (red, or
“hot” regions have higher probability) as a function of the “x” (decision making) and “y “variables (activity).
A full image of the distribution is obtained by “stacking” plots of increasing FFDI, with the fourth dimension
(the probability) shown as the colour intensity. Details of the activity codes (1 to 19), and decision making
codes (1 to 8) are described in Appendix 2 - Data category tables and their contents. In summary, the
activity codes between 1 to 4 and 14 represent people sheltering, the code from 5 to 8 are fatalities
evacuating, codes 10,11,13,15 are fatalities travelling (for saving own property or for pleasure), 16 is
outside saving livestock, 12 is the code for fatalities waiting rescue, 17 to 19 are linked to fire fighting
activities, 20 is linked to burn off activities. The decision is coded from 1 (fatalities that have a plan that was
ineffective), 2 (aware of the fire but plan unclear), 3 (unaware of fire), 4 (unknown), 5 (extenuating
circumstances), 6 (children or adults who followed the instructions of another person) to 7 (physically or
mentally incapable of implementing an effective survival strategy).
Figure 22 indicates that fatalities that occur during a very low FFDI (corresponding to the first 4 tiles) are
associated with people who are defending wider property or caught outside in highly exposed positions.
Many of these people did not have plans or were unaware of the fire until it was too late to implement a
successful survival strategy. More moderate FFDI’s are associated with a range of activities including
defending wider property, late evacuation and sheltering with some defence. These people are split
between those who had plans and were carrying out a premeditated action and those who did not have a
plan, and those with a firm plan but did not follow their plans. Extreme FFDI is associated with those
sheltering (including defending) at the time of death and also included in higher numbers those who had a
plan and were carrying out a premeditated action (mainly for 2009 Victorian bushfires).

48
Figure 22 Tridimensional probability visualisation of the following variable Decision making, Activity and FFDI ((a)
FFDI (at 12 different values of FFDI)

49
6.5.3 REGRESSION
A multiple linear regression was used to identify and explore the relationships within the data. A linear
regression analysis fits a statistical model to the data in order to investigate how a set of independent (or
predictor) variables relate to the level of a dependent variable.
All the expected predictor variables measured in the study were entered into the first iteration of a
regression model with the categorical variable ‘Activity’ as the dependent variable. Only the data from 1965
onwards was analysed as more information was available in this time period. The predictor making the
least statistically significant contribution to the reduction in the variance in the dependant variable was
then removed. The model was then re-estimated and the remaining predictor with the least statistically
significant contribution was again removed. This ‘backward elimination’ method was continued until the
variation in the dependant (Activity) variable was best explained by a set of predictors, all of which were
statistically significant in the regression model. The two remaining predictors (FFDI and Gender) explain
15.5% (R2=0.155 x 100) of the variability in activity. Although this percentage might appear low, it is
statistically significant (F=27.5, p<0.0001), due to the large sample size (n=303).
The regression indicates that the average coded activity level was 15.5 (Activity 16 is defending wider
property outside). This indicates the activity of the average victim in the sample. Table 18 indicates that
female fatalities (Gender=2) occurred more frequently than male fatalities (Gender=1) to be engaged in
activities with lower codes (i.e. related to sheltering and evacuation, for detail of code see Appendix 2 -
Data category tables and their contents).
Table 18 Correlation coefficients (activity, gender and FFDI)
Beta Sig. Exp (B)
Gender (1=male, 2=female) -.234 .000 -2.489 FFDI (WS) calc -.311 .000 -.037 Constant .000 15.537
F statistic = 27.469 p 0.000
By contrast males are more likely to be engaged in activities with higher activity codes (i.e. related to
defending activity outside). As the FFDI increases people of both sexes are likely to be engaged in activities
associated with a lower activity code (e.g. sheltering with some defence and evacuating).
6.6 Fire weather context
This section demonstrates the relationships between meteorological conditions and fatalities. The objective
is to show the statistical profile (with and without firefighters) in order to provide a basis for discussion on
fire weather thresholds and trends. The first section (6.6.1) first qualifies issues of timing with regard to fire
weather parameters, the second section (6.6.2) shows the weather conditions and aggregated fatalities by
fire event and the third section (6.6.3) shows the categorisation of weather conditions for fatalities and
their location and gender.
6.6.1 WEATHER DATA QUALIFICATION AND TIMING
320 weather observations have been recorded for 146 fires. The range of data recorded varies from
qualitative information from reports or inquests, to quantitative information on weather conditions at
different times of the day (time of exposure and 3pm observations).
Standard meteorological observations at 3pm, and data from the historical fire weather dataset described
by Lucas (Lucas 2010) have been obtained for 114 fires.

50
The 3pm FFDI and the FFDI at time of exposure were used to represent the weather conditions during the
event. However using FFDI at fixed time of the day may not be indicative of the daily maximum fire danger
as noted by Lucas (2010). It might also not be representative of the weather conditions most influential on
the fatality. For example, by taking into account the summertime cool change, which may have occurred
before or after the time considered in the analysis. The summertime cool change, often crosses southern
Australia during the day and is associated with dropping temperatures, rising Relative Humidity (RH) and
abrupt wind direction and strength changes (Luke 1978; Wilson and Stern 1985; McCaw and Hanstrum
2003). The minimum weather thresholds are discussed considering observations for each fatality at 3pm.
The FFDI at 3pm is compared to the FFDI values obtained in relation to summertime wind change to better
characterise the weather conditions experienced by the people at the time of death.
The FFDI at the time of exposure could be higher or lower than the one at 3pm for a particular fatality (see
Figure 23) hence would occur above or below the midline shown in Figure 23.
Figure 23 Comparison FFDI at 3pm and at time of exposure for civilians (before wind change, after wind change and
no or unknown wind change) - 430 observations at 3pm and time of exposure (TOE)
The time of exposure in relation to the cool change makes a distinctive difference, as after a cool change,
FFDI at the time of exposure are usually lower than the 3pm value (note that 75% of exposures occurred
after 3pm). It is interesting to note that in those cases the FFDI value at time of exposure might not
represent the weather conditions at the fatal exposure location. Several reasons could be envisaged: high
local winds are associated with the changes that might not be recorded at the weather station (Luke and
McArthur 1978 and anecdotal evidences), fuel moisture lag (which correspond to the time delay in fuel
moisture content to respond to change in environmental conditions).
It is though difficult to determine a time where weather conditions are representative of the peak weather
experienced by the person exposed. Ideally using the peak FFDI of the day (on an hourly basis) would
reduce the inconsistency in using a fixed time. However this data is not consistently available across the
time scale in which fatalities have occurred.
The summertime cool change and associated wind change and weather pattern has affected in total 50% of
all the fatalities (414 civilians and firefighters), 90% have died after the change and 10% before the change.
0
20
40
60
80
100
120
140
160
180
200
0 20 40 60 80 100 120 140 160 180 200
FF
DI
at
the
tim
e o
f e
xp
osu
re
FFDI at 3pm
TOE after wind change TOE before wind change TOE change unknown or no change

51
6.6.2 METEOROLOGICAL CONDI
Numbers of losses per fire event are
been used with house loss analysis in
loss rather than house loss. The analysis displays the
logarithmic scale) and weather variables at 3pm (
observations.
Figure 24 Relationships between the number of houses lost (logarithmic scale) and FFDI at 3pm, temperature, wind
speed and RH
These graphs can be particularly useful in deriving thresholds for the conditions above which significant loss
of life per event have occurred. The shaded regions in each of the plots in
no losses been recorded. The bounds of these regions could be further refined as
reason why they should or should not intersect the x axis at the given values or have a log linear boundary.
However regions such as these can serve as a sound basis for
thresholds for policy implementation
five fatalities per event line is drawn for each graph
that lowest FFDI event involving five or more fatalities occurred above an FFDI of 50 and its intersect with
the shaded region occurs around and FFDI of 35.
temperature in which 5 or more loss
maximum relative humidity was 16%.
1
10
100
0 50 100
Nu
mb
er
of
fata
liti
es
Forest Fire Danger Index at 3pm
1
10
100
0 20 40
Nu
mb
er
of
fata
liti
es
Wind speed 3pm (km/h)
METEOROLOGICAL CONDITIONS AND NUMBER OF FATALITIES BY F
are often used as a metric to rate the level of impact, this method has
in Blanchi et al. (2010). Figure 24 provides a similar analysis using life
rather than house loss. The analysis displays the relationship between number of fatalities
weather variables at 3pm (FFDI, temperature, wind speed and RH
Relationships between the number of houses lost (logarithmic scale) and FFDI at 3pm, temperature, wind
These graphs can be particularly useful in deriving thresholds for the conditions above which significant loss
curred. The shaded regions in each of the plots in Figure 24
no losses been recorded. The bounds of these regions could be further refined as there are no specific
reason why they should or should not intersect the x axis at the given values or have a log linear boundary.
However regions such as these can serve as a sound basis for establishing appropriate
implementation based on acceptable levels of life loss per event
five fatalities per event line is drawn for each graph (blue dotted line on Figure 24). For FFDI the plot shows
that lowest FFDI event involving five or more fatalities occurred above an FFDI of 50 and its intersect with
the shaded region occurs around and FFDI of 35. For the other weather parameters the minimum
more losses occurred was 33 degrees Celsius, minimum wind speed was 24 and
maximum relative humidity was 16%.
150 200
Forest Fire Danger Index at 3pm
1
10
100
10 20 30
Nu
mb
er
of
fata
liti
es
Temperature 3pm (Deg C)
60 80
Wind speed 3pm (km/h)
1
10
100
0 20
Nu
mb
er
of
fata
liti
es
Relative humidity 3pm (%)
FATALITIES BY FIRE EVENT
often used as a metric to rate the level of impact, this method has
provides a similar analysis using life
relationship between number of fatalities (on a
FFDI, temperature, wind speed and RH) based on 93
Relationships between the number of houses lost (logarithmic scale) and FFDI at 3pm, temperature, wind
These graphs can be particularly useful in deriving thresholds for the conditions above which significant loss
are clear regions where
there are no specific
reason why they should or should not intersect the x axis at the given values or have a log linear boundary.
appropriate weather severity
based on acceptable levels of life loss per event. As an example the
. For FFDI the plot shows
that lowest FFDI event involving five or more fatalities occurred above an FFDI of 50 and its intersect with
For the other weather parameters the minimum
occurred was 33 degrees Celsius, minimum wind speed was 24 and
30 40 50
Temperature 3pm (Deg C)
40 60
Relative humidity 3pm (%)

52
One fire with one fatality occurred at low FFDI (<11). This single fatality occurred during a burn off with a
sudden change of wind, the weather conditions might have been mild and the sudden change might not
have been recorded at the weather station used for this event. Seven fire events with mainly one fatality
have occurred at high FFDI (11-24). Two fires with 4 fatalities, one with 2 fatalities and 14 fires with one
fatality have occurred at very high FFDI (25-49). The potential range of number of fatalities by event is
increasing with the level of FFDI (for example for a FFDI of 50 the range of fatalities is between 1 to 10, for a
FDI of 75 the range of fatalities is from 1 to 20). Each of the weather parameters shows a distinctive
transition from lower values to high (reversed for relative humidity). Section 6.6.3 explores these in more
detail.
The correlation coefficients R2 between number of fatalities and FFDI, along with its individual components
are shown in the Table 19. The log of number of fatalities is correlated with temperature (0.5% level), FFDI
(0.1% level), wind speed (2% level) and relative humidity (5% level).
FFDI has the highest correlation, which is not surprising as it is an aggregation of factors that all have some
degree of correlation.
Table 19 Correlation of logarithmically (log-10) transformed number of fatalities under different weather variables
Variables R2
FFDI 0.376
Temperature (C) 0.301
Wind speed (km/h) avg 10 mins 0.253
Relative humidity (%) -0.216
6.6.3 METEOROLOGICAL CONDITIONS AND FATALITIES
In some analyses the FFDI is categorised according to the existing national danger rating scheme18:
• 0-11: low - moderate
• 12-24: high
• 25-49: very high
• 50-74: severe
• 75-100: extreme
• >100: catastrophic (Code Red in Victoria)
Meteorological conditions at 3pm minimum thresholds
Figure 25, Figure 26, Figure 27 and Figure 28 show the number of civilian fatalities per classes of FFDI,
temperature, wind speed and relative humidity at 3pm (452 observations). Ninety-one percent of civilian
fatalities have occurred for each of the following conditions:
• FFDI values above 50,
• temperature exceeded 35°C,
• relative humidity was below 20%, and
• wind speeds greater than 20km/h.
18 http://www.cfa.vic.gov.au/warnings-restrictions/about-fire-danger-ratings/ (accessed 15/11/2012)

53
Figure 25 Number of civilian fatalities by gender and FFDI (3pm value)
Figure 25 shows that the proportion of male fatalities is significantly greater for the mid class of FFDI 25-49,
50-74, 75-99 and most often involved death in the open suggesting that they are more directly engaged in
direct fire fighting or defence activities under these dangerous conditions.
Figure 26 Number of fatalities by gender and 3pm temperature (degree Celsius)
Figure 26 show a very significant temperature threshold for the onset of bushfire fatalities begin at around
35 degrees, with significant loss levels in the 35-40 range and the majority of loss in the 40-45 degree
range. The proportionality of male to female fatalities is does not appear to trend strongly with
temperature.
0
50
100
150
200
250
300
0-11 12-24 25-49 50-74 75-99 100+
Civ
ilia
n f
ata
liti
es
FFDI Categories Civilians Male Civilians Female
0
50
100
150
200
250
300
0-25 >25-30 >30-35 >35-40 >40-45
Civ
ilia
n F
ata
liti
es
Temperature (°°°°C) Civilians Male Civilians Female

54
Figure 27 Number of fatalities by gender and wind speed (3pm value)
Figure 26 shows a significant wind speed threshold for the onset of bushfire fatalities beginning around the
20km/hr region, loss in the high categories is greater in the higher wind speed categories however there is
not the same heave bias towards the upper category as is the case with temperature. The proportion of
Male to Female fatalities tends to be higher in the lower wind speed categories.
Figure 28 Number of fatalities by gender and 3pm relative humidity (%)
Figure 28 shows a significant relative humidity threshold for the onset of bushfire fatalities below 20%, with
the vast majority of loss in the 10% or less region.
0
50
100
150
200
0-20 >20 -40 >40-60 >60-80
Civ
ilia
n F
ata
liti
es
Average 10m wind speed (km/h) Civilians Male Civilians Female
0
50
100
150
200
250
300
350
0-10 >10 -20 >20-30 >30-40 >40-50
Civ
ilia
n F
ata
liti
es
Relative Humidity (%) Civilians Male Civilians Female

55
Meteorological condition and fatalities location
There is expected to be a link with the location of fatal exposure and fire weather severity owing to the
different vulnerabilities of each location context. To observe this data has been extracted to compare FFDI
class with location category, see Figure 29.
Figure 29 FFDI at 3pm and location of fatality
There is no clear trend in the location categories for the FFDI range between 0-49, all categories tend to
generally increase with increasing FFDI with the notable exception of open air over FFDI 100. This may be
due to a tendency seek shelter from both the weather severity and the fire under such intense conditions,
this point is considered in section 6.5.2. The most noticeable result is the characteristic of loss for the inside
structure which has near exponential profile with FFDI. At lower levels of FFDI civilians are caught outside
as the predominant loss location category due to the inherently vulnerably nature of being caught outside
even in mild fire conditions.
6.7 Fire Weather index for fatalities
Given the extensive dataset on fatalities developed there is an opportunity to explore the possibility, using
a regression analysis approach, to link fire weather parameters to bushfire fatalities via a novel index. The
correlative power of this index can then be compared to the FFDI index.
To explore the approach two options have to be considered:
- To use either a first order or second order regression equation (the FFDI index is a first order
equation)
- To consider the whole dataset including single fatality fires or to consider only multiply fatality fires
with a minimum number of x fatalities per fire event.
The Table 20 shows the correlation factor (R2) with these options.
0
20
40
60
80
100
120
140
0-11 12-24 25-49 50-74 75-99 100+
Nu
mb
er
of
fata
liti
es
FFDI Class inside structure inside vehicle open air Unknown
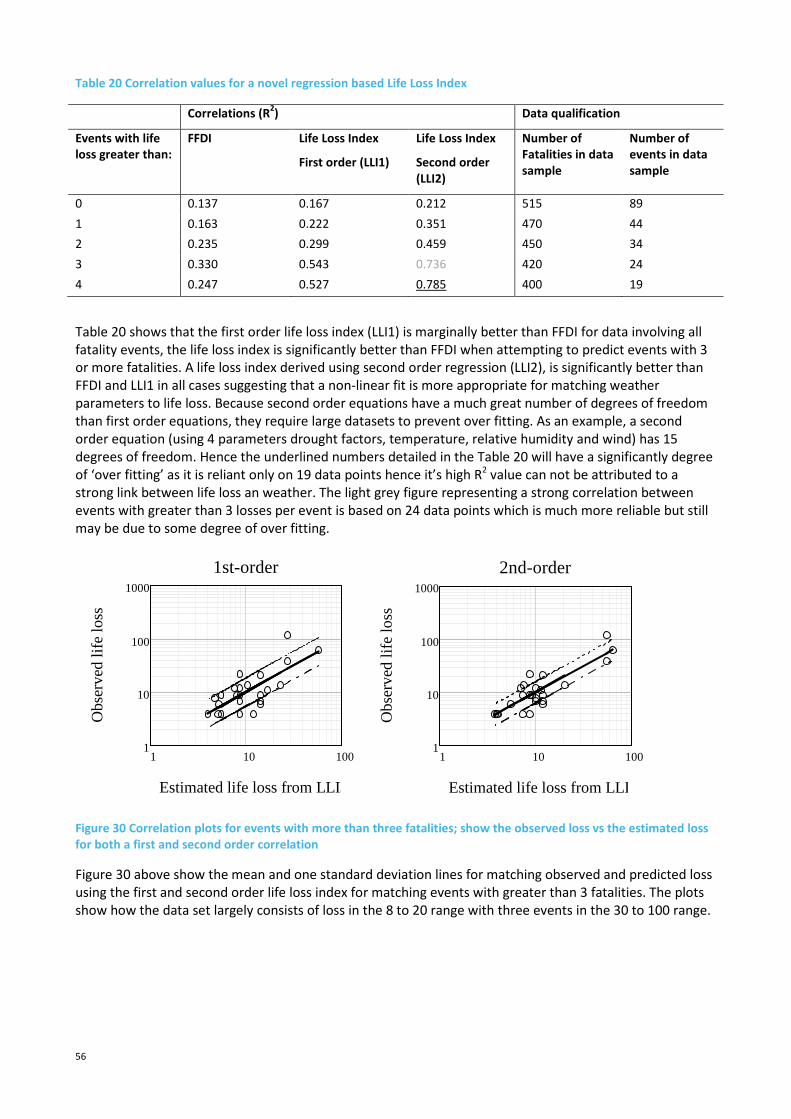
56
Table 20 Correlation values for a novel regression based Life Loss Index
Correlations (R2) Data qualification
Events with life
loss greater than:
FFDI Life Loss Index
First order (LLI1)
Life Loss Index
Second order
(LLI2)
Number of
Fatalities in data
sample
Number of
events in data
sample
0 0.137 0.167 0.212 515 89
1 0.163 0.222 0.351 470 44
2 0.235 0.299 0.459 450 34
3 0.330 0.543 0.736 420 24
4 0.247 0.527 0.785 400 19
Table 20 shows that the first order life loss index (LLI1) is marginally better than FFDI for data involving all
fatality events, the life loss index is significantly better than FFDI when attempting to predict events with 3
or more fatalities. A life loss index derived using second order regression (LLI2), is significantly better than
FFDI and LLI1 in all cases suggesting that a non-linear fit is more appropriate for matching weather
parameters to life loss. Because second order equations have a much great number of degrees of freedom
than first order equations, they require large datasets to prevent over fitting. As an example, a second
order equation (using 4 parameters drought factors, temperature, relative humidity and wind) has 15
degrees of freedom. Hence the underlined numbers detailed in the Table 20 will have a significantly degree
of ‘over fitting’ as it is reliant only on 19 data points hence it’s high R2 value can not be attributed to a
strong link between life loss an weather. The light grey figure representing a strong correlation between
events with greater than 3 losses per event is based on 24 data points which is much more reliable but still
may be due to some degree of over fitting.
Figure 30 Correlation plots for events with more than three fatalities; show the observed loss vs the estimated loss
for both a first and second order correlation
Figure 30 above show the mean and one standard deviation lines for matching observed and predicted loss
using the first and second order life loss index for matching events with greater than 3 fatalities. The plots
show how the data set largely consists of loss in the 8 to 20 range with three events in the 30 to 100 range.
1 10 1001
10
100
1000
1st-order
Estimated life loss from LLI3
Obs
erve
d li
fe lo
ss
1 10 1001
10
100
1000
2nd-order
Estimated life loss from LLI3
Obs
erve
d li
fe lo
ss

57
6.8 Distance to forest
The separation between bushfire fuels and the fatality is an important risk assessment metric to classify
likely exposure levels on the person, vehicle or structure. For this analysis forest has been used, hence does
not account for any non-forest fuel types or areas of forest cover less than minimum threshold as defined
in section 5.1.119. Two specific types of analysis were undertaken, these were distance to the closest forest
in any direction and the distance to forest in the direction of fire approach; the approaches used to
describe these are also detailed in section 5.1.1.
Figure 31 shows the cumulative loss profiles for fatalities as distance to closest forest and distance to forest
in the direction of fire approach.
Figure 31 Cumulative loss profile of fatalities distance to forest
By definition the distance to forest in fire direction will be equal to or greater than the closest distance in
any direction. What is interesting regarding this graph is that the curves are relatively close to each other
with some deviation in the 20-100m range where radiation exposure from flame front emission for forest
could play some role in defining the impact on buildings, people or vehicles. Of particular interest in this
plot is the observation that over 50% of all fatalities occurred less than 10m from the forest, 78% in less
than 30m and 85% in less than 100m. This provides a strong qualification of the possible influence of forest
proximity as a factor in defining exposure resulting in fatal outcomes. For the purposes of future
comparisons, distance to forest will be used as the comparative metric.
To expand on this discussion the same dataset was compared to fatality location category and plotted also
as a cumulative percentile resulting in Figure 32.
19 Note: Forest is defined according to the National Forest Inventory (NFI) as vegetation with a minimum 20% canopy cover, potentially reaching 2
meters high and a minimum area of 0.2 hectares
0
10
20
30
40
50
60
70
80
90
100
1.0 10.0 100.0 1000.0
Cu
mu
lati
ve
pe
rce
nta
ge
of
fata
lie
s
Distance from forest (m)
Distance to forest in fire direction Distance to forest

58
Figure 32 Cumulative loss profile of fatalities distance to forest (per location categories)
For Figure 32, the distance from forest to fatalities inside a structure (n137), inside a vehicle (n34), and in
open air (n73) is shown. A distinctive profile is present for fatalities within structures, where 76% has
occurred within 10m of the forest, 88% within 30m and 95% within 50m. This suggests that fatalities within
structures are strongly associated with high radiant heat and possible flame contact circumstances
potentially resulting in a rapid rate of tenability loss of the structure. Comparing these percentages with the
broader dataset of house loss as a function of distance to forest demonstrates that house loss involving
fatal exposure are far more dominant in the 0-30m from forest regions. Compared to house losses not
involving fatalities, less than 60% of all house losses occurred less than 30m from the forest (Newnham et
al. 2012). To be noted than 30m is a distinctive threshold for direct radiant heat ignition of structures
identified by Cohen (2008).
Open air fatalities have similar proportions at close distances and then tracks much higher than the inside
structure profile, highlighting the fact that people are more exposed to fire effects outside of structures.
Although, the effects of non-forest fuels have an influence on the fatal exposure for a number of the
fatalities on the open air. This data is only available where recorded in reports. Exact details of the fuel load
of non-forest fuels was unavailable for analysis.
Vehicle fatalities track even higher than open air and structure based fatalities. This is likely to be due to
these fatalities occurring adjacent to roadside vegetation (which might not be sufficiently large to qualify as
continuously forest in the analysis).
0
10
20
30
40
50
60
70
80
90
100
1 10 100 1000
Cu
mu
lati
ve
pe
rce
nta
ge
of
tota
l ci
vil
ian
lo
sse
s
Distance to forest (m)
inside structure inside vehicle open air

59
6.9 Results from the Victorian 2009 bushfires
For the 2009 Victorian bushfires additional coding classes were developed to utilise the detailed
information available on the circumstances surrounding each fatality of data availability (see Appendix 3 –
Coding Scheme 2009 Victorian bushfires). This expanded coding describes the preparedness, intention and
action of the fatality for this bushfire with the intent to compare it with other environmental variables (fire
intensity, distance to forest).
The coding scheme was informed by the work of O’Neil and Handmer (2010) but it is not strictly based on it
as it was not possible to have access to their coding scheme and base datasets for use in this work. Hence a
new coding was developed based on the O’Neil and Handmer (2010) final report and using data from the
Royal Commission final report20. The different coding scheme used and material of which it is based would
explain some of the different results obtained with O’Neil and Handmer study.
The following relationships between the variables have been considered and are presented in this section
(for detail definition see Appendix 3 – Coding Scheme 2009 Victorian bushfires):
- The relationship between the fire plan and the location of fatality (definition of fire plan in this case
include people with detail fire plan or intent actions and thoughts of what they would do)
- The relationship between the fire plan and the level of preparation prior to the 7th February 2009
- The relationship between the level of preparation prior to and on the 7th February 2009
- The relationship between the level of preparation prior to February 7th 2009 and activities in the
lead up to death
- The relationship between the level of preparation prior to February 7th 2009 and activities at the
time of death
A linear regression was performed between the variables ‘fire plan’, ‘activity’, ‘activity leading up to death’,
preparation prior, preparation on the day and decision making are all well correlated. The factor analysis
shows that the linear combination of these variables explains 50% of the variance of the deaths.
A multivariable linear regression was performed between all these variables coded into a single activity-
factor, which ranges from defending (low values) to evacuating as the dependant variable and fire intensity
and distance to forest as independent variables. The objective is to verify whether intensity and distance to
forest is a predictor for activity.
6.9.1 FREQUENCY ANALYSIS OF ACTIVITY, DECISION MAKING AND PREPARDNESS
The following results are presented as percentage of civilian fatalities that have occurred as a direct result
of landscape bushfire mechanisms (total number 168, or less if data was not available for 168 fatalities).
Table 21 and Table 22 explore the relationship between fire plan, preparation prior to February 7th 2009
and the location of the fatality. The largest group of fatalities in the 2009 fires had intended to stay and
defend (65 fatalities). This is followed jointly by those who were intending to leave when threatened and
those who didn’t have a plan or didn’t have a clear plan (31 fatalities). The majority of people died within a
structure (118 fatalities). Of these, 40% had intended to stay and defend, 23% had planned to leave when
threatened and 9% didn’t have a plan or for whom the plan was unclear. Of those who died in the open air
(39), 33% had planned to stay and defend and 32.5% didn’t have a plan or a clear plan (see Table 21). In
terms of preparation, the majority (78%) of people who were intending to stay and defend were well
prepared prior to February 7 (see Table 22). The remainder had undertaken some preparation (21.5%).
Those who were planning to leave when threatened are characterized by the largest mix of preparation
types and the highest number of people who had undertaken no preparation. Within this group 45.2% had
undertaken no preparation, 35.4% had undertaken some and 16.1% were considered well prepared.
20 http://www.royalcommission.vic.gov.au/commission-reports/final-report (accessed 30/10/2012)
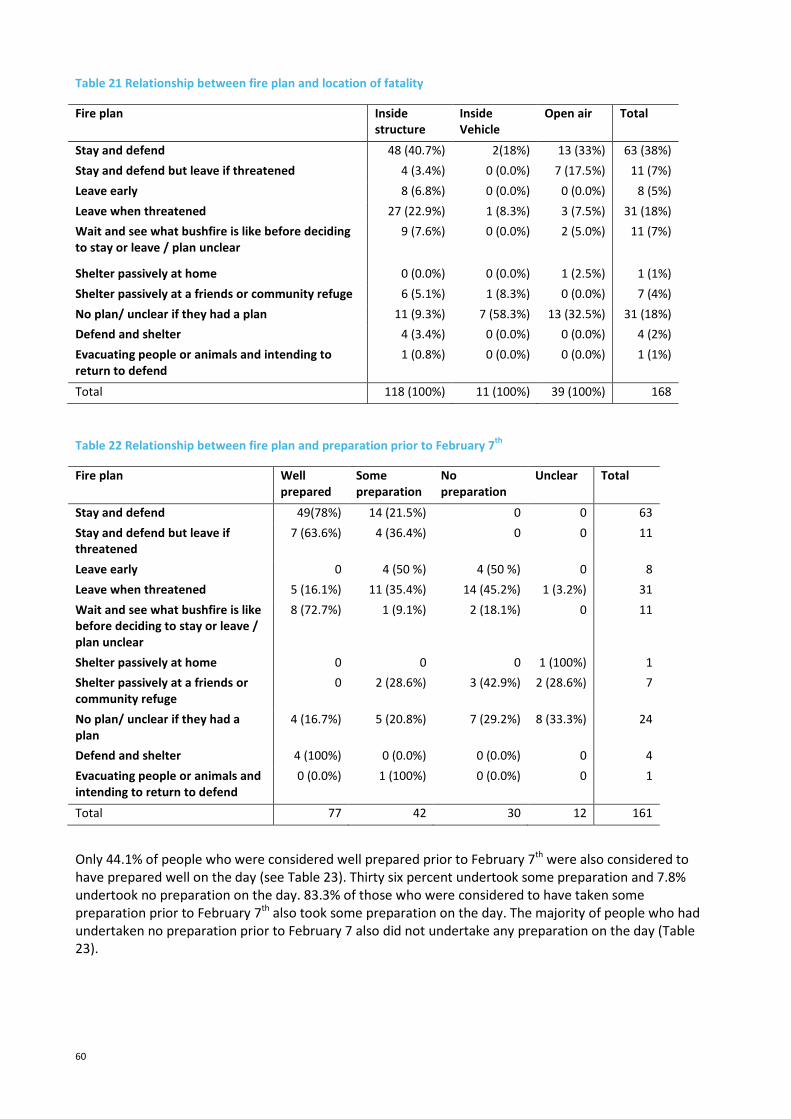
60
Table 21 Relationship between fire plan and location of fatality
Fire plan Inside
structure
Inside
Vehicle
Open air Total
Stay and defend 48 (40.7%) 2(18%) 13 (33%) 63 (38%)
Stay and defend but leave if threatened 4 (3.4%) 0 (0.0%) 7 (17.5%) 11 (7%)
Leave early 8 (6.8%) 0 (0.0%) 0 (0.0%) 8 (5%)
Leave when threatened 27 (22.9%) 1 (8.3%) 3 (7.5%) 31 (18%)
Wait and see what bushfire is like before deciding
to stay or leave / plan unclear
9 (7.6%) 0 (0.0%) 2 (5.0%) 11 (7%)
Shelter passively at home 0 (0.0%) 0 (0.0%) 1 (2.5%) 1 (1%)
Shelter passively at a friends or community refuge 6 (5.1%) 1 (8.3%) 0 (0.0%) 7 (4%)
No plan/ unclear if they had a plan 11 (9.3%) 7 (58.3%) 13 (32.5%) 31 (18%)
Defend and shelter 4 (3.4%) 0 (0.0%) 0 (0.0%) 4 (2%)
Evacuating people or animals and intending to
return to defend
1 (0.8%) 0 (0.0%) 0 (0.0%) 1 (1%)
Total 118 (100%) 11 (100%) 39 (100%) 168
Table 22 Relationship between fire plan and preparation prior to February 7th
Fire plan Well
prepared
Some
preparation
No
preparation
Unclear Total
Stay and defend 49(78%) 14 (21.5%) 0 0 63
Stay and defend but leave if
threatened
7 (63.6%) 4 (36.4%) 0 0 11
Leave early 0 4 (50 %) 4 (50 %) 0 8
Leave when threatened 5 (16.1%) 11 (35.4%) 14 (45.2%) 1 (3.2%) 31
Wait and see what bushfire is like
before deciding to stay or leave /
plan unclear
8 (72.7%) 1 (9.1%) 2 (18.1%) 0 11
Shelter passively at home 0 0 0 1 (100%) 1
Shelter passively at a friends or
community refuge
0 2 (28.6%) 3 (42.9%) 2 (28.6%) 7
No plan/ unclear if they had a
plan
4 (16.7%) 5 (20.8%) 7 (29.2%) 8 (33.3%) 24
Defend and shelter 4 (100%) 0 (0.0%) 0 (0.0%) 0 4
Evacuating people or animals and
intending to return to defend
0 (0.0%) 1 (100%) 0 (0.0%) 0 1
Total 77 42 30 12 161
Only 44.1% of people who were considered well prepared prior to February 7th were also considered to
have prepared well on the day (see Table 23). Thirty six percent undertook some preparation and 7.8%
undertook no preparation on the day. 83.3% of those who were considered to have taken some
preparation prior to February 7th also took some preparation on the day. The majority of people who had
undertaken no preparation prior to February 7 also did not undertake any preparation on the day (Table
23).

61
Table 23 Relationship between preparation prior to and on 7th
of February 2009
Prep on Feb 7th
Prep prior to Feb
7th
Well
prepared
Some
preparation
No
preparation
Unclear Total
Well prepared 34(44.1%) 28(36.4%) 6 (7.8%) 9 (11.7%) 77 (47.8%)
Some preparation 2 (4.8%) 35 (83.3%) 3 (7.1%) 2 (4.8%) 42 (26%)
No preparation 0 (0.0%) 8 (26.7%) 17 (56.7%) 5 (16.7%) 30 (18.6%)
Unclear 0 (0.0%) 3 (25%) 4 (33.3%) 5 (41.7%) 12 (7.4%)
Total 36 (22.3%) 74 (45.9%) 30 (18.6%) 21 (13%) 161
It is interesting to compare the results on preparation and fire-planning with the analysis of interviews and
surveys conducted with survivors in the fire impacted areas immediately following Black Saturday. Analysis
of interview data reveals that the majority of residents (86%) reported having a plan or an intention about
what they would do in the event of a bushfire (McLennan et al. 2011). When examined in more detail, 65%
of those who said they were either planning on staying to defend or leaving early “had made more than
minimal long term preparation to implement the plan” (McLennan et al. 2011p16). This is further
corroborated by quantitative survey data where 69% of respondents claimed to have had a firm plan for
what they would do in the event of a fire (Whittaker et al. 2013). The data presented here on the 2009
fatalities shows a remarkably similar trend, with 82% of fatalities associated with a plan or intention in
relation to their actions during a bushfire threat (from Table 21). Of those who had a firm plan to stay and
defend throughout the fire, defend then shelter or evacuate early, 78% were considered well prepared
prior to February 7th (Table 22). However, when all fatalities are considered, irrespective of their intended
actions only 47.8% are considered well prepared. Furthermore, the numbers of those considered prepared
declines once preparations on the day are also considered (Table 23). Determining adequate preparedness
is a challenging issue and discussion of those fatalities who were actually prepared to stay and defend on
Black Saturday is discussed further in section 6.9.3.
Table 24 shows the relationship between preparation prior to February 7th and activities in the lead up to
death. As would be expected from the relationship between fire plan and preparation prior to February 7th
(Table 24) the majority of those who were considered to be well prepared prior to February 7th were
defending in the hours leading up to their death (76.9%). Those who had undertaken some preparation
prior to February 7th were split between a slight majority who were defending (45.2%) and those who were
waiting to see if circumstances required it (38.1%). Those who had undertaken no preparation prior to
February 7th were split between a slight majority who were waiting to see (50%) and those who were not
engaged in any action in relation to the fire in the hours leading up to their death (43.3%).
Table 24 Relationship between preparation prior to February 7th
and activities in the lead up to death
Activities in the hours leading up to death
Preparation prior to
Feb 7th
Defending Waiting to see No prior action
/sheltering from heat
/ caring for others1
Total
Well prepared 59 (76.9%) 6 (7.7%) 12 (15.4%) 77
Some preparation 20 (45.2%) 16 (38.1%) 6 (16.7%) 42
No preparation 2 (6.7%) 15 (50%) 13 (43.3%) 30
Unclear 4 (33.3%) 3 (25%) 5 (41.7%) 12
Total 85 40 36 161
1Includes individuals who were inside taking care of children or others with special needs while others were defending
or making preparations to defend. Although this is recognised as an important supportive role it is not classified here
as active defense.
Table 25 shows the relationship between preparation prior to February 7 and activities at the time of
death. The majority of those who were considered to be well prepared were split between three dominant
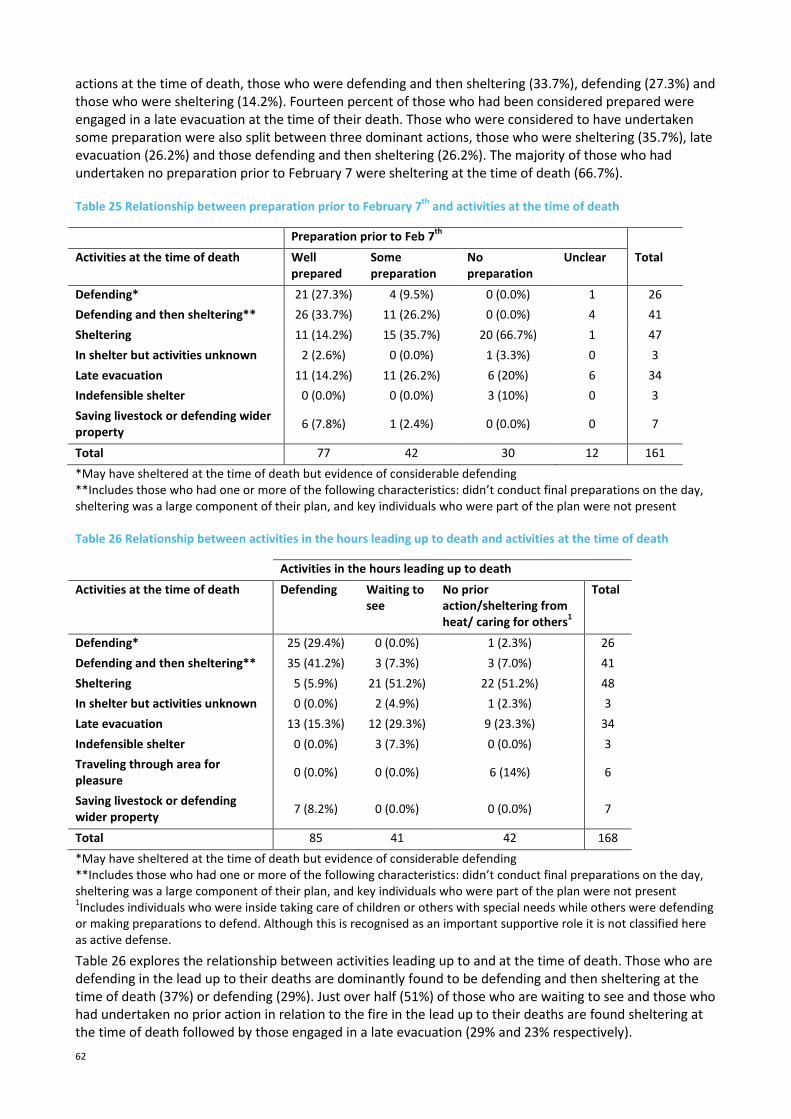
62
actions at the time of death, those who were defending and then sheltering (33.7%), defending (27.3%) and
those who were sheltering (14.2%). Fourteen percent of those who had been considered prepared were
engaged in a late evacuation at the time of their death. Those who were considered to have undertaken
some preparation were also split between three dominant actions, those who were sheltering (35.7%), late
evacuation (26.2%) and those defending and then sheltering (26.2%). The majority of those who had
undertaken no preparation prior to February 7 were sheltering at the time of death (66.7%).
Table 25 Relationship between preparation prior to February 7th
and activities at the time of death
Preparation prior to Feb 7th
Activities at the time of death Well
prepared
Some
preparation
No
preparation
Unclear Total
Defending* 21 (27.3%) 4 (9.5%) 0 (0.0%) 1 26
Defending and then sheltering** 26 (33.7%) 11 (26.2%) 0 (0.0%) 4 41
Sheltering 11 (14.2%) 15 (35.7%) 20 (66.7%) 1 47
In shelter but activities unknown 2 (2.6%) 0 (0.0%) 1 (3.3%) 0 3
Late evacuation 11 (14.2%) 11 (26.2%) 6 (20%) 6 34
Indefensible shelter 0 (0.0%) 0 (0.0%) 3 (10%) 0 3
Saving livestock or defending wider
property 6 (7.8%) 1 (2.4%) 0 (0.0%) 0 7
Total 77 42 30 12 161
*May have sheltered at the time of death but evidence of considerable defending
**Includes those who had one or more of the following characteristics: didn’t conduct final preparations on the day,
sheltering was a large component of their plan, and key individuals who were part of the plan were not present
Table 26 Relationship between activities in the hours leading up to death and activities at the time of death
Activities in the hours leading up to death
Activities at the time of death Defending Waiting to
see
No prior
action/sheltering from
heat/ caring for others1
Total
Defending* 25 (29.4%) 0 (0.0%) 1 (2.3%) 26
Defending and then sheltering** 35 (41.2%) 3 (7.3%) 3 (7.0%) 41
Sheltering 5 (5.9%) 21 (51.2%) 22 (51.2%) 48
In shelter but activities unknown 0 (0.0%) 2 (4.9%) 1 (2.3%) 3
Late evacuation 13 (15.3%) 12 (29.3%) 9 (23.3%) 34
Indefensible shelter 0 (0.0%) 3 (7.3%) 0 (0.0%) 3
Traveling through area for
pleasure 0 (0.0%) 0 (0.0%) 6 (14%) 6
Saving livestock or defending
wider property 7 (8.2%) 0 (0.0%) 0 (0.0%) 7
Total 85 41 42 168
*May have sheltered at the time of death but evidence of considerable defending
**Includes those who had one or more of the following characteristics: didn’t conduct final preparations on the day,
sheltering was a large component of their plan, and key individuals who were part of the plan were not present 1Includes individuals who were inside taking care of children or others with special needs while others were defending
or making preparations to defend. Although this is recognised as an important supportive role it is not classified here
as active defense.
Table 26 explores the relationship between activities leading up to and at the time of death. Those who are
defending in the lead up to their deaths are dominantly found to be defending and then sheltering at the
time of death (37%) or defending (29%). Just over half (51%) of those who are waiting to see and those who
had undertaken no prior action in relation to the fire in the lead up to their deaths are found sheltering at
the time of death followed by those engaged in a late evacuation (29% and 23% respectively).

63
6.9.2 FATALITIES AND ENVIRONMENTAL IRCUMSTANCES
A multivariate linear regression analysis was performed between a single activity-factor, as the dependant
variable and fire intensity and distance to forest as independent variables. This model has very small linear
coefficients, which signifies that activity is uncorrelated with intensity and distance to forest. The R2 value
for this regression is 0.03 (Adjusted R2 0.017).
The results are not significant to find a relationship between activity of fatality and intensity and distance to
forest. This appears to indicate that the actual potential exposure level a person may receive may not be an
effective predictor of the tendency for a person to have a predetermined plan. Also it has to be emphasized
that the exceptional nature of the 2009 Victorian bushfires. Under intense weather conditions and fire
severity21 and as stated by O’Neil and Handmer (2010) on that day, some people could not respond
appropriately to the risk the bushfires presented to them.
6.9.3 EXPLORATION OF THOSE WHO WERE ‘WELL PREPARED’
It is acknowledged that judging preparedness based on the preparations people undertook prior to Black
Saturday is problematic. In order to improve the examination of those who were prepared to defend on
Black Saturday, a more sophisticated variable was calculated which included preparations, fire-plan, age,
physical ability and ability to focus on defence.
Included in this analysis are those people who were considered well prepared in terms of their preparations
prior to Black Saturday and on February 7th, had a clear fire-plan to stay and defend throughout the fire
whatever the conditions, were 16 years or older and under the age of 70, were in good physical health and
were not responsible for dependents (children, elderly, sick or immobile people) on the day of the fire.
When these factors are combined, only 21 of the total fatalities are considered ‘well prepared’. This
number includes 14 males and 7 females. Table 27 documents the location at the time of death of these 21
fatalities, the majority are found inside the home with one in a vehicle and four in the open air. Table 28
lists the activities engaged in during the hours leading up to and at the time of these deaths. Only three
activities are represented: defending, defending and sheltering and defending wider property (those killed
outside their home, their neighbour’s home or their place of work).
Table 29 describes the details of the 21 fatalities. All but three of the fatalities are in their 50s and 60s.
These fatalities are associated with 11 incidents. In 7 of these incidents a possible weakness in their
planning can be identified. Four of the incidents were associated with bunkers or under house enclosure
and from the descriptions supplied in the Final Report of the Victorian Bushfires Royal Commission21 it
appears that all 8 of those who died where highly reliant on the bunkers as a ‘safe haven’ to which they
could retreat if conditions deteriorated. All these bunkers were unsuccessful in sustaining life. Although
these families were all considered to be well prepared, it is questionable whether they would have stayed
to defend in the conditions experienced on Black Saturday if they did not have bunkers as a form of back
up. In all of these cases, those who died were aware of the fire threat and had sufficient time to evacuate
safely.
Three cases (including one associated with a bunker) represent people defending on their own and in at
least one of these cases the fire plan was for other members of the family to assist. The findings of the
Victorian Bushfires Royal Commission21 identified the dangers of singular defence and the importance of
assistance.
Finally, in one case, livestock needed care and this extra responsibility may have distracted the deceased
and be a causal factor in their death. By comparison, the husband, who did not attend to the livestock as
the fire-front hit, survived).
21 http://www.royalcommission.vic.gov.au/commission-reports/final-report (accessed 30/10/2012)

64
This leaves only 4 incidents. One represents a father and son who were caught on the road while returning
to their property after assisting a neighbour with defence. The other 3 incidents involved properties where
more than one person was present and all were well prepared to defend throughout the fire. However, all
3 properties were within densely forested areas where, in the conditions experienced on Black Saturday,
defence would have been extremely difficult. Indeed, in all but 2 of the incidents involving the 21 fatalities
the properties or location of the deceased was very close to the forest and for 9 incidents having more than
70% forest cover within 100m of the house. .
Table 27 Location at the time of death of fatalities that were considered highly prepared
Location Number
Inside structure 16
Inside vehicle 1
Open air 4
Total 21
Table 28 Activities leading up to and at the time of death for those considered highly prepared
Activities in the hours leading up to death
Activities at the time of death Defending
Defending* 10
Defending and then sheltering** 7
Saving livestock or defending
wider property.
4
Total 21
*May have sheltered at the time of death but were defending up to the point of their death.
** Where defending prior to death however, sheltering a large component of their plan and all found in a bunker
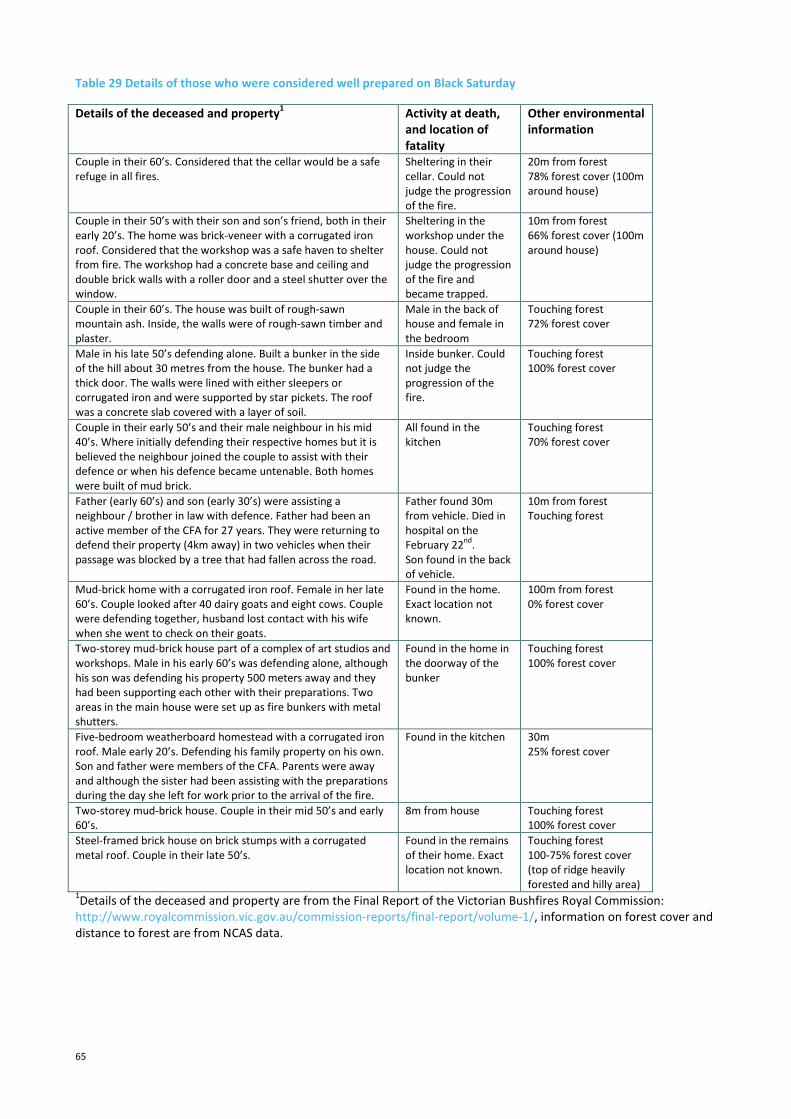
65
Table 29 Details of those who were considered well prepared on Black Saturday
Details of the deceased and property1 Activity at death,
and location of
fatality
Other environmental
information
Couple in their 60’s. Considered that the cellar would be a safe
refuge in all fires.
Sheltering in their
cellar. Could not
judge the progression
of the fire.
20m from forest
78% forest cover (100m
around house)
Couple in their 50’s with their son and son’s friend, both in their
early 20’s. The home was brick-veneer with a corrugated iron
roof. Considered that the workshop was a safe haven to shelter
from fire. The workshop had a concrete base and ceiling and
double brick walls with a roller door and a steel shutter over the
window.
Sheltering in the
workshop under the
house. Could not
judge the progression
of the fire and
became trapped.
10m from forest
66% forest cover (100m
around house)
Couple in their 60’s. The house was built of rough-sawn
mountain ash. Inside, the walls were of rough-sawn timber and
plaster.
Male in the back of
house and female in
the bedroom
Touching forest
72% forest cover
Male in his late 50’s defending alone. Built a bunker in the side
of the hill about 30 metres from the house. The bunker had a
thick door. The walls were lined with either sleepers or
corrugated iron and were supported by star pickets. The roof
was a concrete slab covered with a layer of soil.
Inside bunker. Could
not judge the
progression of the
fire.
Touching forest
100% forest cover
Couple in their early 50’s and their male neighbour in his mid
40’s. Where initially defending their respective homes but it is
believed the neighbour joined the couple to assist with their
defence or when his defence became untenable. Both homes
were built of mud brick.
All found in the
kitchen
Touching forest
70% forest cover
Father (early 60’s) and son (early 30’s) were assisting a
neighbour / brother in law with defence. Father had been an
active member of the CFA for 27 years. They were returning to
defend their property (4km away) in two vehicles when their
passage was blocked by a tree that had fallen across the road.
Father found 30m
from vehicle. Died in
hospital on the
February 22nd
.
Son found in the back
of vehicle.
10m from forest
Touching forest
Mud-brick home with a corrugated iron roof. Female in her late
60’s. Couple looked after 40 dairy goats and eight cows. Couple
were defending together, husband lost contact with his wife
when she went to check on their goats.
Found in the home.
Exact location not
known.
100m from forest
0% forest cover
Two-storey mud-brick house part of a complex of art studios and
workshops. Male in his early 60’s was defending alone, although
his son was defending his property 500 meters away and they
had been supporting each other with their preparations. Two
areas in the main house were set up as fire bunkers with metal
shutters.
Found in the home in
the doorway of the
bunker
Touching forest
100% forest cover
Five-bedroom weatherboard homestead with a corrugated iron
roof. Male early 20’s. Defending his family property on his own.
Son and father were members of the CFA. Parents were away
and although the sister had been assisting with the preparations
during the day she left for work prior to the arrival of the fire.
Found in the kitchen 30m
25% forest cover
Two-storey mud-brick house. Couple in their mid 50’s and early
60’s.
8m from house Touching forest
100% forest cover
Steel-framed brick house on brick stumps with a corrugated
metal roof. Couple in their late 50’s.
Found in the remains
of their home. Exact
location not known.
Touching forest
100-75% forest cover
(top of ridge heavily
forested and hilly area) 1Details of the deceased and property are from the Final Report of the Victorian Bushfires Royal Commission:
http://www.royalcommission.vic.gov.au/commission-reports/final-report/volume-1/, information on forest cover and
distance to forest are from NCAS data.

66
7 Conclusions
An extensive dataset has been developed to spatially and temporally locate all know Australian bushfire
fatalities over the past 110 years (1901-2011). The dataset has attempted to cover all reported deaths
occurring up to the end of 2011 and includes 733 civilian and 92 firefighter deaths (known as the Attorney
General Department’s (AGD) NFDRS Life Loss database/Life Loss database). An extensive range of qualifying
parameters has also been included to assist in developing the context under which the deaths occurred.
The database contains details of fire weather (using the McArthur Forest Fire Danger Index (FFDI) and its
individual components), fire properties, distance to forest, incident circumstances, fatality details, activities
and associated object locations and properties related to the fatality. It is hoped that the database will be
maintained by adding future and newly discovered historical deaths to the dataset and to build on the
range and quality of qualifying parameters it contains.
Analysis has been performed as a first step in exploring the newly developed dataset. This included the
analysis of spatial information to determine the environmental circumstances such as the location and
extent of objects directly related to a fatality, the proximity to forest and predicted fire weather severity.
The following provides a list of the key conclusions from this analysis:
Timing and weather:
• The 825 fatalities in the database occurred during 260 separate fire events. With 10 major fire days
accounting for 65% of the total number of fatalities. The number of fatalities is dominated by few
iconic events resulting in large numbers of the fatalities (such as Black Friday 1939, Hobart 1967,
Ash Wednesday 1983, and Black Saturday 2009).
• Over 80% of all fatalities have occurred in the months of January and February. Of these deaths the
fatalities generally occur in daylight with a peak between 3pm and 7 pm. Firefighter Fatalities are
distinctly different with a peak at 3pm and another at 9pm. There have been no known civilian
deaths and only one firefighter death between 12pm and 9am.
• Fire weather severity is a key qualifier in setting the context of life loss in bushfire with all events
involving 5 or more deaths occurring on days where FFDI at 3pm was over 50. The weather
thresholds for individual parameters where losses of 5 or more occurred were:
o Temperatures above 33 degrees Celsius
o Wind speeds above 24km/hr
o Relative Humidity below 16%.
• There is a prominence of life loss around the time of a wind change during a fire event.
• Over 50% of all civilian fatalities occurred on days where the FFDI at 3pm exceeded 100 meaning
that it would occur under the newly defined ‘catastrophic’ weather conditions. Over 60% occurred
on days that exceed 40 degrees Celsius. Over 35% occurred on days were the 10 minute average
wind speed exceeded 60km/hr. Approximately 70% of all fatalities occurred on days where the
relative humidity was below 10% at 3pm.
• Fatalities occurring in open air are more prevalent for FFDI values below 100. Fatalities within
structures are the most prevalent for FFDI values above 100.
• An exploration of a new life loss index based on fire weather parameters (temperature, wind,
relative humidity and drought factor) was developed from the dataset to provide an improvement
in the degree of correlation compared to the currently used McArthur Forest fire danger index.
• Statistical analysis demonstrated a tendency for fatalities occurring on moderate fire weather days
to occur while defending property, evacuating late or sheltering with some defence. This group

67
consisted of a mix of people with and without fire plans. While under the most severe fire weather
days, fatalities were mainly sheltering and following a pre-considered plan.
Spatial location:
• Victorian fatalities account for over 60% of all Australian fatalities. Victoria’s house loss also
accounts for a similar proportion of Australia’s total. While New South Wales had the greatest
number of firefighter fatalities per state.
• Over 50% of all fatalities occurred as either single or double loss incidence. The largest group of
civilian fatalities was 17 motorists during the Lara bushfire (1969), and the largest group of
firefighter fatalities was 12 trapped with their tankers during the Ash Wednesday Beaconsfield
bushfire in 1983.
• Approximately 84% of all fatalities occurred at the location of fatal exposure, the remaining 14%
occurred at a different location (e.g. in Hospital) with 2% unknown.
• Fatalities occurred in various locations: 58% in the open air, 28% inside structures, 8% inside
vehicles and 6% unknown. There were no known firefighter fatalities within structures, 28 occurred
inside vehicles and 38 in the open. Male and female civilian fatalities within structures were evenly
represented, while male fatalities out in the open were approximately 3 times greater.
• Proximity to forest appears to be a highly influential factor with over 78% of fatal exposures
occurring within 30m and 85% within 100m of the forest edge. If we specifically consider fatalities
inside structures, 88% occurred within 30m of the forest and 95% within 50m. This suggests that
fatalities inside structures are strongly associated with high radiant heat and possible flame contact
circumstances potentially resulting in a rapid loss of tenability of the structure.
• Civilian deaths tended to occur within close proximity to their place of residence. Of the civilian
fatalities occurring inside structures approximately 82% were in their place of residence. Of the
fatalities with known residential addresses and accurately known location of fatality that died in
placed other than their place of residence, 61% were within 100m and 84% were within 1km of
their place of residence.
• Fatal exposure in open air but related to a vehicle show that 40% died within 10m of the vehicle
and 67% within 100m.
• Of the civilian deaths occurring inside a structure with a specific locations known, approximately
41% occurred in bathrooms or under house enclosures where reduced capability to monitor
outside conditions.
Correlations:
• The context of the fire weather severity in understanding the location of death is important with a
significant shift from open air fatalities at low FFDI’s to a dominance of inside structure deaths at
FFDI’s greater than 100.
• Using fire weather days as a point of correlation between life loss and house loss, we find that
house loss is a reasonably good predictor of the potential or life loss with a linear correlation factor
of R2=0.84. This equates to 16.5 houses lost per fatality.
• A regression was used to explore potential relationships between several variables to predict
fatality activities. Two variables, gender and FFDI showed correlation. The regression indicates that
females are more likely than men to die engaged in activities with lower codes (i.e. related to
sheltering and evacuation).
• An exploration of the relationship of different environmental circumstances, fatality activities and
fire plans was performed for the 2009 Victorian bushfires. The results of the multivariate linear
regression analysis showed that there was not significant relationship between the activity
undertaken and the intensity of fire or distance to forest. This appears to indicate that the actual

68
potential exposure level to a person may not be an effective predictor of the tendency for that
person to have a predetermined plan.
• FFDI is a slightly stronger predictor of life loss than its individual components with an R2 of 0.38 for
FFDI and an R2 of 0.30 for temperature (the strongest correlation of the individual parameters).
However using FFDI threshold as a predictor for life loss is difficult as other factors influence the
outcomes, such as fire severity, community attitude, response and decision making, management
and education policies.
• Newly derived weather based life loss indices could provide an improved method to predict life loss
potential compared to traditional indices such as FFDI which have been used for a broad range of
purposes beyond their original intent.
Fatalities are dominated by a few fire events that have occurred under extreme weather conditions. These
conditions should be used as the context for discussing appropriate defensive actions for communities
faced with a bushfire threat. It should be highlighted that climate change projections are for more frequent
fire weather event (Lucas 2010) of the level in which significant life loss has occurred in the past. Much can
be gained from the understanding this dataset provides in relating the circumstances of death to these
levels of fire weather severity.

69
8 Acknowledgements
We gratefully acknowledge all the people who contribute to this research including those we haven’t
named below.
We would like to thanks the following people for their assistance in collecting the data for this database:
Gary Featherstone (AFAC), Ralph Smith, Lachie McCaw (WA), Simon Heemstra, Katie Collins, Melissa
O’Hallaran, Monica Daniels (NSW RFS), Mark Garvey (CFA), Mark Chladil (Tasmania Fire Service), Liam
Fogarty (DSE), Rick McRae (ACT), Fergus Adrian (QLD Fire Service).
Judge Jennifer Coates, Lisa Nicholas, Greg Callow, Sheree Argento, David Whelan (Coroners Court of
Victoria), various persons from Public Record of Victoria and New South Wales, Paul West and Joshua
McIvenny (Coroners Court NSW), Michele Bayly-Jones (Coroners Court SA), Matthew Gordon-Clark (Public
Records SA).
Mark Bradley (Department of Climate Change and Energy Efficiency), Chris Lucas (BOM), Joshua Whittaker
and John Handmer (RMIT).
We would like to thank Stacey Dravitzki, Chi-Hsiang Wang, Bob Leicester, Richard Thornton and Katie
Collins for their helpful reviews, suggestions and comments. We also are thankful to Chi-Hsiang Wang for
assisting in the exploration of new fire weather indices.

70
9 References
Ahern, A. and Chladil, M. (1999). How far do bushfires penetrate urban areas? Proc. Australian Disaster
Conf. 1999, Disaster Prevention for the 21st Century. Canberra, Emergency Management Australia: 6-21.
Barrow, G. J. (1945). "survey of houses affected in the Beaumaris fire, January 14, 1944." Journal of the
Council for scientific and Industrial research 18(1).
Blanchi, R., Leonard, J. and Leicester, R. H. (2006). Lessons learnt from post bushfire surveys at the urban
interface in Australia. V International Conference on Forest Fire Research. D. X. Viegas. Figueira da Foz.
Blanchi, R. and Leonard, J. (2008). Property safety: judging structural safety. In Community Bushfire Safety
J. Handmer, Haynes, K. (eds). Melbourne, CSIRO publishing: 77-85.
Blanchi, R., Lucas, C., Leonard, J. and Finkele, K. (2010). "Meteorological conditions and wildfire-related
house loss in Australia." International Journal of Wildland Fire 19: 914-926.
Bradstock, R. A. and Gill, A. M. (2001). "Living with fire and biodiversity at the urban edge: in search of a
sustainable solution to the human protection problem in southern Australia." J. Mediterr. Ecol. 2: 179.
Butler, B. and Cohen, J. (1998). "Firefighter Safety Zones: A Theoretical Model Based on Radiative Heating."
International Journal of Wildland Fire 8(2): 73-77.
Byram, G. M. (1959). Combustion of forest fuels, in Davis K.P. Byrma G.M. Krumm W.R. Forest fire - Control
and use. McGraw-Hill Book Co., New York.
Chen, K. and McAneney, J. (2004). "Quantifying bushfire penetration into urban areas in Australia."
Geophys. Res. Lett. 31(12): L12212.
Cheney, N. P. (1979). Bushfire disasters in Australia 1945-1975. In: Natural Hazards in Australia. R. L.
Heathcote and B. G. Thom. Canberra, Australian Academy of Science: 72-93.
Cheney, P., Gould, J. and McCaw, L. (2001). "The dead-man zone - a neglected area of firefighter safety."
Australian Forestry 64(1): 45-50.
Cohen, J. D. (2000). Examination of the Home Destruction in Los Alamos Associated with the Cerro Grande
Fire July 10, 2000. Missoula, Montana, USDA Forest Service, Rocky Mountain Research Station.
Cohen, J. D. and Statton, R. (2008). Home Destruction Examination Grass Valley Fire, Lake Arrowhead, CA,
United States Department of Agriculture: 26p.
Cohen, J. D. (2008). "The wildland-urban interface fire problem. A consequence of the fire exclusion
paradigm." Forest History Today (Fall 2008): 20-26.
Cole, R. E. (1983). Houses exposed to bushfires. A survey of the effects of the Hobart fire of 1967 and the
Blue Mountains fire of 1968, Technical record 390(L). Experimental building station department of housing
and construction.
Collins, P. (2009). Burn: The Epic Story of Bushfire in Australia: with an introduction on the Black Saturday
fires. Melbourne, Scribe Publications.
Country Fire Authority (1983). The major fires originating 16th February, 1983, Report CFA.
Crompton, R. P., McAneney, K. J., Chen, K. P., Pielke, R. A. and Haynes, K. (2011). "Influence of Location,
Population, and Climate on Building Damage and Fatalities due to Australian Bushfire: 1925-2009."
Weather Climate and Society 3(1): 63-66.
Ellis, S., Kanowski, P. and Whelan, R. (2004). National inquiry on bushfire mitigation and management.
Canberra, Commonwealth of Australia. http://www.coagbushfireenquiry.gov.au/findings.htm (Accessed
December 2012).

71
Foley, J. C. (1947). A study of meteorological conditions associated with bush and grass fires and fire
protection strategy in Australia. Bulletin ; no. 38 Melbourne, Commonwealth of Australia, Bureau of
Meteorology: 234p.
Furby, S. (2002). Land Cover Change: Specification for Remote Sensing Analysis. CSIRO Mathematical and
Information Sciences Technical Report No. 9, prepared for National Carbon Accounting System, Australian
Greenhouse Office, Canberra.
Griffiths, D. (1999). "Improved formula for the drought factor in McArthur’s Forest Fire Danger Meter."
Australian Forestry 62(2): 202-206.
Handmer, J. and Tibbets, A. (2005). "Is staying at home the safest option during bushfires? Historical
evidence for an Australian approach." Environ. Hazards 6(2): 81.
Handmer, J. W. and Haynes, K. (2008). Community bushfire safety. Collingwood, Vic., CSIRO Publishing.
Harris, S., Anderson, W., Kilinc, M. and Fogarty, L. (2011). Establishing a link between the power of fire and
community loss: The first step towards developing a bushfire severity scale. Fire and adaptive management,
report no. 89. Melbourne, Victorian Government Department of Sustainability and Environment.
Harris, S., Anderson, W., Kilinc, M. and Fogarty, L. (2012). "The relationship between fire behaviour
measures and community loss: an exploratory analysis for developing a bushfire severity scale." Natural
Hazards 63(2): 391-415.
Haynes, K., Tibbits, A., Coates, L., Ganewatta, G., Handmer, J. and McAneney, J. (2008). 100 years of
Australian civilian bushfire fatalities: exploring the trends in relation to the ‘stay or go policy'. Melbourne,
RMIT. Report for the Bushfire CRC.
Haynes, K., Handmer, J., McAneney, J., Tibbits, A. and Coates, L. (2010). "Australian bushfire fatalities 1900-
2008: exploring trends in relation to the "Prepare, stay and defend or leave early" policy." Environmental
Science & Policy 13(3): 185-194.
Krusel, N. and Petris, S. (1999). A Study Of Civilian Deaths In the 1983 ash wednesday bushfire victoria. CFA
Occasional Paper No 1. Mt Waverley, Contry Fire Authority: 28p.
Leonard, J. and McArthur, N. A. (1999). A history of research into building performance in Australian
bushfires. Proc. Bushfire 99: Australian Bushfire Conference. Albury, 7–9 July 1999.
Leonard, J. E. (2003). People and property – a researcher's perspective. In Australian Burning: Fire Ecology,
Policy and Management Issues. G. Cary, D. Lindenmayer and S. Dovers. Melbourne, Vic, CSIRO Publishing.
Leonard, J. and Blanchi, R. (2005). Investigation of bushfire attack mechanisms involved in house loss in the
ACT Bushfire 2003, CSIRO Manufacturing & Infrastructure Technology.
Leonard, J. (2009). Report to the 2009 Victorian Bushfires Royal Commission Building performance in
Bushfires, Commonwealth Scientific and Industrial Research Organisation.
http://www.royalcommission.vic.gov.au/Documents/Document-files/Exhibits/TEN-066-001-0001.pdf.
Lucas, C., Hennessy, K., Mills, G. and Bathols, J. (2007). Bushfire Weather in Southeast Australia: Recent
Trends and Projected Climate Change Impacts, Consultancy Report prepared for The Climate Institute of
Australia. Bushfire CRC.
Lucas, C. (2010). "A historical fire weather dataset for Australia." Australian Meteorological and
Oceanographic Journal 60: 1-14.
Luke, R. H. and McArthur, A.G. (1978). Bushfires in Australia. Reprinted with corrections 1986, Canberra
Publishing and Printing Co.
Manzello, S. L., Park, S. H. and Cleary, T. G. (2010). "Development of rapidly deployable instrumentation
packages for data acquisition in wildland-urban interface (WUI) fires." Fire Safety Journal 45(5): 327-336.
Maranghides, A. and Mell, W. (2011). "A Case Study of a Community Affected by the Witch and Guejito
Wildland Fires." Fire Technology 47(2): 379-420.

72
McArthur, A. G. (1967). Fire behaviour in eucalypt forests. Leaflet No. 107., Comm. of Australia For. &
Timber Bur.
McArthur, A. G. and Cheney, N. P. (1967). Report on the southern Tasmanian bushfires of 7 February 1967.
Hobart, Forestry Commission Tasmania.
McArthur, A. G., Cheney, N.P., Barber, J. (1982). The fires of 12 February 1977 in the western district of
Victoria, A joint report by CSIRO Division of Forest Research Canberra and Country Fire Authority
Melbourne.
McCaw, L. and B. Hanstrum (2003). Fire environment of Mediterranean south-west Western Australia. Fire
in ecosystem of south Western Australia: Impact and management. I. Abbots and N. Burrows. Leiden, The
Netherlands, Bachuys: 87-106pp.
McLennan, J., Elliott, G., and Omodei, M., 2011 Issues in Community Bushfire Safety: Analyses of Interviews
Conducted by the 2009 Victorian Bushfires Research Task Force. Report No 4: 2011.
http://www.bushfirecrc.com/managed/resource/issues_in_community_bushfire_safety-
analyses_of_interviews_conducted_by_the_2009_victorian_bushfires_0.pdf. (Accessed online, December
2012).
Newnham, G. J., Siggins, A. S., Blanchi, R. M., Culvenor, D. S., Leonard, J. E. and Mashford, J. S. (2012).
"Exploiting three dimensional vegetation structure to map wildland extent." Remote Sensing of
Environment 123(0): 155-162.
Noble, I. R., Bary, G. A. V. and Gill, A. M. (1980). "Mcarthur Fire-Danger Meters Expressed as Equations."
Australian Journal of Ecology 5(2): 201-203.
NSW Rural Fire Service (2000). 50 years of fires in NSW New South Wales Rural Fire Service Printed.
O'Neill, S. J., Handmer, J. and Killalea, D. (2010). Review of fatalities in the February 7, 2009, bushfires.
Prepared for the Victorian Bushfires Royal Commission Melbourne, Centre for Risk and Community Safety
RMIT University, Bushfire CRC.
O'Neill, S. J. and Handmer, J. (2012). "Responding to bushfire risk: the need for transformative adaptation."
Environmental Research Letters 7(1).
Purton, C.M., (1982). Equations for the McArthur mark 4 grassland fire danger meters.Meteorological Note
147. Bureau of Meteorology, Melbourne.
Ramsay, G. C., McArthur, N.A. Dowling, V.P. (1987). "Preliminary results from an examination of house
survival in the 16 February 1983 bushfires in Australia." Fire and Materials 11: 49-51.
Ramsay, G. C. and McArthur, N. A. (1995). Building in the urban interface : lessons from the January 1994
Sydney bushfires. Bushfire ’95 Conference, September 1995. Hobart: 13 p.
Reisen, F. and Brown, S. K., 2009. "Australian firefighters' exposure to air toxics during bushfire burns of
autumn 2005 and 2006. " Environ Int. 35(2): 342-352.
Reisen, F., Hansen, D. and Meyer, C. P., 2011. "Exposure to bushfire smoke during prescribed burns and
wildfires: Firefighters' exposure risks and options." Environ Int. 37(2): 314-321.
Reisen, F. (2011). Toxic Emissions from Fires at the Rural Urban Interface – Desktop Study. Bushfire CRC
report, 30p.
Standards Australia (2009). AS 3959-2009 (Amend. 1) Construction of buildings in bushfire prone areas,
Standards Australia.
Teague B, McLeod R, Pascoe S (2010) 2009 Victorian Bushfires Royal Commission final report. Available at:
http://www.royalcommission.vic.gov.au/commission-reports/final-report (Accessed December 2012).
Tibbits, A., Blanchi, R. and Gill, A. M. (2006). A Resident’s experiences of the 2003 Canberra bushfire.
Australasian Bushfire Conference. Brisbane.

73
Tibbits, A., Handmer, J., Haynes, K., Lowe, T. and Whittaker, J. (2008). Prepare, stay and defend or leave
early: evidence for the Australian approach. In Community bushfire safety. J. Handmer, Haynes, K. (eds).
Melbourne, CSIRO publishing: 59-71.
Viegas, D. X., Stipanicev, D., Ribeiro, L., Pita, L. P. and Rossa, C. (2008). "The Kornati fire accident - eruptive
fire in relatively low fuel load herbaceous fuel conditions." Modelling, Monitoring and Management of
Forest Fires 119: 365-375.
Whittaker, J., Haynes, K., Handmer, J. and McLennan, J. (2013). "Community safety during the 2009 ‘Black
Saturday’ bushfires: an analysis of household preparedness and response. " International Journal of
Wildland Fire (in press).
Wilson, A. A. G. and Ferguson, I. S. (1984). "Fight or flee : a case study of the Mount Macedon bushfire."
Aust. For. 47(4): 203-236.
Wilson, A. A. G. and Ferguson, I. S. (1986). "Predicting the probability of house survival during bushfires."
Journal of Environmental Management 23: 259-270.
Wilson, K. J. and H. Stern (1985). "The Australian Summertime Cool Change .1. Synoptic and Subsynoptic
Scale Aspects." Monthly Weather Review 113(2): 177-201.

74
Appendix 1 – Database Structure
Science subgroup
The stakeholders are the members of the NFDRS –Science Subgroup. The members are listed below. The
members represent all the end user agencies.
Name Title Branch/Organisation
Peter Channells Chair AGD
Darren Bretherton AGD
Jeff Kepert BoM
Kevin Tory BoM
Richard Thornton Bushfire CRC
Andrew Sullivan CSIRO
Justin Leonard CSIRO
Mark Chladil TFS
Simon Heemstra RFS (NSW)
David Nichols CFA (Vic)
Geoff Conway CFA (Vic)
Leigh Miller CFA (SA)
Liam Fogarty DSE (Vic)
Lachie McCaw ` DEC (WA)
Neil Burrows DEC (WA)
Rick McRae RFS (ACT)
Ralph Smith FESA
Ross Bradstock University of Wollongong
Kevin Tolhurst University of Melbourne
Samantha Setterfield Charles Darwin University
Natalie Rossiter-Rachor Charles Darwin University
Structure and parameters of database
The following tables describe the parameters intended for use in describing historic fatalities in the AGD
NFDRS project. Each table represents a linked hierarchy with all parameters in the table being links to the
line items below it. Tables are linked to each other where common variables existing in different tables
such as an Object ID or Incident ID. The highest level table is the Incident table, an incident is a single
fatality or a multiple fatality scene where individuals were sheltering or behaving as a collective group.
This spatial dataset will link directly to the Landscape Fire Fatalities Database 2011 09(LFDD) via the Fatality
ID in the Fatalities table.
Each parameter will be populated in the table if it is available, for those not available a default indicating
that it is unknown will be provided. For some of the variables free text fields are defined, as free text is
problematic for spatial and statistical querying efforts will be made to categorise these parameters as their
contents emerges.

75
It is expected that some fatalities in older fires will contain object associations without the specific location
of the object being known. An approach using large confidence limits on the estimated location will be
applied to deal with this case.
The parameters may be subject to change to make full use of the data as it is aggregated. Feedback on
parameters and suggestions for change are very welcome at this stage of the project.
Incident table
Variable Description Comments
Incident ID Unique number Site map of an incident that include one or several
fatalities inclusive of all relevant objects to those
fatalities.
Objects ID Unique number for each
object
Relates all relevant objects to specific incidents
Object Type House
Car
any surrounding object
relevant to the case
Fire front
Spatial description of the scene where fatalities has
occurred. Geo-rectified aerial photo or map
identifying locations of other relevant objects eg
building vehicles, bushland, fire approach direction.
(set of attribute to collect for each object, detail in
each table)
Time of object ignition
Time of loss of tenability
Object description Polygon, line, point Geo-referenced object in GIS
Data sources used to
populate parameters for each
object
Develop table of codes to
cover each data source
used

76
Fatalities table
Variable Description Comments
Fatality ID Unique Number from Landscape Fire Fatalities Database
2011 09(LFDD) from CRC/risk
frontier/RMIT/Agency
Incident ID
Unique Number Unique number
Location of fatality Point Geo-referenced object in GIS. Geo-rectified
aerial photo or map identifying location of
fatality and fatal exposure if different
Time of fatality Time / Unknown (blank)
For each standard time descriptor:
Time + confidence limits
Show as Date and local time in 24 hour
minutes and seconds
Location of fatality different
than location of fatal exposure
Y/N/Unknown If Yes answer two following questions (time
and location of fatal exposure)
Time of fatal exposure Time / Unknown (blank) Time + confidence limits
Show as Date and local time in 24 hour
minutes and seconds
Location of fatal exposure Point Geo-referenced point object in GIS
Time of fire arrival (at location
nearest to fatal exposure point)
Time / Unknown (blank) Time + confidence limits
Show as Date and local time in 24 hour
minutes and seconds
Location of fatal exposure text -Inside structure (X distance from
nearest structure)
Inside vehicle (X Distance from
their vehicle)
-Open air (distance from
structure or vehicle unknown)
In nearly all cases location of fatal exposure
is the same as location of fatality.
(Include additional shelter types if present
in data)
Related Object to location
above
Object ID numbers
Detail of fatalities location Free text, e.g what room inside
structure, what distance for near
structure case
-to be broken down into generic
categories
All parameters from Landscape
Fire Fatalities Database 2011
09(LFDD) from CRC/risk
frontier/RMIT/Agency
See data entry spread sheet from the
Landscape Fire Fatalities Database 2011
09(LFDD)
Related objects to fatal
exposure
Object ID numbers
0 Unknown
List of one or several objects that were
identified as being responsible for the fatal
exposure
Exposure description Free text, e.g. relevant
information relating to fatal
exposure for cases with little or
no spatial data available
(preparedness?)

77
Surrounding Objects table
Variable Description Comments
Objects ID Unique number
Status of the surrounding object Damaged, destroyed, untouched, unknown
Object use as a shelter Y/N/Unknown
House table
Variable Description Comments
Objects ID Unique number
Address Text
Final status of house Damaged, destroyed, untouched, unknown
House used as shelter Y/N/Unknown
Construction type/ era/date Various classes
Known damage process prior to ignition Radiant heat, Wind, tree impact, Combination,
Unknown
Known ignition process Embers, Radiant heat, Flame
Known source of ignition Object ID
Likely rate of loss of tenability of the
house if lost
Class to be defined
Time of loss of infrastructure (power) Time/N/Unknown/Not Present
Time of loss of infrastructure (water) Time/N/Unknown/Not Present
Time of loss of infrastructure (telephone) Time/N/Unknown/Not Present
Plan of house Attach document if
available
Description of house and surrounding Free text, e.g. relevant information relating to fatal
exposure for cases with little or no spatial data
available, presents of spray protection system.
Categorisation of defend-ability.
Context of entrapment (inside structure) Free text/ or classes
Vehicle table
Variable Description Comments
Objects ID Unique number
Vehicle detail Text Brand/model/age
Status of vehicle Damaged, destroyed, untouched,
unknown
Use as shelter Y/N/Unknown
Context of entrapment (inside
vehicle)
Classes to be defined
Likely rate of loss of tenability of the
car if lost
Classes to be defined
Origin of car journey Point Location Geo-referenced object in GIS
Intended destination of car journey Point Location Geo-referenced object in GIS
Description of car and surroundings Free text, e.g. relevant information
relating to fatal exposure for cases
with little or no spatial data available

78
Physical parameter table
Variable Description Comments
Incident ID Unique number
FDI reported (on the day) Number, source, FFDI
Type
Nearest BOM station for which following
data is derived
Point Location Geo-referenced object in GIS
Temperature (degrees Celsius) Daily summary and closest recorded to
time of critical exposure
Relative Humidity (%) “”
Drought factor “”
Wind speed (km/h) average 10 minutes “”
Wind speed (km/h) 3 second gust “”
Wind direction 8 classes or bearing “”
Weather context before fire (few days
before fire arrived
classes
FFDI calculated from factors above? At time of fatality, peak for the day etc
Forest
Variable Description Comments
Forest ID Unique number
Description polygon Geo-referenced object in GIS
Type of unmanaged vegetation
relevant to fire front behaviour
nearest fatal exposure
AS3959 classification
Last reduction burn if known classes
Fire front object
Variable Description Comments
Objects ID Unique number
Forest ID Unique number
Reported intensity of fire Classes (fire line intensity)/Unknown

79
Appendix 2 - Data category tables and their contents
TABLE OVERVIEW
TABLE NAME DESCRIPTION
Fire Contains information about a fire that involved fatalities
Fire Weather Contains information about the weather conditions around the time of fatalities in the vicinity of
the fire. One fire may have a number of fire weather records associated with it giving weather
conditions at different times throughout the day or recorded at different nearby weather stations.
Incident Contains information about incidents involving fatalities that occurred during a fire. An incident is
a single fatality or a multiple fatality scene where individuals were sheltering or behaving as a
collective group.
Fatality Contains information about the fatalities that occurred during an incident.
Object Contains information about the objects that are associated with an incident. These objects may be
houses, vehicles, or other objects.
House Contains information about houses associated with an incident.
Vehicle Contains information about vehicles associated with an incident.
Other Object Contains information about other objects associated with an incident. This may include sheds,
fences, dams, trees, etc.
GIS Object Inventory Contains information about spatial objects that are associated with the database

80
FIRE TABLE
FIELD NAME DESCRIPTION VALUES
Fire Code Unique fire identification number. e.g. 256
Fire name Fire name. e.g. Barnawartha 2006
Fire Date Date of fire on which fatalities occurred. e.g. 21/01/2005
Weather context before fire Description of weather context before fire
(few days before fire arrived)
Text
Wind change Indicates whether the wind changed direction
on fire date (for some fire event there is only
a mention of wind change during the day
without specific details of time or direction).
yes/no/unknown
Time of Wind change Date and time of wind change. e.g. 21/01/2009 4:30PM
Blank if unknown
Wind direction after change Wind direction after wind change. e.g. NW
Blank if unknown
Unmanaged Vegetation type Broad type of unmanaged vegetation that fire
travelled through.
e.g. forest, grassland,
combination (more than one
type of vegetation, e.g. forest
and grassland)
Direction of fire spread Direction of fire spread. e.g. SE
Location of origin of fire Description of where the fire began. Text
Time of origin of fire Estimate of time that fire began. e.g. 23/02/1960 10:00AM
House loss Number of houses destroyed in fire. e.g. 213
Description General description of fire (weather, fire
severity, rate of spread, vegetation, etc.).
Text

81
FIRE WEATHER TABLE
FIELD NAME DESCRIPTION VALUES
Fire Code Identifies fire that the fire weather is
associated with. Provides link to Fire table.
e.g. 256
Fire Weather ID Unique fire weather identification number e.g. 25
Fire Weather name Weather name (e.g. TOE: time of exposure,
2PM).
Text
Date Date of fire weather. e.g. 02/02/1995
Time Time of fire weather. e.g. 2:00PM
Blank are non-applicable (e.g.
referring to a maximum
record on the day such as
maximum temperature on the
day, or combination of records
at different time)
Weather station name Name of weather station from which fire
weather data was collected.
e.g. Melbourne AP
NA: non-applicable (for record
with qualitative information)
Unknown : station name is
unknown
Station Number Number of weather stations from which fire
weather data was collected.
Number
Blank when station number is
not known or not applicable
Drought factor Drought factor. 0-10
Temperature (C) Temperature in degrees Celsius. Number
Relative humidity (%) Relative Humidity as a percentage. Number
Wind speed (km/h) avg 10 mins Average wind speed over 10 minutes in km/h. Number
Wind speed (km/h) 3 sec gust Gust wind speed over 3 seconds in km/h. Number
Wind direction Direction of wind. Text
Curing Level of grassland curing as a percentage. Number
FFDI reported Forest Fire Danger Index reported. Number
GFDI report Grassland Fire Danger Index reported. Number
FFDI (WS)calc Forest Fire Danger Index calculated using
wind speed average over 10 minutes.
Number
FFDI (WG) calc Forest Fire Danger Index calculated using
wind gust.
Number
GFDI (WS) calc Grassland Fire Danger Index calculated using
wind speed average over 10 minutes.
Number
Description/references Description of fire weather and/or indication
of where data came from.
Text

82
INCIDENT TABLE
FIELD NAME DESCRIPTION VALUES
Incident Code Unique incident identification code. Format In, e.g. I0231
Incident Name Incident name. Text
Fire Code Identifies fire that incident was associated
with. Provides link to Fire table.
e.g. 256
Description Description of incident. Text
Unmanaged vegetation
description
Description of localised unmanaged
vegetation in vicinity of incident.
e.g. dense forest area
Fire front description Describes fire front at location of incident. Text
Estimated time of fire arrival Estimated time of fire arrival at location of
incident.
e.g. 12/12/2003 3:00PM
Number of fatalities Number of fatalities involved in each incident. Number
Survivors account If there is a survivor involved in the incident.
this field gives an account of their experience
Text
FATALITY TABLE
FIELD NAME DESCRIPTION VALUES
Fatality Code Unique fatality identification
number. Corresponds to AFAC ID.
e.g.432
State The jurisdiction in which the fatality
occurred.
ACT
NSW
NT
QLD
SA
TAS
VIC
WA
Residential address Residential address of person. Text
Unknown identifies where insufficient information
was available on fatalities residential address.
Incident Code Identifies the incident in which this
person died. Provides link to Incident
table.
e.g. I0012
GIS location of fatal
exposure
Identifies the name of the spatial
object that gives the location of the
fatal exposure. These are also
included in the GIS Object Inventory
table.
e.g. F432
NA identifies where persons location is non-
applicable (some indirectly related to the bushfire
and/or not sufficient information to locate fatality)
Description of location
fatal exposure
Describes the location at which the
fatal exposure occurred.
Text/unknown/NA (no clear link between the
fatality and the bushfire event)
Estimated date of fatal
exposure
Best estimate of the date at which
the fatal exposure occurred.
e.g. 12/12/2003
Estimated time of fatal
exposure
Best estimate of the time at which
the fatal exposure occurred.
e.g. 15:00
Loc of death different to
Loc of fatal exposure
Indicates whether death occurred at
a location different to the location of
fatal exposure.
yes/no/unknown/NA

83
FIELD NAME DESCRIPTION VALUES
If yes, location of death If death occurred at a location
different to the location of fatal
exposure, describes the location of
death.
Text
Estimated time of death Best estimate of time of death (if
different from time of fatal
exposure).
e.g. 14/12/2003 4:00AM
Fatal exposure location
class
Classifies location of fatal exposure. inside structure
inside vehicle
open air
unknown
Object related to fatal
exposure location class
Identifies the object that person was
in or near when fatal exposure
occurred. Provides link to Object
table.
Object Code, e.g. V0023
Detail of fatalities
location
Describes location of fatality relative
to the object related to fatal
exposure and/or other objects.
Text
e.g. 5m from V0023, in bathroom.
Distance to residence Straight line distance between
location of fatal exposure and their
residence (km).
Number
Details of distance to
residence
Describes the location of residence
to location of fatal exposure or
identifies where residence was
unable to be located.
Text
e.g. Unable to location residence, fatality at
residence, fatality near residence H0018
Distance to vehicle Straight line distance between
location of fatal exposure and vehicle
related to incidence (km).
Number
Details of distance to
vehicle
Describes the location of vehicle to
location of fatal exposure or
identifies where a vehicle was not
involved in the incidence.
Text
e.g. Fatal exposure unrelated to a vehicle, distance
to vehicle too inaccurate to record, fatal exposure
occurred near vehicle V0012
Death related to fire
mechanism
Indicates whether death was due to
a fire mechanism (smoke, RHF,
convection, flame, over exertion
from fire-fighting) or due to some
other causes.
yes/no/unclear/unknown
If relevant, description
of mechanism
If relevant, description of cause of
death.
e.g. heart attack
Sex Number that indicates gender of
person (from AFAC/Risk frontier
datasets with update on new
fatalities).
1 = male
2 = female
3 = unknown

84
FIELD NAME DESCRIPTION VALUES
Factors Number that indicates factors that
contributed to death (from
AFAC/Risk frontier datasets with
update on new fatalities).
0 = unknown
1 = flames, radiated heat
2 = smoke, hot gas inhalation, asphyxiation,
carbon monoxide
3 = tree, limb or elevated object impact
4 = vehicle incident – single vehicle
5 = vehicle incident – multiple vehicles
6 = aviation incident
7 = drowned
8 = heart attack, overexertion, shock
9 = dehydration, heat stroke
10 = pre-existing illness or medical condition
11 = natural causes
12 = falling
Role Class Number that indicates whether
person was a firefighter or a civilian
(from AFAC/Risk frontier datasets
with update on new fatalities).
1 = firefighter
2 = civilian
Age Class Number that indicates age of person
(from AFAC/Risk frontier datasets
with update on new fatalities).
0 = 00-09
1 = 10-19
2 = 20-29
3 = 30-39
4 = 40-49
5 = 50-59
6 = 60-69
7 = 70-79
8 = 80-89
9 = 90-99
10 = 100+
99 = Unknown
Transport Number that indicates transport
mode of person (from AFAC/Risk
frontier datasets with update on new
fatalities).
1 = on foot
2 = inside a closed car / vehicle
3 = exited a closed car or vehicle due to fire threat
or found with the door open
4 = on open transport or working around or on a
vehicle
5 = unknown
6 = not applicable for those found inside
structures

85
FIELD NAME DESCRIPTION VALUES
Activity Activity and location prior to death
(from AFAC/Risk frontier datasets
with update on new fatalities
including 2009 fires).
0 = Unknown
1 = In defensible shelter and defending
2 = In defensible shelter and made meagre and
unsuccessful attempts to defend
3 = In defensible shelter and passively sheltering
4 = In defensible shelter but activities unknown
5 = Late evacuation from indefensible shelter
6 = Late evacuation from outside work
7 = Late evacuation from shelter
8 = Late evacuation destination or origin unknown
9 = In an indefensible shelter i.e. dugout
10 = On route to defend home, property or
(rescue) loved ones i.e. left safe area and
deliberately
11 = Travelling through area for work unrelated to
fire and unaware of the fire
12 = Waiting rescue
13 = Returned to burning building for possessions
/ rescue
14 = Passively sheltering as a group (3 or more
people from separate families) Or any number of
separate families gathering at a ‘community’
refuge (new code compare to AFAC/Risk Frontier
dataset)
15 = Travelling through area for pleasure e.g.
picnic
16 = Saving livestock, livelihood or defending
wider property or place of work, caught outside
their home, friend’s home, local community or
place of work. Could also be assisting fire fighting
operations
17 = Undertaking official support activities for the
control or supporting agencies
18 = Undertaking official fire fighting activities for
a control agency
19 = Travelling to and from a landscape fire
incident for the purposes of official fire fighting or
supporting activities.
20 = Outside undertaking burn off of property
Decision making Fatality decision making and plans on
the day (from AFAC/Risk frontier
datasets with update on new
fatalities including 2009 fires). Note:
codes changed from AFAC/Risk
Frontier datasets.
1 = Were aware of fire with enough time to save
their lives. Had a fire plan and were following
intended actions which were ineffective
2 = Were aware of the fire with enough time to
save their lives. Either had no fire plan, plan was
unclear or didn’t follow their plan. Includes people
were ‘waiting to see’
3 = Were unaware there was a fire and only
realised when it was too late to implement an
effective survival strategy
4 = Unknown
5 = Extenuating circumstances affected plans
(heart attack)
6 = Children or adults who followed the
instructions of another person
7 = Physically or mentally incapable of
implementing an effective survival strategy (shock,
drugs etc)

86
FIELD NAME DESCRIPTION VALUES
Isochrones time of fire
arrival
Determination of time of fire arrival
at the location of fatal exposure
(possible when location of fatal
exposure is known and isochrones of
the fire event available).
e.g. 15:00
Blank: no isochrones or location of fatal exposure
available
Isochrones fire direction Direction of fire spread at location of
fatal exposure
e.g. SW
Blank: no isochrones or location of fatal exposure
available
Estimated rate of fire
spread (km/hr)
Estimated rate of fire spread (km/hr)
at location of fatal exposure.
Number
Blank: no isochrones or location of fatal exposure
available
Intensity coded (from
Byram)
Intensity categories 1 = 0-500 kW/m
2 = 501-4000 kW/m
3 = 4001-20000 kW/m
4 = 20001-60000 kW/m
5 > 60000 kW/m
6 = Unknown
NCAS version The National Carbon Accounting
System (NCAS) Forest/Non-forest
dataset version.
Number
Blank: no forest layer or location of fatal exposure
available
NCAS tile The National Carbon Accounting
System (NCAS) Forest/Non-forest tile
name.
Number
Blank: no forest layer or location of fatal exposure
available
NCAS year The National Carbon Accounting
System (NCAS) Forest/Non-forest
year of tile.
Number
Blank: no forest layer or location of fatal exposure
available
NCAS distance to forest
(km)
Distance from closest part of the
forest to location of fatal exposure in
a straight line distance.
Number
Blank: no forest layer or location of fatal exposure
available
NCAS distance to forest
in fire direction (km)
Distance to closest part of forest and
closest straight line distance to
location of fatal exposure in the
direction of the approaching fire
front.
Number
Blank: no forest layer or location of fatal exposure
available
NCAS fraction forest
within 100m
Calculation of fraction of forest
around location of fatal exposure
(100m buffer around the location of
fatal exposure).
Number
Blank: no forest layer or location of fatal exposure
available
Comments on distance
to fire/forest
Description of distance to forest and
fire.
Text
e.g. No isochrones, no location, outside of
isochrones
Blank: Fire isochrones and forest data available for
location of fatal exposure
Comments Description of the event and
circumstances leading up to the
fatality (from Risk frontiers/ AFAC
dataset, Royal Commission report,
media reports or inquest findings).
Text
2009 VIC BUSHFIRE CIVILIAN FATALITIES TABLE
(see Appendix3)

87
OBJECT TABLE
FIELD NAME DESCRIPTION VALUES
Object Code Unique object identification code. Format xnnnn, e.g. V1123
x=’H’ for object type ‘house’
x=’V’ for object type ‘vehicle’
x=’O’ for object type ‘other’
Incident Code Identifies the incident that this object is
associated with. Provides link to Incident
table.
e.g. I0211
Object Type Identifies the type of object. house
vehicle
other object
GIS object Identifies the name of the spatial object that
gives the location of the object. Provides link
to GIS Object Inventory table.
e.g. H0254
Final Status Indicates the status of the object. damaged
destroyed
untouched
unknown
NA
Used as shelter Indicates whether the object was used for
shelter.
yes/no/unknown
HOUSE TABLE
FIELD NAME DESCRIPTION VALUES
House Object Code Unique house identification code. Provides
link to Object table.
Hnnnn, e.g. H0567
Address Address of house. Text
Construction type Construction type of house. e.g. single story brick home,
with a second level made of
timber attached to the rear
half of the home
Construction year Year house was constructed. e.g. 01/01/1976
Damage Process prior to ignition Process by which house was damaged prior to
ignition, if known.
e.g. radiant heat, wind, tree
impact
Rate of loss of tenability Description of the loss of tenability process. Text
Loss of power Indicates whether power supply to house was
lost.
yes/no/unknown
Time of loss of power Time at which power supply to house was
lost.
e.g. 23/01/1982 3:45PM
Loss of water Indicates whether water supply to house was
lost.
yes/no/unknown
Time of loss of water Time at which water supply to house was lost. e.g. 23/01/1982 3:45PM
Description of house and
surrounds
Free text containing relevant information
about house and surrounds, e.g. defend-
ability.
Text

88
VEHICLE TABLE
FIELD NAME DESCRIPTION VALUES
Vehicle Object Code Unique vehicle identification code. Provides
link to Object table.
Vnnnn, e.g. V0237
Vehicle detail Describes vehicle, i.e. make, model, type, age. e.g. Holden Commodore 1988
Context of entrapment Description of how person became entrapped
in car.
Text
Description vehicle journey origin Description of where vehicle was travelling
from.
Text
GIS vehicle origin Identifies the name of the spatial object that
gives the location of where vehicle was
travelling from. Provides link to GIS Object
Inventory table.
e.g. H0030, V0003origin
Description vehicle journey
intended destination
Description of where vehicle was travelling
to.
Text
GIS vehicle destination Identifies the name of the spatial object that
gives the location of where vehicle was
travelling to. Provides link to GIS Object
Inventory table.
e.g. H0050, V0003destination
Description of vehicle and
surrounds
Free text containing relevant information
about vehicle and surrounds.
Text
OTHER OBJECT TABLE
FIELD NAME DESCRIPTION VALUES
Other Object Object Code Unique other object identification code.
Provides link to Object table.
Onnnn, e.g. O5237
Description Describes what the object is and any other
relevant information about its role in the
incident.
Text
GIS OBJECT INVENTORY TABLE
FIELD NAME DESCRIPTION VALUES
GIS Object Code Unique spatial object identification code.
Provides link to object names in spatial files.
Also attributes to records in the Fatality,
Vehicle and Object tables.
Format xnnnn, e.g. V1123
X=’F’ for fatalities
x=’H’ for object type ‘house’
x=’V’ for object type ‘vehicle’
x=’O’ for object type ‘other’
Comments Free text containing information relevant to
GIS object, e.g. how it was created.
Text
e.g. Created from aerial
imagery, created using Google
Earth
Confidence in GIS location An estimate is made of the spatial accuracy of
the object. This field shows the possible
margin of error in this estimate in metres.
Number, e.g. 50

89
Appendix 3 – Coding Scheme 2009 Victorian bushfires
A new coding scheme was developed for the 2009 civilian fatalities directly impacted by the bushfire (n168)
and include information on:
• Preparation prior to the 7th of February 2009 (well, some, none, unknown),
• Preparation on the day (well, some, none, unknown),
• Activity in the last few hours before fatality,
• Intended fire plan,
• Time when people carried out their first action.
Prior preparation – (prior to the 7th
of February 2009) (from O’Neil and Handmer 1010).
Code Description
1 Well prepared = an independent water supply (dam, tank, pool or creek). If the water supply is
not gravity fed then there should be evidence of an electric pump connected to a generator or
a diesel / petrol pump, evidence of fuel management (creation of a defendable space) and/or
appropriate clothing, equipment (a minimum of buckets and mops) (as the evidences of
appropriate clothing and equipment is subjected to information available in Royal commission
report22)
2 Some preparation = evidence of some fuel management, planning an independent water
supply (water to be stored in buckets around the property), appropriate clothing, equipment
(a minimum of buckets and mops),
3 None
4 Unclear
Preparation on the day (7th
of February 2009)
Code Description
1 Well (Prior to 1.30)– Getting equipment set up, last minute fuel management, filling water,
checking equipment, etc.
2 Some – (After 1.30) – filling water, blocking downpipes. Not well informed of fire’s progress.
3 None
4 Unclear
22 http://www.royalcommission.vic.gov.au/commission-reports/final-report (accessed 30/10/2012)

90
Activity in the last few hours before fatality
Code Description
1 Defending
2 Defending then evacuating to another home or shelter on or nearby the property and
defending
3 Defending (one or more properties) then moving to another home or shelter on or nearby the
property and sheltering
4 Defending (one or more properties) then moving to shelter in a parked car
5 Waiting to see if defend or evacuate
6 Moving around community actively seeking information on what to do
7 Preparing to evacuate
8 Waiting for a trigger to evacuate
9 No prior action – in denial or too tired
10 No prior action - unaware
11 Sheltering – includes those sheltering from heat
12 Defending then sheltering
Intended fire plan
Code Description
1 Stay and defend
2 Evacuate to a friends and assist with defence
3 Stay and defend but leave if threatened
4 Leave early
5 Leave when threatened
6 Wait and see what bushfire is like before deciding to
stay or leave / plan unclear
7 Shelter passively at home
8 Shelter passively at a friends or community refuge
9 No plan/ unclear if they had a plan
10 Defending and sheltering
11 Evacuating people or animals and intending to return
to defend
What time started action that lead to fatality?
Time, indication of time (e.g. morning, afternoon), unknown


92
CONTACT US
t 1300 363 400
+61 3 9545 2176
w www.csiro.au
YOUR CSIRO
Australia is founding its future on
science and innovation. Its national
science agency, CSIRO, is a powerhouse
of ideas, technologies and skills for
building prosperity, growth, health and
sustainability. It serves governments,
industries, business and communities
across the nation.