Embed Size (px)
Citation preview

Life Planning for Retirement
LIFE@WesternCarolina
Life Planning for Retirement
LIFE@WesternCarolinaLIFE@WesternCarolina is a lifelong education program specifically designed to provide learning opportunities to adults ages 50 and over. In this program, learners will participate in non-credit educational programs led by current and retired WCU faculty and staff and other educators from the regionfrom the region.
life.wcu.edu

Life Planning for RetirementLife Planning for Retirement
Menu© 2003 – 2017 FMT Solutions, LLC

Life Planning for RetirementLife Planning for Retirement
We believe that Retirementshould mean Independence,should mean Independence, Dignity and the ability to Live Life on your own termsLife on your own terms.


Retirement Needs & Expenses
To put it another way… Your Money Today Will Likely Buy Less Tomorrow
1913 1963 2015
Retirement Needs & Expenses
1913 1963 2015
$0 09 W th f Milk 1913 2015
$0.09 = Quart of milk $0.09 = 1 Small Glass of milk $0.09 = 7 Tablespoons of milk
•In US dollars. Source for 1913 and 1963: Historical Statistics of the United States: Colonial Times to 1970/U.S. Dept. of Commerce. Source for 2014: United States Department of Labor, Bureau of Labor Statistics, Economic Statistics, Consumer Price Index–Average Price Data.
$0.09 Worth of Milk 1913-2015

Retirement Needs & ExpensesRetirement Needs & Expenses

Page 3 1Retirement Roadblocks & Mistakes
Introduction
Page 3-1Retirement Roadblocks & Mistakes
Below is a list of 10 retirement planning roadblocks:
1. Don’t define how they wish to live their retirement years
2. Don’t set financial goals to achieve their lifestyle goals
3. Don’t make a commitment to be financially successful - measure and monitorD ’t d t th l b t l fi• Don’t educate themselves about personal finance
• Don’t take a financial inventory – cash flow and net worth
• Don’t manage credit wisely
• Don’t seek professional assistance
4. Don’t invest early in life or on a regular basis – Retirement planning doesn’t stop at retirement
Menu
5. Don’t use tax laws to their advantage© 2003 – 2017 FMT Solutions, LLC

Page 3 1Retirement Roadblocks & Mistakes
Introduction
Page 3-1Retirement Roadblocks & Mistakes
6. Don’t allocate assets properly and adjust as needed
7. Don’t plan for the unexpected
8. Don’t take full advantage of employer benefit plans and don’t choose the best way to take money out of their retirement plan
9. Don’t properly plan for their estate p p y p
10. Don’t Take Action - create a comprehensive financial plan and implement it
Menu© 2003 – 2017 FMT Solutions, LLC

Retirement Roadblocks & Mistakes
Income Expenses
Retirement Roadblocks & Mistakes

Retirement Roadblocks & Mistakes
Use Cash Flow to Your AdvantagePay Yourself FIRST
Retirement Roadblocks & Mistakes
y
Pay Yourself FirstM thl I $4 000• Monthly Income $4,000
• Savings (Hitting Your Target) $1,000• Available for Living Expenses $3,000
Pay Expenses First• Monthly Income $4,000
Li i E (C U d) $3 500• Living Expenses (Creep Upward) $3,500• Available for Savings $ 500
If lf l t lf lIf you pay yourself last – you pay yourself less

Simple Interest

Compounding

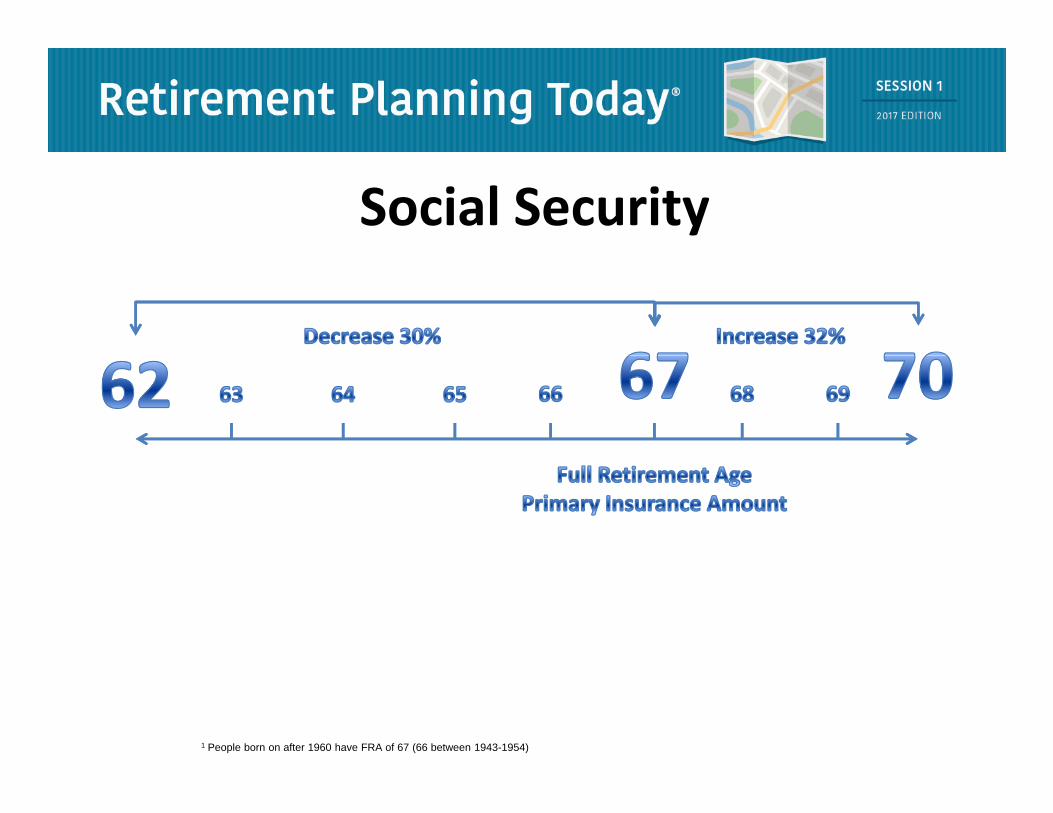
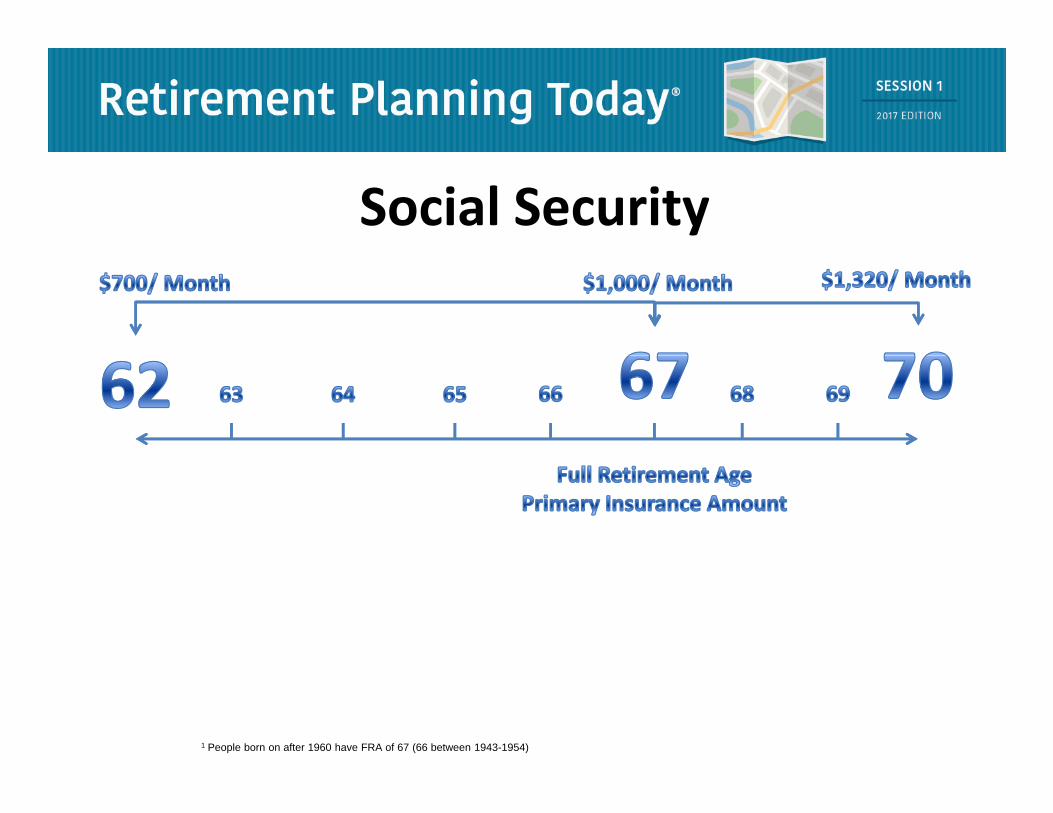
Social Security
1 People born on after 1960 have FRA of 67 (66 between 1943-1954)
Social Security
1 People born on after 1960 have FRA of 67 (66 between 1943-1954)

The Retirement Income GapTotal Spending Needs
Social Security Other Sources

Page 4 11Retirement Income Sources
IRA to Roth IRA ConversionsPage 4-11Retirement Income Sources
TO CONVERT OR NOT TO CONVERT?What if you have IRA assets and want Roth Assets instead?
THE TRADE-OFFTHE TRADE OFFIf you convert your Traditional IRA to a Roth IRA, you:
– Con- Pay income taxes, at your current tax rate– Pro- Receive tax-free withdrawals during retirementPro Receive tax free withdrawals during retirement– Pro- Have no required minimum distributions. – Pro- Creates income flexibility in retirement
Page 4 11Retirement Income Sources Page 4-11Retirement Income Sources
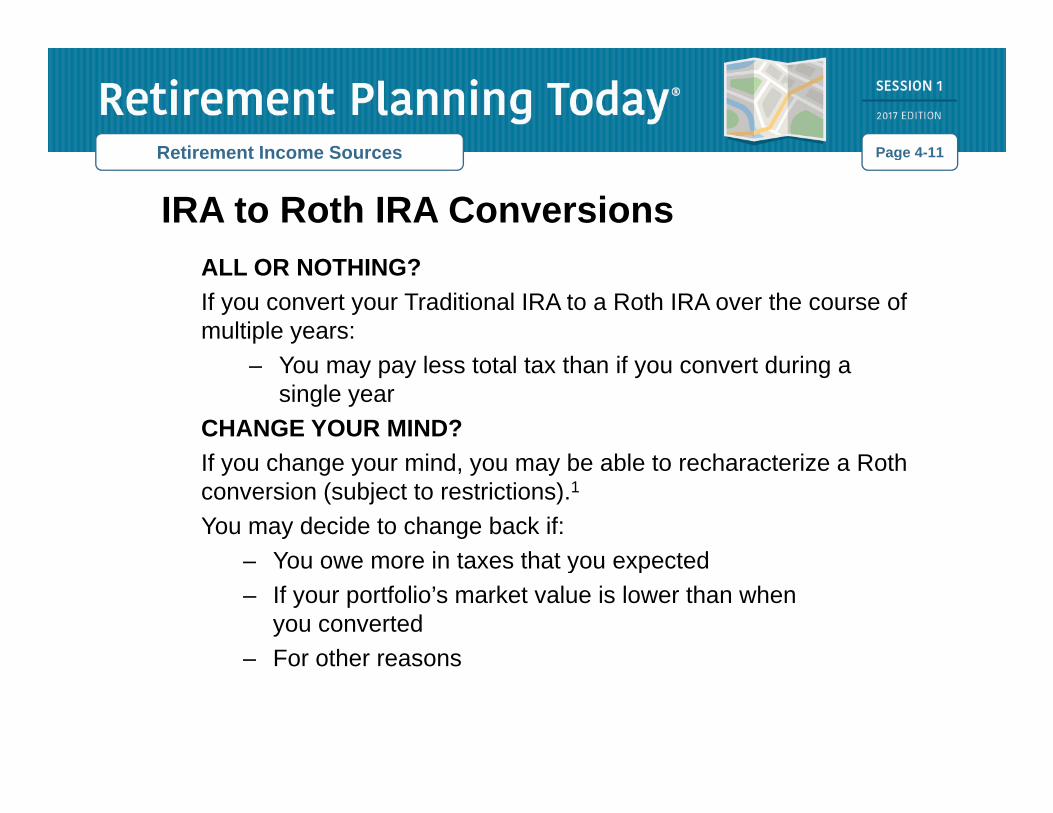
IRA to Roth IRA ConversionsALL OR NOTHING?If you convert your Traditional IRA to a Roth IRA over the course of multiple years:
– You may pay less total tax than if you convert during asingle year
CHANGE YOUR MIND?If h i d b bl t h t i R thIf you change your mind, you may be able to recharacterize a Roth conversion (subject to restrictions).1
You may decide to change back if:You owe more in taxes that you expected– You owe more in taxes that you expected
– If your portfolio’s market value is lower than when you converted
– For other reasonsFor other reasons

Page 4 11Retirement Income Sources Page 4-11Retirement Income Sources
IRA to Roth IRA Conversions
• 3 Questions to ask before completing a Roth Conversion
• 1. When – When will the money be needed – the longer the time horizon the better usually (10-15 years)
• 2. What – Consider what the future tax rates might be for you ( id h i i )(consider changes in income)
• 3. Where – Where will the money to pay the tax come from (Generally better to not pay taxes from amount converted)(Generally better to not pay taxes from amount converted)

Page 4 14Retirement Income Sources
Investment Accounts
Page 4-14Retirement Income Sources
Investment Accounts (A.K.A. Taxable Account / After-Tax Account)
Investments held outside of a retirement plan often provide an important p p psource of retirement income.
A few examples of investment types include bonds, mutual funds, certificates of deposit and others. As you approach and begin your retirement, your financialdeposit and others. As you approach and begin your retirement, your financial circumstances will change. You should consider making adjustments to your investment mix to reflect these changes.
Menu© 2003 – 2017 FMT Solutions, LLC
Page 4 14Retirement Income Sources
Investment Accounts
Page 4-14Retirement Income Sources
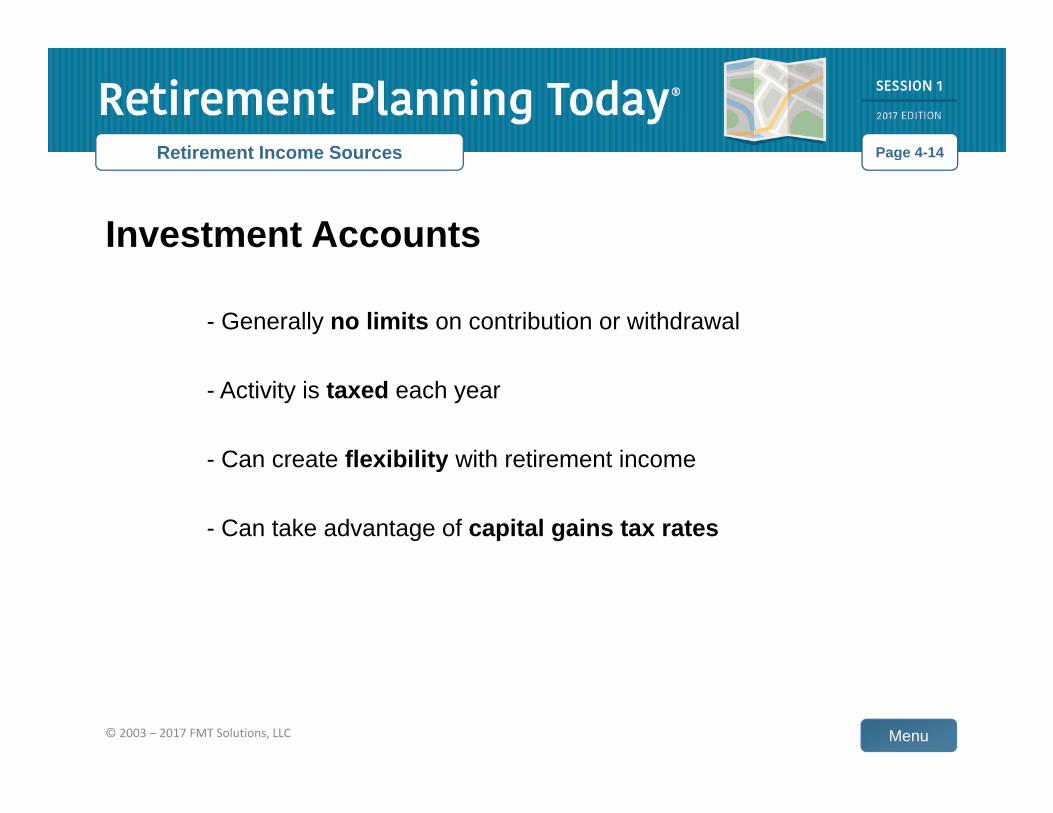
- Generally no limits on contribution or withdrawal
- Activity is taxed each year
Can create flexibility with retirement income- Can create flexibility with retirement income
- Can take advantage of capital gains tax rates
Menu© 2003 – 2017 FMT Solutions, LLC

Page 4 15Retirement Income Sources
Other Personal Retirement Sources
Page 4-15Retirement Income Sources
Factors to Consider
– Reliability
– Flexibility
– Liquidity
1 It is not recommended that you tap into your home equity to invest. Investors who must rely on investment returns to make their home equity or mortgage payments could end up defaulting on their home loans if their investments decline and they are unable to meet their monthly payments.

Saving For Retirement to Provide Income
• Save Consistently• The ‘new’ opportunity and responsibility. Start where you are.
• Save more as income grows• Where? Workplace Retirement Plan, IRA, After-Tax
• Monitor Progress• Cash Flow and Financial Statement
Page 6 3Investments
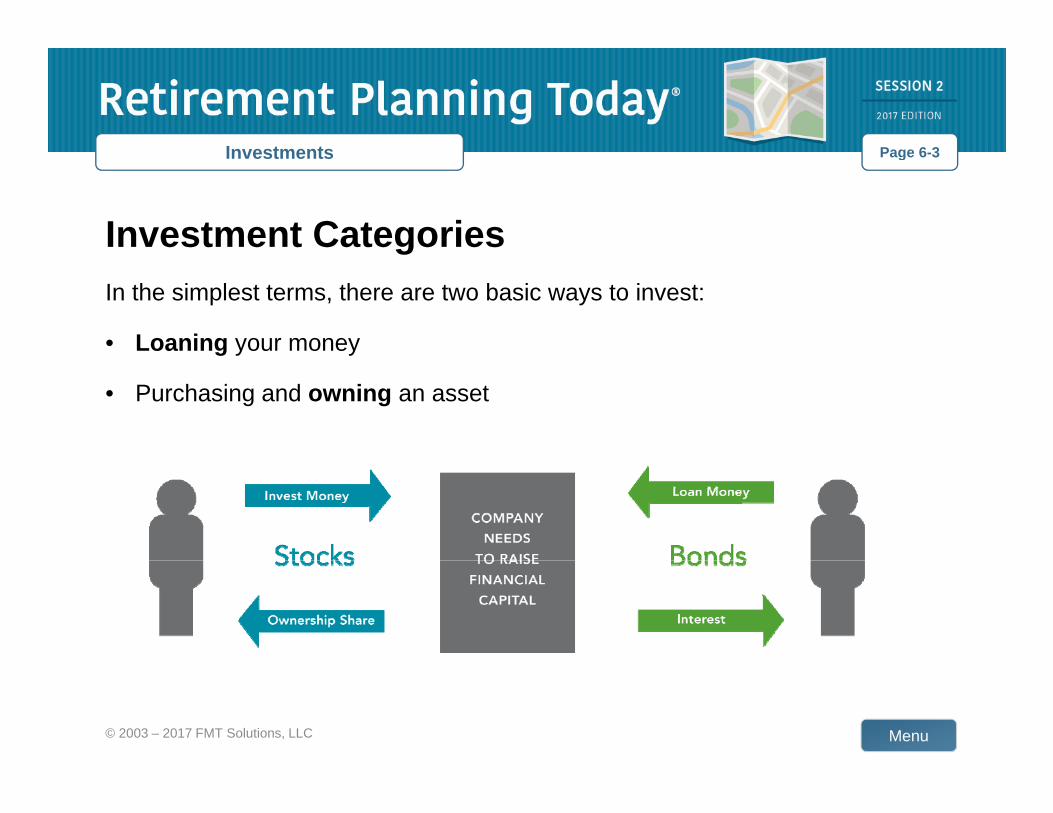
Investment Categories
Page 6-3Investments
gIn the simplest terms, there are two basic ways to invest:
• Loaning your moneyg y y
• Purchasing and owning an asset
Menu© 2003 – 2017 FMT Solutions, LLC

Investments
What Affects a Stock’s Current Price?Investments
All A company’s All Available Information
p yequity, its prospects for future earnings, and
Priceg
perceived risk
Given all information, a stock’s current price reflects aggregate expectations about risk and return.
Investments
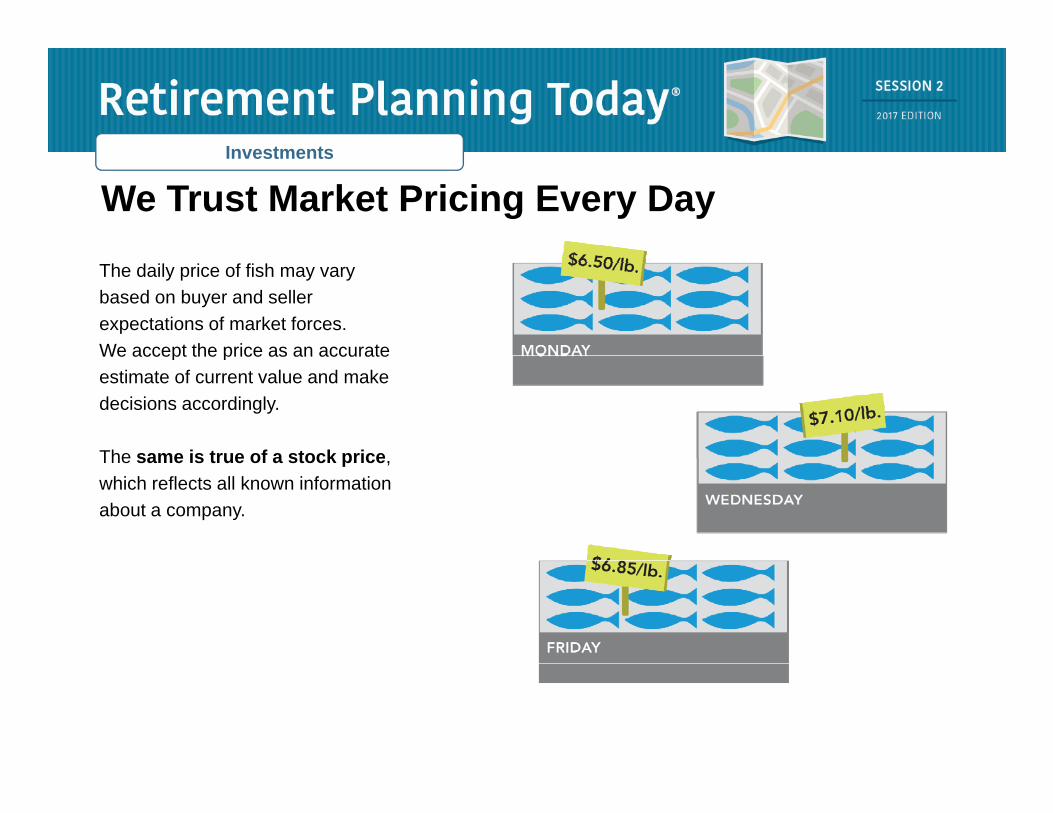
We Trust Market Pricing Every DayInvestments
The daily price of fish may vary based on buyer and seller expectations of market forces. We accept the price as an accurateWe accept the price as an accurate estimate of current value and make decisions accordingly.
The same is true of a stock priceThe same is true of a stock price, which reflects all known information about a company.
InvestmentsInvestments
Investing means taking risks.
InvestmentsInvestments
Notinvesting means taking risks,
tootoo.

InvestmentsInvestments
Ten Considerations to Help You Manage Investment RiskInvestment Risk
Investments
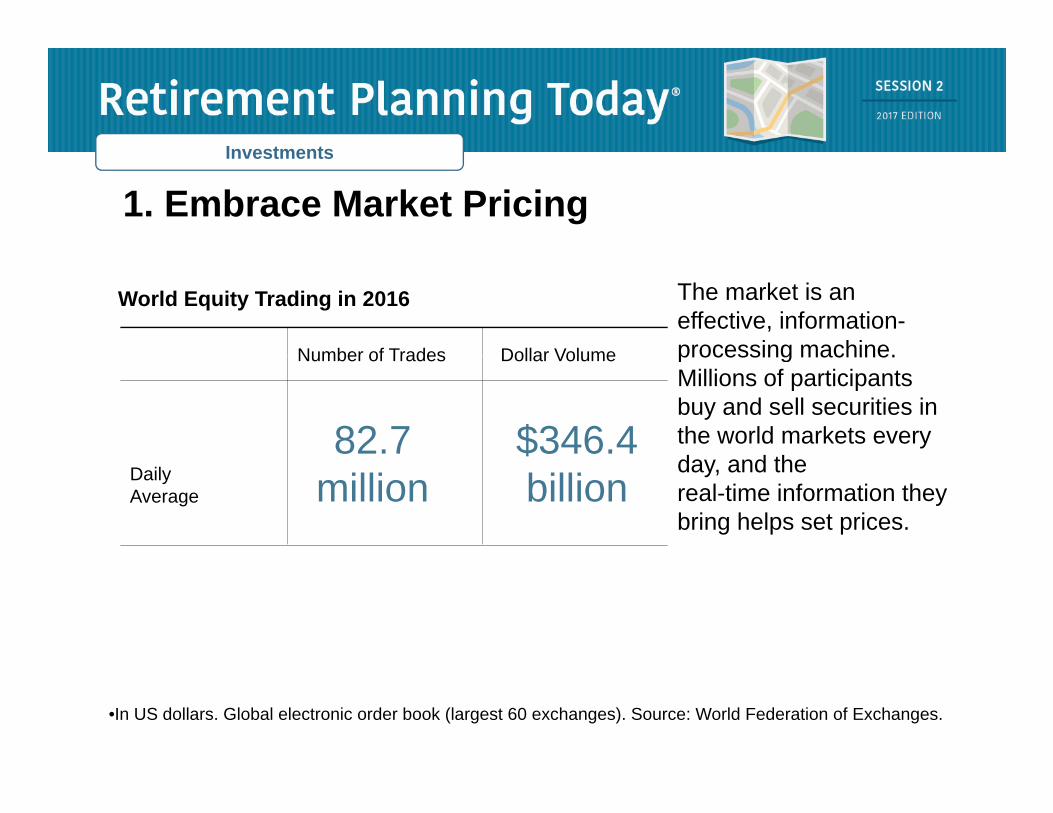
1. Embrace Market PricingInvestments
The market is an effective, information-processing machine.
World Equity Trading in 2016
Number of Trades Dollar Volume processing machine. Millions of participants buy and sell securities in the world markets every d d th
Number of Trades Dollar Volume
82.7 $346.4 day, and the real-time information they bring helps set prices.
DailyAverage million billion
•In US dollars. Global electronic order book (largest 60 exchanges). Source: World Federation of Exchanges.
Investments
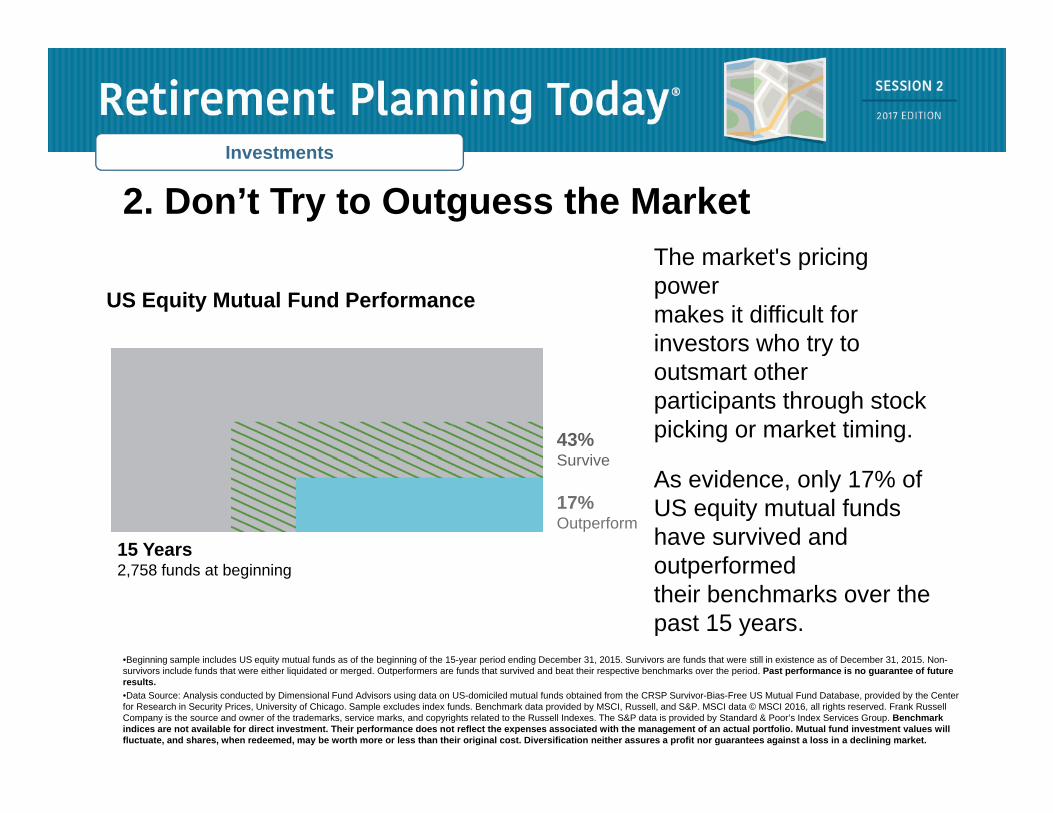
2. Don’t Try to Outguess the MarketThe market's pricing
Investments
The market's pricing power makes it difficult for investors who try to
US Equity Mutual Fund Performance
youtsmart other participants through stock picking or market timing. 43%
SurviveAs evidence, only 17% of US equity mutual funds have survived and
t f d
Survive
17%Outperform
15 Years
•Beginning sample includes US equity mutual funds as of the beginning of the 15-year period ending December 31, 2015. Survivors are funds that were still in existence as of December 31, 2015. Non-
outperformed their benchmarks over the past 15 years.
2,758 funds at beginning
g g p q y g g y p g , ,survivors include funds that were either liquidated or merged. Outperformers are funds that survived and beat their respective benchmarks over the period. Past performance is no guarantee of future results. •Data Source: Analysis conducted by Dimensional Fund Advisors using data on US-domiciled mutual funds obtained from the CRSP Survivor-Bias-Free US Mutual Fund Database, provided by the Center for Research in Security Prices, University of Chicago. Sample excludes index funds. Benchmark data provided by MSCI, Russell, and S&P. MSCI data © MSCI 2016, all rights reserved. Frank Russell Company is the source and owner of the trademarks, service marks, and copyrights related to the Russell Indexes. The S&P data is provided by Standard & Poor’s Index Services Group. Benchmark indices are not available for direct investment. Their performance does not reflect the expenses associated with the management of an actual portfolio. Mutual fund investment values will fluctuate, and shares, when redeemed, may be worth more or less than their original cost. Diversification neither assures a profit nor guarantees against a loss in a declining market.
Investments
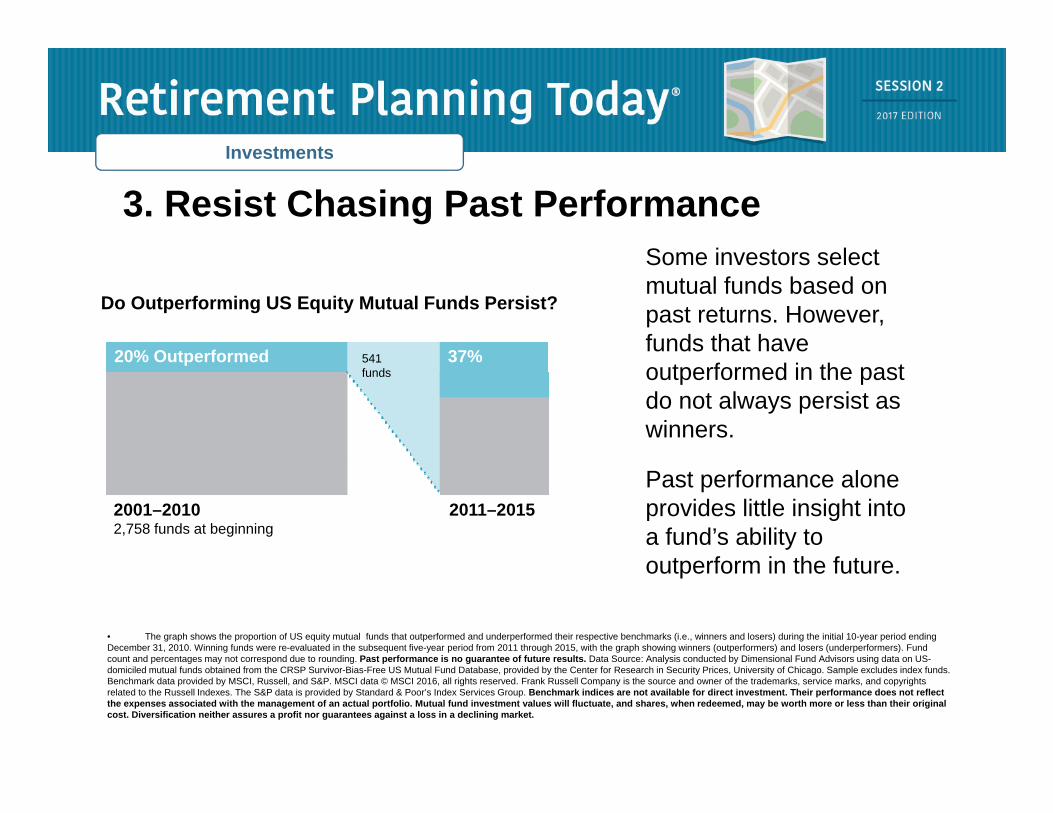
3. Resist Chasing Past PerformanceSome investors select
Investments
Some investors select mutual funds based on past returns. However, funds that have
Do Outperforming US Equity Mutual Funds Persist?
37%20% Outperformed 541outperformed in the past do not always persist as winners.
37%20% Outperformed 541funds
Past performance alone provides little insight into a fund’s ability to
t f i th f t
2001–20102,758 funds at beginning
2011–2015
outperform in the future.
• The graph shows the proportion of US equity mutual funds that outperformed and underperformed their respective benchmarks (i.e., winners and losers) during the initial 10-year period ending December 31, 2010. Winning funds were re-evaluated in the subsequent five-year period from 2011 through 2015, with the graph showing winners (outperformers) and losers (underperformers). Fund count and percentages may not correspond due to rounding. Past performance is no guarantee of future results. Data Source: Analysis conducted by Dimensional Fund Advisors using data on US-p g y p g p g y y gdomiciled mutual funds obtained from the CRSP Survivor-Bias-Free US Mutual Fund Database, provided by the Center for Research in Security Prices, University of Chicago. Sample excludes index funds. Benchmark data provided by MSCI, Russell, and S&P. MSCI data © MSCI 2016, all rights reserved. Frank Russell Company is the source and owner of the trademarks, service marks, and copyrights related to the Russell Indexes. The S&P data is provided by Standard & Poor’s Index Services Group. Benchmark indices are not available for direct investment. Their performance does not reflect the expenses associated with the management of an actual portfolio. Mutual fund investment values will fluctuate, and shares, when redeemed, may be worth more or less than their original cost. Diversification neither assures a profit nor guarantees against a loss in a declining market.
Investments
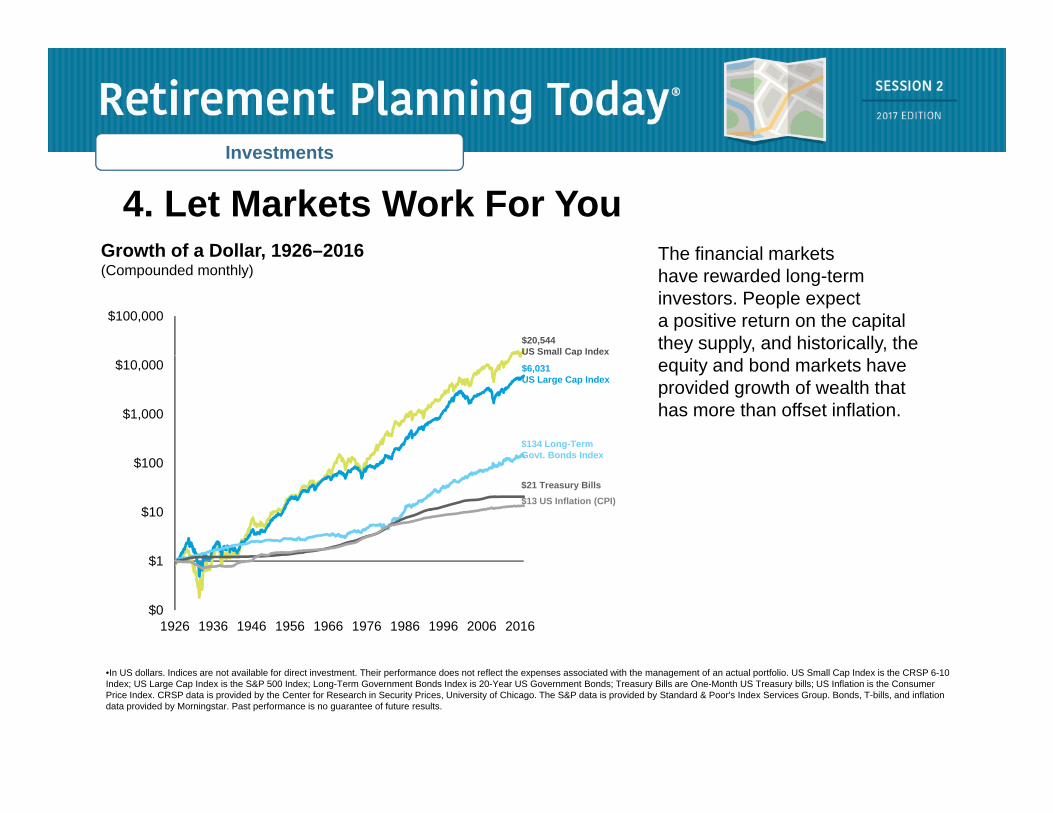
The financial marketsGrowth of a Dollar 1926–2016
4. Let Markets Work For YouInvestments
The financial markets have rewarded long-term investors. People expect a positive return on the capital they supply, and historically, the
Growth of a Dollar, 1926 2016(Compounded monthly)
$100,000
$20,544 US Small Cap Index
equity and bond markets have provided growth of wealth that has more than offset inflation.
$100
$1,000
$10,000p
$6,031 US Large Cap Index
$134 Long-TermGovt. Bonds Index
$1
$10
$100Govt. Bonds Index
$21 Treasury Bills$13 US Inflation (CPI)
$0
$1
1926 1936 1946 1956 1966 1976 1986 1996 2006 2016
•In US dollars. Indices are not available for direct investment. Their performance does not reflect the expenses associated with the management of an actual portfolio. US Small Cap Index is the CRSP 6-10 Index; US Large Cap Index is the S&P 500 Index; Long-Term Government Bonds Index is 20-Year US Government Bonds; Treasury Bills are One-Month US Treasury bills; US Inflation is the Consumer Price Index. CRSP data is provided by the Center for Research in Security Prices, University of Chicago. The S&P data is provided by Standard & Poor's Index Services Group. Bonds, T-bills, and inflation data provided by Morningstar. Past performance is no guarantee of future results.

Investments
•Academic research has
5. Consider the Long-Term Drivers of ReturnDimensions of Expected Returns
Investments
•Academic research has identified these equity and fixed income dimensions, which point to differences in expected returns.
Dimensions of Expected Returns
Market Equity premium—stocks vs. bonds
These dimensions are pervasive, persistent, and robust and can be pursued in cost-effective portfolios.
Company Size Small cap premium—small vs. large companies
Relative PriceEQ
UIT
IES
in cost effective portfolios.Value premium—value vs. growth companies
ProfitabilityProfitability premium—high vs. low profitability companies
Term Term premium—longer vs. shorter maturity bonds
Credit XE
D IN
CO
ME
•Diversification does not eliminate the risk of market loss. Relative price is measured by the price-to-book ratio; value stocks are those with lower price-to-book ratios. Profitability is a measure of current profitability, based on information from individual companies’ income statements.
Credit premium—lower vs. higher credit quality bondsFIX

Investments
Home Market Global Market
6. Practice Smart DiversificationInvestments
•Diversification helps reduce risks that have no expected
Home MarketIndex Portfolio
Global MarketIndex Portfolio
return, but diversifying within your home market is not enough. Global diversification can broaden your investment universeS&P 500 I d MSCI ACWI your investment universe.S&P 500 Index
1 country, 500 stocksMSCI ACWI
Investable Market Index (IMI)46 countries, 8,716 stocks
• Number of holdings and countries for the S&P 500 Index and MSCI ACWI (All Country World Index) Investable Market Index as of December 31, 2015. Indices are not available for direct investment, and their performance does not reflect the expenses associated with the management of an actual portfolio. International investing involves special risks such as currency fluctuation and political instability. Investing in emerging markets may accentuate these risks. Diversification neither ensures a profit nor guarantees against loss in a declining market. Past performance is not a guarantee of future results. The S&P data is provided by Standard & Poor`s Index Services Group. MSCI data © MSCI 2016, all rights reserved.

Investments
Think of Building Your Portfolio as Choosing Building Blocks
Investments
Building Blocks
For illustrative purposes only.

Investments
Choosing the Appropriate Building BlocksInvestments
For illustrative purposes only.
Investments
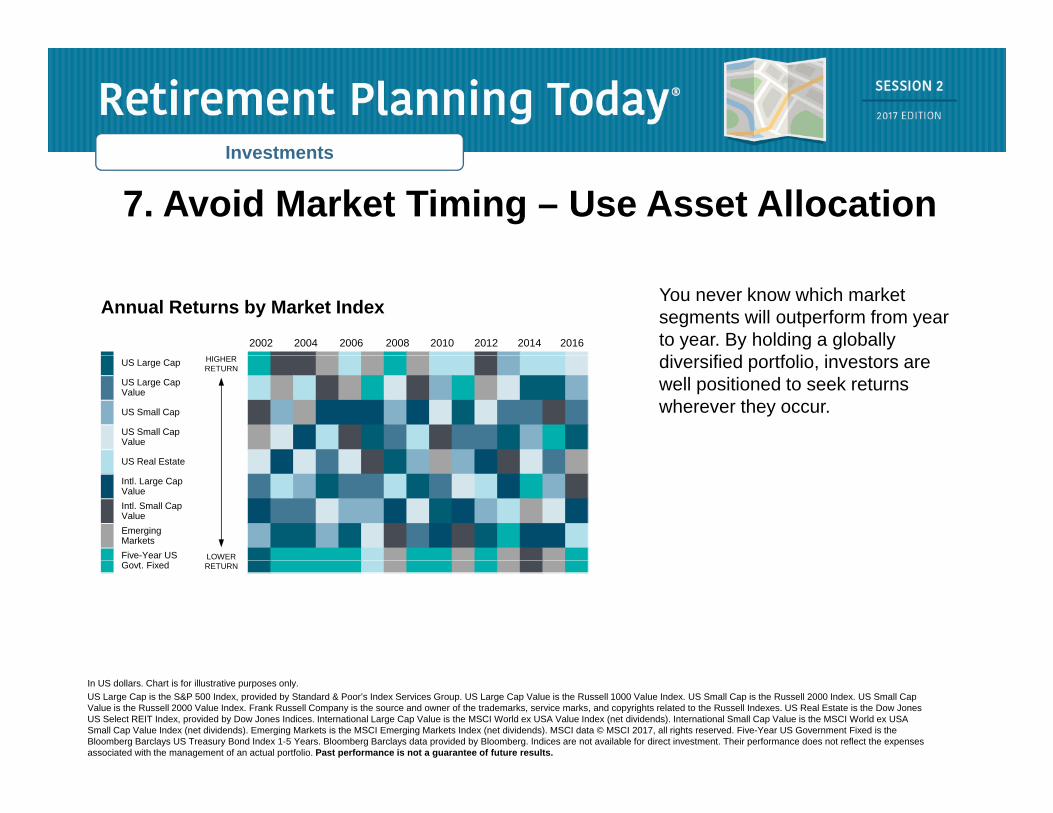
7. Avoid Market Timing – Use Asset AllocationInvestments
You never know which market segments will outperform from year to year. By holding a globally di ifi d tf li i t
Annual Returns by Market Index
2002 2004 2006 2008 2010 2012 2014 2016
diversified portfolio, investors are well positioned to seek returns wherever they occur.
US Large Cap
US Large CapValue
US Small Cap
US Small CapValue
US R l E
HIGHERRETURN
US Real Estate
Emerging Markets
LOWER
Intl. Large CapValueIntl. Small CapValue
Five-Year US RETURNGovt. Fixed
In US dollars. Chart is for illustrative purposes only. US Large Cap is the S&P 500 Index, provided by Standard & Poor’s Index Services Group. US Large Cap Value is the Russell 1000 Value Index. US Small Cap is the Russell 2000 Index. US Small Cap Value is the Russell 2000 Value Index. Frank Russell Company is the source and owner of the trademarks, service marks, and copyrights related to the Russell Indexes. US Real Estate is the Dow Jones US Select REIT Index, provided by Dow Jones Indices. International Large Cap Value is the MSCI World ex USA Value Index (net dividends). International Small Cap Value is the MSCI World ex USA Small Cap Value Index (net dividends). Emerging Markets is the MSCI Emerging Markets Index (net dividends). MSCI data © MSCI 2017, all rights reserved. Five-Year US Government Fixed is the Bloomberg Barclays US Treasury Bond Index 1-5 Years. Bloomberg Barclays data provided by Bloomberg. Indices are not available for direct investment. Their performance does not reflect the expenses associated with the management of an actual portfolio. Past performance is not a guarantee of future results.

Investments
Many people struggle to separateAvoid Reactive Investing
8. Manage Your EmotionsInvestments
Many people struggle to separate their emotions from investing. Markets go up and down.
Reacting to current market
Avoid Reactive Investing
Reacting to current market conditions may lead to making poor decisions at the worst possible times
NervousnessOptimism
Elation
Optimism
NervousnessOptimism
Fear
•For illustrative purposes only.


InvestmentsInvestments
“The dominant determinant of real-life portfolio returns isn’t investment performance. It’s investor behavior.”investor behavior.
- Nick Murray

Investments
We Aren’t Wired for Disciplined InvestingInvestments
When people follow their p pnatural instincts, they tend to apply faulty reasoning to investing.


Investments
Daily market news and
9. Look Beyond the HeadlinesInvestments
Daily market news and commentary can challenge your investment discipline. p
Some messages stir anxiety about the futureanxiety about the future while others tempt you to chase the latest investment fad.
When tested, consider the source and maintain a long-term perspective
• For illustrative purposes only.

Investments
Markets Have Rewarded Long-Term InvestorsInvestments
Growth of a dollar—MSCI World Index (net dividends), 1970–2016
Euro zone debt crisis
S&P 500
Dotcom stock crash
Income tax rates rate
Dow drops 23% on Black Monday
BusinessWeek: “The Death of Equities”
Eurozone debt crisis
Subprime mortgage
crisis
Dotcom stock crash
Income tax rates rise
Dow drops 23% on Black Monday
BusinessWeek: “The Death of Equities” Brexit
$43
US home prices hit
S&P 500 down 46%
Hurricanes Katrina and Rita
9/11 terrorist attack
Y2K Scar
e
Russian financial
rate
Savings and loan crisis
US
Gold hits record highOil prices
quadruple
Arab oil embargo
$48
US home prices hit Hurricanes
9/11 terrorist attacks
Y2K Scare
Russian financial
rise
Savings and loan crisisGold hits
record highOil prices quadruple
Arab oil embargo
bottom
Fiscal cliff worries
Subprime mortgage crisis
and RitaIraq war begins
financial crisis
Asian currency
crisis
Iraq invades Kuwait
inflation at 13.5%
S&P 500 down 43%
1bottom
Fiscal cliff worries
S&P 500 down 46%
Katrina and Rita
Iraq war begins
financial crisis
Asian currency
crisis
Iraq invades Kuwait
US inflation at 13.5%S&P 500
down 43%
1970 1980 1990 2000 2010 2013
A disciplined investor looks beyond the
1970 1980 1990 2000 2010 2016
In US dollars. Indices are not available for direct investment. Their performance does not reflect the expenses associated with the management of an actual portfolio. Past performance is no guarantee of future results. MSCI data © MSCI 2017, all rights reserved.
concerns of today to the long-term growth potential of markets.

Investments
10. Focus on What You Can ControlInvestments
Decide if you want to be self-directed or if you want to work with a professional fi i l d i t tCreating an financial advisor to create a plan tailored to your personal financial needs while helping your focus on
Creating an investment plan to fit
your needs and risk tolerance
Structuring a portfolio with appropriate asset classes p g y
actions that add value.
Following these ten strategies can lead to a
pp p
Diversifying broadly
Reducing expenses and turnover
Minimizing taxes strategies can lead to a better investment experience.
Minimizing taxes
•Diversification does not eliminate the risk of market loss. There is no guarantee investment strategies will be successful. For illustrative purposes only.
Risk Management & Asset Protection
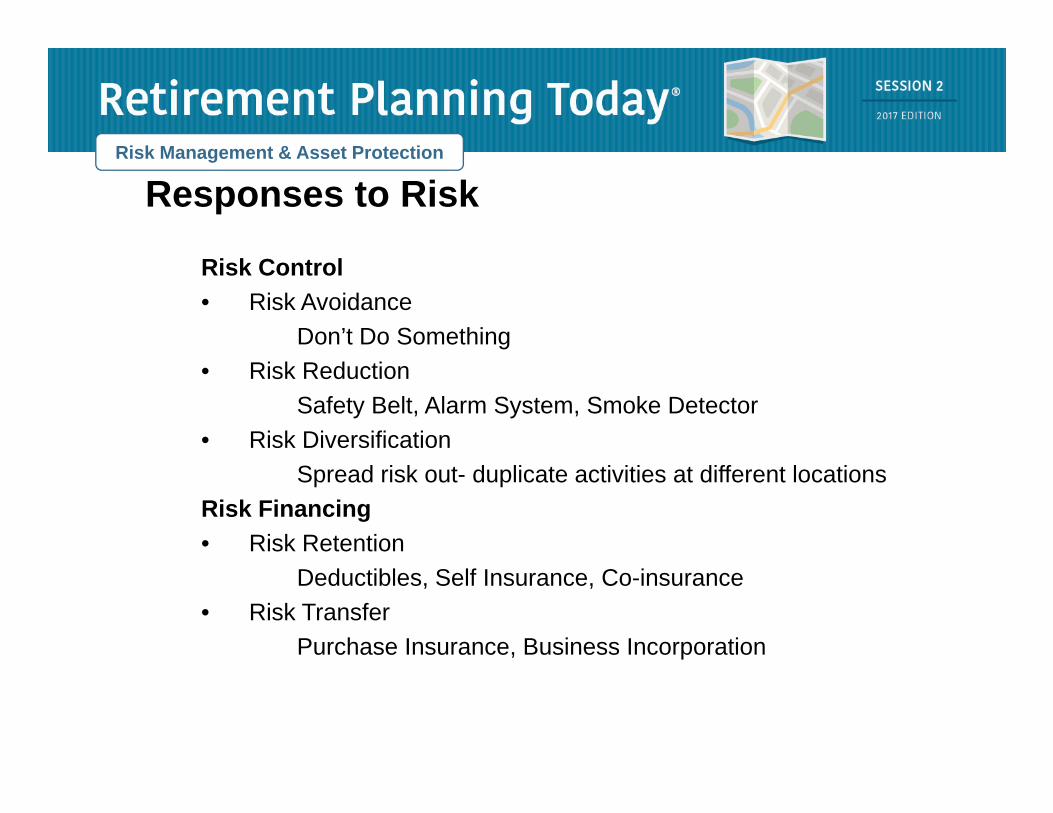
Responses to RiskRisk Management & Asset Protection
Risk Control• Risk Avoidance
Don’t Do Something • Risk Reduction
Safety Belt, Alarm System, Smoke Detector• Risk Diversification
Spread risk out- duplicate activities at different locationsRisk Financing• Risk Retention
Deductibles, Self Insurance, Co-insurance• Risk Transfer
Purchase Insurance, Business Incorporation

Risk Management & Asset Protection
Types of Risk Risk Management & Asset Protection
Speculative Risk• Chance of Loss• Chance of Gain
Pure Risk• Chance of Loss

Risk Management & Asset Protection
Parts of an Insurance ContractRisk Management & Asset Protection
• Declarations Page- States the person, property, and/or activity being insured and the parties of the agreement.
• Definitions- Explains key terms within the policy
• Insuring agreements- Describes the basic promises of the iinsurance company
• Exclusions- Spells out the circumstances when the insurer will not paynot pay
• Conditions- Spells out the duties and rights of both parties
Risk Management & Asset Protection Page 7 2
Property, Casualty, and Liability Risk Management & Asset Protection Page 7-2
• Types of property, casualty, and/or liability insurance
• Homeowners• Auto• Renters• Flood • Earthquake• Personal Liability
Risk Management & Asset Protection Page 7 2
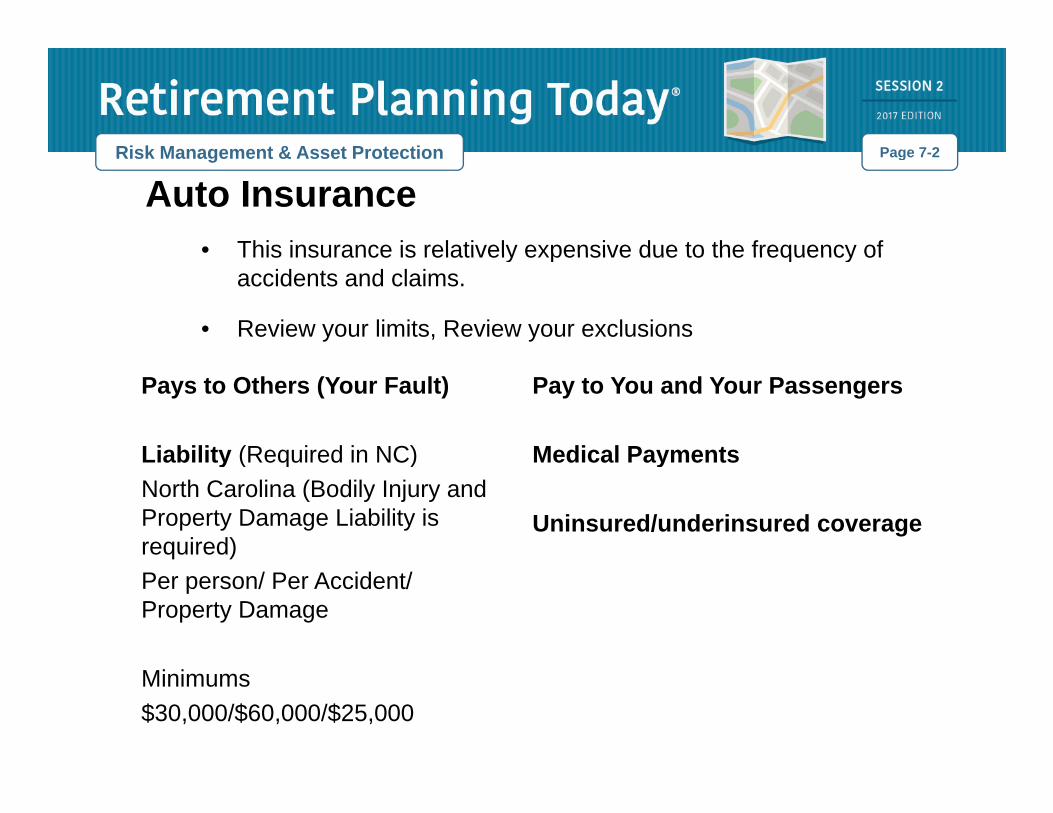
Auto Insurance• This insurance is relatively expensive due to the frequency of
Risk Management & Asset Protection Page 7-2
This insurance is relatively expensive due to the frequency of accidents and claims.
• Review your limits, Review your exclusions
Pays to Others (Your Fault)
Liability (Required in NC)
Pay to You and Your Passengers
Medical PaymentsLiability (Required in NC)North Carolina (Bodily Injury and Property Damage Liability is required)
Medical Payments
Uninsured/underinsured coverage
Per person/ Per Accident/ Property Damage
Minimums$30,000/$60,000/$25,000
Risk Management & Asset Protection Page 7 2
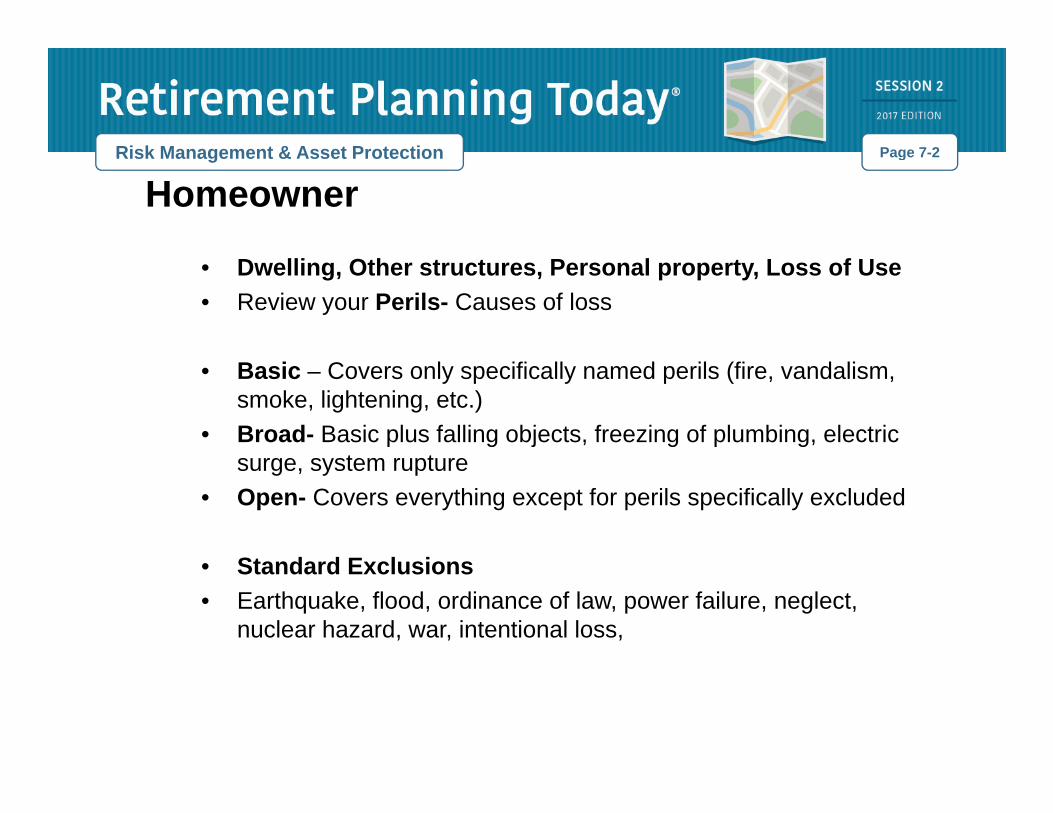
HomeownerRisk Management & Asset Protection Page 7-2
• Dwelling, Other structures, Personal property, Loss of Use• Review your Perils- Causes of loss
• Basic – Covers only specifically named perils (fire, vandalism, smoke, lightening, etc.)
• Broad- Basic plus falling objects, freezing of plumbing, electric t tsurge, system rupture
• Open- Covers everything except for perils specifically excluded
St d d E l i• Standard Exclusions• Earthquake, flood, ordinance of law, power failure, neglect,
nuclear hazard, war, intentional loss,

Risk Management & Asset Protection Page 7 2
Umbrella Liability Risk Management & Asset Protection Page 7-2
Auto Homeowner’s
Umbrella Umbrella U b e aLiability Up To$1,000,000
Liability Up To$1,000,000
Auto Base Liability $200,000
Homeowner’s Base Liability$300,000

Risk Management & Asset Protection
1035 Exchanges
Risk Management & Asset Protection
• Tax Free Exchange of certain life insurance and annuity contracts
Life for life
Or
Life for annuity
Or
Annuity for annuity
Note: Annuities are considered insurance products. Provides protection against superannuation
Risk Management
Cybersecurity and Identity Theft Protection
Risk Management
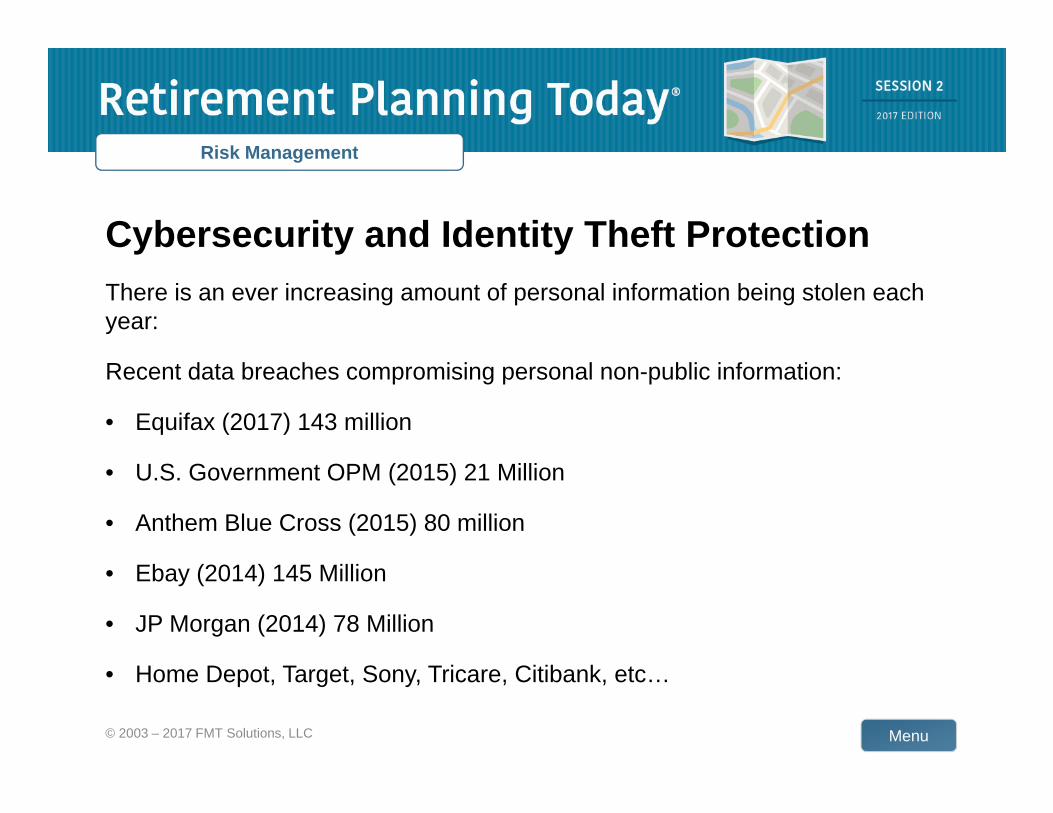
y y yThere is an ever increasing amount of personal information being stolen each year:
Recent data breaches compromising personal non-public information:
• Equifax (2017) 143 million
• U.S. Government OPM (2015) 21 Million
• Anthem Blue Cross (2015) 80 million
• Ebay (2014) 145 Million
• JP Morgan (2014) 78 Million
Menu
• Home Depot, Target, Sony, Tricare, Citibank, etc…
© 2003 – 2017 FMT Solutions, LLC
Risk Management
Cybersecurity and Identity Theft Protection
Risk Management
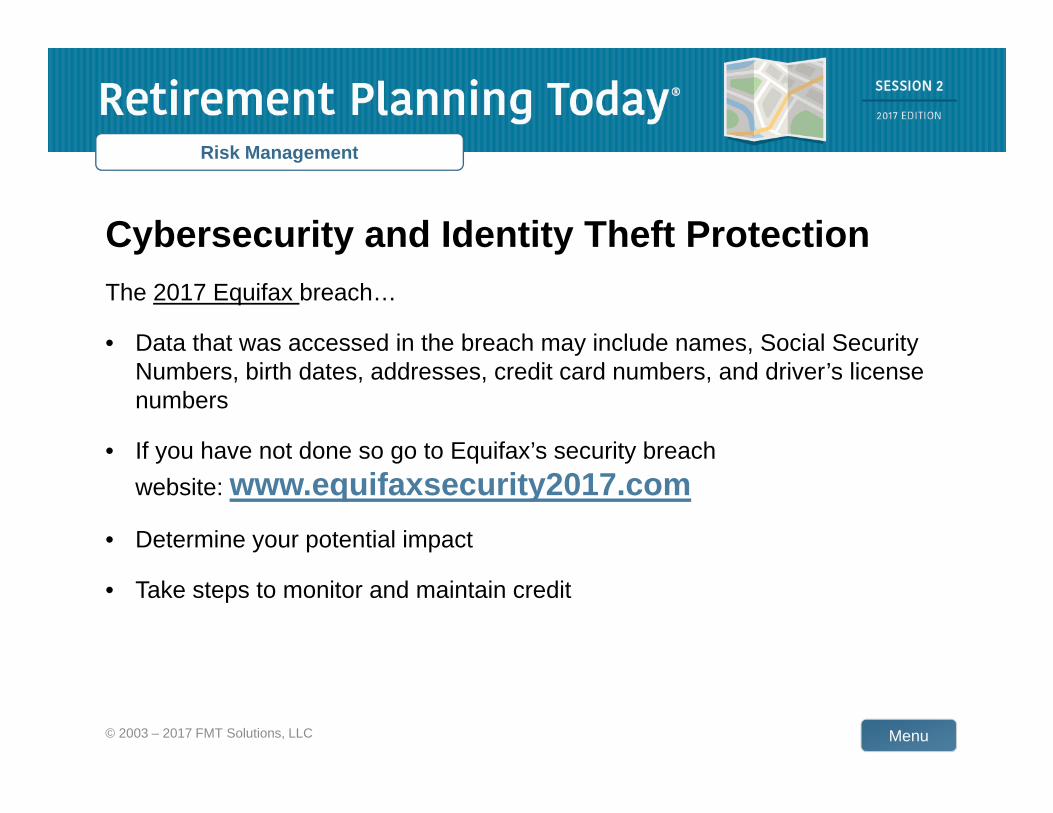
y y yThe 2017 Equifax breach…
• Data that was accessed in the breach may include names, Social Security y yNumbers, birth dates, addresses, credit card numbers, and driver’s license numbers
• If you have not done so go to Equifax’s security breachIf you have not done so go to Equifax s security breach website: www.equifaxsecurity2017.com
• Determine your potential impact
• Take steps to monitor and maintain credit
Menu© 2003 – 2017 FMT Solutions, LLC

Risk Management
Cybersecurity and Identity Theft Protection
Risk Management
y y yWhat can you do? Risk Control (Avoidance and Reduction)
• Identity theft comes in may different forms. The most common involve either y yusing your personal information to access credit – or using credit card or financial account information to steal.
• Most identity theft today occurs digitally/ online (especially through email!)
1. Risk reduction and avoidance for digital activity2. Financial Account maintenance3. Credit monitoring and maintenance
Menu© 2003 – 2017 FMT Solutions, LLC

Risk Management
Cybersecurity and Identity Theft Protection
Risk Management
y y yWhat can you do? Risk reduction and avoidance for digital activity
• Do not open un-trusted email attachments or links! p
• Don’t click links in emails requiring action (go to the website directly or call)
• Make sure your computer has the most up-to-date anti-virus software
• Use two-factor authentication when possible.p
• Use a password manager system (LastPass)
Menu© 2003 – 2017 FMT Solutions, LLC
Risk Management
Cybersecurity and Identity Theft Protection
Risk Management
y y yWhat can you do? Financial Account maintenance
• Regularly check accounts. Watch for inconsistencies or missing statements. g y gAvoid wire transfers to unverified recipients.
• Change the passwords and PINs on your financial accounts. Periodically changing your financial account login information has been and remains a best practice.
Pl ti it l t / tifi ti ll fi i l t Thi ld i l d• Place activity alerts/notifications on all financial accounts. This could include alerts for purchases, logins, contact information changes, credit-limit, or withdrawal/distributions. Each financial institution you use may have a different set of alerts to choose from.
Menu• File your tax returns as early as possible and/or utilize an IRS PIN.

Risk Management
Cybersecurity and Identity Theft Protection
Risk Management
y y yWhat can you do? Credit monitoring and maintenance
Get your free credit reports from annualcreditreport.com. Check for any accounts or charges you don't recognize. One each - once a year.
· Credit freeze: Should prevent others from opening accounts in your name (which is the main benefit), it will also make it harder for you to do so as well. Before deciding tothe main benefit), it will also make it harder for you to do so as well. Before deciding to freeze your credit, consider the pros and cons (your willingness to maintain the freeze/thaw cycle)
F d l t dit fil Y l d t t it f b hi h ill· Fraud alert on your credit file. You only need to request it from one bureau, which will then alert the other credit bureaus. Your credit file will still be accessible, and creditors will be mandated to take reasonable steps to verify your identity before granting you credit. 90 day or extended 7 year
Menu
· Subscribe to a credit monitoring tool. Make sure to receive notifications for Hard Inquiries. Won’t prevent fraud, but may offer financial reimbursement.

Possibility vs. Probability
Menu© 2003 – 2017 FMT Solutions, LLC

Final Thoughts
DisciplineDiscipline
Confidence
Knowledge