Embed Size (px)
Citation preview

“Blight Elimination Program” Initiative of
IHCDA’s Hardest Hit Funds:
Repurposing Demolished SitesReinvesting in Neighboring Properties
Presentations 4/8 – 4/22/2014
Bruce Frankel
Professor of
Urban Planning
Director, Real Estate
Development Programs
PART A10:00-noon

PARTS1. Guidelines to Conduct Workshop
2. Myths & Premises
3. Getting Started
4. Repurposing
5. Break for Lunch
6. Afternoon Workshop

PART 1Guidelines to Conduct Workshop1. Interactive
2. For & Beyond BEP
3. Why me?
a. Not You
b. Not IHCDA
4. 2 sets of workshops
In need of gadflies and facilitators:
RolesPoliticalPracticalFinancialMarket
Equitable

The BEPIncentive to expend funds
U.S. Treasury
Hardest Hit Fund [HHF] 2/2010
$7.6B
18 states + DC
Indiana $221M end 12/2017
BEP $75M
6 Divisions
Schedule
Division Application
Deadline
Awards
Made
1 Marion & Lake 4-21 5-22
2 5-19 6-26
3 6-16 7-24
4 7-21 8-28
5 8-18 9-25
6 9-15 10-23

Workshops A & B – IHCDA/ICC Contract
1. Causes & Remedies of
Blight
2. I.D. & Procure Resources
3. Incremental Repurposing
Strategies
4. Best Practices
1. Business Plan/ Problem-
solving
2. PPP –Roles
3. Strategies
outside BEP Rules
4. Catalytic Reinvestment
Strategies
What?Why?How?
Absence EPA, FNMA

Workshops A Preliminary to BEP Application
• BEP site selection, site control & potential post-demolition uses
• as part of a strategic community & business planning process
A. Causes of and remedies for blight and divestment of real property.
B. Options to work with the Federal National Mortgage Association (“Fannie Mae”) to identify Fannie Mae properties that may qualify for the BEP.
C. Identify and procure resources to develop or stabilize properties after demolition.
D. Reinvestment strategies for specific sites and whole neighborhoods.
E. Best practices business reinvestment plan for BEP properties post-demolition, including exploring options of developing former residential sites into commercial sites and marketing, financing and managing such sites.

Workshops B Post BEP Awards• long-term strategies to eliminate blight and revitalize communities • after BEP resources have been exhausted & regardless of whether BEP funds
have ever been used
A. Developing and executing a business plan for blighted
B. Roles of private and public players and their resources within the
business plan, including, if applicable, options to work with the Fannie
Mae to identify Fannie Mae properties that may be appropriate for
demolition and revitalization.
C. Strategies [outside IHCDA rules] to stabilize sites and maintain site
control while redevelopment resources are unavailable [not yet
procured], including the appropriate role of demolition.
D. Problem solving for the business plan
What?Why?How?

Schedule
1 A – northern: Lake County La Porte City Hall 801 Michigan Ave. Tuesday, 4/8
2 A – central: Marion County Indianapolis OldCity Hall, Atrium
202 N. Alabama St.
Thursday, 4/10
3 A – southern: Bartholomew
Columbus City Hall, 1st Floor
123 Washington St.
Tuesday, 4/15
4 A – southern: Knox County VincennesFortnightly Bldg.
421 N Sixth St. Thursday, 4/17
5 A – northern: Allen County Ft. Wayne City Hall
Citizens Square, 200 E. Berry St.
Tuesday, 4/22
6 B – northern: Howard Kokomo TBD Monday, 10/27
7 B – central: Hancock Greenville TBD Wednesday,10/29
8 B – southern: Dearborn Aurora TBD Monday, 11/3
9 B – northern: Tippecanoe Lafayette TBD Wednesday, 11/5
10 B – southern: Brown Bloomington TBD Monday, 11/10

WebsitePowerPoints
Resources Round 1 Workshops as “primers”, “best practices” & “position papers”
Resources Round 2 Workshops on “elements” & “calculators” for business plan
Blog
IHCDA Materials
http://www.877gethope.org/blight
http://www.in.gov/ihcda/2340.htm

Webcast April 102:00-4:00 pm
Panelists include:
Yolanda Chavez, Moderator, Deputy Assistant Secretary for
Grant Programs, Community Planning and Development, HUD
Alan Mallach, Nonresident Senior Fellow, Brookings Institution
Terry Schwarz, Director, Kent State University's Cleveland
Urban Design Collaborative
Sara Toering, Counsel, Center for Community Progress
Reports on BEP website
Follow the event on Twitter #PDRupdate
and email in questions during the webcast
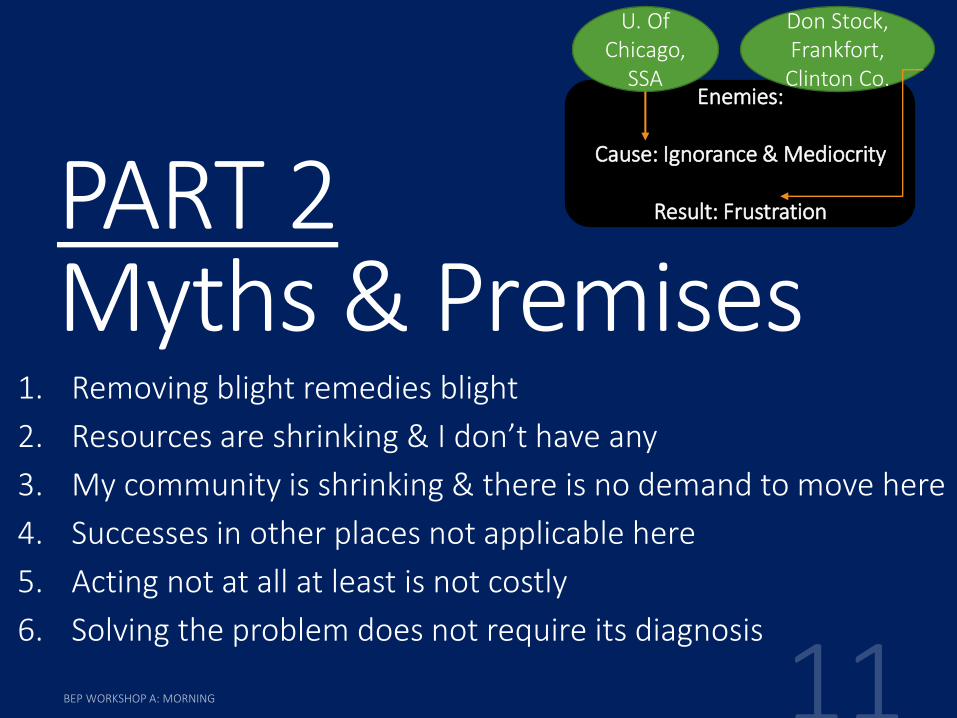
PART 2Myths & Premises
1. Removing blight remedies blight
2. Resources are shrinking & I don’t have any
3. My community is shrinking & there is no demand to move here
4. Successes in other places not applicable here
5. Acting not at all at least is not costly
6. Solving the problem does not require its diagnosis
Enemies:
Cause: Ignorance & Mediocrity
Result: Frustration
U. Of Chicago,
SSA
Don Stock, Frankfort,
Clinton Co.

1. Removing blight remedies blight
Blight is the proximate cause of property value decline, …but
Demolition alone will not cause a value reversal
Demolitions Impact on Neighboring Properties Muncie Disinvestment Neighborhoods
2011 2013
Average $26,875 $21,425
Absolute -$5,450
Relative -20%
Demolitions Impact on All Properties Muncie Disinvestment Neighborhoods
2011 2013
Average $21,150 $12,163
Absolute -$8,988
Relative -42%
Historic Districts Sandwiching Downtown

National Historic Trend Vacant & Abandoned Housing Stock
Source: U.S. Department of Housing & Urban Development, 2014

Effect of Blight [Vacant & Abandoned] on Neighborhood Property Values
Website
• Longer the blight the stronger the effect [value, geographic scope]• Match strategy to market conditions• Detroit, Youngstown > 30% vacant & population not stabilizing• Milwaukee, < 10% vacant & population stabilizing
Study Baltimore 1991-2010
Alternative use
Rehab/ Replace
…but, Frankel has a different take in the afternoon… and in Workshop B
Strategies HUD Study
Set
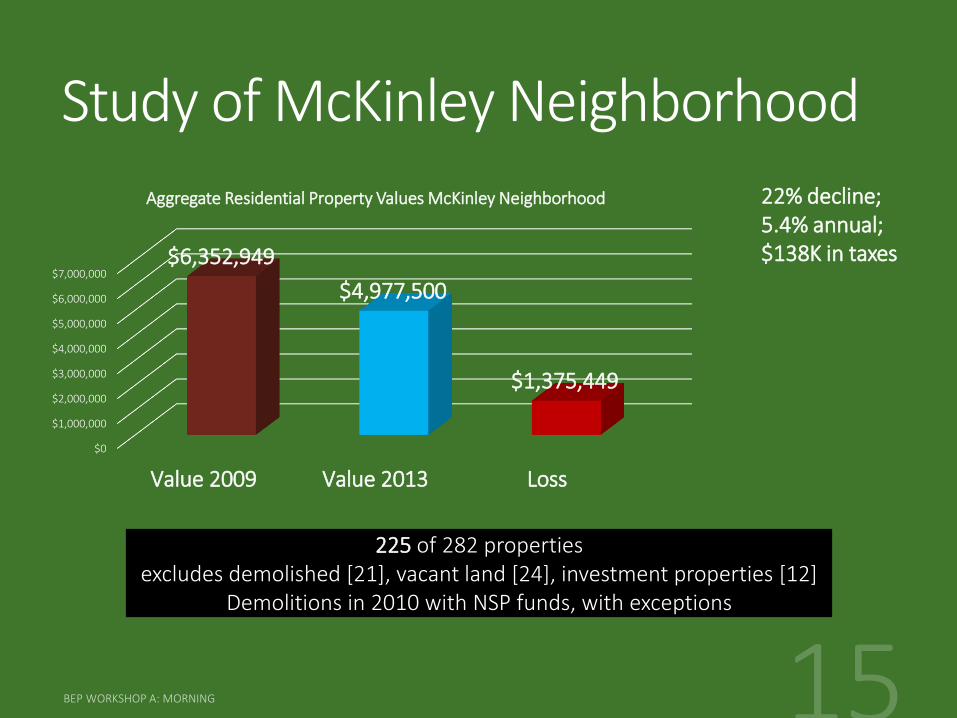
Study of McKinley Neighborhood
22% decline; 5.4% annual; $138K in taxes
225 of 282 propertiesexcludes demolished [21], vacant land [24], investment properties [12]
Demolitions in 2010 with NSP funds, with exceptions
$0
$1,000,000
$2,000,000
$3,000,000
$4,000,000
$5,000,000
$6,000,000
$7,000,000
Value 2009 Value 2013 Loss
$6,352,949
$4,977,500
$1,375,449
Aggregate Residential Property Values McKinley Neighborhood

Includes all properties [now with investment uses]
less demolished and vacant land
$0
$1,000,000
$2,000,000
$3,000,000
$4,000,000
$5,000,000
$6,000,000
$7,000,000
$8,000,000
$9,000,000
2009 2013 Lost Value
$8,803,149
$7,153,100
$1,650,049
Aggregate Value
$274,600 in lost investment[$1,650,049 - $1,375,449]
MF + C

Average Home Value
$37,144$32,788 $32,371
$30,293$30,182
MEAN
Without Vacant Land or Demolished Properties
2009
2010
2011
2012
2013
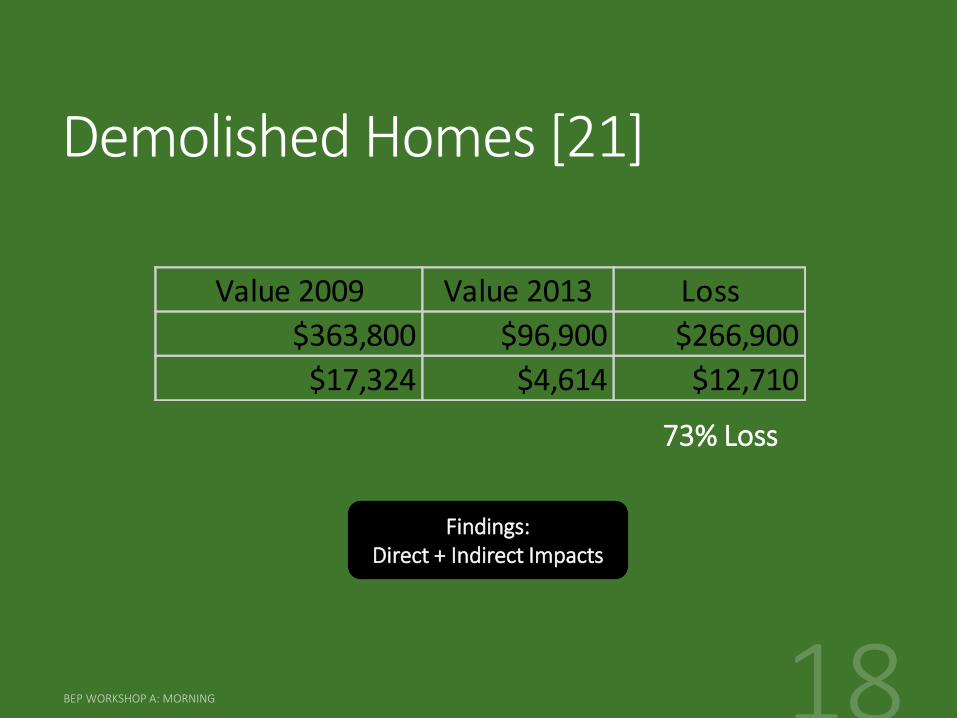
Demolished Homes [21]
Value 2009 Value 2013 Loss
$363,800 $96,900 $266,900
$17,324 $4,614 $12,710
73% Loss
Findings:Direct + Indirect Impacts

2. Resources are shrinking & I don’t have any
Some, while others are expanding
… & Yes
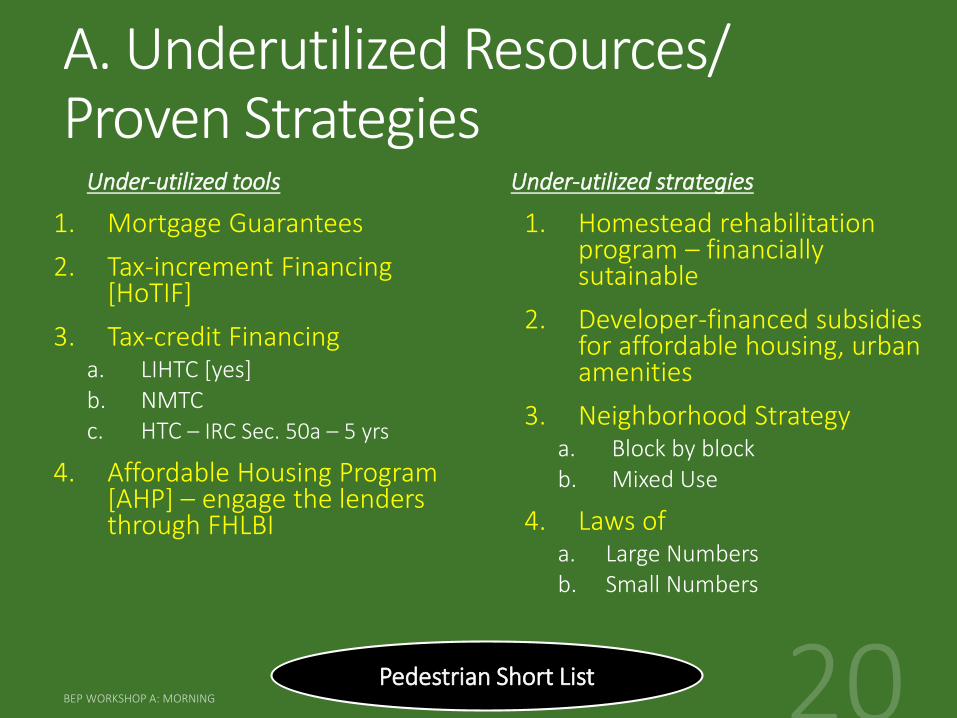
A. Underutilized Resources/ Proven Strategies
Under-utilized tools
1. Mortgage Guarantees
2. Tax-increment Financing [HoTIF]
3. Tax-credit Financinga. LIHTC [yes]b. NMTCc. HTC – IRC Sec. 50a – 5 yrs
4. Affordable Housing Program [AHP] – engage the lenders through FHLBI
Under-utilized strategies
1. Homestead rehabilitation program – financially sutainable
2. Developer-financed subsidies for affordable housing, urban amenities
3. Neighborhood Strategya. Block by blockb. Mixed Use
4. Laws ofa. Large Numbersb. Small Numbers
Pedestrian Short List

3. My community is shrinking & there is no demand to move here
A. Essential role of neighborhood organizationi. Every household is named Hughes or Thornburg
B. Market Capturei. College: matriculants + graduatesii. What is venture capital funding?iii. What is an offer that can’t be refused? What is the role of price?iv. Quid pro quo on new businesses [catalytic projects in the afternoon]
C. What if housing contained a means of living & livelihood?i. Mixed uses “urban amenities” [“strategy of indirection” in October
workshops]ii. Live/work
If you build it,
will anyone come?

NVCA
National Venture Capital Associationhttp://www.nvca.org/
Considerable Membership
>50% investing from public/ private pension funds
Rest from endowments, foundations, insurance companies, banks, fat cats
Also, Dun & Bradstreet DMI indicators [by product and credit ratings of each new venture]
NVCA Partners
6 VC firms headquartered in
Indianapolis

Venture Capitalism
Direct Investment for equity shareSeed or Early Stage [typically 3-5 years]Mezzanine [typically year 5-7]Also – acquisition, turnaround, recapitalization stage
Add managerial credibility or credit for debt financingHigher risk for higher reward
technical, managerial support
IndependentAffiliates/ subsidiaries of commercial bank or insurance companySubsidiaries of non-financial companies [e.g., manufacturer]
Dare I say public or private nonprofitCorporate form as LP [GP + LP’s] or LLC
cheap is requisite when revenues are nil
What is a security? A tranche? A place-based tranche?

Socially Responsible Banking
People, Planet, Profit =“mission-based banking”
Chicago, IllinoisCleveland, Ohio,
Detroit, MichiganArkansas
Pacific NW NOT Indiana
https://www.upbnk.com/
But can induce through Federal mortgage sureties
Concept: depositors are also stakeholders in their community• Local banking
marries stakeholders with investment
Concept: investing in neighborhoods, instead of properties, is less risky
Since 2010
first bank holding company to combine commercial banking, real estate development, nonprofit loan funds: $900 million 2000-2006
1973-2010 1974
$18M awards
59 lenders

Brookings Study endorsed by Urban Land Institute – Enough Demand to Reverse Blight
213.4B / 427.3B= ~50%
“THE PROSPECTIVE MARKET FOR REAL ESTATE DEVELOPMENT”WEBSITE
By Bruce Frankel 11/15/2010

A. Opportunity: Extent of the Challenge
~40% of real estate investment in the near term shall be infill and
adaptive reuse, and most of that in markets of disinvestment
ULI Endorsed
40% of 50% = 20%Muncie’s vacant/ abandoned housing stock = 15%
2000-2030Market for gray zones: 82 B s.f.
Additionally, the “smart growth” and “sustainable cities” movements are emerging and may redirect investment
from cornfields to urban redevelopment.
Arthur Nelson, TOWARD A NEW METROPOLIS: THE OPPORTUNITY TO REBUILD AMERICA, The Brookings Institution Metropolitan Policy Program, 2004

Excerpts from Frankel Paper 2010
Indiana will require another 1,118,417 dwelling units by 2030, a 44.2% increase over the 2,532,319 units in 2000.
Of this demand 441,003 will be from existing dwellings lost to neglect and disinvestment, largely in our economically distressed cities and towns, and reflecting a notable inefficiency in our allocation of resources as well as an opportunity for rehabilitation and renewal.
Indianapolis alone will require another 388,000 dwellings, a 57% increase.
Albeit less significant in absolute terms, the national demand for commercial and institutional space toward 2030 will almost double the rate of growth relative to residential, a 90% cf. 51% increase.
For the Midwest the demand will be for another 23,289,021,000 s.f. of such space and for Indiana that demand is 2,128,130,000 s.f., an increase of 88% over its current inventory. For such Midwest cities as Indianapolis the growth is 743,661,000 s.f. [95% increase], and for Grand Rapids the increase is 106% [468,681,000 s.f.]. For our largest Midwest city, Chicago, the growth is 3.3 billion s.f.
44% increase dwellings Indiana
88% increase in non-residential Midwest

Excerpt
Though a small component of overall growth, the projected demand for industrial space in the Midwest outpaces that of the other regions, unlike the other major land uses.
States with a strong industrial presence will see the largest amount of growth in industrial space even though other areas may witness faster growth. After California, which far outpaces the nation in terms of absolute square feet of new industrial construction, the next four largest producers of industrial space are all Rust Belt states in the Midwest: Ohio, Michigan, Illinois, and Indiana. Indiana alone will generate 442,571,000 s.f. of industrial space, 12% of the growth of 3.8 billion s.f. projected for the Midwest. By 2030, 70 percent of the Midwest’s industrial space will be less than 30 years old.
While these projections may seem overwhelming, they also demonstrate that nearly half of what will be the built environment in 2030 doesn’t even exist yet, giving the current generation a vital opportunity to reshape future development.
Recent trends indicate that demand is increasing for more compact, walkable, and high quality living, entertainment, and work environments. The challenge for leaders is to create the right market, land use, and other regulatory climates to accommodate new growth in more sustainable ways.
70% increase in industrial Midwest
Overall 50% increase in all uses nationwide

Excerpt on Affordable Housing
The LIHTC may be combined with Indiana’s HoTIF [Housing Tax Increment Financing]. The State’s share of the 5.5 million units currently needed presents a virtually bottomless need and demand for affordable housing development here. That need is multiplied throughout other states, and especially those with a higher cost of housing. This special need was not highlighted in the aforementioned Brookings’ study of Nelson.
Nationwide need for 5.5 M affordable
dwellings; since 1987 satisfied
2.318 M =“bottomless need;
ready market”

Land Improvements 2004
$126.8
$16.5 $39.1 $47.4 $65.0
$474.8
$34.4 $7.5
$148.7
U.S. Private Land Improvements in $ billions for 2004

Commercial + Health Care
13% Manufacturing2%
Power + Communication
4%
Mining5%
Farm + Other7%
Single Family49%
Multifamily4%
Manufactured Homes
1%
Site Improvements + Other
15%
Allocation of U.S. Private Land Improvements for 2004
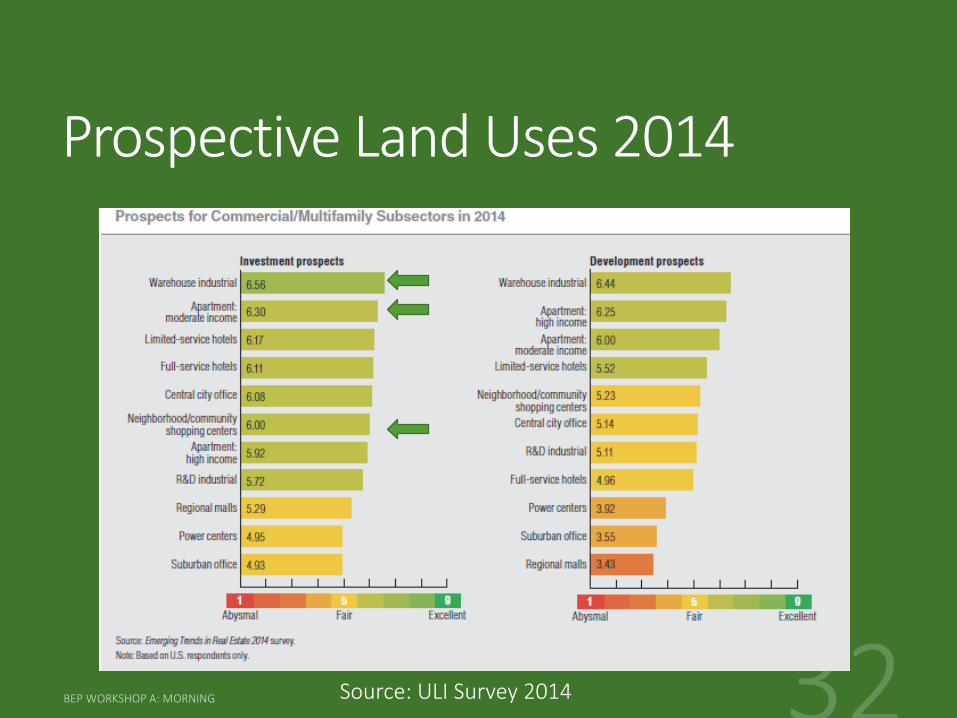
Prospective Land Uses 2014
Source: ULI Survey 2014
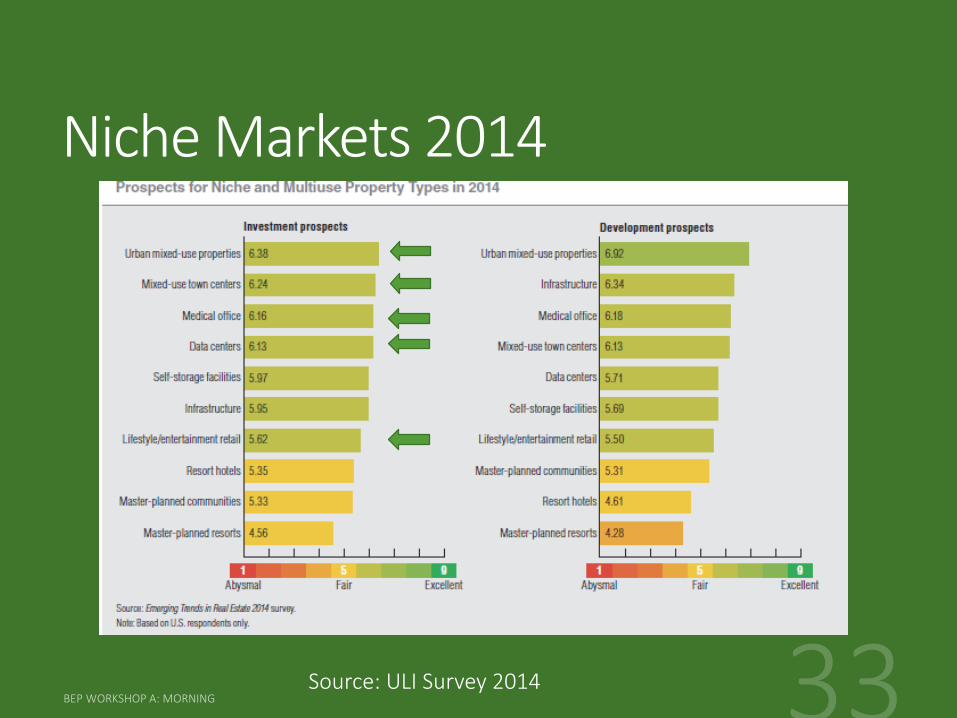
Niche Markets 2014
Source: ULI Survey 2014

Indiana Prospects
Source: ULI Survey-Indiana 2013

How Central Indiana Rates Transit 92% important, but 70% rated poor
Only 15% respondents outside 8-county
Indianapolis metro

Expectation by Type of Place
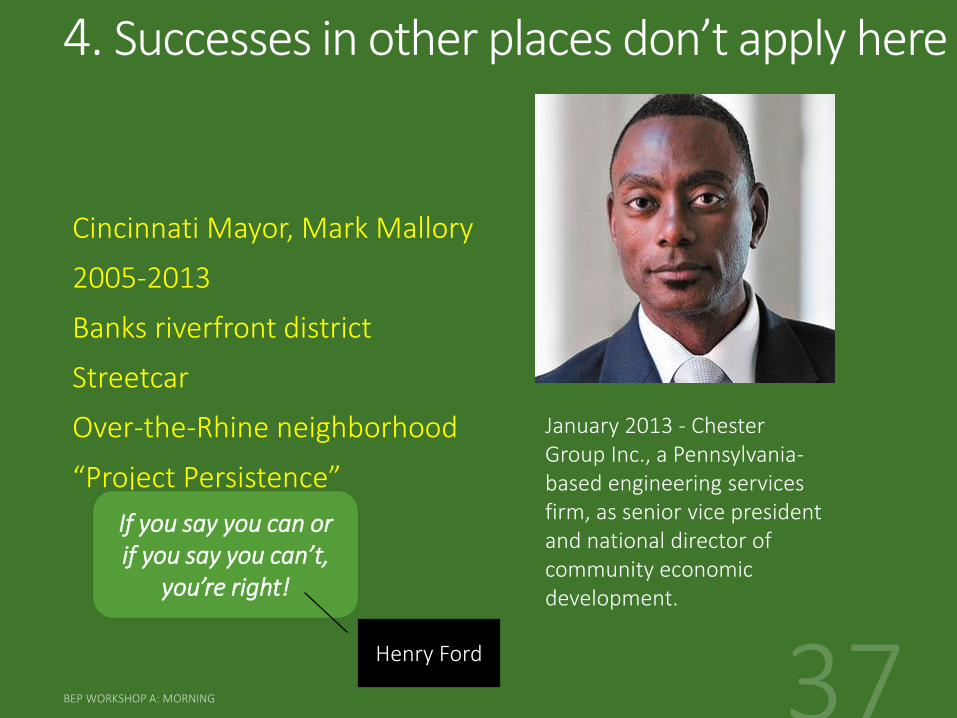
4. Successes in other places don’t apply here
Cincinnati Mayor, Mark Mallory
2005-2013
Banks riverfront district
Streetcar
Over-the-Rhine neighborhood
“Project Persistence”
January 2013 - Chester Group Inc., a Pennsylvania-based engineering services firm, as senior vice president and national director of community economic development.
If you say you can or if you say you can’t,
you’re right!
Henry Ford
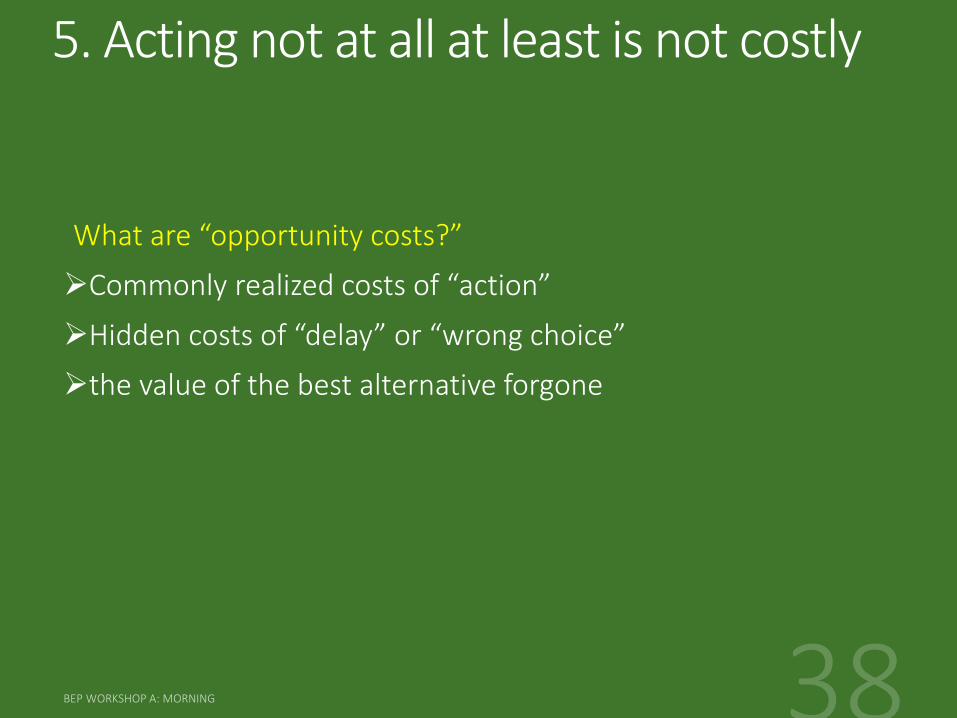
5. Acting not at all at least is not costly
What are “opportunity costs?”
Commonly realized costs of “action”
Hidden costs of “delay” or “wrong choice”
the value of the best alternative forgone

Historic Preservation
• $0 direct costs [or demolition @ $1.2M]
• Loss of subject ratables [e.g., 10% per annum x 135 properties of $50K = $5K x 135 = $675K/ yr.]
• Loss of neighborhood ratables [e.g., 5% x 400 properties of $150K = $7.5K x 400 = $3.0M/ yr.]
• Loss of economic development [e.g., 1,000 jobs – 250 jobs = 750 jobs x $35,000 wages = $26.25M/ yr.
Defer Blight
• $100K rehab @ 20% public investment x 135 properties = $20K x 135 = $2.7M as one time investment [$13.5M counting both sectors]
• Over 10 years: $13.5M
Reinvestment Strategy
Over 10 years defer: - $6.75M - $30M - $262.5M = -$299.25M = “indirect costs”
“Opp. Cost” over 10 years invest: ($100K * 135 + $3.0M + $26.25M) * 10 = $135M + $292.5M = $427.5M - $2.7M as public investment = $424.8M [Note: benefits could be reduced to tax
revenue added @ 1-2% of assessed value per annum]
This is an argument
Defer @ $0 publicInvest @ $2.7M

6. Solving the problem does not require its diagnosis
Monumental mistake of planning
Rush to goals, objectives, strategies
Equal time to understanding the problem

A. Causes Vacant & Abandoned
Loss of Jobs• Reduced
Demand
Property Stock Deteriorates
• Relaxed Code Enforcement
• Declining 𝑽𝒎
Tipping Point:
𝑉𝑚 < 𝑉𝑟𝑅𝑂𝐼 < 0
• Supply determines Demand
• Live in slum = invest in slum
Critical relationship between market & replacement value
UBHA
Pols campaign
on this
Systematic response as demolition?

PART 3Getting StartedPartner Selection
Site Selection

Partners
Local Government Awardees & Program Partners execute with IHCDA
“Participation Agreements”

1. Function
A. Hold title and
B. Control site
C. Serve as land developer and GC
D. Lease or sell to end user
E. Reversion under performance contract
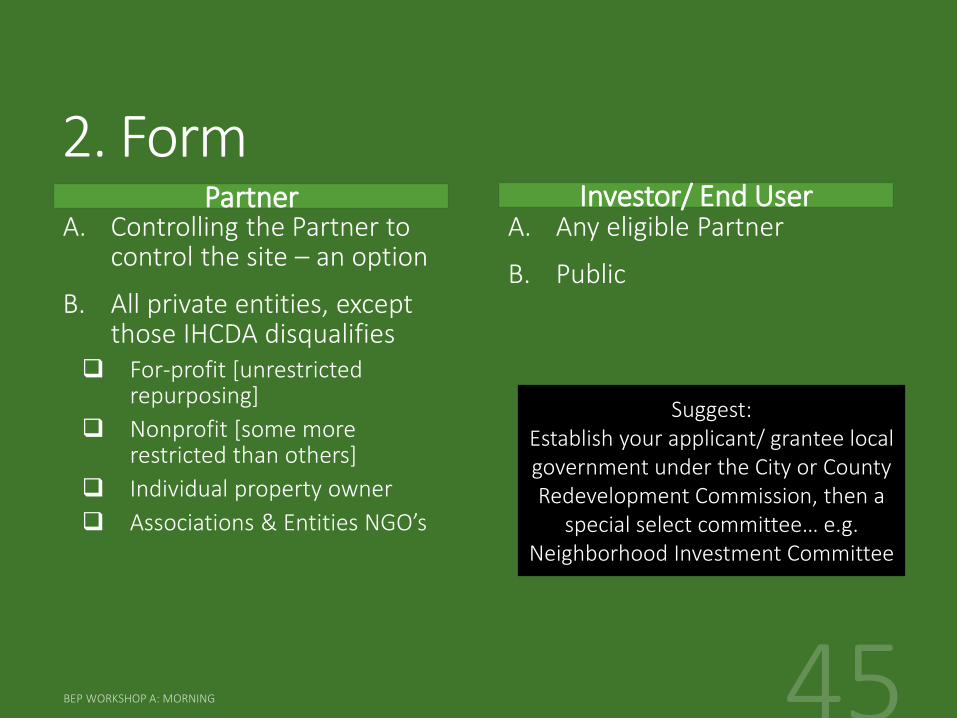
2. FormA. Controlling the Partner to
control the site – an option
B. All private entities, except those IHCDA disqualifies
For-profit [unrestricted repurposing]
Nonprofit [some more restricted than others]
Individual property owner
Associations & Entities NGO’s
A. Any eligible Partner
B. Public
Partner Investor/ End User
Suggest: Establish your applicant/ grantee local government under the City or County Redevelopment Commission, then a
special select committee… e.g. Neighborhood Investment Committee

Nonprofit FormsIRC presents under Section 501-521, 33 nonprofit forms
501c3 – charitable & highly restricted Private charity [e.g., foundation]
Independent of government <10% public support
501c6 – promotes business & commerce [e.g., IEDC]
501c14 – credit unions, mutual funds
509a - public charity Established to carry out public
purpose or governmental role
e.g., land bank, redevelopment corporation
“Public-private” - may be controlled by public
>10% public support with other factors OR
> 33.3% public support prima facie
Carefully consider
In general, the broad interests of the public will be served by a governing body comprised of public officials or their representatives; persons with expertise in the organization's field of operation; community leaders; or persons elected by a broadly based membership.

3. Local/ Nonlocal as Partner, Developer or End User
Homeowners Association [HoA] HoA adopts common area Indiana’s Barrett Law, IC 36-9-36 as
municipal or county special assessment
Public bond unwritten by special assessment
HoTIF
Adjoining property owner
CDC, CDE, CHDO
Local Builder
Local Lender with REO
Housing Authorities [developer alter-ego]
Redevelopment Commissions or Authorities [developer alter-ego]
National/ Regional Developer, e.g.any public interest developer
Local Initiatives Support Corporation [LISC]
Metro in Indianapolis Rural Outside Enterprise Foundation IACED
Source of Demand & Supply

4. Type of Strategy
Stabilize Area of Investment
Incrementally approach Area of Disinvestment Extend adjoining lot Single project • urban farm• neighborhood park
• house• non-residential• mixed-uses
Neighborhood Reinvestment
Systematic block by block
Entails catalytic programs
Business Plan
16 criteria [conditions] for neighborhood selection
6 distinct strategies to match neighborhood conditions + 7th as synthesis
Introduced afternoon session
Topic of 2nd workshop
Introduced afternoon session & more fully explored in Workshop B
afternoon

PART 4Repurposing1. Extended Lot
2. Urban Agriculture
3. Public/ NGO
4. Residential
5. Nonresidential
6. Mixed Use

1. Extended Lot
What are the net merits of subdividing V?
…of relying on the Property Maintenance Code or a Deed reversion clause?

Cost
1 side yard $4,668
2 side yards$5,767

2. Urban Agriculture
1. Soil Conditionsa. Pollutants
b. Debris
c. Compacted
2. Water Access
3. Permitsa. Zoning Code
b. Building Code
4. Equipment
5. Fencing/ Security
6. Native Plant Selection
7. Budgetsa. Vineyard
b. Orchard
c. Market Garden
d. Community Garden

A. Vineyard$4,923

B. Orchard$3,718

C. Market Garden$3,659

Earthworks - Detroit

Earthworks

Earthworks
Shane Bernardo:
Outreach
Coordinator

Earthworks

To Market

D. Community Garden $5,577
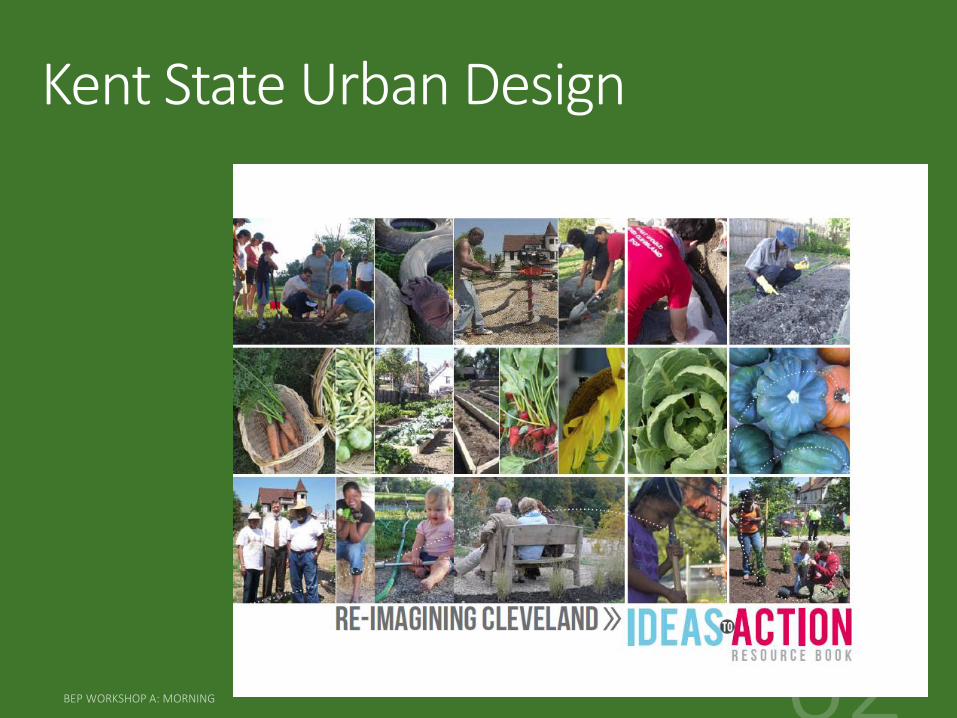
Kent State Urban Design

3. Public/ NGO
1. Public Open Spacea. Land Bank Street Edge Improvements
b. Neighborhood Pathway
c. Neighborhood Pocket Park
d. Rain Garden [Neighborhood Hydrology]
e. Public Art
2. Public Facilitya. Community School
b. Community Center
c. Economic Development Incubator

A. Land Bank Street Edge Improvements$546

I would add a 3’ fence

B. Neighborhood Pathway$8,446
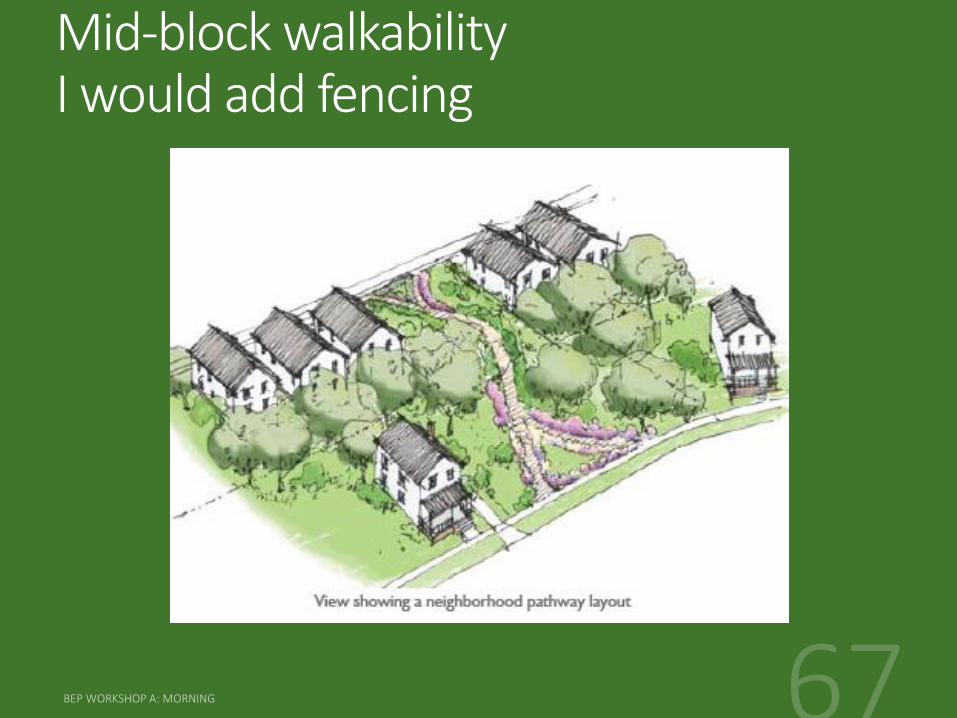
Mid-block walkability I would add fencing

C. Neighborhood Pocket Park$6,094

Pocket Park
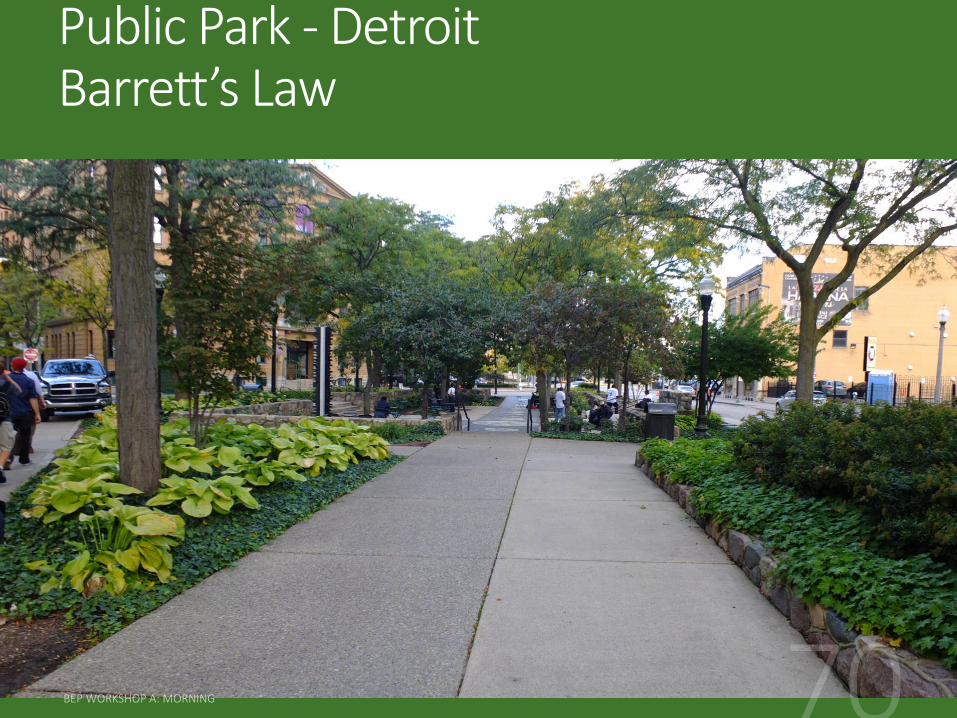
Public Park - DetroitBarrett’s Law

Campus Martius - Detroit

D. Neighborhood Rain Garden [Hydrology]$1,128

Rain Garden considerations

E. Neighborhood Art + Park -Detroit

DetroitThe Heidelberg Project,
3600 Heidelberg Street
2nd most popular tourist attraction

Heidelberg

Heidelberg

Heidelberg

Heidelberg

Heidelberg

Heidelberg

ResourcesGuides to Demolition & Redevelopment

WebsitePowerPoints
Resources Round 1 Workshops as “primers”, “best practices” & “position papers”
Resources Round 2 Workshops on “elements” & “calculators” for business plan
Blog
IHCDA Materials
http://www.877gethope.org/blight
http://www.in.gov/ihcda/2340.htm

FoldersMorning Session Workshop A
Afternoon Session A + Workshop B
PowerPoints Frankel
Workshop A
• Morning
• AFTERNOON
Workshop B
• Morning
• Afternoon
PowerPoint IHCDA
For BEP Program
Repurposing Strategies
Incremental Repurposing
Corporate Partner
Scholarly Studies Redevelopment
Ordinances
Repurposing Strategies
Catalytic Redevelopment
Finance
Income Limits Federal Programs

BreakPreview of Afternoon Session
1:00 – 3:00 pm
RepurposingResidentialNon-residentialMixed Uses
ResourcesIntroduction - Strategies for Neighborhoods
NRSA