Embed Size (px)
Citation preview

applied sciences
Article
Lightning Protection Methods for Wind TurbineBlades: An Alternative Approach
Viktor Mucsi 1, Ahmad Syahrir Ayub 1,* , Firdaus Muhammad-Sukki 1,* ,Muhammad Zulkipli 2 , Mohd Nabil Muhtazaruddin 3 , Ahmad Shakir Mohd Saudi 4,* andJorge Alfredo Ardila-Rey 5
1 School of Engineering, Robert Gordon University, The Sir Ian Wood Building, Riverside East, Garthdee Road,AB10 7GJ Aberdeen, UK; [email protected]
2 Faculty of Engineering Technology, Universiti Tun Hussein Onn Malaysia, Pagoh Higher Education Hub,KM1, Jalan Panchor, Pagoh, Muar 84600 Johor, Malaysia; [email protected]
3 Razak Faculty of Technology and Informatics, Universiti Teknologi Malaysia, Jalan Sultan Yahya Petra,Kuala Lumpur 54100, Malaysia; [email protected]
4 Universiti Kuala Lumpur-Institute of Medical Science Technology (UniKL MESTECH), A1-1, Jalan TKS 1,Taman Kajang Sentral, Kajang 43000, Selangor, Malaysia
5 Department of Electrical Engineering, Universidad Técnica Federico Santa María, Santiago de Chile 8940000,Chile; [email protected]
* Correspondence: [email protected] (A.S.A.); [email protected] (F.M.-S.);[email protected] (A.S.M.S.)
Received: 30 January 2020; Accepted: 10 March 2020; Published: 20 March 2020�����������������
Abstract: Lightning strikes happens in a fraction of time, where they can transfer huge amounts ofcharge and high currents in a single strike. The chances for a structure to be struck by lightningincreases as the height increases; thus, tall structures are more prone to lightning. Despite the existinglightning protection systems available for wind turbine blades, there are still many cases reported dueto the fact of damage caused by lightning strike. Owing to that, the present work introduces a newapproach for a lightning protection system for wind turbine blades where preliminary investigationswere done using Analysis Systems (ANSYS) Workbench. Two models were developed: one witha conventional type down conductor system and the other with a hybrid conductor system. Therecorded findings have been compared and discussed, where it was found that the hybrid conductorsystem may provide alternative protection from lightning for wind turbine blades.
Keywords: lightning; lightning protection system; wind turbine blades; ANSYS workbench
1. Introduction
Windmills have been around for centuries, operating as grain grinders and water pumps. Theconcept and technology behind windmills have been adapted to generate electricity, which in its newform is now called wind turbines (i.e., wind energy). Wind energy generation is now becoming oneof the largest contributors to renewable energy generation, where the recent demand for renewableenergy has seen its increasing growth in use as well as in physical size. In other words, wind turbinesare getting taller, in order to accommodate the demand, by capturing wind through a larger bladeswept area and converting it into electricity. Owing to this, wind turbines are now more prone tolightning strikes due to the fact of their increased structural height.
There are approximately 2000 thunderstorms at any given minute and about 100 lightning strikesper second worldwide [1]. This creates great risk for tall structures, such as wind turbines, to be struckby lightning, where the average electric current from a lightning return stroke is 30 kA [1]. This massiveflow of current can heat up the leader channel air to between 25,000 ◦C and 30,000 ◦C (around five
Appl. Sci. 2020, 10, 2130; doi:10.3390/app10062130 www.mdpi.com/journal/applsci

Appl. Sci. 2020, 10, 2130 2 of 18
times the effective temperature of the sun) [1–3]. Lightning protection system (LPS) is composed oflightning receptor, down conductor, and grounding, and all elements must be well connected to passthe lightning current to Earth safely. Although wind turbines are installed with LPS, there are still caseswhere blades and whole turbines are destroyed due to the fact of lightning strikes. Considering the20–25 year design life for wind turbine [3], it is worth safeguarding the turbines from lightning strikes,because the damage associated with it will cause the down time of the turbine operation, causing extracosts for maintenance and an shortage of electricity. This, therefore, may suggest a need for improvingthe existing lightning protection systems for wind turbine blades.
2. Lightning Discharges and Existing Lightning Protection Systems for Wind Turbine
Mechanism of Lightning Discharge
Lightning discharge from cloud to ground stems from a stepped leader initiated in a cloud andincreases the electric field within its path. When a grounded object is in that electric field, it generates aleader towards the stepped leader, and it is called a connecting leader. If the downward moving leaderhas a negative charge, then the connecting leader is positive. If the downward leader is negative, thenthe connecting leader is positive [3].
As a stepped leader approaches ground level or the tip of the grounded structures, the electric fieldincreases to such an extent that it discharges, and connecting leaders starts to propagate towards thedownward leader in an attempt to connect, to equal the potential difference. Taller structures generatelonger connecting leaders due to the field enhancement caused by the accumulation of positive chargeon the structure [1,3,4].
The stepped leader channel is at cloud potential, approximately 50 MV [1,3–8] and with the finalconnecting jump, a near of ground potential travels along the channel in the direction of the cloud,which is called return stroke. The flow of charge generates a large current with an average peak of30 kA [1,3] to 80 kA [1]. Due to the rapid generation of heat of around 30,000 K [1,3] in the channel,a pressure is created of 10 atm or above [3]. In some instances, new charges from the cloud forminganother electrical discharge called dart leaders, creating subsequent return strokes with an averagepeak current of about 10–15 kA [1,3].
Most negative cloud-to-ground flashes contain more than one stroke, generally 3–4 [1] and,in major cases, the first stroke is usually 2–3 [3] times larger than the following subsequent strokes. Onthe other hand, occasionally in multiple stroke flashes there is at least one subsequent stroke which isgreater than the first return stroke [3].
3. Wind Turbine Blades and Its Protection Methods
3.1. Wind Turbines and Blades
There are two main types of wind turbines on the market nowadays: vertical axis and horizontalaxis turbines. Due to the lower efficiency, vertical axis turbines were not considered in this paper.Modern turbines are dominantly composed of horizontal axis models, since with rotor blade pitching,the speed of rotation and hence the power output can be controlled, and the blade aerodynamics canbe optimized for maximum efficiency. In most cases, the three-blade model is used as it has the highestefficiency in ratio of the number of blades and their overall weight.
At blade design, the actual shapes are very similar within commercial turbines, although, slightlydiffers by each manufacturer for the best possible aerodynamics according to company preferences [9].Common characteristics are the hollow design, to reduce weight and the turnable rotor blade tip tohelp overspeed limitation [10]. Modern blades generally made of Fiber-Reinforces Composites such ascarbon fiber and glass fiber with a matrix material of polyester resins or epoxy resins.
Carbon fiber generally has good braking and elasticity characteristics, with stiffness not far fromsteel, although it is the most expensive material component among the possible choices. Also, in regards

Appl. Sci. 2020, 10, 2130 3 of 18
to lightning protection, it requires special considerations due to the fact of its material properties whichare similar to a semiconductor, creating issues with lightning attachment and flashovers on the surfaceof the blade.
Glass fiber, on the other hand, has lower ratings in almost all the characteristics mentioned before,but it is considerably cheaper, and it acts as an insulator. Manufacturers tend to use it with moreexpensive but high-quality epoxy resins to enhance the required physical properties of it [10,11].Although, the blade is nonconductive, it still attracts lightning due to the fact of its height; therefore,lightning protection is necessary.
3.2. Lightning Protection in General
Lightning protection systems for wind turbines are based on International ElectrotechnicalCommission (IEC) IEC 61400-24. According to this standard, the lightning protection levels (LPLs)have been set in accordance with the probability of minimum and maximum expected lightningcurrents, I to IV. The maximum protection, LPL I levels should not be exceeded with a probability of99% for negative flashes, meanwhile, for positive flashes it is below 10% [12]. The parameters for LPLII and III–IV are the reduced values of LPL I by 75% and 50%, respectively.
The rolling sphere method (RSM) was used to identify the locations of the air termination systemon a given structure. The method assumes that there is a spherical region with a radius equal of thestriking distance located around the tip of the oncoming lightning leader to a structure. Owing to that,the RSM method demonstrated on a wind turbine with 20 m radius (LPL I). This radius, r, is in relationto the peak current I of the first stroke. According to the IEEE, the equation is:
r = 10I0.65 (1)
There are many different proposals regarding the calculations of the radius for the rolling spherein relation with the peak current, but the suggested values for each protection level are set by thestandards [7] where for each LPL and radius, there is a corresponding minimum peak current valuewhich, against the protection level, it gives protection.
3.3. Protection Methods for Blades
There are four main types of lightning protection methods developed as recommended andoutlined in IEC 61400-24 [7]. The methods are as follow:
(a) receptors placed in the tip and an internal wire (i.e., conductor) is used to carry the current tothe hub
(b) metallic conductor placed around the edges to serve as termination and down conductor(c) metal mesh used on the side of the blade
Regardless of the methods, the main function [12–14] of the lightning protection on the blades is:
- Successful attachment of the lightning strike to a designated or preferred air termination or downconductor system to conduct the current safety without damaging the blades;
- Provide passage for the lightning current through sufficient cross-section conductors, diverters,and air terminators to earth. Preventing damage to the system and minimizing the high levelmagnetic and electric field due to high currents;
- Minimizing the high level of voltages induced and observed inside and outside of the turbine.
With insulator-based materials blades, such as glass fiber composites, the conductors can beplaced outside of the blade to divert lightning from the blade surface, also, can be placed inside, withair-terminations at specific point outside of the blade. When carbon fiber composites are used, a layerof conducting material is placed over it which can then carry the current to the blade root. With

Appl. Sci. 2020, 10, 2130 4 of 18
both cases, sliding connectors are used to carry the current from the blade to the hub towards theground [12–14].
For the earth termination and down conductors, it has to carry the lightning current safely to theground where common materials are aluminum, steel, and copper. In general, air termination and fordown conductor, the cross-section of at least 50 mm2 is recommended [7,12–14].
3.4. Lightning Damage to Wind Turbines and Blades
According to many field observations and studies [15–18], wind turbines receive significantamounts of lightning attachments during their designed lifetime, mostly on rotor blades. The damagescaused mostly from unsuccessful attachments on air terminations or from induced voltages fromelectric and electromagnetic fields. The highest percentage of damages occurred on the control system,although, on some cases, the damage were simple interruptions. Meanwhile the damage caused onblades are 11%, it often corresponds with severe damage. The damages associated with lightning aregenerally blade rupturing and burnout, wire melting, surface cracking and delamination, lightningreceptor vaporization, and loss [19–25].
The most popular lightning protection model used nowadays for large turbines consist of aninternal down conductor and metal receptors or air terminators penetrating the surface of the bladeto serve as desired attachment points. These two systems are then connected together inside of theblade to carry the lightning current to earth. The receptors are installed at nearby the tip of the blade orplaced at equal distance from each other alongside the blade from the root to the tip.
One of the main issues with this type of protection is that since the receptors are small compared tothe blade planform area, it decreases the efficiency of the attachment of the lightning, causing damageon the surface of the blade [21–25].
Considering the distribution of the lightning attachment and damage along the blade, it can beseen that majority of the attachment occurs at the tip, and the percentage decreases as the distanceincreasing from the end of the blade. As it can be seen, around 60% of the total damage was located inthe last meter of the turbine blade, and 90% of the total damage occurred in the first 4 m [26].
Even though there are many different designs for the lightning protection of blades, there isstill potential room for improvement. On the interception of the lightning to the air terminations toincrease the effectiveness of the captured lightning flashes and on the down conduction part with theconnections of different parts to conduct the current safely to earth.
3.5. Blade Model for Investigation
The blade to be inspected was based on an existing model, currently the largest turbine on themarket Vestas V164-9.5MW [9], at present, produced for offshore, although the company is in theprocess for an onshore model with similar dimensions [27]. For this study, the length of the blades wasonly considered for the simulation. Although their lightning protection systems are compliant withIEC 61400-24 standards, the exact lightning protection system employed by the blade’s manufactureris not available in the public domain. However, as briefly discussed in Section 3.3, any wind turbineblades should be protected and complied as per methods proposed by IEC 61400-24 standards [7]. Fora structure this size, approximately with a tip height around 200 m above sea level, the number ofstrikes can be estimated considering the lightning density in Europe (between 0.1 and 42 flashes peryear per km2) [5,7].
The height of structure greatly affects the number of flashes predicted on the structure. Based onthe regular expected turbine lifetime, what is generally predicted to be 20–25 year, it is very likely thatthe turbine will be hit at least once during its lifetime. Without any protection, the blade will most likelybe destroyed. If the base cost lies between GBP 0.6–0.8 million per MW for an onshore turbine, andgenerally around 13% of these blades are [28], therefore, the estimated price for losing one blade wouldbe roughly GBP 300,000 on the aforementioned model, not calculating the replacement, transportation,and power outage caused costs. From this, it is clear that wind turbines require adequate protection

Appl. Sci. 2020, 10, 2130 5 of 18
against lightning strike nevertheless of their location, since even if it is estimated with the lowestdensity, over the expected lifetime the turbine will be struck at least one or two times.
4. ANSYS Workbench Implementation
4.1. ANSYS Workbench
Nowadays, engineering problems are becoming genuinely complex, relying only on theory, and.physical experiments are not practical anymore. Furthermore, deriving those with hand calculationsare rather complex and time consuming. Analysis Systems (ANSYS) is one of the most reputableengineering software analysis packages available on the market and is used by many companies andresearch facilities around the world. The software is based on finite element analysis (FEA) to solvecomplex problems in single or multiphysics environment.
The basic principle of the method is that the domain or object is divided into elements withdiscretization. The distribution of the elements is called mesh, and the points connecting the elementsare nodes. When the mesh is generated, an equation is generated for each element regarding withthe solvable physics or method of analyzation. The elemental equation is than assembled to a globalequation to describe the behavior of the body as a whole [29].
4.2. Blade and Protection Implementation
As briefly discussed in Sections 2 and 3, the wind turbine is a grounded structure, hence, thelightning current as a result of return stroke will then be passed safely to the ground through hub,nacelle, tower, and tower footing at the ground level. Hence, when lightning strike on the lightningreceptor installed on a blade, the ground is elevated to the highest tip at the time of strike due to theblade tip being at its highest point at a time. Thus, this assumption is also used by many other lightningresearchers around the world [1,3,4,8,10,14,15,19,20,26] and also for this study. Owing to that, singleblade was examined without any attachment to rotor and nacelle. The ANSYS Workbench version 18.2was used to carry out the simulation of the lightning protection of blade. The available software licensewas for Academic Research, which restricts the meshing node number to 300,000 which corresponds toaround 40,000 elements depending on the meshing algorithm chosen. As it was mentioned earlier, thesize base was taken from an existing model (Vestas V164-9.5 MW. The turbine had approximately 80 mlong blades; in the model it was extended slightly to represent a potential future size. As shown inFigure 1, the hollow blade design can be seen from what was modelled in ANSYS DesignModeler. Themodel measurements were 85 m long, 5 m wide, 2.6 m depth, 10 times base-to-tip ratio, and 0.015 mwall thickness. The current was applied at point A, meanwhile, points B and C were specified as 0 V.
Appl. Sci. 2020, 10, 2130 5 of 18
4. ANSYS Workbench Implementation
4.1. ANSYS Workbench
Nowadays, engineering problems are becoming genuinely complex, relying only on theory, and. physical experiments are not practical anymore. Furthermore, deriving those with hand calculations are rather complex and time consuming. Analysis Systems (ANSYS) is one of the most reputable engineering software analysis packages available on the market and is used by many companies and research facilities around the world. The software is based on finite element analysis (FEA) to solve complex problems in single or multiphysics environment.
The basic principle of the method is that the domain or object is divided into elements with discretization. The distribution of the elements is called mesh, and the points connecting the elements are nodes. When the mesh is generated, an equation is generated for each element regarding with the solvable physics or method of analyzation. The elemental equation is than assembled to a global equation to describe the behavior of the body as a whole [29].
4.2. Blade and Protection Implementation
As briefly discussed in Sections 2 and 3, the wind turbine is a grounded structure, hence, the lightning current as a result of return stroke will then be passed safely to the ground through hub, nacelle, tower, and tower footing at the ground level. Hence, when lightning strike on the lightning receptor installed on a blade, the ground is elevated to the highest tip at the time of strike due to the blade tip being at its highest point at a time. Thus, this assumption is also used by many other lightning researchers around the world [1,3,4,8,10,14,15,19,20,26] and also for this study. Owing to that, single blade was examined without any attachment to rotor and nacelle. The ANSYS Workbench version 18.2 was used to carry out the simulation of the lightning protection of blade. The available software license was for Academic Research, which restricts the meshing node number to 300,000 which corresponds to around 40,000 elements depending on the meshing algorithm chosen. As it was mentioned earlier, the size base was taken from an existing model (Vestas V164-9.5 MW. The turbine had approximately 80 m long blades; in the model it was extended slightly to represent a potential future size. As shown in Figure 1, the hollow blade design can be seen from what was modelled in ANSYS DesignModeler. The model measurements were 85 m long, 5 m wide, 2.6 m depth, 10 times base-to-tip ratio, and 0.015 m wall thickness. The current was applied at point A, meanwhile, points B and C were specified as 0 V.
Figure 1. Wind turbine blade for simulation. Figure 1. Wind turbine blade for simulation.

Appl. Sci. 2020, 10, 2130 6 of 18
The blade material was chosen to be E-glass fiber-reinforced polyester with the necessary valuesset manually [30,31] to serve as an insulator-type blade, the lightning conductor was set to the copperparameters taken from standards [12] with a 50 mm2 round cross-section as the minimal specifiedarea. For evaluation, one of the recommended method by IEC 61400-24 [7] was considered where thismethod was used previously for smaller turbines, although in this project, it was examined for largerturbine blade.
4.3. Simulation Setup
For the lightning attachment point, a part on the conductor at the tip of the blade was defined(point A). In the absence of specifying ground, 0 voltage was applied on the connecting ends of theconductor (points B and C (Figure 1)).
For simulation, electric, transient-thermal, and static structural analysis was chosen usingMechanical APDL solver [32]. As shown in Figure 2, the applied mechanical APDL structure can beseen. By connecting the electric, thermal, and structural sections, it was possible to transfer resultsfrom one stage to another, creating a complex simulation environment.
Appl. Sci. 2020, 10, 2130 6 of 18
The blade material was chosen to be E-glass fiber-reinforced polyester with the necessary values set manually [30,31] to serve as an insulator-type blade, the lightning conductor was set to the copper parameters taken from standards [12] with a 50 mm2 round cross-section as the minimal specified area. For evaluation, one of the recommended method by IEC 61400-24 [7] was considered where this method was used previously for smaller turbines, although in this project, it was examined for larger turbine blade.
4.3. Simulation Setup
For the lightning attachment point, a part on the conductor at the tip of the blade was defined (point A). In the absence of specifying ground, 0 voltage was applied on the connecting ends of the conductor (points B and C (Figure 1)).
For simulation, electric, transient-thermal, and static structural analysis was chosen using Mechanical APDL solver [32]. As shown in Figure 2, the applied mechanical APDL structure can be seen. By connecting the electric, thermal, and structural sections, it was possible to transfer results from one stage to another, creating a complex simulation environment.
Figure 2. Simulation setup for the model.
The first and subsequent return stroke current rise were implemented according to the current standards [12], with an additional ‘extreme’ level of first and subsequent return stroke and the effects were observed over set amount of time as tabulated in Table 1. The ‘extreme’ level used referred to the highest recorded lightning peak current [2,5].
Table 1. Test parameters for simulations showing the extreme case for LPL [23].
Type of Stroke Test Parameter Unit LPL
Extreme (0)
First 𝛥i kA 300 𝛥t µs 10
Subsequent 𝛥i kA 75 𝛥t µs 0.25
The ambient temperature was set to 20 °C, and the blade was set to be fixed at the base. For testing the proposed method, first, the cross-section of the down conductor area was set to the recommended minimum area which was then increased to 100 mm2 and to 200 mm2. Afterwards, as it has been mentioned in many publications [4,26,33–35] and stated in the standards [7], lightning tends to attach to the tip and to the close approximation of the blades. Therefore, to overcome the destructive heating effect of the lightning, especially at the attachment point on the conductor, a hybrid conductor has been designed. This design consisted of two conductors with different diameters joined together. The larger diameter covered the tip of the blade and ran down at a specific distance from the tip towards the root. The joints of the two conductors could be welded or the whole
Figure 2. Simulation setup for the model.
The first and subsequent return stroke current rise were implemented according to the currentstandards [12], with an additional ‘extreme’ level of first and subsequent return stroke and the effectswere observed over set amount of time as tabulated in Table 1. The ‘extreme’ level used referred to thehighest recorded lightning peak current [2,5].
Table 1. Test parameters for simulations showing the extreme case for LPL [23].
Type of Stroke Test Parameter UnitLPL
Extreme (0)
First∆i kA 300∆t µs 10
Subsequent ∆i kA 75∆t µs 0.25
The ambient temperature was set to 20 ◦C, and the blade was set to be fixed at the base. For testingthe proposed method, first, the cross-section of the down conductor area was set to the recommendedminimum area which was then increased to 100 mm2 and to 200 mm2. Afterwards, as it has beenmentioned in many publications [4,26,33–35] and stated in the standards [7], lightning tends to attachto the tip and to the close approximation of the blades. Therefore, to overcome the destructive heatingeffect of the lightning, especially at the attachment point on the conductor, a hybrid conductor hasbeen designed. This design consisted of two conductors with different diameters joined together. Thelarger diameter covered the tip of the blade and ran down at a specific distance from the tip towards

Appl. Sci. 2020, 10, 2130 7 of 18
the root. The joints of the two conductors could be welded or the whole conductor could be molded toachieve a better transition between the different thicknesses. In total, six case studies were examinedwith different diameters and a combination of conventional and hybrid methods:
Conventional:A: Minimal protection level with 50 mm2 conductor cross-section area;B: 100 mm2 conductor cross-section area;C: 200 mm2 conductor cross-section area.Hybrid:
D: Hybrid conductor design for tip;E: Hybrid conductor design, 2 m on sides;F: Hybrid conductor design, 5 m on sides.
The parameters examined from the simulation models were:
1. Voltage at the attachment point (V);2. Maximum value of Joule heating in the conductor (MW/m3);3. Current density at the attachment point (kA/m2);4. Maximum temperature generated by Joule heating in the conductor (◦C);5. Total deformation caused on the blade due to the heating effect (mm);
In addition to the existing parameters, another probe was added to hybrid design at the joints ofthe two conductors to follow the change in the current density:
6. Current density at joint (kA/m2).
5. Simulation Results and Discussion
5.1. Results from Conventional Case Studies
The graphical representation of the conventional design can be seen in Figure 3, where:
• Current density in the conductor;• Temperature generated by current;• Deformation caused by temperature.
Appl. Sci. 2020, 10, 2130 7 of 18
conductor could be molded to achieve a better transition between the different thicknesses. In total, six case studies were examined with different diameters and a combination of conventional and hybrid methods:
Conventional: A: Minimal protection level with 50 mm2 conductor cross-section area; B: 100 mm2 conductor cross-section area; C: 200 mm2 conductor cross-section area. Hybrid: D: Hybrid conductor design for tip; E: Hybrid conductor design, 2 m on sides; F: Hybrid conductor design, 5 m on sides. The parameters examined from the simulation models were:
1. Voltage at the attachment point (V); 2. Maximum value of Joule heating in the conductor (MW/m3); 3. Current density at the attachment point (kA/m2); 4. Maximum temperature generated by Joule heating in the conductor (°C); 5. Total deformation caused on the blade due to the heating effect (mm);
In addition to the existing parameters, another probe was added to hybrid design at the joints of the two conductors to follow the change in the current density:
6. Current density at joint (kA/m2).
5. Simulation Results and Discussion
5.1. Results from Conventional Case Studies
The graphical representation of the conventional design can be seen in Figure 3, where:
• Current density in the conductor; • Temperature generated by current; • Deformation caused by temperature.
As the current from the lightning strike runs from the striking point towards ground (0 V), it heats up the conductor and the blade at the contact surfaces. Due to thermal expansion, the blade and the conductor experience force which causes deformation in both bodies.
Figure 3. Graphical simulation results for conventional design; (a) 50 mm2 cross section area conductor,(b) 100 mm2 cross section area conductor; (c) 200 mm2 cross section area conductor.
Appl. Sci. 2020, 10, 2130 8 of 18
As the current from the lightning strike runs from the striking point towards ground (0 V), it heatsup the conductor and the blade at the contact surfaces. Due to thermal expansion, the blade and theconductor experience force which causes deformation in both bodies.
5.1.1. Case Study A: Minimal Protection Level with 50 mm2 Conductor Cross-Section Area
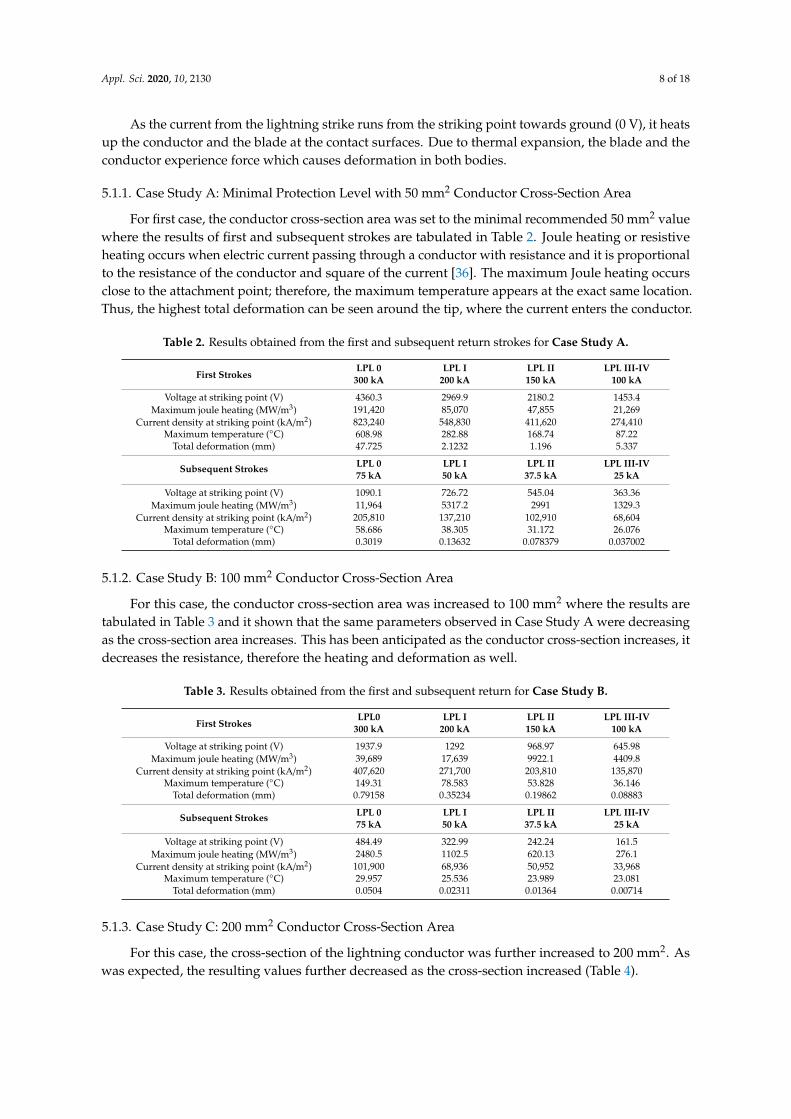
For first case, the conductor cross-section area was set to the minimal recommended 50 mm2 valuewhere the results of first and subsequent strokes are tabulated in Table 2. Joule heating or resistiveheating occurs when electric current passing through a conductor with resistance and it is proportionalto the resistance of the conductor and square of the current [36]. The maximum Joule heating occursclose to the attachment point; therefore, the maximum temperature appears at the exact same location.Thus, the highest total deformation can be seen around the tip, where the current enters the conductor.
Table 2. Results obtained from the first and subsequent return strokes for Case Study A.
First StrokesLPL 0 LPL I LPL II LPL III-IV
300 kA 200 kA 150 kA 100 kA
Voltage at striking point (V) 4360.3 2969.9 2180.2 1453.4Maximum joule heating (MW/m3) 191,420 85,070 47,855 21,269
Current density at striking point (kA/m2) 823,240 548,830 411,620 274,410Maximum temperature (◦C) 608.98 282.88 168.74 87.22
Total deformation (mm) 47.725 2.1232 1.196 5.337
Subsequent Strokes LPL 0 LPL I LPL II LPL III-IV75 kA 50 kA 37.5 kA 25 kA
Voltage at striking point (V) 1090.1 726.72 545.04 363.36Maximum joule heating (MW/m3) 11,964 5317.2 2991 1329.3
Current density at striking point (kA/m2) 205,810 137,210 102,910 68,604Maximum temperature (◦C) 58.686 38.305 31.172 26.076
Total deformation (mm) 0.3019 0.13632 0.078379 0.037002
5.1.2. Case Study B: 100 mm2 Conductor Cross-Section Area
For this case, the conductor cross-section area was increased to 100 mm2 where the results aretabulated in Table 3 and it shown that the same parameters observed in Case Study A were decreasingas the cross-section area increases. This has been anticipated as the conductor cross-section increases, itdecreases the resistance, therefore the heating and deformation as well.
Table 3. Results obtained from the first and subsequent return for Case Study B.
First StrokesLPL0 LPL I LPL II LPL III-IV
300 kA 200 kA 150 kA 100 kA
Voltage at striking point (V) 1937.9 1292 968.97 645.98Maximum joule heating (MW/m3) 39,689 17,639 9922.1 4409.8
Current density at striking point (kA/m2) 407,620 271,700 203,810 135,870Maximum temperature (◦C) 149.31 78.583 53.828 36.146
Total deformation (mm) 0.79158 0.35234 0.19862 0.08883
Subsequent Strokes LPL 0 LPL I LPL II LPL III-IV75 kA 50 kA 37.5 kA 25 kA
Voltage at striking point (V) 484.49 322.99 242.24 161.5Maximum joule heating (MW/m3) 2480.5 1102.5 620.13 276.1
Current density at striking point (kA/m2) 101,900 68,936 50,952 33,968Maximum temperature (◦C) 29.957 25.536 23.989 23.081
Total deformation (mm) 0.0504 0.02311 0.01364 0.00714
5.1.3. Case Study C: 200 mm2 Conductor Cross-Section Area
For this case, the cross-section of the lightning conductor was further increased to 200 mm2. Aswas expected, the resulting values further decreased as the cross-section increased (Table 4).
Appl. Sci. 2020, 10, 2130 9 of 18
Table 4. Results obtained from the first and subsequent return strokes for Case Study C.
First StrokesLPL0 LPL I LPL II LPL III-IV
300 kA 200 kA 150 kA 100 kA
Voltage at striking point (V) 1090 726.66 545 363.33Maximum joule heating (MW/m3) 13,389 5950.8 3347.3 1487.7
Current density at striking point (kA/m2) 302,270 201,510 151,130 100,760Maximum temperature (◦C) 65.017 41.118 32.754 26.78
Total deformation (mm) 0.27567 0.13922 0.079422 0.036739
Subsequent strokes LPL 0 LPL I LPL II LPL III-IV75 kA 50 kA 37.5 kA 25 kA
Voltage at striking point (V) 181.67 136.25 90.833 181.67Maximum joule heating (MW/m3) 371.93 209.21 92.982 371.93
Current density at striking point (kA/m2) 50,378 37,784 25,189 50,378Maximum temperature (◦C) 23.195 23.08 23.069 23.195
Total deformation (mm) 0.01129 0.00769 0.00523 0.01129
5.2. Results from Hybrid Case Studies
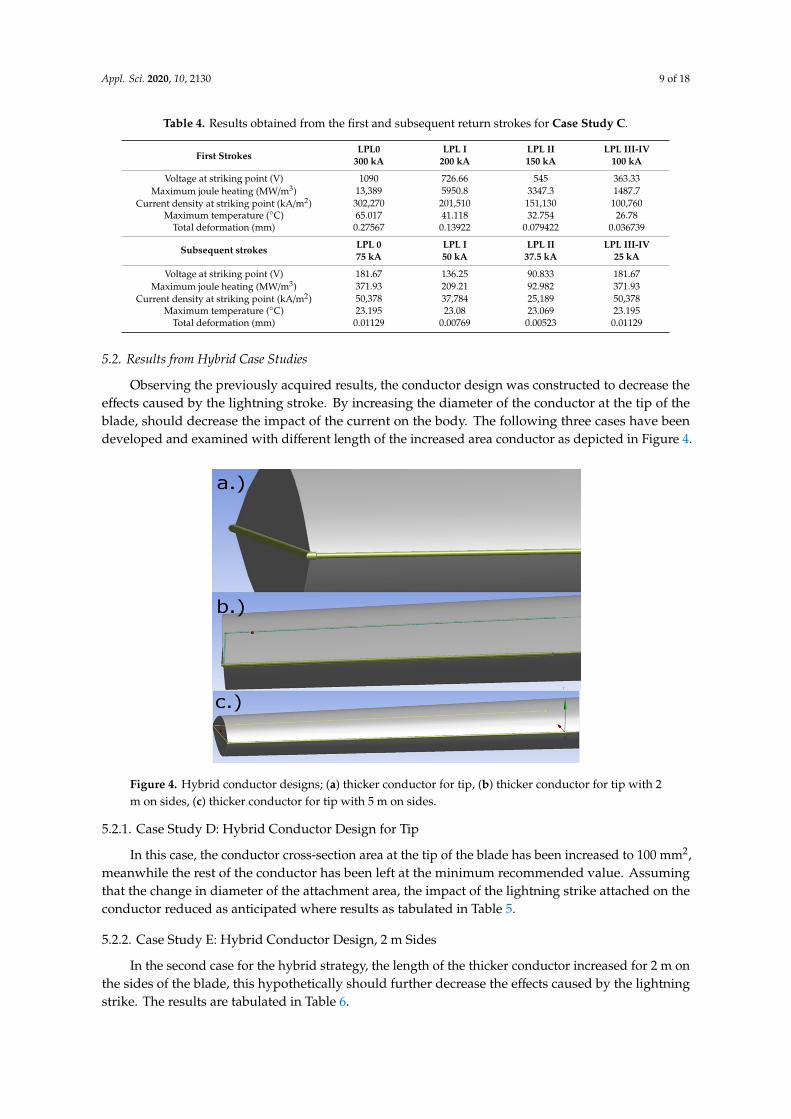
Observing the previously acquired results, the conductor design was constructed to decrease theeffects caused by the lightning stroke. By increasing the diameter of the conductor at the tip of theblade, should decrease the impact of the current on the body. The following three cases have beendeveloped and examined with different length of the increased area conductor as depicted in Figure 4.
Appl. Sci. 2020, 10, 2130 9 of 18
5.1.3. Case Study C: 200 mm2 Conductor Cross-Section Area
For this case, the cross-section of the lightning conductor was further increased to 200 mm2. As was expected, the resulting values further decreased as the cross-section increased (Table 4).
Table 4. Results obtained from the first and subsequent return strokes for Case Study C.
First Strokes LPL0 LPL I LPL II LPL III-IV
300 kA 200 kA 150 kA 100 kA Voltage at striking point (V) 1,090 726.66 545 363.33
Maximum joule heating (MW/m3) 13,389 5,950.8 3,347.3 1,487.7 Current density at striking point (kA/m2) 302,270 201,510 151,130 100,760
Maximum temperature (°C) 65.017 41.118 32.754 26.78 Total deformation (mm) 0.27567 0.13922 0.079422 0.036739
Subsequent strokes LPL 0 LPL I LPL II LPL III-IV 75 kA 50 kA 37.5 kA 25 kA
Voltage at striking point (V) 181.67 136.25 90.833 181.67 Maximum joule heating (MW/m3) 371.93 209.21 92.982 371.93
Current density at striking point (kA/m2) 50,378 37,784 25,189 50,378 Maximum temperature (°C) 23.195 23.08 23.069 23.195
Total deformation (mm) 0.01129 0.00769 0.00523 0.01129
5.2. Results from Hybrid Case Studies
Observing the previously acquired results, the conductor design was constructed to decrease the effects caused by the lightning stroke. By increasing the diameter of the conductor at the tip of the blade, should decrease the impact of the current on the body. The following three cases have been developed and examined with different length of the increased area conductor as depicted in Figure 4.
Figure 4. Hybrid conductor designs; (a) thicker conductor for tip, (b) thicker conductor for tip with 2m on sides, (c) thicker conductor for tip with 5 m on sides.
5.2.1. Case Study D: Hybrid Conductor Design for Tip
In this case, the conductor cross-section area at the tip of the blade has been increased to 100 mm2,meanwhile the rest of the conductor has been left at the minimum recommended value. Assumingthat the change in diameter of the attachment area, the impact of the lightning strike attached on theconductor reduced as anticipated where results as tabulated in Table 5.
5.2.2. Case Study E: Hybrid Conductor Design, 2 m Sides
In the second case for the hybrid strategy, the length of the thicker conductor increased for 2 m onthe sides of the blade, this hypothetically should further decrease the effects caused by the lightningstrike. The results are tabulated in Table 6.

Appl. Sci. 2020, 10, 2130 10 of 18
Table 5. Results obtained from the first and subsequent return strokes for Case Study D.
First StrokesLPL0 LPL I LPL II LPL III-IV
300 kA 200 kA 150 kA 100 kA
Voltage at striking point (V) 4354.3 2902.8 2177.7 1451.4Maximum joule heating (MW/m3) 341,640 151,840 85,411 37,961
Current density at striking point (kA/m2) 1,091,100 727,370 545,530 363,690Maximum temperature (◦C) 547.52 255.56 153.38 80.391
Total deformation (mm) 4.5937 2.043 1.502 0.5125Current density at joints (kA/m2) 2,715,500 1,810,400 1,357,800 905,180
Subsequent Strokes LPL 0 LPL I LPL II LPL III-IV75 kA 50 kA 37.5 kA 25 kA
Voltage at striking point (V) 1088.6 725.71 544.28 362.85Maximum joule heating (MW/m3) 21,353 9490.1 5338.2 2372.5
Current density at striking point (kA/m2) 272,760 181,840 136,380 90,922Maximum temperature (◦C) 54.845 36.598 30.211 25.649
Total deformation (mm) 0.2893 0.1299 0.0741 0.0343Current density at joints (kA/m2) 678,890 452,590 339,440 263,000
Table 6. Results obtained from the first and subsequent return strokes for Case Study E.
First StrokesLPL0 LPL I LPL II LPL III-IV
300 kA 200 kA 150 kA 100 kA
Voltage at striking point (V) 2773.4 1848.9 1386.7 924.45Maximum joule heating (MW/m3) 66,067 29,363 16,517 7340.8
Current density at striking point (kA/m2) 844,930 563,290 422,470 281,640Maximum temperature (◦C) 237.15 117.62 75.788 45.906
Total deformation (mm) 1.355 0.6034 0.3404 0.1525Current density at joints (kA/m2) 2,072,100 1,381,400 1,036,100 690,700
Subsequent Strokes LPL 0 LPL I LPL II LPL III-IV75 kA 50 kA 37.5 kA 25 kA
Voltage at striking point (V) 693.34 462.23 346.67 23.11Maximum joule heating (MW/m3) 4129.2 1631.3 1032.3 458.8
Current density at striking point (kA/m2) 211,230 140,820 105,620 70,411Maximum temperature (◦C) 35.447 27.978 25.362 23.494
Total deformation (mm) 0.0867 0.0398 0.0234 0.0118Current density at joints (kA/m2) 518,030 345,350 259,010 172,680
5.2.3. Case Study F: Hybrid Conductor Design, 5 m Sides
The thicker portion of the conductor has been further increased to 5 m on each side of the tip ofthe blade, in theory, further reducing the recorded values where results are tabulated in Table 7.
Table 7. Results obtained from the first and subsequent return strokes for Case Study F.
First StrokesLPL0 LPL I LPL II LPL III-IV
300 kA 200 kA 150 kA 100 kA
Voltage at striking point (V) 2691.2 1794.1 1345.6 897.06Maximum joule heating (MW/m3) 64,236 28,549 16,059 7137.3
Current density at striking point (kA/m2) 495,610 330,410 247,800 165,200Maximum temperature (◦C) 218.42 115.85 74.788 45.461
Total deformation (mm) 1.216 0.5420 0.3061 0.1376Current density at joints (kA/m2) 1,999,800 1,333,200 999,910 666,610
Subsequent Strokes LPL 0 LPL I LPL II LPL III-IV75 kA 50 kA 37.5 kA 25 kA
Voltage at striking point (V) 672.8 488.53 336.4 224.27Maximum joule heating (MW/m3) 4014.7 1784.3 1003.7 446.08
Current density at striking point (kA/m2) 123,900 82,601 61,951 41,301Maximum temperature (◦C) 35.197 27.865 25.299 23.466
Total deformation (mm) 0.0787 0.0366 0.0218 0.0114Current density at joints (kA/m2) 499,960 333,300 249,980 166,650

Appl. Sci. 2020, 10, 2130 11 of 18
5.3. Discussion
5.3.1. Conventional Cases (A, B, and C)
Based on the simulation results on the conventional type conductor tabulated in Tables 2–4, thecurrent density at the attachment point and total deformation (highest value at the tip of the blade)plot can be seen on Figure 5. Comparing the graphs, it can be seen that increasing the diameter of theconductor reduces the value of current density and the amount of deformation produced on the bladeas it can be expected. Although, further inspecting the results, the difference between the 100 mm2 andthe 200 mm2 cross-section area was less significant (34.8%) than the difference between the 50 mm2
and 100 mm2 (101.9%). Increasing the diameter of the conductor implied better results or lower values,although it was not linear compared to the change in diameter. Evaluating the results leads to theassumption that the 100 mm2 cross-section area produced the best results among the tested valuesaccording to the given LPL, considering the weight and cost of the usable material. Similar correlationscan be seen on the graphs from the rest of the results in Figure A1 (Appendix A).
Appl. Sci. 2020, 10, 2130 11 of 18
5.2.3. Case Study F: Hybrid Conductor Design, 5 m Sides
The thicker portion of the conductor has been further increased to 5 m on each side of the tip of the blade, in theory, further reducing the recorded values where results are tabulated in Table 7.
Table 7. Results obtained from the first and subsequent return strokes for Case Study F.
First Strokes LPL0 LPL I LPL II LPL III-IV
300 kA 200 kA 150 kA 100 kA Voltage at striking point (V) 2,691.2 1,794.1 1,345.6 897.06
Maximum joule heating (MW/m3) 64,236 28,549 16,059 7137.3 Current density at striking point (kA/m2) 495,610 330,410 247,800 165,200
Maximum temperature (°C) 218.42 115.85 74.788 45.461 Total deformation (mm) 1.216 0.5420 0.3061 0.1376
Current density at joints (kA/m2) 1,999,800 1,333,200 999,910 666,610
Subsequent Strokes LPL 0 LPL I LPL II LPL III-IV 75 kA 50 kA 37.5 kA 25 kA
Voltage at striking point (V) 672.8 488.53 336.4 224.27 Maximum joule heating (MW/m3) 4,014.7 1,784.3 1,003.7 446.08
Current density at striking point (kA/m2) 123,900 82,601 61,951 41,301 Maximum temperature (°C) 35.197 27.865 25.299 23.466
Total deformation (mm) 0.0787 0.0366 0.0218 0.0114 Current density at joints (kA/m2) 499,960 333,300 249,980 166,650
5.3. Discussion
5.3.1. Conventional Cases (A, B, and C)
Based on the simulation results on the conventional type conductor tabulated in Tables 2–4, the current density at the attachment point and total deformation (highest value at the tip of the blade) plot can be seen on Figure 5. Comparing the graphs, it can be seen that increasing the diameter of the conductor reduces the value of current density and the amount of deformation produced on the blade as it can be expected. Although, further inspecting the results, the difference between the 100 mm2 and the 200 mm2 cross-section area was less significant (34.8%) than the difference between the 50 mm2 and 100 mm2 (101.9%). Increasing the diameter of the conductor implied better results or lower values, although it was not linear compared to the change in diameter. Evaluating the results leads to the assumption that the 100 mm2 cross-section area produced the best results among the tested values according to the given LPL, considering the weight and cost of the usable material. Similar correlations can be seen on the graphs from the rest of the results in Figure A1.
Figure 5. Current density (left) and total deformation of the blade (right) for the conventional case studies. Figure 5. Current density (left) and total deformation of the blade (right) for the conventionalcase studies.
5.3.2. Hybrid Cases (D, E, and F)
As shown in Figure 6, the graphical representation of the simulation results can be seen for Case E.
Appl. Sci. 2020, 10, 2130 12 of 18
5.3.2. Hybrid Cases (D, E, and F)
As shown in Figure 6, the graphical representation of the simulation results can be seen for Case E.
Figure 6. Graphical simulation results, hybrid design (case study E); a) current density in the conductor, b) temperature generated by current, c) deformation caused by temperature
Based on the data tabulated in Tables 5–7, Figure 7 plotted the different current densities at different points comparing three different hybrid cases. When diameters increased, the current density reduced in the conductor as well as heating and deformation in the blade. On the other hand, at the joints of the two types of conductor, there was still an increment that could still be seen. Comparing the values of the three designs indicates that the tip only version reduces the effects of the stroke at the attachment point the least, although increasing the length of the higher diameter conductor reduces the current density at both the attachment point and at joint. The increase in current density between the attachment point and the joint, for case D, case E, and case F with 148.9%, 145.2%, and 303.5%, respectively, thus the possible damage due to the current flowing in the down conductors. This suggests that the most efficient way to improve the LPS would be to increase the overall diameter of the whole conductor.
Figure 7. Current density of hybrid case studies.
Figure 6. Graphical simulation results, hybrid design (case study E); (a) current density in the conductor,(b) temperature generated by current, (c) deformation caused by temperature.

Appl. Sci. 2020, 10, 2130 12 of 18
Based on the data tabulated in Tables 5–7, Figure 7 plotted the different current densities atdifferent points comparing three different hybrid cases. When diameters increased, the current densityreduced in the conductor as well as heating and deformation in the blade. On the other hand, at thejoints of the two types of conductor, there was still an increment that could still be seen. Comparingthe values of the three designs indicates that the tip only version reduces the effects of the strokeat the attachment point the least, although increasing the length of the higher diameter conductorreduces the current density at both the attachment point and at joint. The increase in current densitybetween the attachment point and the joint, for case D, case E, and case F with 148.9%, 145.2%, and303.5%, respectively, thus the possible damage due to the current flowing in the down conductors.This suggests that the most efficient way to improve the LPS would be to increase the overall diameterof the whole conductor.
Appl. Sci. 2020, 10, 2130 12 of 18
5.3.2. Hybrid Cases (D, E, and F)
As shown in Figure 6, the graphical representation of the simulation results can be seen for Case E.
Figure 6. Graphical simulation results, hybrid design (case study E); a) current density in the conductor, b) temperature generated by current, c) deformation caused by temperature
Based on the data tabulated in Tables 5–7, Figure 7 plotted the different current densities at different points comparing three different hybrid cases. When diameters increased, the current density reduced in the conductor as well as heating and deformation in the blade. On the other hand, at the joints of the two types of conductor, there was still an increment that could still be seen. Comparing the values of the three designs indicates that the tip only version reduces the effects of the stroke at the attachment point the least, although increasing the length of the higher diameter conductor reduces the current density at both the attachment point and at joint. The increase in current density between the attachment point and the joint, for case D, case E, and case F with 148.9%, 145.2%, and 303.5%, respectively, thus the possible damage due to the current flowing in the down conductors. This suggests that the most efficient way to improve the LPS would be to increase the overall diameter of the whole conductor.
Figure 7. Current density of hybrid case studies. Figure 7. Current density of hybrid case studies.
As shown in Figure 8, on the left, the maximum temperature of the blade, which was measured atconductor joints and on the right the total deformation caused on the blade, where the highest measuredvalue was at the tip of the blade. It shows that there was no significant reduction in temperatureand deformation between the 2 m and 5 m type (8% for temperature and 11.4% for deformation),although, the maximum temperature point moved from the area of attachment point to the joints ofthe two conductor. Comparing the three tested designs’ results, the 2 m long conductor is suggested tobe the most sufficient of all, considering the amount of material involved and the improvement intemperature, thus reduction in deformation too. The rest of the results can be seen in Figure A2.
Appl. Sci. 2020, 10, 2130 13 of 18
As shown in Figure 8, on the left, the maximum temperature of the blade, which was measured at conductor joints and on the right the total deformation caused on the blade, where the highest measured value was at the tip of the blade. It shows that there was no significant reduction in temperature and deformation between the 2 m and 5 m type (8% for temperature and 11.4% for deformation), although, the maximum temperature point moved from the area of attachment point to the joints of the two conductor. Comparing the three tested designs’ results, the 2 m long conductor is suggested to be the most sufficient of all, considering the amount of material involved and the improvement in temperature, thus reduction in deformation too. The rest of the results can be seen in Figure A2.
Figure 8. Maximum temperature (left) and total deformation of the blade (right) for the hybrid case studies.
5.3.3. Conventional and Hybrid
As shown in Figure 9, on the left, the maximum temperature of the blade, meanwhile on the right, the total deformation caused on the blade, where the highest measured value was at the tip of the blade. It can be seen that both the B and E cases performed better compared to the minimal conductor cross-section area in terms of temperature increment and blade deformation. For LPL 0, the temperature difference between Case B and A was 459.67 °C (307.86%), meanwhile between Case E and A it was 371.83 °C (156.79%), furthermore, the temperature difference between Case B and E is 87.74 °C. Furthermore, the temperature increase is linearly proportional to the deformation and the changes for deformation are nearly identical.
Figure 9. Maximum temperature (left) and total deformation (right) of the blade at A, B, and E case studies.
Figure 8. Maximum temperature (left) and total deformation of the blade (right) for the hybridcase studies.

Appl. Sci. 2020, 10, 2130 13 of 18
5.3.3. Conventional and Hybrid
As shown in Figure 9, on the left, the maximum temperature of the blade, meanwhile on theright, the total deformation caused on the blade, where the highest measured value was at the tipof the blade. It can be seen that both the B and E cases performed better compared to the minimalconductor cross-section area in terms of temperature increment and blade deformation. For LPL 0, thetemperature difference between Case B and A was 459.67 ◦C (307.86%), meanwhile between Case Eand A it was 371.83 ◦C (156.79%), furthermore, the temperature difference between Case B and E is87.74 ◦C. Furthermore, the temperature increase is linearly proportional to the deformation and thechanges for deformation are nearly identical.
Appl. Sci. 2020, 10, 2130 13 of 18
As shown in Figure 8, on the left, the maximum temperature of the blade, which was measured at conductor joints and on the right the total deformation caused on the blade, where the highest measured value was at the tip of the blade. It shows that there was no significant reduction in temperature and deformation between the 2 m and 5 m type (8% for temperature and 11.4% for deformation), although, the maximum temperature point moved from the area of attachment point to the joints of the two conductor. Comparing the three tested designs’ results, the 2 m long conductor is suggested to be the most sufficient of all, considering the amount of material involved and the improvement in temperature, thus reduction in deformation too. The rest of the results can be seen in Figure A2.
Figure 8. Maximum temperature (left) and total deformation of the blade (right) for the hybrid case studies.
5.3.3. Conventional and Hybrid
As shown in Figure 9, on the left, the maximum temperature of the blade, meanwhile on the right, the total deformation caused on the blade, where the highest measured value was at the tip of the blade. It can be seen that both the B and E cases performed better compared to the minimal conductor cross-section area in terms of temperature increment and blade deformation. For LPL 0, the temperature difference between Case B and A was 459.67 °C (307.86%), meanwhile between Case E and A it was 371.83 °C (156.79%), furthermore, the temperature difference between Case B and E is 87.74 °C. Furthermore, the temperature increase is linearly proportional to the deformation and the changes for deformation are nearly identical.
Figure 9. Maximum temperature (left) and total deformation (right) of the blade at A, B, and E case studies. Figure 9. Maximum temperature (left) and total deformation (right) of the blade at A, B, and Ecase studies.
Comparing Cases B and E, the results showed that Case B suggests the most effective conductordesign in terms of temperature and displacement, also the other measured parameters.
5.3.4. Summary
Comparing results obtained from Case Studies, it can be deduced that the most efficient way ofincreasing the efficiency of the protection of a wind turbine blade is to increase the diameter of thedown conductor. However, it will be compromised due to the actual cost of the extra material, theweight increasement and the possible effects on the airfoil of the blades as these factors are the mostcrucial in blade design. Furthermore, applying Case E to a modern turbine blade could potentiallyreduce the effects of the heat and deformation because it only requires small portion of the conductorin the tip region. In general, most turbines are glued together at the leading and trailing edge to reducethe manufacturing costs, this brings an issue since the down conductors placed along these lines. Asthe current heats up the conductor, this could possibly melt the applied glue material causing severedamage which may cause blade to separate. As to potentially alleviate this, it would be possible toimplement the hybrid conductor design for the blade lightning protection.
6. Conclusions, Recommendations for Future Works
6.1. Conclusions
Lightning protection is an important aspect of wind energy, since over the expected lifetime of aturbine; at least once a lightning will hit it. Due to the enormous amount of current, without properprotection, it is most likely to result failure to turbine and will cause high repair costs. The protectionmethods and levels are proposed by standards to achieve the minimal protection suggested, althoughthis protection cannot be taken as guarantee for all cases. As wind turbines keep increase in size to

Appl. Sci. 2020, 10, 2130 14 of 18
keep up with the generation demand, as the chance increases, of being hit by a lightning due to theirelevation from ground level.
In this paper, a conventional lightning protection concept, previously used for smaller turbinemodels has been evaluated for possible use for large blades. For the task, simulation software, ANSYSWorkbench, Mechanical APDL has been used. In the first three case studies, different conductorcross-section areas have been set for conventional design for full length of the conductor. For thesecond half of the case studies a hybrid conductor model was evaluated. This design consists of twoconductors with different diameters joined together. The higher diameter one covered the tip of theblade and ran down at specific distance from the tip towards the root. The lightning parameters wasset according to the current standards, with and additional extreme first and subsequent return strokecurrent amplitude. Comparing the simulation outcomes has been showed that Case Study C indicatedthe most promising results among all. In the other hand considering the weight and cost of the extramaterial, also the possible aerodynamical effects of the conductor around the blade, Case Study Ehas been appeared to be the most adequate alternative. The design shows great improvement inreducing the lightning caused effects, compared to Case Study A, therefore the possible damage on theblade. Furthermore, it only requires simple modification of the existing lightning protection concept,minimizing the associated costs, weight, and the possible disturbance in the aerodynamics of the blade.
6.2. Recommendations for Future Work
There are still many factors and values that should be evaluated in order to give full understandingand clarification of the proposed design.
• One possible future work could include the examination of electromagnetic forces and wavesgenerated by the current, since those were excluded from the simulation due to missing MechanicalAPDL functions (electromagnetic analysis system).
• There are possible incorrect, unrealistic values presented in this work due to the potentialmisconfiguration of simulation physics in the absence of relatable guide.
• The software used had limited solver size due to academic license; therefore, the mesh of theobjects had to be left coarse, meaning less accurate and possible differences in expected and reallife values.
• The design and therefore the investigation could be extended to model a complete turbine to seethe effects on the whole structure.
• The exact length of the increased diameter conductor could be evaluated in the ratio of the sizeof the blade; therefore, the proposed design could be implemented on various size blades withmaximum efficiency.
• A comparison could be made with existing blade LPS what is used on large blades nowadays toestimate the efficiency of both designs.
Author Contributions: Conceptualization, A.S.A.; Data curation, A.S.A.; Formal analysis, V.M.; Fundingacquisition, F.M.-S., A.S.M.S. and J.A.A.-R.; Investigation, V.M. and A.S.A.; Methodology, A.S.A.; Resources, A.S.A.;Software, A.S.A.; Supervision, A.S.A.; Validation, A.S.A.; Visualization, A.S.A. and F.M.-S.; Writing—original draft,V.M.; Writing—review and editing, V.M., A.S.A., F.M.-S., M.Z., M.N.M., A.S.M.S. and J.A.A.-R. All authors haveread and agreed to the published version of the manuscript.
Funding: Part of the work presented in this research study funded by the Agencia Nacional de Investigación yDesarrollo (through the project Fondecyt regular 1200055 and the project Fondef ID19I10165), project PI_m_19_01(UTFSM) and by Universiti Kuala Lumpur under the Short Term Research Grant (STRG) STR18022.
Conflicts of Interest: The authors declare no conflict of interest.

Appl. Sci. 2020, 10, 2130 15 of 18
Appendix A
Appl. Sci. 2020, 10, 2130 15 of 18
• The software used had limited solver size due to academic license; therefore, the mesh of the objects had to be left coarse, meaning less accurate and possible differences in expected and real life values.
• The design and therefore the investigation could be extended to model a complete turbine to see the effects on the whole structure.
• The exact length of the increased diameter conductor could be evaluated in the ratio of the size of the blade; therefore, the proposed design could be implemented on various size blades with maximum efficiency.
• A comparison could be made with existing blade LPS what is used on large blades nowadays to estimate the efficiency of both designs.
Author Contributions: Conceptualization, A.S.A.; Data curation, A.S.A.; Formal analysis, V.M.; Funding acquisition, F.M.-S., A.S.M.S. and J.A.A.-R.; Investigation, V.M. and A.S.A.; Methodology, A.S.A.; Resources, A.S.A.; Software, A.S.A.; Supervision, A.S.A.; Validation, A.S.A.; Visualization, A.S.A. and F.M.-S.; Writing—original draft, V.M.; Writing—review and editing, V.M., A.S.A., F.M.-S., M.Z., M.N.M., A.S.M.S. and J.A.A.-R. All authors have read and agreed to the published version of the manuscript.
Funding: Part of the work presented in this research study funded by the Agencia Nacional de Investigación y Desarrollo (through the project Fondecyt regular 1200055 and the project Fondef ID19I10165), project PI_m_19_01 (UTFSM) and by Universiti Kuala Lumpur under the Short Term Research Grant (STRG) STR18022.
Conflicts of Interest: The authors declare no conflict of interest.
Appendix
Figure A1. Plotted results from conventional simulations. Figure A1. Plotted results from conventional simulations.

Appl. Sci. 2020, 10, 2130 16 of 18
Appl. Sci. 2020, 10, 2130 16 of 18
Figure A2. Plotted results from hybrid simulations.
References
1. Cooray, V. An Introduction to Lightning; Springer: Heidelberg, Germany, 2015. 2. NSSDC. Sun Fact Sheet. Available online: https://nssdc.gsfc.nasa.gov/planetary/factsheet/sunfact.html
(accessed on 2 October 2018). 3. Rakov, V.A.; Uman, M.A. Lightning: Physics and Effects; Cambridge University Press: Cambridge, UK, 2003. 4. Cooray, V. Lightning Protection; The Institution of Engineering and Technology: London, UK, 2010. 5. The Weather Channel. Where Almost 9 Billion Lightning Strikes in 5 Years Have Happened on Earth.
Available online: https://weather.com/safety/thunderstorms/news/2018-05-07-world-lightning-strikes-map-vaisala-2013-2017 (accessed on 2 February 2019).
6. Anderson, G.; Klugmann, D. European lightning density analysis using 5 years of ATDnet data. Nat. Hazards Earth Syst. Sci. 2014, 14, 815–829.
7. Technical Committee PEL/88,, Wind Turbines Part. 24: Lightning Protection, BS EN 61400-24:2019, The British Standards Institution, London, UK, 2019
8. Uman, M.A. The Lightning Discharge; Dover Publications, Inc.: Mineola, NY, USA, 2001. 9. HMI Vestas Offshore Wind. The World’s Most Powerful Available Wind Turbine Gets Major Power Boost.
Available online: http://www.mhivestasoffshore.com/worlds-most-powerful-available-wind-turbine-gets-major-power-boost/ (accessed on 5 February 2019)
10. Hu, W. Advanced Turbine Wind Technology; Springer: Ithaca, NY, USA, 2018.
Figure A2. Plotted results from hybrid simulations.
References
1. Cooray, V. An Introduction to Lightning; Springer: Heidelberg, Germany, 2015.2. NSSDC. Sun Fact Sheet. Available online: https://nssdc.gsfc.nasa.gov/planetary/factsheet/sunfact.html
(accessed on 2 October 2018).3. Rakov, V.A.; Uman, M.A. Lightning: Physics and Effects; Cambridge University Press: Cambridge, UK, 2003.4. Cooray, V. Lightning Protection; The Institution of Engineering and Technology: London, UK, 2010.5. The Weather Channel. Where Almost 9 Billion Lightning Strikes in 5 Years Have Happened on Earth.
Available online: https://weather.com/safety/thunderstorms/news/2018-05-07-world-lightning-strikes-map-vaisala-2013-2017 (accessed on 2 February 2019).
6. Anderson, G.; Klugmann, D. European lightning density analysis using 5 years of ATDnet data. Nat. HazardsEarth Syst. Sci. 2014, 14, 815–829. [CrossRef]
7. Technical Committee PEL/88. Wind Turbines Part. 24: Lightning Protection, BS EN 61400-24:2019; The BritishStandards Institution: London, UK, 2019.
8. Uman, M.A. The Lightning Discharge; Dover Publications, Inc.: Mineola, NY, USA, 2001.

Appl. Sci. 2020, 10, 2130 17 of 18
9. HMI Vestas Offshore Wind. The World’s Most Powerful Available Wind Turbine Gets Major Power Boost.Available online: http://www.mhivestasoffshore.com/worlds-most-powerful-available-wind-turbine-gets-major-power-boost/ (accessed on 5 February 2019).
10. Hu, W. Advanced Turbine Wind Technology; Springer: Ithaca, NY, USA, 2018.11. Czeshop. Wind Turbine Blade Cross Section. Available online: http://czeshop.info/2017/wind-turbine-blade-
cross-section.html (accessed on 10 February 2019).12. Technical Committee GEL/81. Protection against Lightning Part. 1: General Principles, BS EN 62305-1:2011; The
British Standards Institution: London, UK, 2017.13. Cooray, V. Lightning Protection; Athenaeum Press Ltd.: Gateshead, UK, 2010.14. Barwise, A. Lightning and Surge Protection for Wind Turbines. Available online: https://www.ee.co.za/
article/lightning-surge-protection-wind-turbines-2.html (accessed on 21 February 2019).15. Wilson, N.; Myers, J.; Cummins, K.L.; Hutchinson, M.; Nag, A. Lightning attachment to wind turbines in
Central Kansas: Video observations, correlation with the NLDN and in-situ peak current measurements. InProceedings of the European Wind Energy Conference Exhibition EWEC 2013, Vienna, Austria, 4–7 February2013.
16. Cummins, K.L.; Zhang, D.; Quick, M.G.; Garolera, A.C.; Myers, J. Overview of the Kansas Windfarm2013Field Program. In Proceedings of the 23rd International Lightning Detection Conference (ILDC), Tucson, AZ,USA, 18–19 March 2014.
17. Wang, D.; Takagi, N.; Watanabe, T.; Sakurano, H.; Hashimoto, M. Observed characteristics of upward leadersthat are initiated from a windmill and its lighting protection tower. Geophys. Res. Lett. 2008, 35. [CrossRef]
18. Ishii, M.; Saito, M.; Natsuno, D.; Sugita, A. Lighting current observed at wind turbines at winter in Japan. InProceedings of the International Conference on Lightning & Static Electricity ICLOSE 2013, Seattle, WA,USA, 18–20 September 2013.
19. Yasuda, Y.; Yokoyama, S.; Minowa, M. Classification of Lightning Damage to Wind Turbine Blades. IEEJTrans. Electr. Electr. Eng. 2012, 7, 559–566. [CrossRef]
20. Sorensen, T.; Jensen, F.V.; Raben, N. Lightning protection for offshore wind turbines. In Proceedings ofthe 16th International Conference & Exhibition on Electricity Distribution, Amsterdam, The Netherlands,18–21 June 2001.
21. Solacity. Lightning Protection. Available online: https://www.solacity.com/lightning-protection/ (accessedon 30 March 2019).
22. Yasuda, Y.; Yokoyama, S. Proposal of Lightning Damage Classification to Wind Turbine Blades. In Proceedingsof the 7th Asia Pacific International Conference on Lightning (APL), Chengdu, China, 1–4 November 2011;pp. 368–371.
23. GlobalBladeService. Lightning Damage. Available online: https://www.globalbladeservice.eu/blade-service/
lightning-damage (accessed on 31 March 2019).24. Gorgeouswithattitude. 1st Blade Wends Way to Wind Farm. Available online: http://gorgeouswithattitude.
blogspot.com/2010/09/1st-blade-wends-way-to-wind-farm.html (accessed on 31 March 2019).25. EPSRC, Lightning Protection of Wind Turbine. Available online: https://community.dur.ac.uk/
supergen.wind/docs/presentations/2010-04-25_1425_EWEC%202010_SideEvent_Lightning_VP.pdf (accessedon 31 March 2019).
26. Garolera, A.C.; Madsen, S.F.; Nissim, M.; Myers, J.D.; Holboell, J. Lightning Damage to Wind Turbine BladesFrom Wind Farms in the U.S. IEEE Trans. Power Deliv. 2016, 31, 1043–1049. [CrossRef]
27. MHI Vestas Offshore Wind A/S. V164-9.5 MW. Available online: http://www.mhivestasoffshore.com/category/
v164-9-5-mw/ (accessed on 24 February 2019).28. Schubel, P.J. Technical cost modelling for a generic 45-m wind turbine blade producedby vacuum infusion
(VI). Renew. Energy 2010, 35, 183–189. [CrossRef]29. Alawadhi, E.M. Finite Element Simulations Using ANSYS, 2nd ed.; CRC Press: Boca Raton, FL, USA, 2015.30. AZoNetwork. E-Glass Fibre. Available online: https://www.azom.com/properties.aspx?ArticleID=764
(accessed on 25 February 2019).31. MatWeb. Glass Fiber Summary List. Available online: http://www.matweb.com/search/DataSheet.aspx?
MatGUID=5c6df0ae272e41808562d3374d7b4f5a&ckck=1 (accessed on 28 February 2019).32. ANSYS, Inc. Analysis Types. Available online: https://www.sharcnet.ca/Software/Ansys/18.2.2/en-us/help/
wb_sim/ds_simulation_types.html (accessed on 2 March 2019).

Appl. Sci. 2020, 10, 2130 18 of 18
33. Heidler, F.; Flisowski, Z.; Zischank, W.; Bouquegneau, C. Parameters of lightning current given in IEC62305–Background, experience and outlook. In Proceedings of the 29th International Conference on LightningProtection ICLP 2008, Uppsala, Sweden, 23–26 June 2008.
34. Guo, Z.; Li, Q.; Ma, Y. Experimental study on lightning attachment manner to wind turbine blades withlightning protection system. IEEE Trans. Plasma Sci. 2019, 47, 635–646. [CrossRef]
35. Arif, W.; Li, Q.; Guo, Z.; Ellahi, M.; Wang, G.; Siew, W.H. Experimental study on lightning dischargeattachment to the modern wind turbine blade with lightning protection system. In Proceedings of the 13thInternational Conference on Emerging Technologies (ICET), Islamabad, Pakistan, 27–28 December 2017;pp. 1–6.
36. Young, J.H. Steady state Joule heating with temperature dependent conductivities. Appl. Sci. Res. 1986, 43,55–65. [CrossRef]
© 2020 by the authors. Licensee MDPI, Basel, Switzerland. This article is an open accessarticle distributed under the terms and conditions of the Creative Commons Attribution(CC BY) license (http://creativecommons.org/licenses/by/4.0/).