Embed Size (px)
Citation preview
General rights Copyright and moral rights for the publications made accessible in the public portal are retained by the authors and/or other copyright owners and it is a condition of accessing publications that users recognise and abide by the legal requirements associated with these rights.
Users may download and print one copy of any publication from the public portal for the purpose of private study or research.
You may not further distribute the material or use it for any profit-making activity or commercial gain
You may freely distribute the URL identifying the publication in the public portal If you believe that this document breaches copyright please contact us providing details, and we will remove access to the work immediately and investigate your claim.
Downloaded from orbit.dtu.dk on: Apr 11, 2020
Lightning protection of flap system for wind turbine blades
Candela Garolera, Anna
Publication date:2014
Document VersionPublisher's PDF, also known as Version of record
Link back to DTU Orbit
Citation (APA):Candela Garolera, A. (2014). Lightning protection of flap system for wind turbine blades. DTU Elektro.

Anna Candela Garolera
Lightning protection of flap system for wind
turbine blades
PhD Thesis
September 2014
Lightning Protection of Flap System for Wind Turbine Blades PhD Thesis
This thesis was prepared by Anna Candela Garolera Supervisor: Joachim Holbøll, DTU-Elektro External Supervisor: Søren Find Madsen, Global Lightning Protection Services A/S Department of Electrical Engineering Centre for Electric Power and Energy (CEE) Technical University of Denmark Elektrovej 325 DK-2800 Kgs. Lyngby Denmark www.elektro.dtu.dk/cee Tel: (+45) 45 25 35 00 Fax: (+45) 45 88 61 11 E-mail: [email protected]
Release date:
September 2014
Category 1 (Public)
Edition:
First
Comments:
This report is a part of the requirements to achieve the Doctor of Philosophy (Ph.D.) at the Technical University of Denmark.
Rights:
© Anna Candela Garolera 2014
i
Preface
This thesis is the result of three years of research within the field of lightning
protection of wind turbine blades. The report contains the main results of the field
observations, analytical models and experimental work, which has been conducted as
part of a EUDP project no. 64010-0458 entitled “Industrial adaptation of a prototype
flap system for wind turbines” leaded by DTU-Wind Energy, with the collaboration of
the industrial partners Rehau, AVN and Dansk Gummi.
All the content of this thesis has been produced by the author, either individually or in
collaboration with academic and industrial partners, during the three years of the PhD.
The thesis has been carried out in three main locations, at the Technical University of
Denmark in Kgs. Lyngby, at Global Lightning Protection Services in Hedehusene and
Herning, and at EDP-Renewables North America in Houston, Texas, for a 4 months
external stay.
The Technical University of Denmark, Department of Electrical Engineering, was the
main location during the course of the PhD. Most of the research, comprising computer
modeling, experiments at the high voltage laboratory, technical discussion with the
supervisors of the thesis, as well as other PhD duties, including teaching and
supervision of students, took place at DTU in Lyngby. Additionally, bi-annual
meetings were held in Risø-DTU, where all the partners of the EUDP project shared the
progress of the research.
At Global Lightning Protection Services periodical meetings were held in the offices
of Lejre/Hedehusene to discuss the development of numerical tools to simulate the
lightning process in the office. Furthermore, a full scale blade specimen was tested at
the high voltage laboratory in Herning.
As part of the PhD, an external stay of 4 months was carried out at EDP-Renewables
North America. The study performed in collaboration with EDPR consisted in the

ii
analysis of field data and was carried out at the headquarters of EDPR in Houston,
Texas.
Furthermore, during the course of the PhD there was the opportunity to participate
several international conferences and other relevant events, including the meetings for
the maintenance of the standard IEC 61400-24 on Lightning protection of wind
turbines, involving travelling over the world and meet academic and industrial
specialists within the field of lightning physics and lightning protection.
The content of the thesis has contributed with 3 journal papers and 5 conference
papers. The list of these publications is included in the Appendix.
iii
Acknowledgements
Foremost, I would like to thank my supervisors Joachim Holbøll, from the Technical
University of Denmark, and Søren Find Madsen, from Global Lightning Protection
Services A/S, for their guidance and support during the three years of the PhD.
I would also like to thank all the partners involved in the EUDP project, including
DTU –Wind Energy, Rehau, AVN and Dansk Gummi. Thanks to Helge Madsen, for
coordinating the work within the project, and to Jacob Christensen and Thomas
Andersen for manufacturing a prototype for lightning tests.
I want to express my gratitude to all the team in Global Lightning Protection Services
for helping me in many issues related to my PhD. A special thanks to Søren Find
Madsen for his active interest in my research and for sharing with me his knowledge
and thoughts about lightning protection, to Casper Mieritz for his useful advice on
modeling tools, to Kim Bertelsen for arranging my external stay in EDP-Renewables
North America and to the colleagues at the high voltage laboratory in Herning for their
help with my Phd tests.
A warm thanks to all the colleagues in the Center of Electrical Power and Energy for
making my everyday work at DTU very smooth and pleasant. Thanks to Flemming Juul
Pedersen for many hours shared at the high voltage laboratory, where he trained me in
high voltage techniques while encouraging me to speak Danish. Thanks also to my
fellow PhD students Tilman and Matthew for sharing research pains and joys, as well as
nice lunches and Friday beers during the last three years.
I would like to thank the team in EDP-Renewables, in particular Maya Nissim and
Jackson Myers, for making my external stay very enjoyable. A special thanks to Prof.
Kenneth Cummins from the University of Arizona for his valuable contribution in the
research on lightning detection performed at EDPR.
Many thanks to Salvador Pineda and Juan Miguel Morales for their priceless advice in
many issues related to the academic research, which truly improved the quality of my

iv
PhD work. I also want to thank Lars Bo Hansen from LM Wind Power for his interest
in my work and for providing samples of blade material for testing.
I am deeply grateful to my family and friends for their love and support, especially to
my father, my brother and auntie Núria, and to Iñaki, who conveyed to me his passion
for high voltage engineering. Many thanks to Núria, Anna, Maria, Aràlia and Dani in
Spain, and Salva, Juanmi, Judit, Isaac, Anna and Sergi in Denmark for your care and
patience during the months I have been absorbed in the PhD research.
Finally and above all, I would like to thank my mother, who passed away recently, for
she always encouraged and supported all my projects and decisions, also the pursuit of
this PhD.
Kgs. Lyngby, September 2014
Anna Candela Garolera

v
Abstract
The aim of this PhD project was to investigate the behaviour of a Controllable Rubber
Trailing Edge Flap (CRTEF) in a wind turbine blade when it is exposed to lightning
discharges, and find the best technical solution to protect the CRTEF and the controlling
system against lightning, based on the results of simulation models and high voltage
tests.
Wind turbines are a common target of lightning due to their height and location, and
blades are the components most exposed to direct discharges. Protecting the blades
against lightning is specially challenging, mainly because of the combination of
insulating, semi-conductive and conductive materials in their structure. For this reason,
the installation of a CRTEF in a blade requires a careful assessment of risks related to
lightning strikes.
The study of the lightning effects in the CRTEF system comprised the analysis of the
discharge attachment, the current transmission, including the study of the induced
electromagnetic fields, and the effects of degradation of the flap material due to the
exposure to the lightning high electric fields. The main tools for this analysis were the
simulation by the finite elements method and testing in the high voltage laboratory.
The purpose of the FEM simulation was to obtain reliable models correlated with
experimental results, to determine different parameters related to lightning strike
effects, such as electric field enhancement, current distribution and temperature
increase.
The high voltage laboratory work included testing of materials, small samples, model
testing and full size testing of prototype elements. Particular emphasis was placed on
the tests on rubber material, in order to determine its resistance to erosion due to direct
and indirect effects of lightning.
The results of both simulation and testing, as well as general the general principles of
lightning protection and the experience acquired in the analysis of lightning damages in
field performed during the PhD, were the base for the design and validation of an
vi
effective and reliable lightning protection for the flap. Regarding the design, the
employment of conductive materials in internal components of the blade was avoid
whenever possible, in particular the outermost meters of the blade tip, where the risk of
lightning attachment is lower. Concerning the validation of the prototype, a blade
equipped with the flap system and lightning protection was subjected to high voltage
tests with satisfactory results. Aging tests were also applied to the flap rubber material,
revealing that the material is expected to have at least the same capability as the
fiberglass materials to withstand the high electric fields caused by lightning.
This PhD is part of a broader, EUDP funded project, whose overall objective was to
develop a prototype active trailing edge flap system for a wind turbine blade which
constitutes a complete, reliable and robust load control flap system for a full scale
turbine, ready for prototype testing.

vii
Resumé
Formålet med dette ph.d.-projekt har været at undersøge hvordan en Controllable
Rubber Trailing Edge Flap (CRTEF) i en vindmøllevinge reagerer, når den bliver udsat
for lynnedslag og finde den bedste tekniske løsning til at beskytte CRTEF’en og
kontrolsystemet mod lyn. Undersøgelserne er udført på baggrund af resultater fra
simuleringsmodeller og højspændingsprøver.
Vindmøller er ofte udsat for lynnedslag på grund af deres højde og placering, og
vingerne er den del, der er mest udsat for direkte udladninger. At beskytte vingerne mod
lyn er en udfordring, ikke mindst på grund af kombinationen af isolerende, halv-ledende
og ledende materialer i deres struktur. Derfor kræver installeringen af en CRTEF i
vinger en omhyggelig vurdering af risici i forbindelse med lynnedslag.
Studiet af effekten af lynnedslag i CRTEF-systemet bestod i en analyse af udladning
er eksponering for strømtransmissionen, herunder studiet af de inducerede
elektromagnetiske felter, og virkningerne af nedbrydningen af CRTEF-materialet på
grund af eksponering til højspændingsfelter i forbindelse med lynnedslag. De vigtigste
redskaber i denne analyse har været simulering v.h.a. Finite Elements Method (FEM) og
testning i et højspændingslaboratorium.
Formålet med FEM-simuleringen var at få pålidelige modeller korreleret med
forsøgsresultater, således at det var muligt at bestemme forskellige parametre relateret
til effekten af lynnedslag, såsom kraftigere elektriske felter, strømfordeling og
temperaturstigninger.
Arbejdet i højspændingslaboratoriet bestod bl.a. i testning af materialer, små prøver,
modelforsøg og afprøvning i fuld størrelse af prototypeelementer. Der blev lagt særlig
vægt på forsøg med gummimaterialer for at bestemme deres modstandsdygtighed over
for erosion som følge af direkte og indirekte effekter af lynnedslag.
Resultaterne fra både simulationer og de udførte laboratorietests danner baggrund for
design og validering af en effektiv og pålidelig beskyttelse af flap-systemet. Derudover
viii
bidrager de undersøgte generelle principper for lynbeskyttelse og den omfattende
analyse af erfaringer med lynskader også til resultaterne. Med hensyn til
designet anbefales det, for så vidt muligt, at undgå brugen af ledende materialer i
bladets indre struktur, især i den yderste del af vingespidsen, hvor risikoen for
lynindslag er størst. Prototypen blev valideret ved højspændingstests på en vinge, som
var udstyret med flapsystem og lynbeskyttelse. Testresultaterne var tilfredsstillende.
Ældningstest på gummi, brugt i flapsene, viste, at der kan forventes en
modstandsdygtighed overfor lynspændinger, som er mindst på højde med
fiberforstærkede materialer.
Dette ph.d.-projekt er en del af et større, EUDP-finansieret projekt, hvis overordnede
formål var at udvikle en prototype af active trailing edge flap-systemet til
vindmøllevinger, som kunne udgøre et komplet, pålideligt og robust flap system til en
vindmølle i fuld skala, klar til prototypeafprøvning.
ix
Contents
Preface ............................................................................................................................... i
Acknowledgements .......................................................................................................... iii
Abstract ............................................................................................................................. v
Resumé ............................................................................................................................ vii
..................................................................................................... 1 Chapter 1. Introduction
1.1 Lightning to wind turbines experienced in field ............................................. 2
1.2 Design and validation of lightning protection for wind turbines ................... 2
1.3 The present thesis ........................................................................................... 3
................................................... 7 Chapter 2. Lightning protection of wind turbine blades
2.1 The lightning discharge .................................................................................. 8
2.2 General principles of lightning protection ...................................................... 9
2.3 Lightning protection of wind turbines .......................................................... 10
2.4 Lightning protection of blades ...................................................................... 11
2.4.1 Main components of the blades LPS ..................................................... 12
2.4.2 Validation of the blades LPS ................................................................. 13
2.5 Lightning interaction with blades and failure modes ................................... 13
2.5.1 Lightning interaction of flap system ..................................................... 15
............................ 19 Chapter 3. Field measurements of lightning strikes to wind turbines
3.1 Incidence of lightning in wind turbines ........................................................ 20
3.1.1 Location and observation network ........................................................ 21
3.1.2 Frequency of lightning strikes to wind turbines .................................... 23
3.1.3 Lightning peak current .......................................................................... 30
3.1.4 Discussion ............................................................................................. 32
3.2 Upward lightning in wind turbines ............................................................... 33
3.2.1 Previous observations of upward lightning from tall structures ........... 34
3.2.2 Description of the observations ............................................................. 35

x
3.2.3 Discussion .............................................................................................. 41
3.3 Lightning damage to wind turbine blades ..................................................... 44
3.3.1 Description of the analysis data ............................................................. 45
3.3.2 Location of the lightning damage .......................................................... 46
3.3.3 Characteristics of the lightning damage ................................................ 48
3.3.4 Lightning attachment to more than one blade ....................................... 52
3.3.5 Discussion .............................................................................................. 53
................................................ 55 Chapter 4. Lightning attachment to wind turbine blades
4.1 Physical process of lightning attachment ...................................................... 56
4.1.1 Long electrical discharges ..................................................................... 56
4.1.2 Attachment process on wind turbine blades .......................................... 58
4.2 High voltage lightning attachment tests ........................................................ 60
4.2.1 Small scale tests ..................................................................................... 60
4.2.2 Full scale tests ........................................................................................ 67
4.3 Simulation methods for lightning attachment ............................................... 74
4.3.1 Static FEM simulations ......................................................................... 75
4.3.2 Quasi-dynamic FEM simulations .......................................................... 77
4.3.3 Leader inception simulation .................................................................. 82
4.4 Discussion of results ..................................................................................... 91
............... 93 Chapter 5. Lightning current and voltage distribution in wind turbine blades
5.1 Models description ........................................................................................ 94
5.1.1 Model 1: Down conductor ..................................................................... 95
5.1.2 Model 2: Down conductor and internal wire ......................................... 96
5.1.3 Model 3: Down conductor and carbon fiber laminate ........................... 97
5.1.4 Lightning current waveforms ................................................................ 99
5.2 Electrical parameters of the models .............................................................. 99
5.3 Simulation results ........................................................................................ 103
5.3.1 Model 1: Down conductor ................................................................... 103
5.3.2 Model 2: Down conductor and internal wire ....................................... 105
5.3.3 Model 3: Down conductor and carbon fiber laminate ......................... 109
5.4 Discussion ................................................................................................... 114
...... 117 Chapter 6. Degradation of rubber materials under exposure to high electric fields

xi
6.1 Materials description .................................................................................. 118
6.2 Tests description ......................................................................................... 118
6.2.1 Breakdown strength tests .................................................................... 118
6.2.2 Tracking resistance tests ..................................................................... 119
6.3 Tests results ................................................................................................ 120
6.3.1 Breakdown strength tests .................................................................... 120
6.3.2 Tracking resistance tests ..................................................................... 122
6.4 Discussion ................................................................................................... 124
.................... 127 Chapter 7. Design and validation of lightning protection for flap system
7.1 Flap system description .............................................................................. 128
7.2 Lightning protection design ........................................................................ 130
7.2.1 Requirements and recommendations .................................................. 130
7.2.2 Design of the protection system .......................................................... 132
7.2.3 Prototype ............................................................................................. 132
7.3 Validation ................................................................................................... 134
7.3.1 High voltage tests ................................................................................ 134
7.3.2 Numerical tools ................................................................................... 139
7.4 Discussion ................................................................................................... 142
................................................................................................. 145 Chapter 8. Conclusions
8.1 Characteristics of the lightning activity in wind farms .............................. 145
8.2 Simulation models for wind turbine blades ................................................ 147
8.3 Results of tests ............................................................................................ 148
8.4 Performance of the flap system exposed to lightning ................................ 148
8.5 Future work ................................................................................................ 149
References............................................................................................................... 151
Appendix................................................................................................................. 161
Appendix A – List of publications ...................................................................... 161
Appendix B – Numerical Modelling ................................................................... 163
Appendix C – Equipment of the high voltage laboratory ................................... 164

xii
Chapter 1
Introduction
The wind power technology has experienced a great development during the last few
decades, which is reflected not only on the growing installed capacity worldwide, which
exceeded 300 GW in 2013, but also in the size of the wind turbines. While wind
turbines in the mid 1980’s had an average rotor diameter of 20 m and a power output of
100 kW, nowadays the largest wind turbines have a rotor diameter over 150 m and a
power output up to 8 MW [1]. The increase in the size of the wind turbines has brought
new technical challenges, in particular for the design of the blades. New materials have
been introduced in the blade structure to increase its mechanical strength while keeping
the weight as low as possible, such as the carbon fiber and the balsa wood, whose
mechanical strength and lightness has allowed manufacturing larger blades.
Furthermore, new technologies to control the wind flow on the blade have been
developed to alleviate the mechanical loads, such as flaps, microtabs, camber control
and active twist. The new materials and flow control elements improve substantially the
blade performance, but their operation in real environmental conditions, which include
the hazard of lightning, needs to be assessed.
The risk of lightning strike to wind turbines has been and still is a salient issue for
wind turbine manufacturers. Field experience has shown that wind turbines attract
lightning even if they are manufactured only with insulating materials, resulting in
severe damage. Therefore, it is essential to protect the wind turbine against lightning in
order to preserve the integrity of the different components. The international standard
61400-24 on lightning protection of wind turbines [2] provides the requirements and
recommendations for the lightning risk assessment and the design and verification of
lightning protection for the different components of the wind turbine.
2 Introduction
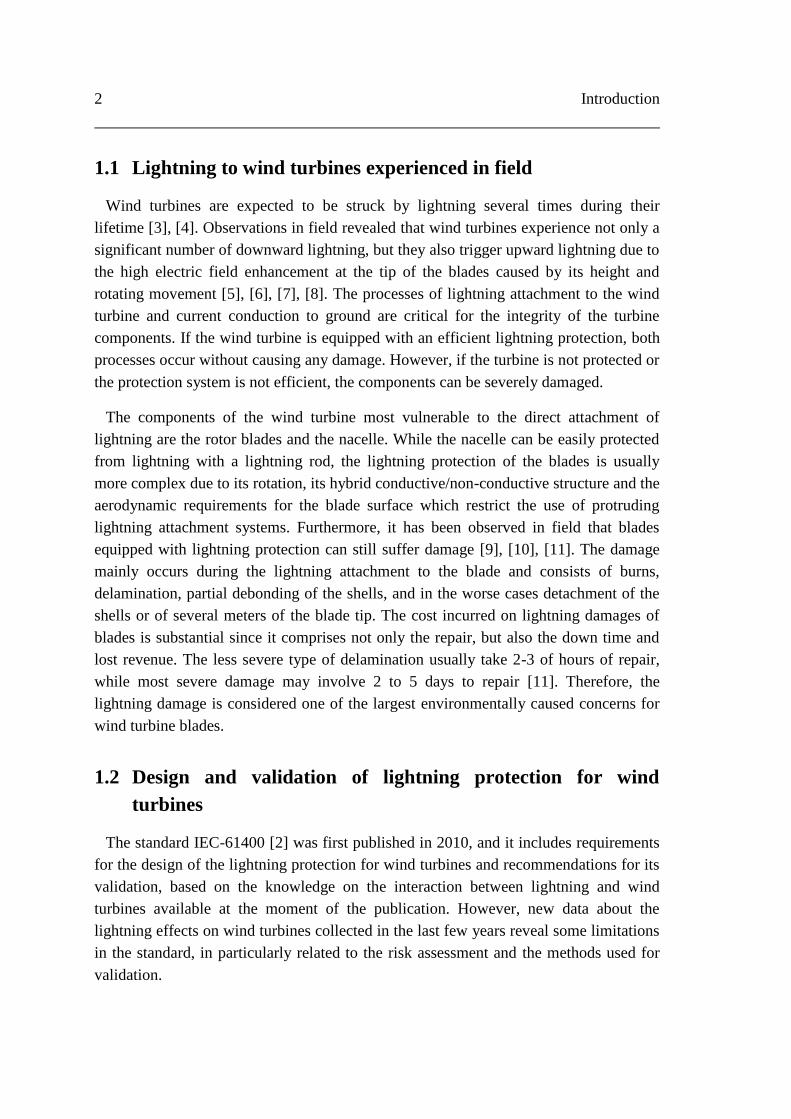
1.1 Lightning to wind turbines experienced in field
Wind turbines are expected to be struck by lightning several times during their
lifetime [3], [4]. Observations in field revealed that wind turbines experience not only a
significant number of downward lightning, but they also trigger upward lightning due to
the high electric field enhancement at the tip of the blades caused by its height and
rotating movement [5], [6], [7], [8]. The processes of lightning attachment to the wind
turbine and current conduction to ground are critical for the integrity of the turbine
components. If the wind turbine is equipped with an efficient lightning protection, both
processes occur without causing any damage. However, if the turbine is not protected or
the protection system is not efficient, the components can be severely damaged.
The components of the wind turbine most vulnerable to the direct attachment of
lightning are the rotor blades and the nacelle. While the nacelle can be easily protected
from lightning with a lightning rod, the lightning protection of the blades is usually
more complex due to its rotation, its hybrid conductive/non-conductive structure and the
aerodynamic requirements for the blade surface which restrict the use of protruding
lightning attachment systems. Furthermore, it has been observed in field that blades
equipped with lightning protection can still suffer damage [9], [10], [11]. The damage
mainly occurs during the lightning attachment to the blade and consists of burns,
delamination, partial debonding of the shells, and in the worse cases detachment of the
shells or of several meters of the blade tip. The cost incurred on lightning damages of
blades is substantial since it comprises not only the repair, but also the down time and
lost revenue. The less severe type of delamination usually take 2-3 of hours of repair,
while most severe damage may involve 2 to 5 days to repair [11]. Therefore, the
lightning damage is considered one of the largest environmentally caused concerns for
wind turbine blades.
1.2 Design and validation of lightning protection for wind
turbines
The standard IEC-61400 [2] was first published in 2010, and it includes requirements
for the design of the lightning protection for wind turbines and recommendations for its
validation, based on the knowledge on the interaction between lightning and wind
turbines available at the moment of the publication. However, new data about the
lightning effects on wind turbines collected in the last few years reveal some limitations
in the standard, in particularly related to the risk assessment and the methods used for
validation.

Introduction 3
Regarding the evaluation of the risk of lightning, the method to estimate the number
of lightning that will attach a wind turbine per year proposed by the standard is based on
the calculations used for buildings, corrected with a coefficient that accounts for the
orography of the terrain and the possibility of upward lightning. The accuracy of this
calculation has been questioned but it is difficult to evaluate, since most of the data
related to lightning incidences on wind turbines belongs to the industry and it is
therefore confidential.
Concerning the methods for the validation of the lightning protection, the focus of the
discussion is on the testing methods and the use of analytical tools. The laboratory tests
proposed by the standard are mainly based on the validation tests performed on aircraft,
and so far they are the most reliable method to verify the efficiency of the lightning
protection system. However, there is controversy in the parameters of the current
impulse used in the tests (peak current, charge, specific energy), which may be too
severe, and in how the results of the tests must be evaluated. Furthermore, the validation
tests do not cover the ageing of the blade materials due to the high electric field
enhancement during the thunderstorms. Again, the lack of field data is a constraint for
the verification of the validation tests.
The standard allows the use of analytical tools for the validation of the lightning
protection provided they are verified with laboratory tests, although it does not include
recommendations about what tools and methods can be used. Nevertheless, the
analytical tools such as Finite Element Method (FEM) simulations and calculations
based on electrical equivalent circuits are becoming a common tool during the design
and evaluation of the wind turbine lightning protection system, since they are flexible
and inexpensive.
In conclusion, field data on the lightning activity in wind farms and research on the
analytical tools to simulate the lightning process are essential for a better understanding
of the lightning effects on wind turbines and towards a greater efficiency of the
lightning protection.
1.3 The present thesis
The aim of this PhD project is to investigate the behavior of a Controllable Rubber
Trailing Edge Flap (CRTEF) installed in a wind turbine blade when it is exposed to
lightning discharges, and to find the best technical solution to protect the CRTEF and
the controlling system against lightning. This PhD is part of a broader, EUDP funded
project, whose overall objective is to develop a prototype active trailing edge flap
system for a wind turbine blade which constitutes a complete, reliable and robust load
4 Introduction
control system for a full scale turbine, ready for prototype testing. This EUDP project is
a collaboration between Risø DTU, DTU – Elektro and the industrial partners Rehau
A/S, AVN Energy A/S and Dansk Gummi Industri A/S.
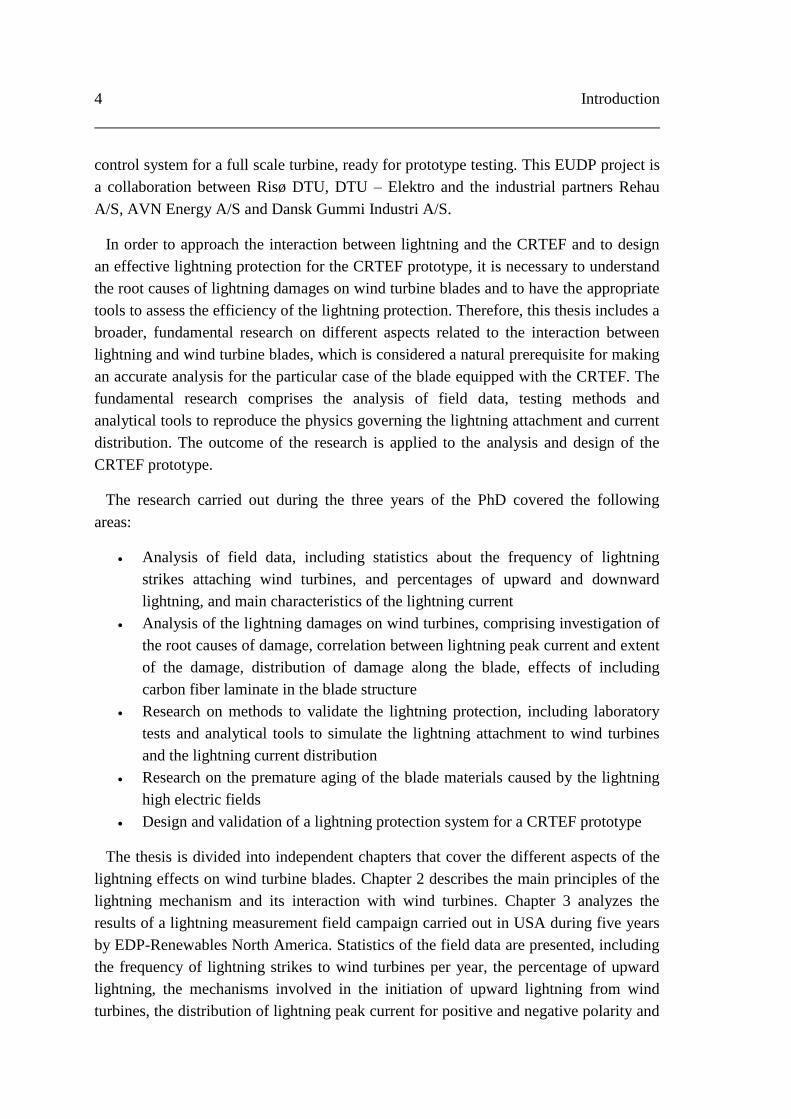
In order to approach the interaction between lightning and the CRTEF and to design
an effective lightning protection for the CRTEF prototype, it is necessary to understand
the root causes of lightning damages on wind turbine blades and to have the appropriate
tools to assess the efficiency of the lightning protection. Therefore, this thesis includes a
broader, fundamental research on different aspects related to the interaction between
lightning and wind turbine blades, which is considered a natural prerequisite for making
an accurate analysis for the particular case of the blade equipped with the CRTEF. The
fundamental research comprises the analysis of field data, testing methods and
analytical tools to reproduce the physics governing the lightning attachment and current
distribution. The outcome of the research is applied to the analysis and design of the
CRTEF prototype.
The research carried out during the three years of the PhD covered the following
areas:
Analysis of field data, including statistics about the frequency of lightning
strikes attaching wind turbines, and percentages of upward and downward
lightning, and main characteristics of the lightning current
Analysis of the lightning damages on wind turbines, comprising investigation of
the root causes of damage, correlation between lightning peak current and extent
of the damage, distribution of damage along the blade, effects of including
carbon fiber laminate in the blade structure
Research on methods to validate the lightning protection, including laboratory
tests and analytical tools to simulate the lightning attachment to wind turbines
and the lightning current distribution
Research on the premature aging of the blade materials caused by the lightning
high electric fields
Design and validation of a lightning protection system for a CRTEF prototype
The thesis is divided into independent chapters that cover the different aspects of the
lightning effects on wind turbine blades. Chapter 2 describes the main principles of the
lightning mechanism and its interaction with wind turbines. Chapter 3 analyzes the
results of a lightning measurement field campaign carried out in USA during five years
by EDP-Renewables North America. Statistics of the field data are presented, including
the frequency of lightning strikes to wind turbines per year, the percentage of upward
lightning, the mechanisms involved in the initiation of upward lightning from wind
turbines, the distribution of lightning peak current for positive and negative polarity and

Introduction 5
the characteristics of the lightning damage on the blades. Chapter 4 investigates the
process of lightning attachment to the blades by means of high voltage tests and
different simulations methods based on FEM models. Chapter 5 calculates the lightning
current distribution between the different conductive elements of a blade struck by
lightning and evaluates the risk of internal sparking due to the induced voltages.
Chapter 6 evaluates the aging on the rubber material of the CRTEF material due to the
lightning high electric fields caused by thunderstorm. Chapter 7 investigates the effects
of lightning on the CRTEF system installed on a blade. A lightning protection system
for the flap is design and validated according to results of the research performed in
Chapters 3 – 6. Finally, Chapter 8 summarizes the main findings of this PhD research
and includes some recommendations for future work.
The chapters 3 to 7, which comprise analysis of data, numerical simulation and tests,
include a discussion in the end of the chapter that summarize the main findings.
Recommendations on the lightning protection of the flap system are included in
different sections of the thesis, and summarized in Chapter 7, which deepens in the flap
system design and validation.
A list of the publications written during the course of this PhD can be found in
Appendix A.

6 Introduction
Chapter 2
Lightning protection of wind turbine blades
The first step in designing and achieving an efficient lightning protection system for
blades is to identify the physical phenomena related to the lightning attachment. Part of
this analysis covers the understanding of the lightning physics and how lightning
discharge interacts with the wind turbine, differing from the common experience in
buildings or other simple structures. This chapter introduces the main concepts related
to the lightning mechanism and the principles of lightning protection of structures in
general and wind turbine blades in particular, and explains the causes of the typical
failure modes of the blade lightning protection system.
The chapter is divided in five sections. Section 2 explains the physics involved in the
process of the lightning discharge, describes the different types of lightning that attach
grounded structures, and defines the main parameters of the lightning impulse
responsible for the damage. Sections 2.2, 2.3 and 2.4 summarize the basic principles of
lightning protection for grounded structures in general, wind turbines and the particular
case of the rotor blade, respectively. The presented methods to design and validate the
lightning protection are based on the requirements and recommendations of the current
international standards. Finally, Section 2.5 investigates the interaction of lightning and
wind turbine blades, with particular attention to the failure modes of the protection, in
order to determine the causes of damage and thus increase the efficiency of the
protection system.
8 Lightning protection of wind turbine blades
2.1 The lightning discharge
This section summarizes the main processes involved in the lightning discharge. The
interested reader may consult the publications of Uman, Rakov and Cooray [12], [13],
[14] for an extensive description of the phenomenon.
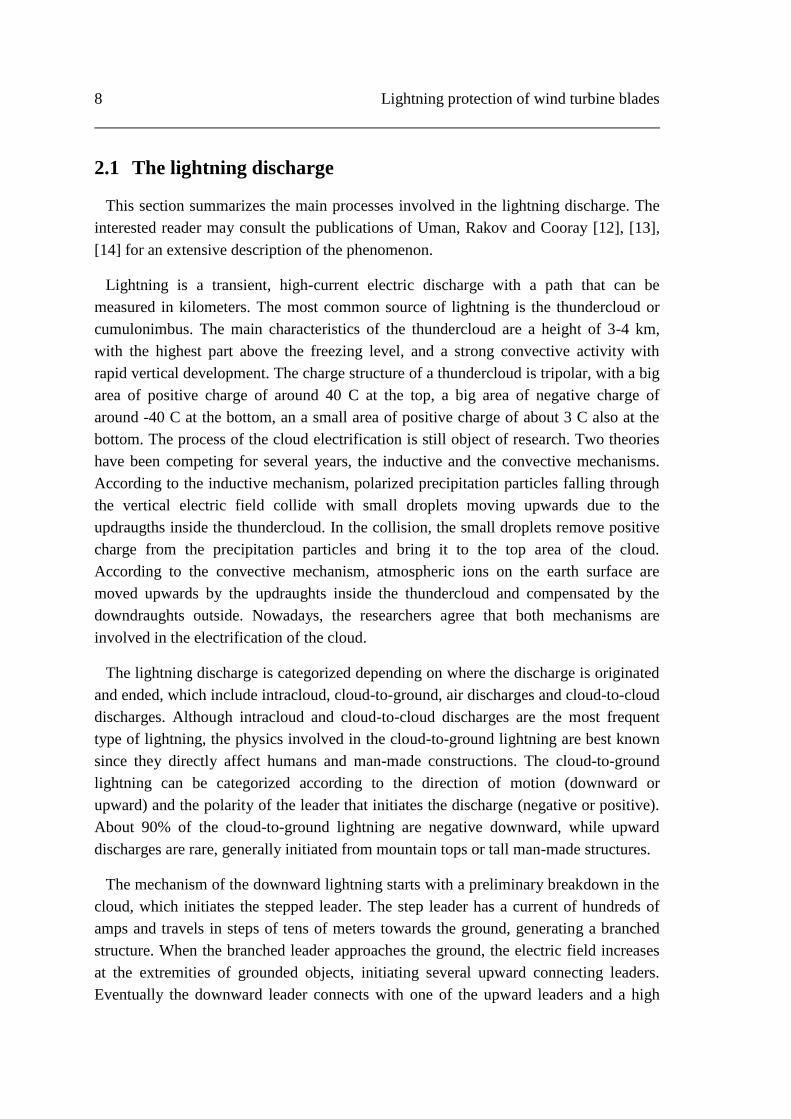
Lightning is a transient, high-current electric discharge with a path that can be
measured in kilometers. The most common source of lightning is the thundercloud or
cumulonimbus. The main characteristics of the thundercloud are a height of 3-4 km,
with the highest part above the freezing level, and a strong convective activity with
rapid vertical development. The charge structure of a thundercloud is tripolar, with a big
area of positive charge of around 40 C at the top, a big area of negative charge of
around -40 C at the bottom, an a small area of positive charge of about 3 C also at the
bottom. The process of the cloud electrification is still object of research. Two theories
have been competing for several years, the inductive and the convective mechanisms.
According to the inductive mechanism, polarized precipitation particles falling through
the vertical electric field collide with small droplets moving upwards due to the
updraugths inside the thundercloud. In the collision, the small droplets remove positive
charge from the precipitation particles and bring it to the top area of the cloud.
According to the convective mechanism, atmospheric ions on the earth surface are
moved upwards by the updraughts inside the thundercloud and compensated by the
downdraughts outside. Nowadays, the researchers agree that both mechanisms are
involved in the electrification of the cloud.
The lightning discharge is categorized depending on where the discharge is originated
and ended, which include intracloud, cloud-to-ground, air discharges and cloud-to-cloud
discharges. Although intracloud and cloud-to-cloud discharges are the most frequent
type of lightning, the physics involved in the cloud-to-ground lightning are best known
since they directly affect humans and man-made constructions. The cloud-to-ground
lightning can be categorized according to the direction of motion (downward or
upward) and the polarity of the leader that initiates the discharge (negative or positive).
About 90% of the cloud-to-ground lightning are negative downward, while upward
discharges are rare, generally initiated from mountain tops or tall man-made structures.
The mechanism of the downward lightning starts with a preliminary breakdown in the
cloud, which initiates the stepped leader. The step leader has a current of hundreds of
amps and travels in steps of tens of meters towards the ground, generating a branched
structure. When the branched leader approaches the ground, the electric field increases
at the extremities of grounded objects, initiating several upward connecting leaders.
Eventually the downward leader connects with one of the upward leaders and a high
Lightning protection of wind turbine blades 9
current wave propagates continuously up through the ionized path of the leader. This
current wave is called first return stroke and has an average peak current of 30 kA,
although it can reach values over 100 kA, and a rise-time of about 10 kA/µs. After the
first return stroke, there is a redistribution of the charge in the thundercloud. The
lightning process may finish here, or continue with one or several subsequent strokes.
The subsequent stroke is initiated with a dart leader, which has a similar level of current
as the stepped leader but flows continuously downward through the already ionized
channel. When the dart leader reaches the ground, a high current wave called
subsequent stroke travels upward, similarly to the first return stroke. On average,
lightning consists of 4-5 strokes. The subsequent strokes have usually lower peak
current than the first return stroke, about 10-15 kA, but a faster wave front that can
reach 100 kA/µs.
The mechanism of the upward lightning is significantly different than the downward
lightning. Upward lightning starts with an upward leader from ground, naturally
initiated at the mountain tops and artificially initiated from man-made structures
(including wind turbines) or events such rockets. The upward lightning has no first
return stroke. Instead, a continuous current follows when the upward leader reaches the
cloud. However, it may have downward dart leaders and upward-moving subsequent
strokes.
The study of the physics of lightning within the field of electrical engineering has the
main objective of designing efficient lightning protection and avoiding any risk of
injuries to humans and other live-beings, damages of structures or loss of services. The
lightning damages can be divided in two types, the heating effects and the
electromagnetic effects. The heating effects depend on the parameters of peak current
[kA], the charge [C] and the specific energy [J/Ω] of the current impulse. The
electromagnetic effects mainly depend on the rate of change of the current with respect
to time di/dt. The highest di/dt usually occurs at the wavefront and causes induced
overvoltages, especially in impedances predominantly inductive. The di/dt is also
responsible for the electromagnetic forces that appear in the conductors when the
lightning current is flowing through.
2.2 General principles of lightning protection
The international standards on lightning protection of structures and services [15],
[16], [17], [18] base the design of the lightning protection on the concepts of Lightning
Protection Levels (LPL) and Lightning Protection Zones (LPZ). The LPL classify
lightning in different levels according to the parameters of the current impulse, while
10 Lightning protection of wind turbine blades
the LPZ define the threat of lightning in a structure due to direct strike or indirect
electromagnetic effects.
The LPL divide lightning into four categories according their maximum current,
charge, specific energy, time, etc., where LPL1 is the most severe case of lightning,
with a maximum current of 200 kA and a specific energy of 10MJ/Ω. The LPZ divides
the structure in different zones according to the degree of exposure to the lightning
strike current and electromagnetic effects, where the LPZ 0 is the zone with threat of
full exposure.
The analysis of the risk assessment of lightning damage is another important factor to
consider in the design of an effective lightning protection. The risk assessment depends
on the frequency of lightning strikes, the probability that the lightning causes damage to
the structure and a quantitative evaluation of the damage. The expected frequency of
lightning strikes expected to a structure Ns is determined from the average lightning
strike density at the location, the geometry of the structure and the local topography. It
is noted that Ns may be difficult to estimate for tall structures, where both downward
and upward lightning are expected.
The lightning protection of structures consists of the external and the internal
protection. The external lightning protection is intended to intercept the direct lightning
strokes, conduct the lightning current from the point of attachment to ground and
disperse the current to earth, without causing dangerous sparking, thermal or
mechanical damages. It comprises an air termination system aimed at intercepting direct
lightning strokes, a down conductor system which conducts the lightning current to
ground, and an earth termination system, which dissipates the lightning current into the
earth. The internal lightning protection is intended to avoid the occurrence of dangerous
sparking within the structure to be protected due to current flowing in the external
protection system. The internal protection is achieved with a combination of
equipotential connection between conductors, by direct bonding of conductors or surge
protective devices, and by keeping certain separation distances between conductors.
2.3 Lightning protection of wind turbines
Wind turbines experience a significant number of lightning strikes during their life
time due to their height and location in isolated areas. Most of the lightning strikes to
wind turbines attach the rotor blades and the nacelle [3] [6], [7]. The damage that the
lightning current causes to the blade structural materials is critical for the integrity of
the blade; therefore, it is essential to equip the rotor blades with a lightning protection
system. The international standard on lightning protection of wind turbines IEC 61400-
Lightning protection of wind turbine blades 11
24 [2] published in 2010 compiles different methods to evaluate the risk of lightning
strikes and to design and verify the lightning protection for wind turbines. Nowadays
the majority of large wind turbine blades (rotor diameter over 50 m) are provided with
lightning protection. However, wind turbine owners report that blades equipped with
lightning protection may still experience severe lightning damage [9], [10], which
incurs substantial costs of repair.
The IEC 61400-24 is based and follows the same principals than the international
standards on lightning protection of buildings and structures described in Section 2.2.
According to the IEC 61400-24, all subcomponents of the wind turbine, including the
blade, should be protected according to LPL1. Regarding the LPZ, the blades and the
nacelle structure are categorized as Zone 0, and are therefore fully exposed to lightning
strikes. The electrical equipment and conductors inside the blade and the tower
experience only a limited current and an attenuated electromagnetic field, so they are
categorized as Zone 1 or higher.
The lightning protection system of the wind turbines consists of one or more air-
termination systems located at the rotor blades and the nacelle. Since the nacelle has a
metallic frame, the frame itself can be used to intercept lightning. However, in order to
avoid direct strike to the meteorological instruments, it is advisable to install a lightning
rod at the outermost part of the nacelle. The air termination system of the blade is
connected to a down conductor system through which the current flows along the blade.
The transmission system between the blade and the nacelle usually consists of a sliding
contact or spark gap system, which avoids the flow of lightning current through the
pitch bearings. The current is transmitted from the nacelle to the tower through a
bonding. Usually the tower is metallic, so the current can flow through the tower
structure to the ground. Otherwise, a lightning down conductor needs to be installed
inside the tower for this purpose. The dispersion of the current into the earth is done by
means of an earthing system. The earthing system consists of the metallic elements of
the wind turbine foundations, combined with a ring electrode arrangement.
2.4 Lightning protection of blades
The lightning protection system (LPS) of wind turbine blades is particularly
challenging due to the rotation of the blades, as well as the combination of insulating
and conductive materials. According to the standard [2], the lightning protection of
blades should fulfill the following requirements:

12 Lightning protection of wind turbine blades
The lighting protection shall be sufficient so that the blade supports lightning strikes
with LPL1 current parameters without structural damages that impair the
functioning of the blade.
The lightning damage shall be limited to that which can be tolerated until the next
scheduled maintenance and inspection (visual inspection once a year, complete
inspection every two years).
2.4.1 Main components of the blades LPS
The lightning protection of the blade consists of an air termination system, and a down
conductor which includes a transmission system to the nacelle.
The aim of the air termination system is to intercept the lightning discharge (Figure
2-1). It is placed on the surface areas of the blade where upward leaders may originate
and cause lightning attachment or punctures if no air terminations were present.
Figure 2-1. Lightning attachment system consisting of discrete receptors along the blade. The
receptors are expected to initiate upward leaders that may attach the lightning downward leader.
Field experience has shown that the majority of the lightning attach to the last few
meters of the blade tip. Possible air termination systems are discrete receptors (Figure
2-1), conductive mesh or bands, metallic tip and diverter strips. The different parts must
be repairable and replaceable.
The down conductor system conducts the lightning current from the air termination
system to the root of the blade. It is expected to withstand the electrical, thermal and
electromechanical effects of the lightning current without damage, and to provide
equipotential connection with all the conductive components of the blade. Possible
down conductor systems are a cylindrical conductor, a band or a mesh, as well as
conductive structural components of the blade such as the carbon fiber laminate.
Finally, the transmission system between the blade and the nacelle aims at conducting
the lightning current from the root of the blade to the nacelle avoiding the pitch

Lightning protection of wind turbine blades 13
bearings. Possible blade-nacelle transmission systems are a sliding contact or a spark
gap system (Figure 2-2).
Figure 2-2. Lightning down conductor system consisting of a cylindrical conductor, connected to the
air termination system and to the carbon fiber laminate of the blade structure. The lightning
transmission system connects the down conductor at the root of the blade with the nacelle
2.4.2 Validation of the blades LPS
The ability of the blade LPS to intercept lightning and conduct the lightning current
along the blade without damage can be verified through three different methods:
Testing: High voltage and high current tests are performed to small samples and
full-scale blade specimens to verify the ability of the lightning protection to
intercept the lightning and support the heating and electromagnetic effects of the
current impulse.
Analytical tools: Based on numerical calculations, they are mainly aimed at
determining the most likely lightning attachment points in the blade and the current
distribution and induced voltages in the blade conductors. The outcome from the
analytical tools needs to be verified with test results or successful service
experience.
Similarity: Verification of the blade LPS by similarity with another blade with
comparable geometry, materials and LPS that has been previously validated with
tests or with successful service experience.
2.5 Lightning interaction with blades and failure modes
During a thunderstorm, there is an electric field enhancement around all the internal
and external conductive components of the blade. These conductive components include
the air termination system but also LPS internal components such as the receptor
support, the down conductor or the connection, the carbon fiber laminate if it is
included in the blade structure and any sensor or electronic device installed inside the
blade for measuring purposes. The high electric field around this components initiates
streamers (small electrical discharges preceding the leader inception) which may
Nacelle
Blade bearing
I0I cable
I carbon
I0
14 Lightning protection of wind turbine blades
develop into an upward leader and attach the lightning discharge. Therefore, any
conductive component of the blade may be struck by lightning.
If the blade is equipped with an efficient lightning protection, the lightning attachment
point should be the air termination system. However, the field experience shows that
there are cases in which the lightning does not attach the air termination system but an
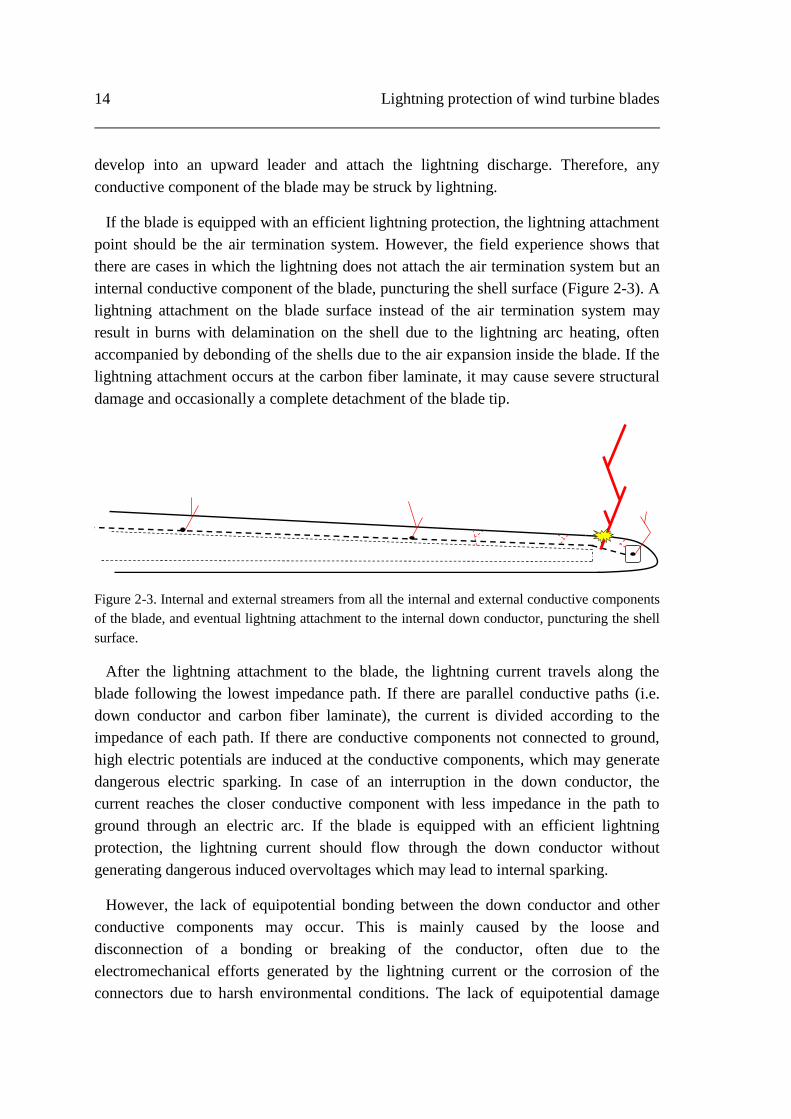
internal conductive component of the blade, puncturing the shell surface (Figure 2-3). A
lightning attachment on the blade surface instead of the air termination system may
result in burns with delamination on the shell due to the lightning arc heating, often
accompanied by debonding of the shells due to the air expansion inside the blade. If the
lightning attachment occurs at the carbon fiber laminate, it may cause severe structural
damage and occasionally a complete detachment of the blade tip.
Figure 2-3. Internal and external streamers from all the internal and external conductive components
of the blade, and eventual lightning attachment to the internal down conductor, puncturing the shell
surface.
After the lightning attachment to the blade, the lightning current travels along the
blade following the lowest impedance path. If there are parallel conductive paths (i.e.
down conductor and carbon fiber laminate), the current is divided according to the
impedance of each path. If there are conductive components not connected to ground,
high electric potentials are induced at the conductive components, which may generate
dangerous electric sparking. In case of an interruption in the down conductor, the
current reaches the closer conductive component with less impedance in the path to
ground through an electric arc. If the blade is equipped with an efficient lightning
protection, the lightning current should flow through the down conductor without
generating dangerous induced overvoltages which may lead to internal sparking.
However, the lack of equipotential bonding between the down conductor and other
conductive components may occur. This is mainly caused by the loose and
disconnection of a bonding or breaking of the conductor, often due to the
electromechanical efforts generated by the lightning current or the corrosion of the
connectors due to harsh environmental conditions. The lack of equipotential damage

Lightning protection of wind turbine blades 15
usually results in internal sparking, which can be accompanied by other hazards, such as
the damage of the carbon fiber laminate or the pass of lightning current through the
blade pitch bearings (Figure 2-4).
Figure 2-4. Possible failures due to lack of equipotential bonding between the conductive
components of the blade.
In view of the blade LPS failure modes, there are some good practices that may help
to increase the efficiency of the LPS, thus avoiding or reducing the damage due to
lightning. The lightning air termination system should be designed so that is the only
uncovered conductive element of the blade, and should be place at any point of the
blade with high probability of lightning strike. Furthermore, all the conductive
components of the blade should be properly insulated, in particular at the last meters of
the blades. The lightning down conductor system should have the minimum possible
number of connections in order to reduce the probability of failure due to disconnection.
The route of the lightning down conductor should be straight along the blade and
properly held on the internal surfaces of the shell or spar, in order to avoid
electromagnetic forces that could pull and break the conductor.
2.5.1 Lightning interaction of flap system
The Controlable Rubber Trailing Edge Flap (CRTEF) will be exposed to the same
electrical environment as the other components of the blade, including the processes of
lightning attachment and current conduction, with the additional issue of the unknown
behavior of the rubber material exposed to the high electric field of lightning.
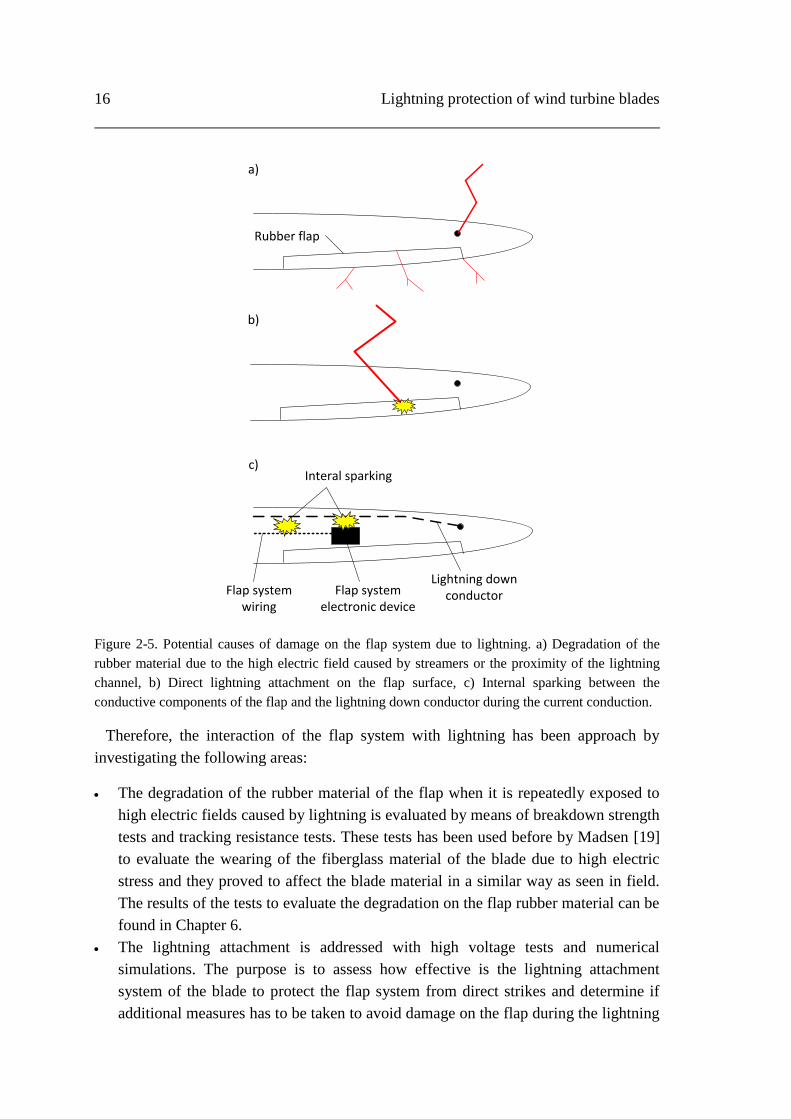
Therefore, the potential causes of lightning damage to the flap system are the
degradation of the rubber material due to the repeated exposure of high electric fields
caused by streamer activity and the proximity of lightning channel (Figure 2-5, a), the
direct attachment on the unprotected flap surface (Figure 2-5, b) and the internal
sparking between conductive components of the flap system, such as electronic
equipment or wiring, and the lightning down conductor during the conduction of the
lightning current to ground (Figure 2-5, c).
Nacelle
Lightning current through the
bearing
Lightning current through the shell due to down conductor
interrupted
Internal electric arc due to low conductivity on a down
conductor connection
Internal electric arc due to lack of equipotential connection between down
conductor and carbon fiber laminate
16 Lightning protection of wind turbine blades
a)
b)
c)Interal sparking
Rubber flap
Lightning down conductorFlap system
electronic deviceFlap system
wiring
Figure 2-5. Potential causes of damage on the flap system due to lightning. a) Degradation of the
rubber material due to the high electric field caused by streamers or the proximity of the lightning
channel, b) Direct lightning attachment on the flap surface, c) Internal sparking between the
conductive components of the flap and the lightning down conductor during the current conduction.
Therefore, the interaction of the flap system with lightning has been approach by
investigating the following areas:
The degradation of the rubber material of the flap when it is repeatedly exposed to
high electric fields caused by lightning is evaluated by means of breakdown strength
tests and tracking resistance tests. These tests has been used before by Madsen [19]
to evaluate the wearing of the fiberglass material of the blade due to high electric
stress and they proved to affect the blade material in a similar way as seen in field.
The results of the tests to evaluate the degradation on the flap rubber material can be
found in Chapter 6.
The lightning attachment is addressed with high voltage tests and numerical
simulations. The purpose is to assess how effective is the lightning attachment
system of the blade to protect the flap system from direct strikes and determine if
additional measures has to be taken to avoid damage on the flap during the lightning
Lightning protection of wind turbine blades 17
attachment. The result of the lightning attachment analysis related to the flap system
can be found in Chapter 7.
The lightning current conduction is assessed by means of numerical calculations
based on equivalent circuits. The analysis aims at determining that the current and
voltage induced at the conductive components of the flap system can be tolerated by
the components, and no internal sparking will occur in case of lightning strike. The
considerations regarding the lightning current conduction with regards to the flap
system can be found in Chapter 7.

18 Lightning protection of wind turbine blades

Chapter 3
Field measurements of lightning strikes to wind
turbines
Lightning physics from an academic and theoretical standpoint is an important feature
for enabling efficient lightning protection designs. Besides these theoretical
considerations, field data is another valuable mean of investigating the real properties
and system performances. This chapter summarizes the field observations of lightning
strikes to wind turbines and the analysis of lightning damage on blades performed in
wind farms in US, in collaboration with EDP-Renewables North America. The aim of
the investigation was determining the mechanisms involved in the lightning attachment
to wind turbines and to determine root causes of the lightning damage in blades. The
resources used to perform the analysis were data from the US. Lightning Detection
Network (NLDN), additional field measurements from high speed cameras and
Lightning Mapping Array (LMA), and blade damage reports from EDPR.
The chapter is divided in three sections. Section 3 presents an analysis of lightning
observations in a monitored wind farm in Kansas, U.S. during a period of 4.5 years. The
observations consist of records from current measurement devices installed in the wind
turbine blades and data from the NLDN. The analysis includes statistics of the
frequency of lightning strikes to the wind turbines, as well as polarity, direction and
peak current of the lightning discharges. The causes for the variation in the number of
lightning strikes to each wind turbine have also been investigated, in particular
concerning the location of the wind turbine in the wind farm. The statistics of frequency
of lightning attaching the wind turbines and range of lightning peak current experienced
in field are compared with calculations of the lightning exposure of wind turbines and

20 Field measurements of lightning strikes to wind turbines
expected peak current based on empirical expressions, including the estimations based
on the international standard on lightning protection of wind turbines IEC 61400-24.
Section 3.2 investigates five specific events from the study performed in Section 3,
where simultaneous lightning currents were registered in different wind turbines of a
wind farm with lightning monitoring equipment installed. The analysis of the data
available for each event suggested that the simultaneous discharges at the wind turbines
were caused by the nearby cloud-to-ground strokes, involving mechanisms that vary
depending on the polarity of the associated cloud-to-ground stroke. Finally, Section 3.3
presents statistical data about lightning damage on wind turbine blades reported at
different wind farms in the U.S, including a large variety of blades with different
lengths, laminate structure and lightning protection systems. The statistics comprises the
distribution of the lightning damage along the blade and classifies the damage by
severity. The work reported in this chapter is published in [4], [8] and [11].
3.1 Incidence of lightning in wind turbines
The lightning exposure assessment of a structure estimates the number of lightning
incidences expected in a structure based on the local lightning density, the height of the
structure and the topography of the terrain. The expression proposed in the IEC standard
[2] to calculate the frequency of lightning strikes to the wind turbines only accounts for
downward lightning. However, it is well known that structures taller than 100 m, such
as tall towers and wind turbines, experience a higher electric field enhancement during a
thunderstorm that may cause longer upward connecting leaders and upward lightning
[13]. Eriksson [20] proposed an expression to calculate the total number of downward
and upward lightning expected in tall structures, based on numerous observations of
lightning strikes in tall towers. The expression depends on the effective height of the
structure, which corresponds to the equivalent height of the structure in a flat terrain that
would have similar lightning attractiveness, thus accounting for the effect of the
surrounding topography. The calculation of the effective height of a tall structure may
not be an easy task if the structure is installed on hilly, complex terrain. Several authors,
including Rakov and Lutz [21] and Rizk [22], [23] have proposed methods to determine
the effective height in towers placed on mountaintops. In the case of the wind turbines,
the rotation of the blades has also an effect on the lightning incidence. Rachidi et al. [5]
noted the similarity between small rockets used to trigger lightning for investigation
purposes and the tip of rotating blades. More recently, Montanyà et al. [7] observed
upward discharges from wind turbines in operation at regular intervals synchronized
with the instant where the tip of each blade reached its highest position, suggesting a
direct relation between the lightning activity and the blade rotation/position.
Field measurements of lightning strikes to wind turbines 21
The current parameters of the lightning strikes attaching wind turbines, such as peak
current, waveform, charge and specific energy, determine the requirements of the
lightning protection. Firstly, there is an empirical relationship between the current peak
of a downward lightning and the areas of the structure that are likely to be struck.
Expressions to evaluate this relationship include the rolling sphere or electro-geometric
method [24] and the striking distance [25], [26]. Secondly, the components of the
lightning protection should be able to support the thermal stress and electromechanical
forces generated by the lightning surge.
In view of the importance of the frequency and characteristics of the lightning strikes
attaching the wind turbines to provide proper lightning protection, direct observations of
lightning activity in the wind farms as the analysis presented here and in the
publications [3], [6], [27], are necessary to provide an accurate risk assessment.
3.1.1 Location and observation network
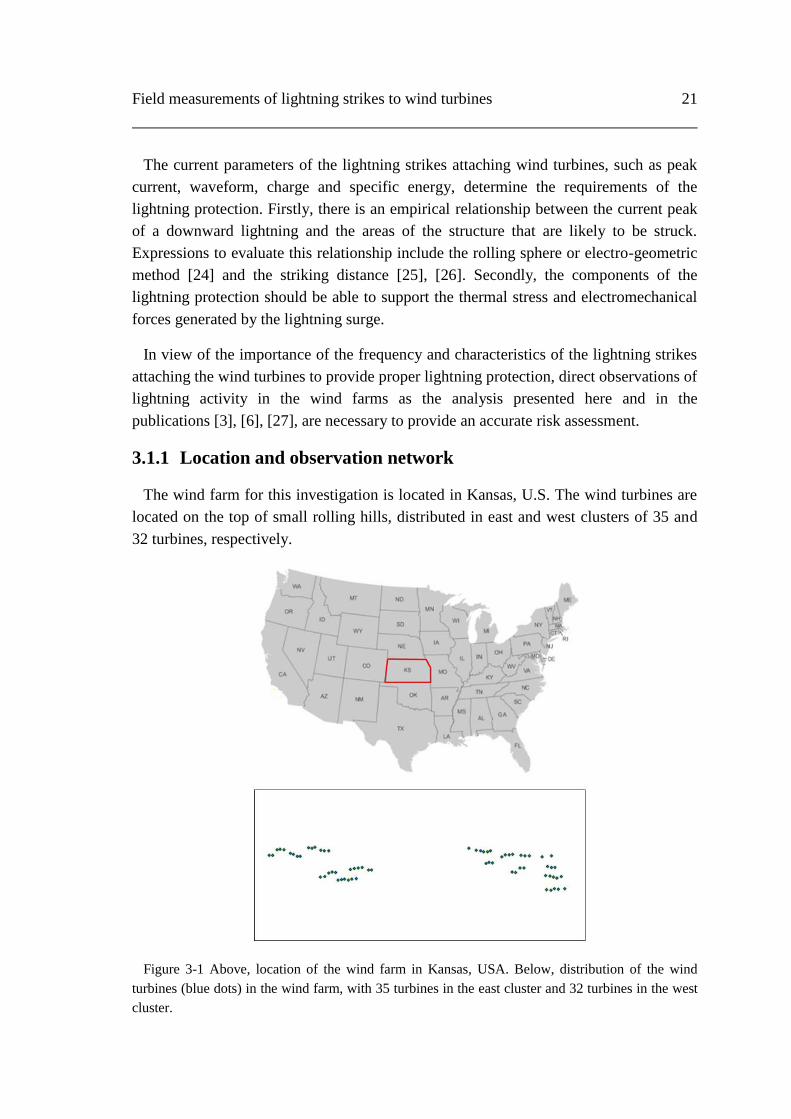
The wind farm for this investigation is located in Kansas, U.S. The wind turbines are
located on the top of small rolling hills, distributed in east and west clusters of 35 and
32 turbines, respectively.
Figure 3-1 Above, location of the wind farm in Kansas, USA. Below, distribution of the wind
turbines (blue dots) in the wind farm, with 35 turbines in the east cluster and 32 turbines in the west
cluster.
22 Field measurements of lightning strikes to wind turbines
All wind turbines have a maximum total height of 125m including the tower and a
blade in vertical position. The average height of the terrain above mean sea level (MSL)
is 457 m and height of the hills where the turbines are installed ranges from 480 m to
515 m with respect to the sea level. The lightning strike density in the area is 2-4
flashes/year/km2 [28].
The wind farm was monitored with permanent and temporary equipment. The
permanent equipment consists of current measurement devices installed at the root of all
the wind turbine blades in the wind farm, and electromagnetic lightning observations
provided by sensors in the NLDN. The temporary equipment was installed during the
field campaigns performed in the spring-summer seasons of 2012 and 2013, and
consisted of two digital auto-triggered video cameras recording at 60 images per
second, electric field mills, slow antennas and lightning mapping array (LMA). The
outcome of the field campaigns is reported in Wilson et al. [6] and Cummins et al. [27].
The NLDN provides real-time data of lightning activity in U.S. A detailed description
of the NLDN sensors network and processing algorithms can be found in Cummins et
al. [29]. The NLDN data include the location, time, type (CG, IC), polarity and current
peak of each lightning stroke, along with additional quality-related information. The
estimated time of the stroke has an accuracy of ~1µs. Between 2004 and 2007,
validation studies summarized by Cummins and Murphy indicated that the NLDN
reported between 90% and 95% of all CG flashes (flash detection efficiency, or DE),
with a median error of the location less than 500m and a peak current RMS uncertainty
of ~15%. There is a risk of misclassification of IC and CG+ discharges. Many of the
small IC events are classified as CG+ , while large CG+ are often classified as IC+
strokes. More-recent analyses carried out in 2012 and 2013 indicate that improvements
in the NLDN have resulted in greater than 95% flash DE and median location error less
than 200m [30], [31].
The current measurements made within the wind turbine blades are transmitted to a
SCADA system, which sets off an alarm to indicate that the turbine was struck by
lightning. The SCADA system reports the time when the lightning strike occurred and
an estimation of the current peak registered by the measurement device. A time
correlation of all the lightning events reported by the SCADA system from 2009 to July
2013 (a total of 360 lightning events) with the NLDN detections shows that the SCADA
alarms have an average time delay of 10 seconds. This delay is attributed to the process
of transferring and storing the data, and can increase to a maximum of 15 seconds when
several lightning strokes attach the wind turbines within a time interval of milliseconds.
Regarding the lightning current peak, the analysis performed by Wilson et al. [6]
concluded that there is a very poor correlation between the values recorded by the

Field measurements of lightning strikes to wind turbines 23
SCADA system and the NLDN detections. Considering the low error expected in the
NLDN peak current detections, the values of peak current registered at the SCADA
system are disregarded in the analysis of the lightning events performed in this analysis.
Vaisala’s LS700x lightning sensors installed in the NLDN over the last several years
have the capability to record and store “lobe data”, which can be used to construct
approximate magnetic field waveforms in the frequency range of 400 Hz to 400 kHz
associated with lightning discharges (Honma et al, [32]). In 2012, one of the sensors
near the Kansas wind farm had this feature enabled. Starting in May 2013, following an
upgrade to the LS7002 sensors in this region, all nearby NLDN sensors record these
data. For this study, one such waveform was used to help understand the nature of the
associated lightning discharge.
Additional information was also available for some of the events, including a video
recording of the discharges at the wind turbines, and Lightning Mapping Array (LMA)
data (Rison et al. [33], Thomas et al. [34]) from a temporarily-installed LMA in the
wind farm in 2013.
3.1.2 Frequency of lightning strikes to wind turbines
This section presents a statistical analysis of the frequency of lightning incidences
based on the 360 lightning strikes to the wind turbines detected from 2009 to July 2013.
The results of the statistics are compared with the estimations from the IEC standard [2]
and an alternative approach proposed by Eriksson [20].
3.1.2.1 Lightning strikes to wind turbines observed in field
The frequency of lightning strikes per year and wind turbine N has been determined
from the total number of SCADA alarms triggered at the wind turbines, the period of
time when observations took place and the total number of wind turbines in the wind
farm. The value of N and the parameters used to determine N are presented in Table
3-1.
Table 3-1. Summary of lightning strikes to wind turbines observed in field
Parameter Value
Total number of SCADA alarms 360
Period of time [years] 4.5
Number of WT 67
N [strikes/year/WT] 1.19
StDev. N 3.11
Max no. of lightning incidences to a WT in the period of 4.5 years 15
Min no. of lightning incidences to a WT in the period of 4.5 years 0
24 Field measurements of lightning strikes to wind turbines
The analysis of the data also reveals that there is a variation in the number of lighting
incidences in each wind turbine, reflected in Table 3-1 with the standard deviation of N
and the maximum and minimum number of lightning strikes to wind turbines. The
possible causes for this variation are analyzed in Section Chapter 3.
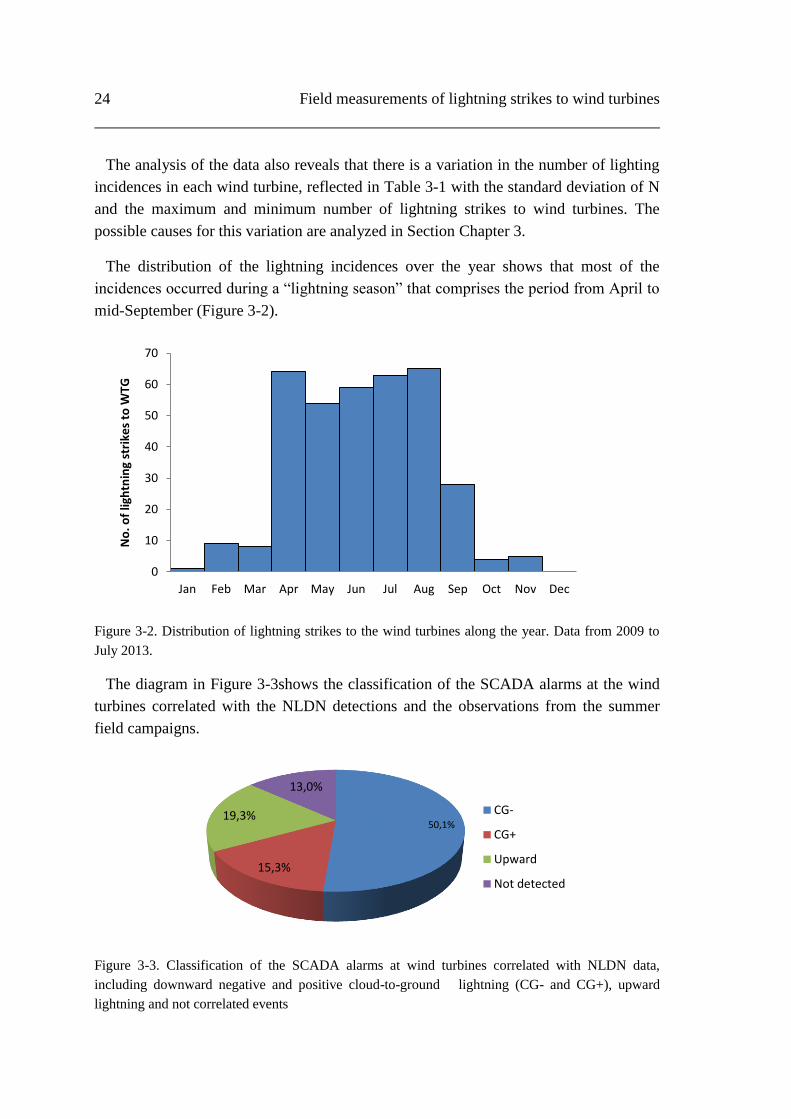
The distribution of the lightning incidences over the year shows that most of the
incidences occurred during a “lightning season” that comprises the period from April to
mid-September (Figure 3-2).
Figure 3-2. Distribution of lightning strikes to the wind turbines along the year. Data from 2009 to
July 2013.
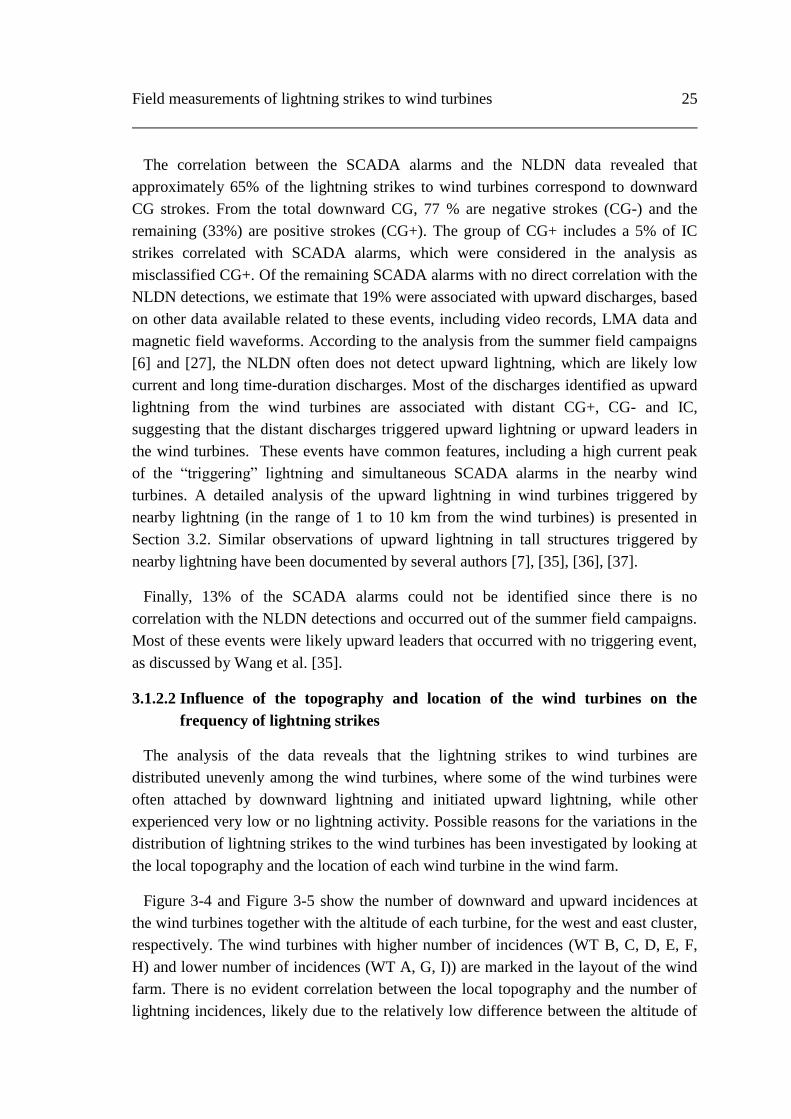
The diagram in Figure 3-3shows the classification of the SCADA alarms at the wind
turbines correlated with the NLDN detections and the observations from the summer
field campaigns.
Figure 3-3. Classification of the SCADA alarms at wind turbines correlated with NLDN data,
including downward negative and positive cloud-to-ground lightning (CG- and CG+), upward
lightning and not correlated events
0
10
20
30
40
50
60
70
Jan Feb Mar Apr May Jun Jul Aug Sep Oct Nov Dec
No
. of
ligh
tnin
g st
rike
s to
WTG
50,1%
15,3%
19,3%
13,0%
CG-
CG+
Upward
Not detected
Field measurements of lightning strikes to wind turbines 25
The correlation between the SCADA alarms and the NLDN data revealed that
approximately 65% of the lightning strikes to wind turbines correspond to downward
CG strokes. From the total downward CG, 77 % are negative strokes (CG-) and the
remaining (33%) are positive strokes (CG+). The group of CG+ includes a 5% of IC
strikes correlated with SCADA alarms, which were considered in the analysis as
misclassified CG+. Of the remaining SCADA alarms with no direct correlation with the
NLDN detections, we estimate that 19% were associated with upward discharges, based
on other data available related to these events, including video records, LMA data and
magnetic field waveforms. According to the analysis from the summer field campaigns
[6] and [27], the NLDN often does not detect upward lightning, which are likely low
current and long time-duration discharges. Most of the discharges identified as upward
lightning from the wind turbines are associated with distant CG+, CG- and IC,
suggesting that the distant discharges triggered upward lightning or upward leaders in
the wind turbines. These events have common features, including a high current peak
of the “triggering” lightning and simultaneous SCADA alarms in the nearby wind
turbines. A detailed analysis of the upward lightning in wind turbines triggered by
nearby lightning (in the range of 1 to 10 km from the wind turbines) is presented in
Section 3.2. Similar observations of upward lightning in tall structures triggered by
nearby lightning have been documented by several authors [7], [35], [36], [37].
Finally, 13% of the SCADA alarms could not be identified since there is no
correlation with the NLDN detections and occurred out of the summer field campaigns.
Most of these events were likely upward leaders that occurred with no triggering event,
as discussed by Wang et al. [35].
3.1.2.2 Influence of the topography and location of the wind turbines on the
frequency of lightning strikes
The analysis of the data reveals that the lightning strikes to wind turbines are
distributed unevenly among the wind turbines, where some of the wind turbines were
often attached by downward lightning and initiated upward lightning, while other
experienced very low or no lightning activity. Possible reasons for the variations in the
distribution of lightning strikes to the wind turbines has been investigated by looking at
the local topography and the location of each wind turbine in the wind farm.
Figure 3-4 and Figure 3-5 show the number of downward and upward incidences at
the wind turbines together with the altitude of each turbine, for the west and east cluster,
respectively. The wind turbines with higher number of incidences (WT B, C, D, E, F,
H) and lower number of incidences (WT A, G, I)) are marked in the layout of the wind
farm. There is no evident correlation between the local topography and the number of
lightning incidences, likely due to the relatively low difference between the altitude of
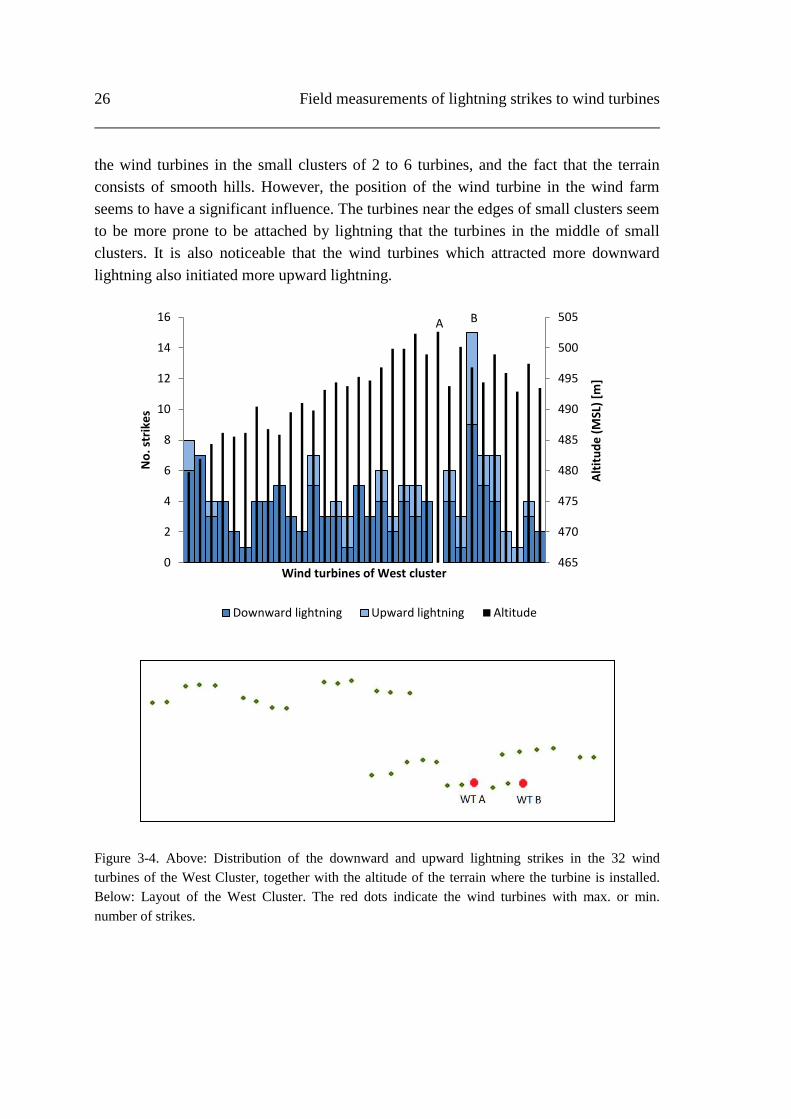
26 Field measurements of lightning strikes to wind turbines
the wind turbines in the small clusters of 2 to 6 turbines, and the fact that the terrain
consists of smooth hills. However, the position of the wind turbine in the wind farm
seems to have a significant influence. The turbines near the edges of small clusters seem
to be more prone to be attached by lightning that the turbines in the middle of small
clusters. It is also noticeable that the wind turbines which attracted more downward
lightning also initiated more upward lightning.
Figure 3-4. Above: Distribution of the downward and upward lightning strikes in the 32 wind
turbines of the West Cluster, together with the altitude of the terrain where the turbine is installed.
Below: Layout of the West Cluster. The red dots indicate the wind turbines with max. or min.
number of strikes.
A B
465
470
475
480
485
490
495
500
505
0
2
4
6
8
10
12
14
16
Alt
itu
de
(M
SL)
[m]
No
. str
ike
s
Wind turbines of West cluster
Downward lightning Upward lightning Altitude
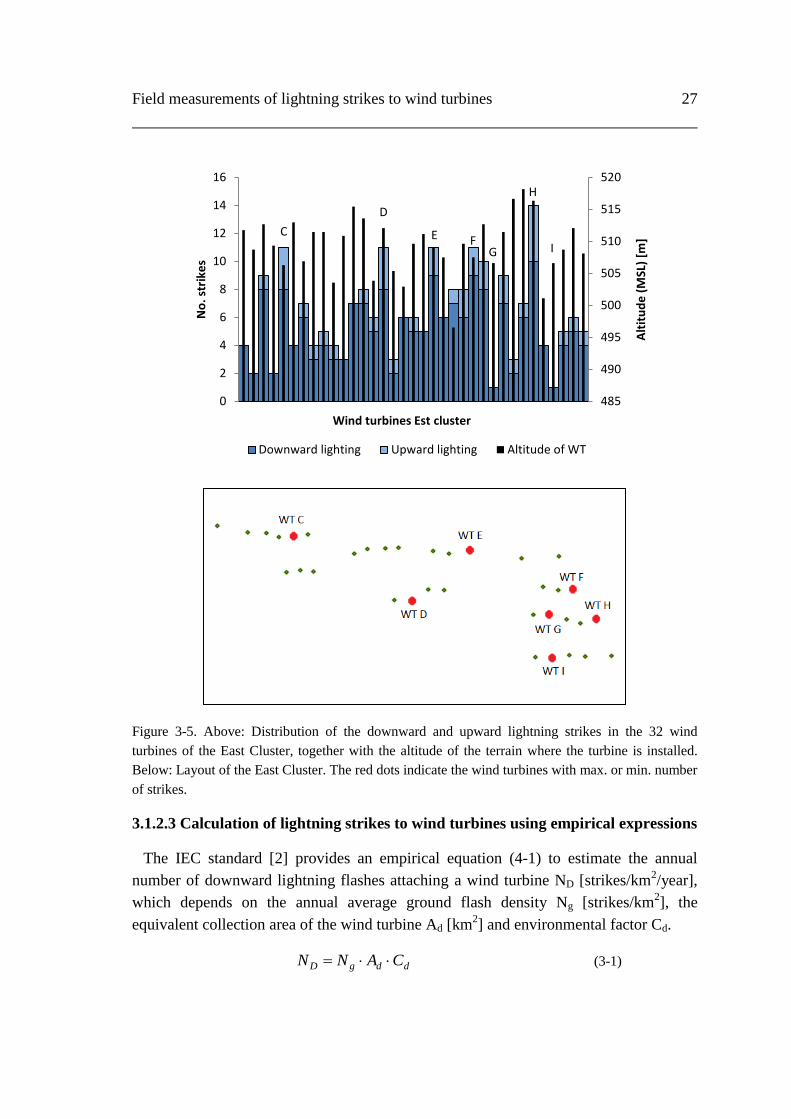
Field measurements of lightning strikes to wind turbines 27
Figure 3-5. Above: Distribution of the downward and upward lightning strikes in the 32 wind
turbines of the East Cluster, together with the altitude of the terrain where the turbine is installed.
Below: Layout of the East Cluster. The red dots indicate the wind turbines with max. or min. number
of strikes.
3.1.2.3 Calculation of lightning strikes to wind turbines using empirical expressions
The IEC standard [2] provides an empirical equation (4-1) to estimate the annual
number of downward lightning flashes attaching a wind turbine ND [strikes/km2/year],
which depends on the annual average ground flash density Ng [strikes/km2], the
equivalent collection area of the wind turbine Ad [km2] and environmental factor Cd.
ddgD CANN (3-1)
C
D
E F G
H
I
485
490
495
500
505
510
515
520
0
2
4
6
8
10
12
14
16
Alt
itu
de
(M
SL)
[m]
No
. str
ike
s
Wind turbines Est cluster
Downward lighting Upward lighting Altitude of WT
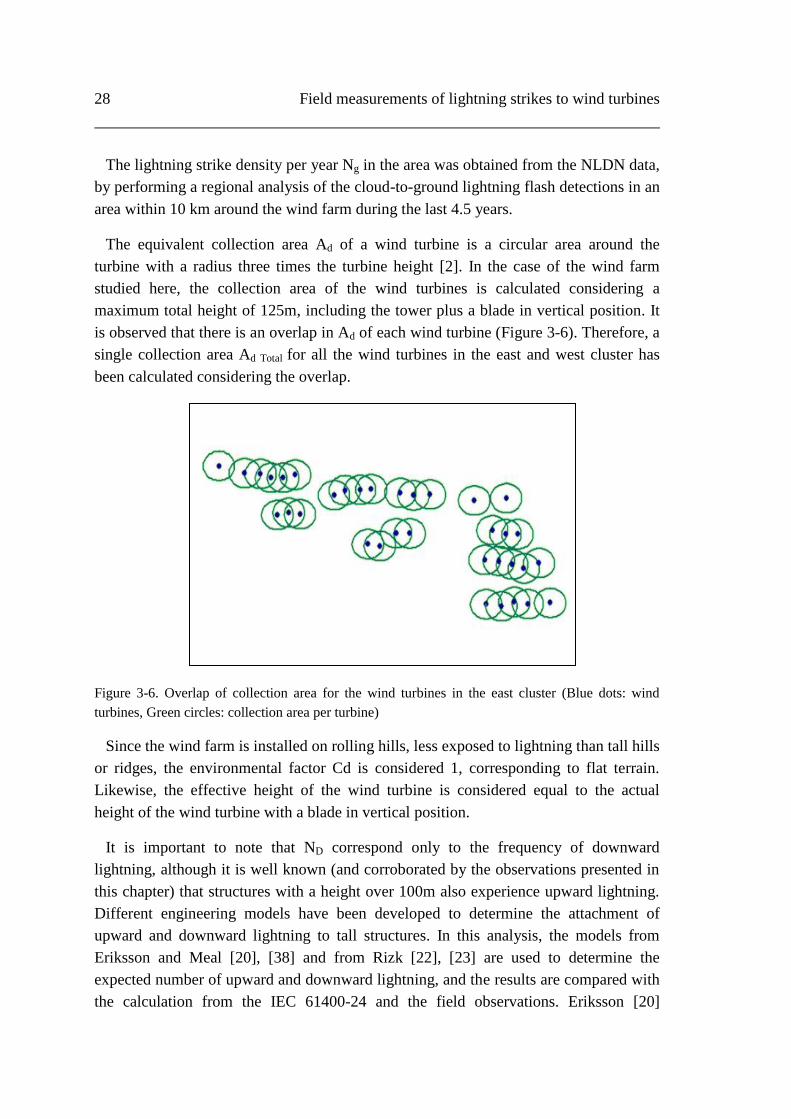
28 Field measurements of lightning strikes to wind turbines
The lightning strike density per year Ng in the area was obtained from the NLDN data,
by performing a regional analysis of the cloud-to-ground lightning flash detections in an
area within 10 km around the wind farm during the last 4.5 years.
The equivalent collection area Ad of a wind turbine is a circular area around the
turbine with a radius three times the turbine height [2]. In the case of the wind farm
studied here, the collection area of the wind turbines is calculated considering a
maximum total height of 125m, including the tower plus a blade in vertical position. It
is observed that there is an overlap in Ad of each wind turbine (Figure 3-6). Therefore, a
single collection area Ad Total for all the wind turbines in the east and west cluster has
been calculated considering the overlap.
Figure 3-6. Overlap of collection area for the wind turbines in the east cluster (Blue dots: wind
turbines, Green circles: collection area per turbine)
Since the wind farm is installed on rolling hills, less exposed to lightning than tall hills
or ridges, the environmental factor Cd is considered 1, corresponding to flat terrain.
Likewise, the effective height of the wind turbine is considered equal to the actual
height of the wind turbine with a blade in vertical position.
It is important to note that ND correspond only to the frequency of downward
lightning, although it is well known (and corroborated by the observations presented in
this chapter) that structures with a height over 100m also experience upward lightning.
Different engineering models have been developed to determine the attachment of
upward and downward lightning to tall structures. In this analysis, the models from
Eriksson and Meal [20], [38] and from Rizk [22], [23] are used to determine the
expected number of upward and downward lightning, and the results are compared with
the calculation from the IEC 61400-24 and the field observations. Eriksson [20]
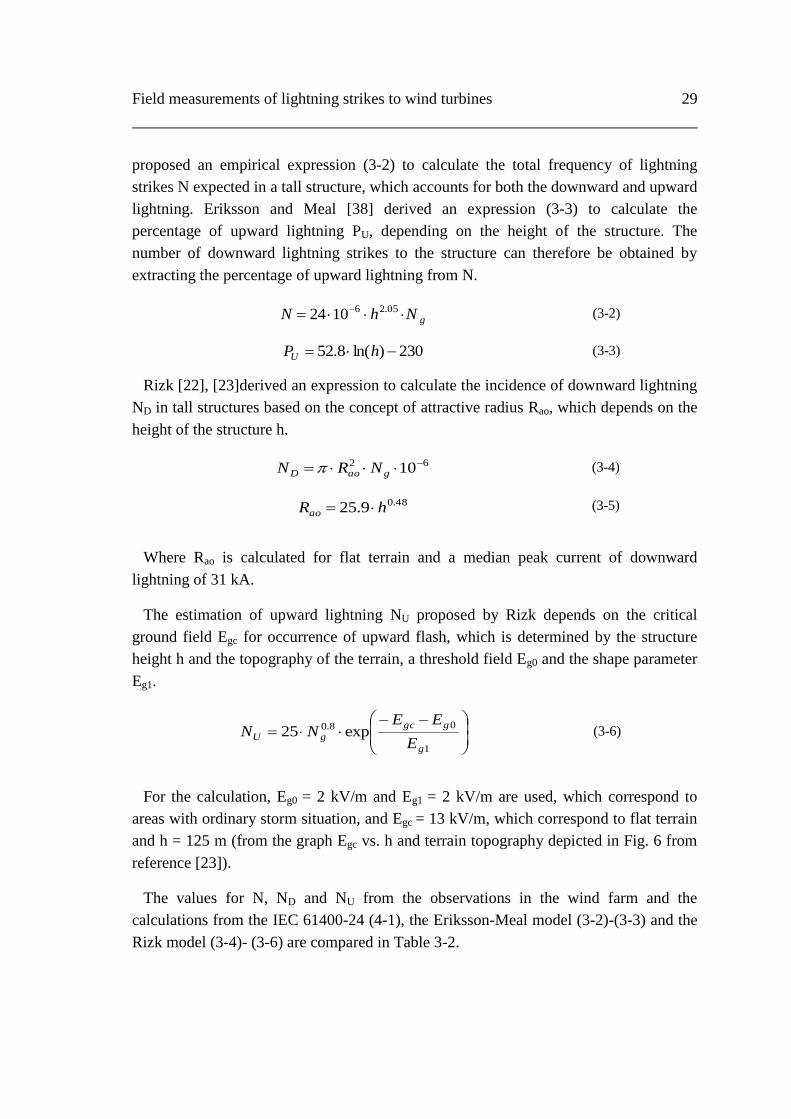
Field measurements of lightning strikes to wind turbines 29
proposed an empirical expression (3-2) to calculate the total frequency of lightning
strikes N expected in a tall structure, which accounts for both the downward and upward
lightning. Eriksson and Meal [38] derived an expression (3-3) to calculate the
percentage of upward lightning PU, depending on the height of the structure. The
number of downward lightning strikes to the structure can therefore be obtained by
extracting the percentage of upward lightning from N.
gNhN 05.261024 (3-2)
230)ln(8.52 hPU (3-3)
Rizk [22], [23]derived an expression to calculate the incidence of downward lightning
ND in tall structures based on the concept of attractive radius Rao, which depends on the
height of the structure h.
62 10 gaoD NRN (3-4)
48.09.25 hRao (3-5)
Where Rao is calculated for flat terrain and a median peak current of downward
lightning of 31 kA.
The estimation of upward lightning NU proposed by Rizk depends on the critical
ground field Egc for occurrence of upward flash, which is determined by the structure
height h and the topography of the terrain, a threshold field Eg0 and the shape parameter
Eg1.
1
08.0 exp25g
ggc
gUE
EENN (3-6)
For the calculation, Eg0 = 2 kV/m and Eg1 = 2 kV/m are used, which correspond to
areas with ordinary storm situation, and Egc = 13 kV/m, which correspond to flat terrain
and h = 125 m (from the graph Egc vs. h and terrain topography depicted in Fig. 6 from
reference [23]).
The values for N, ND and NU from the observations in the wind farm and the
calculations from the IEC 61400-24 (4-1), the Eriksson-Meal model (3-2)-(3-3) and the
Rizk model (3-4)- (3-6) are compared in Table 3-2.

30 Field measurements of lightning strikes to wind turbines
Table 3-2. Frequency of lightning strikes to wind turbines from field observations and empirical
calculations
Observations
N 1.18
ND (PD) 0.92 (78%)
NU (PU) 0.26 (22%)
Calculations according to IEC [4] N 1.01
Calculations according to Eriksson and Meal
[28]
N 1.42
ND (PD) 1.07 (75%)
NU (PU) 0.35 (25%)
Calculations according to Rizk [8], [9]
N 0.89
ND (PD) 0.65 (73%)
NU (PU) 0.24 (27%)
Parameters used in the calculations
Ng [km-2
·year-1
] 2.98 h [m] 125 Ad Total [km
2] 22.73
3.1.3 Lightning peak current
The NLDN data provided the peak current of the downward lightning attaching the
wind turbines, consisting of CG- (183 events) and CG+ (54 events). The lightning peak
current, together with other main parameters of the lightning strokes, has been
investigated by many researchers. The Lightning and Insulator Subcommittee of the
T&D Committee [39] collected a large amount of field observation from different
researchers and derived an expression (3-7) to determine the cumulative probability that
the lightning current will exceed a certain value.
)(5.0)( 00 uerfcIIPC (3-7)
Where erfc is the complementary error function and u0 can be calculated according to
(3-8):
I
IIu
ln
0
02
lnln
(3-8)
Being Iµ the median value of the current peak and σlnI the standard deviation.
Table 3-3 contains the values of Iµ and σlnI used for the calculation of (3-7) and (3-8),
derived from measurements performed by different researchers and compiled in [39]
(see their Tables I and V). It is noted that the values of Iµ and σlnI are derived from
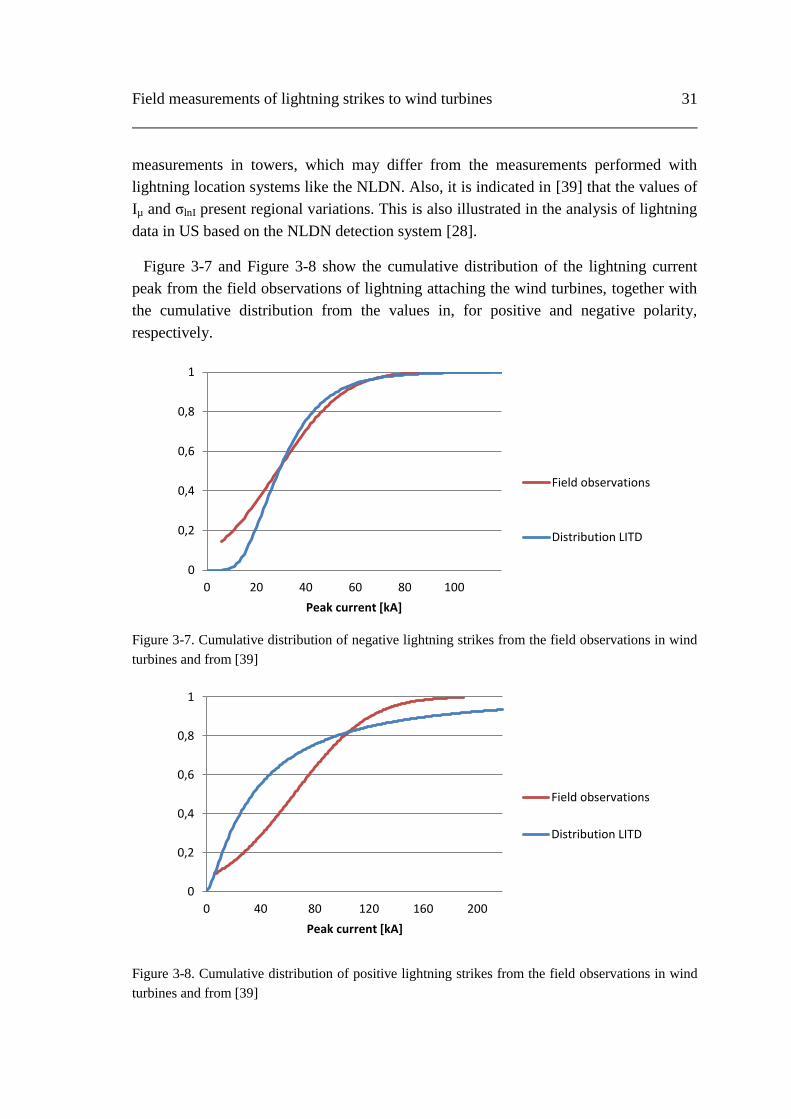
Field measurements of lightning strikes to wind turbines 31
measurements in towers, which may differ from the measurements performed with
lightning location systems like the NLDN. Also, it is indicated in [39] that the values of
Iµ and σlnI present regional variations. This is also illustrated in the analysis of lightning
data in US based on the NLDN detection system [28].
Figure 3-7 and Figure 3-8 show the cumulative distribution of the lightning current
peak from the field observations of lightning attaching the wind turbines, together with
the cumulative distribution from the values in, for positive and negative polarity,
respectively.
Figure 3-7. Cumulative distribution of negative lightning strikes from the field observations in wind
turbines and from [39]
Figure 3-8. Cumulative distribution of positive lightning strikes from the field observations in wind
turbines and from [39]
0
0,2
0,4
0,6
0,8
1
0 20 40 60 80 100
Peak current [kA]
Field observations
Distribution LITD
0
0,2
0,4
0,6
0,8
1
0 40 80 120 160 200
Peak current [kA]
Field observations
Distribution LITD

32 Field measurements of lightning strikes to wind turbines
Table 3-3. Values of the current peak median and standard deviation from [39]
Parameters First negative stroke Positive stroke
Iµ 31.1 35
σlnI 0.48 1.21
3.1.4 Discussion
The lightning observations analyzed here showed that wind turbines experience an
average of 1.19 strikes per turbine per year, including both downward and upward
lightning. The majority of the downward lightning has negative polarity (77% of the
total downward lightning), although this percentage was expected to be even higher,
about 90% [13]. The relative high percentage of positive discharge is attributable to a
particular thunderstorm that with inverse polarity occurred in April 2013 and resulted in
a considerable number of positive downward lightning strikes attaching the wind
turbines. Storms with large number of positive CG flashes (so-called “inverted polarity”
storms) are not uncommon in this region (Carey and Rutledge [40]).
The lightning discharges identified as upward lightning account for 22% of the total
identified SCADA alarms. Since almost none of these discharges were detected by the
NLDN, it is not possible to determine the peak current or the polarity of the upward
lightning. However, the video records, LMA data and magnetic field waveforms from
the summer field campaigns used to identify the upward discharges suggest that they
consist of very low current discharges. Most of these upward discharges were preceded
by a high-current CG flash or cloud flash that was reported by the NLDN, and occurred
during periods when the wind farm was beneath stratiform cloud regions that were
behind multi-cellular thunderstorms. As a final related comment, the equipment from
the summer field campaigns detected more upward discharges and upward leaders from
the wind turbines that did not trigger the SCADA alarms. Therefore, it is inferred that
the percentage of upward discharges from the wind turbines presented here is likely
underestimated.
The distribution of the lightning discharges attaching the wind turbines shows a
significant variation depending on the location of the wind turbine in the wind farm.
Thus, the turbines located at the edges of small clusters are more susceptible to
attachment by downward lightning as well as more likely to initiate upward lightning,
whereas most of the turbines located in the middle of a small cluster experience less
lightning activity. This suggests that the wind turbines with lower number of direct
strikes may be partially shielded by the nearby turbines.
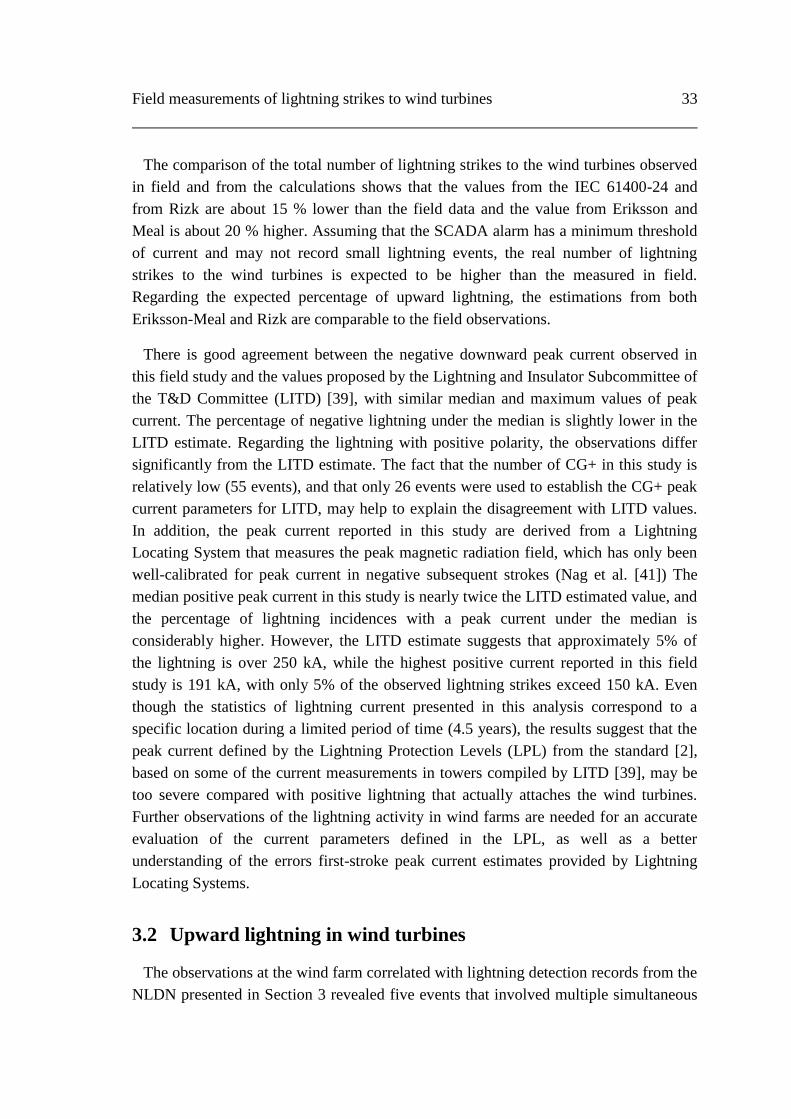
Field measurements of lightning strikes to wind turbines 33
The comparison of the total number of lightning strikes to the wind turbines observed
in field and from the calculations shows that the values from the IEC 61400-24 and
from Rizk are about 15 % lower than the field data and the value from Eriksson and
Meal is about 20 % higher. Assuming that the SCADA alarm has a minimum threshold
of current and may not record small lightning events, the real number of lightning
strikes to the wind turbines is expected to be higher than the measured in field.
Regarding the expected percentage of upward lightning, the estimations from both
Eriksson-Meal and Rizk are comparable to the field observations.
There is good agreement between the negative downward peak current observed in
this field study and the values proposed by the Lightning and Insulator Subcommittee of
the T&D Committee (LITD) [39], with similar median and maximum values of peak
current. The percentage of negative lightning under the median is slightly lower in the
LITD estimate. Regarding the lightning with positive polarity, the observations differ
significantly from the LITD estimate. The fact that the number of CG+ in this study is
relatively low (55 events), and that only 26 events were used to establish the CG+ peak
current parameters for LITD, may help to explain the disagreement with LITD values.
In addition, the peak current reported in this study are derived from a Lightning
Locating System that measures the peak magnetic radiation field, which has only been
well-calibrated for peak current in negative subsequent strokes (Nag et al. [41]) The
median positive peak current in this study is nearly twice the LITD estimated value, and
the percentage of lightning incidences with a peak current under the median is
considerably higher. However, the LITD estimate suggests that approximately 5% of
the lightning is over 250 kA, while the highest positive current reported in this field
study is 191 kA, with only 5% of the observed lightning strikes exceed 150 kA. Even
though the statistics of lightning current presented in this analysis correspond to a
specific location during a limited period of time (4.5 years), the results suggest that the
peak current defined by the Lightning Protection Levels (LPL) from the standard [2],
based on some of the current measurements in towers compiled by LITD [39], may be
too severe compared with positive lightning that actually attaches the wind turbines.
Further observations of the lightning activity in wind farms are needed for an accurate
evaluation of the current parameters defined in the LPL, as well as a better
understanding of the errors first-stroke peak current estimates provided by Lightning
Locating Systems.
3.2 Upward lightning in wind turbines
The observations at the wind farm correlated with lightning detection records from the
NLDN presented in Section 3 revealed five events that involved multiple simultaneous

34 Field measurements of lightning strikes to wind turbines
discharges in different wind turbines. In all five events, the NLDN detected a downward
cloud-to-ground (CG) lightning stroke attaching the ground at a distance of 1 to 10 km
from the affected wind turbines. In two cases, the polarity of the cloud-to-ground
lightning stroke was negative (CG-) while in the other three cases it was positive cloud-
to-ground strokes (CG+), accompanied by small intra-cloud pulses. Only one event was
captured by the video cameras installed in the wind farm, revealing that the
simultaneous discharges at the wind turbines in this case were upward lightning.
Without the video recording in the remaining events, the possible mechanisms causing
the simultaneous discharges at the wind turbines are investigated based on existing
literature, supplementary observations, and our emerging understanding.
3.2.1 Previous observations of upward lightning from tall structures
Previous studies on the incidence of lightning strikes to tall structures show that
structures with an effective height over 100m experience both upward and downward
lightning, and the percentage of upward lightning increases with the height of the
structure [20], [42], [43]. The main characteristics of the electric field that triggers the
upward discharges have been the focus of numerous researchers [13], [22], [26]. A
comprehensive review of the upward lightning discharge by Uman and Rakov [13]
suggests that the upward discharges are more frequently initiated by a rapidly changes
in electric field than by a slow increase of charge in the cloud close to the structure. The
rapid increase of the electric field is generally caused by nearby lightning activity. Field
observations of upward leaders initiated from tall structures have revealed the existence
of upward leaders triggered both by nearby lightning activity and without previous
lightning activity. Wang et al. [35] analyzed the electric field changes of several upward
leaders initiated from wind turbines in Japan during winter thunderstorms. Their
analysis concludes that, although the necessary electric field can be rapidly created due
to nearby lightning or slowly built-up without other close lightning activity, the first
process appears to be more efficient in triggering the upward lightning. Warner et al.
[36] recorded upward lightning discharges from towers in South Dakota, US. Their
correlation between optical observations and data from the NLDN determined that
nearly all the observed upward lightning in that region was triggered by nearby
lightning activity. The lightning discharges that triggered the upward lightning at the
towers were classified into positive cloud-to-ground (CG+) in about 80% of the cases,
and intra-cloud (IC) in the remaining events. The CG+ or IC discharge preceded the
upward lightning at the towers by an average of about 300 ms. Their observations also
show that in approximately half of the registered events, several towers initiated
simultaneous upward leaders. Earlier analysis by Stanley and Heavner [37] of the
observations of lightning associated with tall towers coincides with Warner et al. [36] in
that the nearby CG+ lightning discharges are the predominant initiation mechanism of

Field measurements of lightning strikes to wind turbines 35
upward leaders during the warm season. More recently, Montanyà et al. [7] reported
observations of simultaneous positive upward leaders from a group of wind turbines
triggered by preceding IC lightning.
The initiation of simultaneous upward leaders from multiple tall objects has been
reported in the literature, but is less common than for single isolated objects. A recent
example of four simultaneous upward discharges that were triggered by a single CG+
flash and seen on high-speed video was reported by Warner [44]. In this case, the tall
objects were four communication towers located along a modest-height mountain ridge.
Implicitly, simultaneous upward discharges can only occur if there are closely-spaced
tall objects of comparable effective height. We note that a wind farm is the ultimate
environment meeting these requirements.
The upward leader triggered by a close CG or IC lightning strike is not the only
possible explanation for the multiple discharges in the wind turbines. A negative cloud-
to-ground lightning strike (CG-) typically has 3 to 5 strokes and an average interstroke
interval of about 60ms, and each subsequent return strokes can have a different channel
interception with ground [13]. Thottappillil et al. [45] recorded CG- comprising seven
strokes with four ground terminations, with maximum distances between terminations
of about 5km. A large number of video observations by Valine and Krider [46] indicate
that more than 1/3 of CG- flashes have multiple ground contacts, with an average of
about 1.5 ground contacts per flash. They observed one flash with five ground
termination locations. Another less common feature of CG- lightning is the forked
lightning, consisting of a leader with double branched leaders attaching the ground in
two different points and initiating two simultaneous return strokes. Ballaroti et al. [47]
registered CG- forked lightning with a minimum time separation between the two
strokes of tens of microseconds. For a small set of observations in southeastern China,
Kong et al. [48] found that 15% of the flashes were forked in this manner. Finally,
Stolzenburg et al. [49] observed return-stroke-like upward illuminations on the ground 2
ms after a return stroke, but at a certain distance (up to 2km) from the preceding return
stroke. Their analysis suggests that the upward illumination is a type of return stroke
with a short upward path along one of the leader channels of the downward stepped
leader associated with an earlier return stroke. All of these behaviors provide
mechanisms for at least two (and potentially up to 7) turbines to register simultaneous
current transients in association with a CG flash.
3.2.2 Description of the observations
This section presents the data related to the five events with simultaneous discharges
in several wind turbines, consisting of SCADA alarms and NLDN detections and other
supporting data noted above. The correlation is performed considering the 10-15 second

36 Field measurements of lightning strikes to wind turbines
delay in the SCADA alarms with respect to the NLDN detections. Table 3-4
summarizes the information available for each event, and the characteristics of the
events associated with the CG- and CG+ cases are described in sections 4.1 and 4.2,
respectively. Note that the two cases associated with 10 simultaneous SCADA alarms
had NLDN estimated peak currents in excess of 170 kA (one positive and one negative).
Table 3-4. Data available for the multiple discharge events.
Event Date No. WT with
SCADA alarm Video LMA Detection
1 2011/04/15 10 No No
2 2013/04/17 6 No No
3 2011/05/11 10 No No
4 2013/02/20 7 No No
5 2013/05/30 - Yes Yes
NLDN Detection
Event Type Peak Current
[kA]
Distance to WT [km]
Min Max
1 CG- -192 2.3 3.9
2 CG- -181 0.8 1.5
3 CG+ +171 7.2 9.4
4 CG+ +42 4.1 4.9
5 CG+ +91 ~ 5km from the west cluster
3.2.2.1 Lightning discharges at the wind turbines associated with CG-
Event #1 occurred on 2011/04/15, where SCADA alarms of 10 wind turbines on the
west cluster were registered within a time interval of 4 seconds. These SCADA alarms
are viewed as “simultaneous” given the SCADA reporting procedure discussed above.
The NLDN detected a single high current CG- stroke at the instant of the SCADA
detections, and no other lightning activity during the minutes preceding and following
the event. The discharges reported by the wind turbines were not directly identified with
the NLDN detections since the CG- was located at a distance of 2.3 to 3.9 km from the
closest and furthest wind turbines with SCADA alarm, most likely striking a radio
tower situated in this area. As will be addressed in the Discussion, these location
differences were not caused by location errors in the NLDN reports, but rather by the
nature of the currents in the turbine blades.
Event #2 occurred on 2013/04/17. In this case, the SCADA alarms of 6 wind turbines
from the east cluster were registered within a time interval of 3 seconds. At the time of
the SCADA detections, the NLDN reported a high current CG- stroke at 800m to 1.5
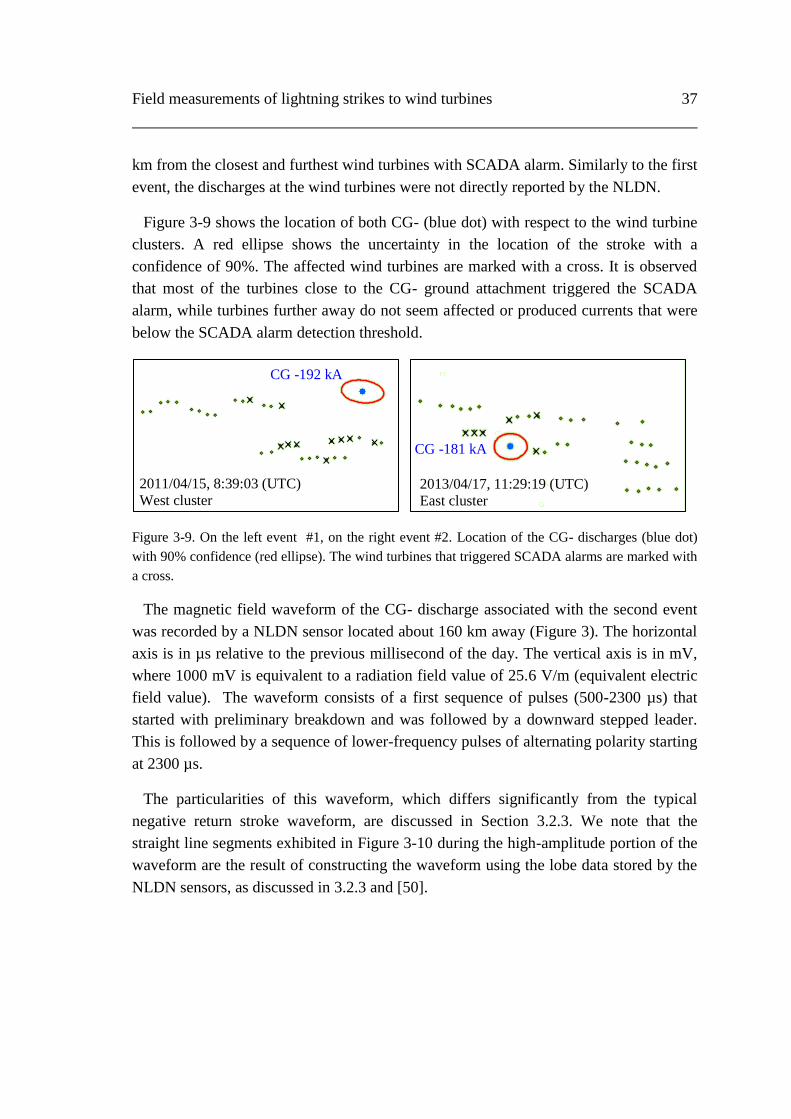
Field measurements of lightning strikes to wind turbines 37
km from the closest and furthest wind turbines with SCADA alarm. Similarly to the first
event, the discharges at the wind turbines were not directly reported by the NLDN.
Figure 3-9 shows the location of both CG- (blue dot) with respect to the wind turbine
clusters. A red ellipse shows the uncertainty in the location of the stroke with a
confidence of 90%. The affected wind turbines are marked with a cross. It is observed
that most of the turbines close to the CG- ground attachment triggered the SCADA
alarm, while turbines further away do not seem affected or produced currents that were
below the SCADA alarm detection threshold.
Figure 3-9. On the left event #1, on the right event #2. Location of the CG- discharges (blue dot)
with 90% confidence (red ellipse). The wind turbines that triggered SCADA alarms are marked with
a cross.
The magnetic field waveform of the CG- discharge associated with the second event
was recorded by a NLDN sensor located about 160 km away (Figure 3). The horizontal
axis is in µs relative to the previous millisecond of the day. The vertical axis is in mV,
where 1000 mV is equivalent to a radiation field value of 25.6 V/m (equivalent electric
field value). The waveform consists of a first sequence of pulses (500-2300 µs) that
started with preliminary breakdown and was followed by a downward stepped leader.
This is followed by a sequence of lower-frequency pulses of alternating polarity starting
at 2300 µs.
The particularities of this waveform, which differs significantly from the typical
negative return stroke waveform, are discussed in Section 3.2.3. We note that the
straight line segments exhibited in Figure 3-10 during the high-amplitude portion of the
waveform are the result of constructing the waveform using the lobe data stored by the
NLDN sensors, as discussed in 3.2.3 and [50].
2011/04/15, 8:39:03 (UTC)
West cluster 2013/04/17, 11:29:19 (UTC)
East cluster
CG -192 kA
CG -181 kA
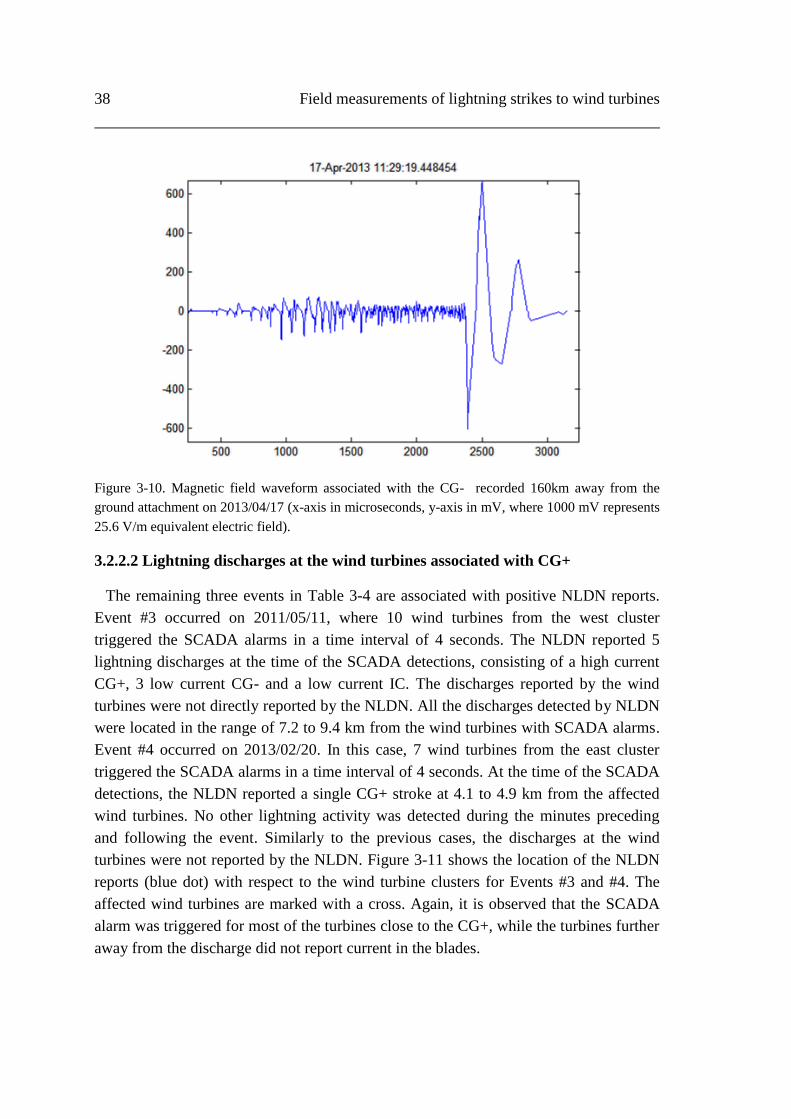
38 Field measurements of lightning strikes to wind turbines
Figure 3-10. Magnetic field waveform associated with the CG- recorded 160km away from the
ground attachment on 2013/04/17 (x-axis in microseconds, y-axis in mV, where 1000 mV represents
25.6 V/m equivalent electric field).
3.2.2.2 Lightning discharges at the wind turbines associated with CG+
The remaining three events in Table 3-4 are associated with positive NLDN reports.
Event #3 occurred on 2011/05/11, where 10 wind turbines from the west cluster
triggered the SCADA alarms in a time interval of 4 seconds. The NLDN reported 5
lightning discharges at the time of the SCADA detections, consisting of a high current
CG+, 3 low current CG- and a low current IC. The discharges reported by the wind
turbines were not directly reported by the NLDN. All the discharges detected by NLDN
were located in the range of 7.2 to 9.4 km from the wind turbines with SCADA alarms.
Event #4 occurred on 2013/02/20. In this case, 7 wind turbines from the east cluster
triggered the SCADA alarms in a time interval of 4 seconds. At the time of the SCADA
detections, the NLDN reported a single CG+ stroke at 4.1 to 4.9 km from the affected
wind turbines. No other lightning activity was detected during the minutes preceding
and following the event. Similarly to the previous cases, the discharges at the wind
turbines were not reported by the NLDN. Figure 3-11 shows the location of the NLDN
reports (blue dot) with respect to the wind turbine clusters for Events #3 and #4. The
affected wind turbines are marked with a cross. Again, it is observed that the SCADA
alarm was triggered for most of the turbines close to the CG+, while the turbines further
away from the discharge did not report current in the blades.
2013/04/17, 11:29:19
(UTC)
East cluster

Field measurements of lightning strikes to wind turbines 39
Figure 3-11. On the left event #3, on the right event #4. Location of the CG- discharges (blue dot).
The wind turbines that triggered SCADA alarms are marked with a cross.
Event #5 occurred on 2013/05/30, and is included here in order to shed light on the
likely nature of the simultaneous SCADA reports associated with CG+ flashes. Two
video cameras installed in the west cluster of the wind farm captured simultaneous
upward discharges in four wind turbines (Figure 3-12).
Figure 3-12. Upward discharges in wind turbines recorded by the video cameras. Above, frame from
the camera installed further away from the west cluster, with a view of 25 wind turbines and the
radio mast. Below, frame from the camera installed close to the west cluster, with a view of 8 wind
turbines (included in the view of the first camera).

40 Field measurements of lightning strikes to wind turbines
At the instant of the upward discharges from the wind turbines, the NLDN detected
nearby lightning activity consisting of a close CG+ with high peak current accompanied
by a small IC, another CG+ further away from the wind farm and 2 CG- with low peak
current.
The LMA data from this event is shown in Figure 3-13. The upper panel is a plan
view of the area, and the lower panel is a time:height depiction of the flash where the
vertical axis is the height of the discharge above local ground level. The image includes
the wind turbines (small blue dots) and the NLDN reports (black circles for CG-, red
circles for CG+ and asterisk for IC).
Figure 3-13. LMA data from the event on 2013/05/30. In the upper plot, the x and y axis correspond
to the longitude [degrees, W] and latitude [degrees, N], respectively and the wind turbines are
represented with blue dots. In the lower plot, the x and y axis correspond to time and altitude above
the ground level (AGL) [m], respectively. In both plots, the color of the detected electrical activity
corresponds to the time, and the NLDN detections of the strokes are marked with black circles for
CG-, red circles for CG+ and asterisk for IC.
The CG+ in this image had a peak current of +92 kA, and it preceded the upward
discharges from the nearby (closest) turbines registered by the video camera in about 50
ms. The LMA “source” points, associated with breakdown processes within the flash,
Field measurements of lightning strikes to wind turbines 41
are color coded by time. Based on the LMA data, this flash started about 20 km
southeast of the eastern edge of the wind farm at a height of about 6 km, an reached the
eastern edge at about 08:59:00.100. Major horizontal channels of this flash then turned
westward and propagated over the east turbines and some of the west turbines. By about
08:59:00.200, the primary horizontal channels turned southward and propagated an
additional 20 km over the next 100 ms. At this time, the large CG+ (red circle) occurred
within the path of this flash, near the location where the main channel turned south. The
LMA discharges then ceased for about 28 ms, ending with the occurrence of the NLDN-
reported cloud pulse (black asterisk). The removal of positive charge aloft by the large
CG+ would have created a rapid change to a negative potential over the turbines shown
in Figure 5, resulting in the numerous simultaneous upward (positive) leaders seen by
the cameras. During the next 300 ms, horizontal leaders propagated at two altitude
ranges (~600 m and 2000 m) in the same area south of the wind farm, and some in the
opposite (north) direction. Clearly this was a complex flash, resulting from a very
complex charge structure in the cloud. Finally, around 08:59:00.600, horizontal
discharges traveling west-to-east reached the middle of the east turbines (see light
brown LMA sources near (39.4N, -97.53W). Following this over-pass of the east
turbines, the NLDN reported 2 CG- strokes (with peak current of -13.6 kA and -8.4 kA),
that seem to have attached to a single wind turbine from the east cluster (both were
located within 60m of this turbine (T120)). Based on experience assessing these
discharges, it is extremely likely that these return strokes are the result of upward
leaders (like those that occurred earlier in the flash and shown in Figure 5) which
reached the negative charge region within the cloud, resulting in a sequence of recoil
leaders and return strokes as reported by Warner et al. [36].
3.2.3 Discussion
The analysis of the data related to the five events associates the simultaneous
discharges in wind turbines with nearby cloud-to-ground lightning strokes. The NLDN
reports revealed that the CG discharges associated with the events present similar
features. Both CG- flashes consisted of a single return stroke with an exceptionally
high peak current (-192 and -181 kA). The three CG+ flashes had medium-high peak
current (+42 to +171 kA), and in two cases they were accompanied by small +IC pulses,
which are likely to be part of the CG+ event. The LMA data associated with Event #5
makes it clear that least in some cases, the high-current CG reports are associated with
widespread and complex charge structures that can result in simultaneous upward
leaders from several wind turbines.
It is also noted that the simultaneous discharges at the wind turbines registered by the
SCADA system and the video cameras are often not reported by the NLDN. This may
42 Field measurements of lightning strikes to wind turbines
indicate that these discharges exhibit very low peak current, or that the events are only
aborted upward leaders. In a few cases in 2012 (not reported here) when NLDN
waveforms were available and upward leaders from 1-2 turbines were captured on
video, the waveform data indicated that the peak currents were quite low, in the range of
2-4 kA. The fact that for Event #5 the upward discharges captured by the video cameras
were not registered by the SCADA system would support this assertion. Unfortunately
the lightning measurement system in the wind turbines only detect peak currents above
a certain threshold level, and does not accurately resolve the actual amplitude of the
recorded events.
Regarding the mechanism that caused the discharges at the wind turbines in the events
associated with nearby CG+, the video recording for Event #5 illustrates that the
discharges at the wind turbines can be upward-moving. Other observations in the
existing literature reported events where upward discharges from tall structures were
initiated by CG+ and IC [35], [36], [37], [7], [44]. This suggests that the simultaneous
discharges at the wind turbines are likely to be upward lightning or upward leaders
triggered by the nearby CG+.
The analysis of the mechanism causing the discharges in the events associated with
CG- is more complex due to the lack of optical observations and existing literature. The
fact that nearby CG+ can trigger upward lightning from tall structures suggests that this
phenomenon may also occur when the polarity of the nearby CG is negative. Work by
Wang et al. [35] demonstrates that this does occur, although much less frequently than
for positive flashes. We are not aware of any reports in the literature indicating
simultaneous upward leaders from numerous tall objects in response to electric field
changes produced by an earlier downward negative flash. Additionally, the CG-
detections are closer to the wind turbines (1 to 4 km) than the CG+ detections (4 to 10
km). Therefore, the possibility of different branches of the CG- stepped leader initiating
and possibly connecting with upward leaders from several wind turbines needs to be
considered. As noted earlier, there is evidence in the literature of negative CG flashes
with sequential strokes attaching to the ground in a few locations, but there are no
observations that support the possibility of 6-10 simultaneous attachments from the
same downward stepped leader (known as forked lightning).
This analysis leads us to consider the possibility that the electric field environment in
the vicinity of the downward propagating negative leaders (prior to the high-current
negative return stroke) is sometimes sufficient to initiate high-current upward positive
leaders from numerous nearby wind turbines. It is not unusual for the negative leader
branches near the ground, prior to ground attachment, to be spread over a horizontal
domain with a radius of several km. The very high potential along the lower portions of

Field measurements of lightning strikes to wind turbines 43
these leader channels are known to create sufficient electric fields to initiate upward
positive leaders. Since these leader channels as descending rapidly towards ground, the
electric field at the turbine blades may be increasing rapidly enough to “beat out” the
developed corona screening, facilitating initiation of upward positive leaders (see
Becerra and Cooray [51]). The high-current negative flashes presented in this analysis
would have had accompanying high leader charge density and potential, further
encouraging strong upward leaders. All this could easily lead to simultaneous high-
current upward leaders from turbines that are several km from the eventual ground
stroke location of these single- stroke negative flashes.
The electromagnetic waveform of the CG- recorded during Event #2, shown in Figure
3-10, supports this possibility. The waveform is similar to the negative upward lightning
discharges observed by Ishii and Saito [50] and Honma et al. [52] in winter storms in
Japan, consisting of a long duration complex leader activity following by multiple high-
current bipolar pulses. This suggests that this CG- is the likely the result of extremely
long upward leaders by multiple tall objects that are initiated by high charge-density
downward leaders, meeting at altitudes on the order of several km AGL. An elevated
contact point such as this could produce the bipolar shape of the high-current (large
magnetic field) discharge. There would be no assurance that the main return stroke
channel would be associated with one of the turbines. Although the majority of the
current would pass through a primary ground contact, it is not unlikely that moderately
high simultaneous currents would occur in nearby locations, most-readily in elevated
objects such as wind turbines. The lower simultaneous current flowing through the
branches of the stepped leaders connecting with the upward leaders initiated at the
turbines would be the reason for not being reported by the NLDN, which bases its
arrival-time and arrival-angle information on the largest component of the magnetic
field waveform.
Concerning the number and location of the wind turbines affected by the simultaneous
discharges, it is noted that in most cases the SCADA alarms were triggered in the wind
turbines closest to the CG connection to the ground. The altitude (MSL) of the wind
turbines, that only differs by ~20 m between turbines of the east and west clusters, does
not seem to have a significant influence. However, it is observed that the turbines at the
outer sides of the wind farm, which are often at the edge of the hills, appear to be more
prone to be affected.
It also has to be considered that the SCADA alarms may not be triggered for low
current discharges, as was shown for the video registering of the CG+ event. Therefore,
it is very likely that more wind turbines initiate upward discharges due to the nearby
lightning activity than those registered by the SCADA system. This is of great
44 Field measurements of lightning strikes to wind turbines
significance for the risk assessment of lightning strikes in wind turbines, since the
number of lightning strikes expected may be underestimated.
Finally, if aborted leaders appear on a large number of turbines but are not detected by
the SCADA system, the protection concept must be capable of handling the impact. The
current pulses may not cause structural damages to blades or other wind turbine
structures, but the immunity and EM compliance of electronic equipment installed on
the turbine must be compatible with this environment.
3.3 Lightning damage to wind turbine blades
According to field observations, wind turbines experience a significant number of
lightning strikes during their lifetim, mostly to the rotor blades. The lightning current
causes severe damage to the blade structural materials and involves considerable costs
of repair - materials, labor and downtime. Therefore, lightning protection of blades is a
very important issue often addressed as one of the two largest environmentally caused
concerns for wind turbine blades, the other being leading edge erosion. The
requirements for an efficient lightning protection system (LPS) of the blade are
specified in the standard IEC 61400-24 [2]. However, lightning damage still occurs in
blades equipped with lightning protection systems, in particular due to interception
failure of the air termination system during direct lightning attachment on the blade
surface.
The standard [2] proposes a procedure to design the blade LPS based on the threat of
direct lightning attachment to the blade, which is evaluated according to the Lightning
Protection Zones (LPZ). High voltage tests simulating the lightning events expected in
field are also recommended to validate the LPS. The blades are classified in the
standard as Lightning Protection Zone 0A, which implies that the entire blade is exposed
to direct lightning strikes, the full current and the un-attenuated magnetic field. This
classification of the blade has been questioned by several authors, including Peesapati et
al. [3] and Madsen et al. [53]. They point out that, according to their field observation
and numerical calculations, the majority of the lightning strikes occur at the last few
meters of the blade tip. Furthermore, Madsen et al. [53] suggest a new zoning concept
for the blade based on more realistic assessment of the lightning attachment points
along the blade, where only the outermost radii of the blade are exposed to the full
amplitude of the lightning current while inboard radii are only partially exposed or not
exposed to direct strikes at all.
The analysis of the lightning damage on blades experienced in field is the most direct
and reliable tool to validate the LPS effectiveness and evaluate the methods of risk
Field measurements of lightning strikes to wind turbines 45
assessment proposed in the standard. Unfortunately, there is little information available
in this regards. The published research mainly concerns blade damage caused by winter
lightning in Japan [9], [10]. This section presents general statistics of lightning damages
on blades reported in different wind farms in U.S. The damage has been classified
according to the location along the blade and the severity. Finally, the results are
compared with the expected damage according to the standard [2] and the existing
literature [3], [53], [9], [10] .
3.3.1 Description of the analysis data
The analysis presented here is based on 304 lightning incidences causing damage to
wind turbine blades that required significant repair. The analysis was performed for a
period of approximately 5 years, with a total population of 508 wind turbines.
Therefore, on average each wind turbine experienced blade damage due to lighting
every 8.4 years. This accounts for 2-3 blade damage incidences due to lightning during
an estimated wind turbine life time of 20 years.
The analysis includes burns, punctures, delamination of the blade structure, debonding
of the shells and detachment of part of the blade, but not only cosmetic damages such as
peeling paint, superficial marks or slight melting of the air termination system. The
analysis comprises only lightning damages associated with the lightning attachment
process, when the air termination fails in intercepting the strike. Consequently, it does
not include damage occurred during the current transmission to ground, such as burns
and melting of the down conductor and connectors due to lack of proper equipotential
bonding.
The analyzed damages occurred in a varied population of blades, with lengths over 35
m. The structure of the damaged blades includes fiberglass only (64.8% of the blades),
and mixed structures of fiberglass and carbon fiber (35.2% of the blades). Regarding the
load carrying structure of the blade, it consists box beam spar in 76% of the damage
blades and structural shell in the remaining 24 %. All the damaged blades were
equipped with lightning protection, which included an air termination system, a down
conductor and a connection system to transmit the lightning current to the nacelle. Each
blade model had a different type of air termination system, including a single pair of
receptors at the tip, several discrete receptors along the blade, a metallic tip, a metallic
band over the caps and metallic mesh covering part of the shell. It is noted that all the
wind turbine blades were designed and manufactured prior to the publication of the IEC
61400-24.
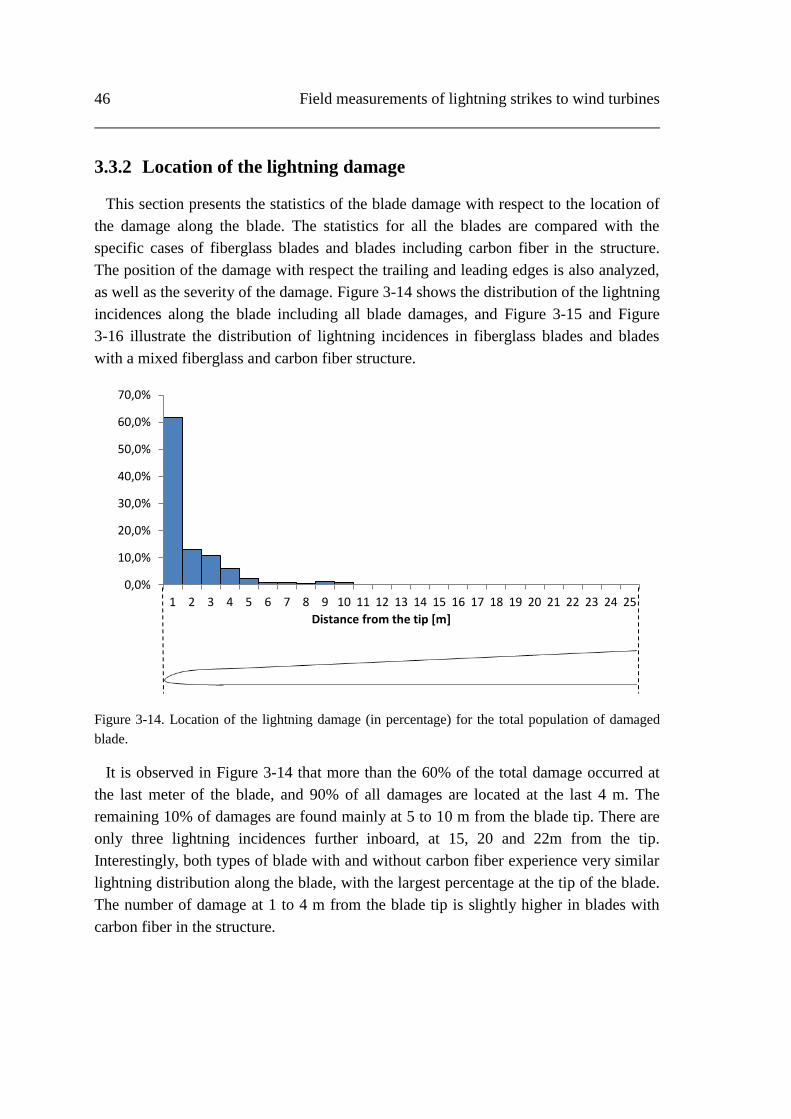
46 Field measurements of lightning strikes to wind turbines
3.3.2 Location of the lightning damage
This section presents the statistics of the blade damage with respect to the location of
the damage along the blade. The statistics for all the blades are compared with the
specific cases of fiberglass blades and blades including carbon fiber in the structure.
The position of the damage with respect the trailing and leading edges is also analyzed,
as well as the severity of the damage. Figure 3-14 shows the distribution of the lightning
incidences along the blade including all blade damages, and Figure 3-15 and Figure
3-16 illustrate the distribution of lightning incidences in fiberglass blades and blades
with a mixed fiberglass and carbon fiber structure.
Figure 3-14. Location of the lightning damage (in percentage) for the total population of damaged
blade.
It is observed in Figure 3-14 that more than the 60% of the total damage occurred at
the last meter of the blade, and 90% of all damages are located at the last 4 m. The
remaining 10% of damages are found mainly at 5 to 10 m from the blade tip. There are
only three lightning incidences further inboard, at 15, 20 and 22m from the tip.
Interestingly, both types of blade with and without carbon fiber experience very similar
lightning distribution along the blade, with the largest percentage at the tip of the blade.
The number of damage at 1 to 4 m from the blade tip is slightly higher in blades with
carbon fiber in the structure.
0,0%
10,0%
20,0%
30,0%
40,0%
50,0%
60,0%
70,0%
1 2 3 4 5 6 7 8 9 10 11 12 13 14 15 16 17 18 19 20 21 22 23 24 25
Distance from the tip [m]

Field measurements of lightning strikes to wind turbines 47
Figure 3-15. Location of the lightning damage (in percentage) for the total population of damaged
blades with mixed fiberglass and carbon fiber structure.
Figure 3-16. Location of the lightning damage (in percentage) in damaged blades with mixed
fiberglass and carbon fiber structure.
The lightning damage on the blades has also been classified according to whether the
lightning attached the blade surface adjacent to the spar caps, the trailing edge, the
leading edge or the area including the last 0.5 m of the blade tip (Figure 3-17).
0,0%
10,0%
20,0%
30,0%
40,0%
50,0%
60,0%
70,0%
1 2 3 4 5 6 7 8 9 10 11 12 13 14 15 16 17 18 19 20 21 22 23 24 25
Distance from the tip [m]
0,0%
10,0%
20,0%
30,0%
40,0%
50,0%
60,0%
70,0%
1 2 3 4 5 6 7 8 9 10 11 12 13 14 15 16 17 18 19 20 21 22 23 24 25
Distance from the tip [m]
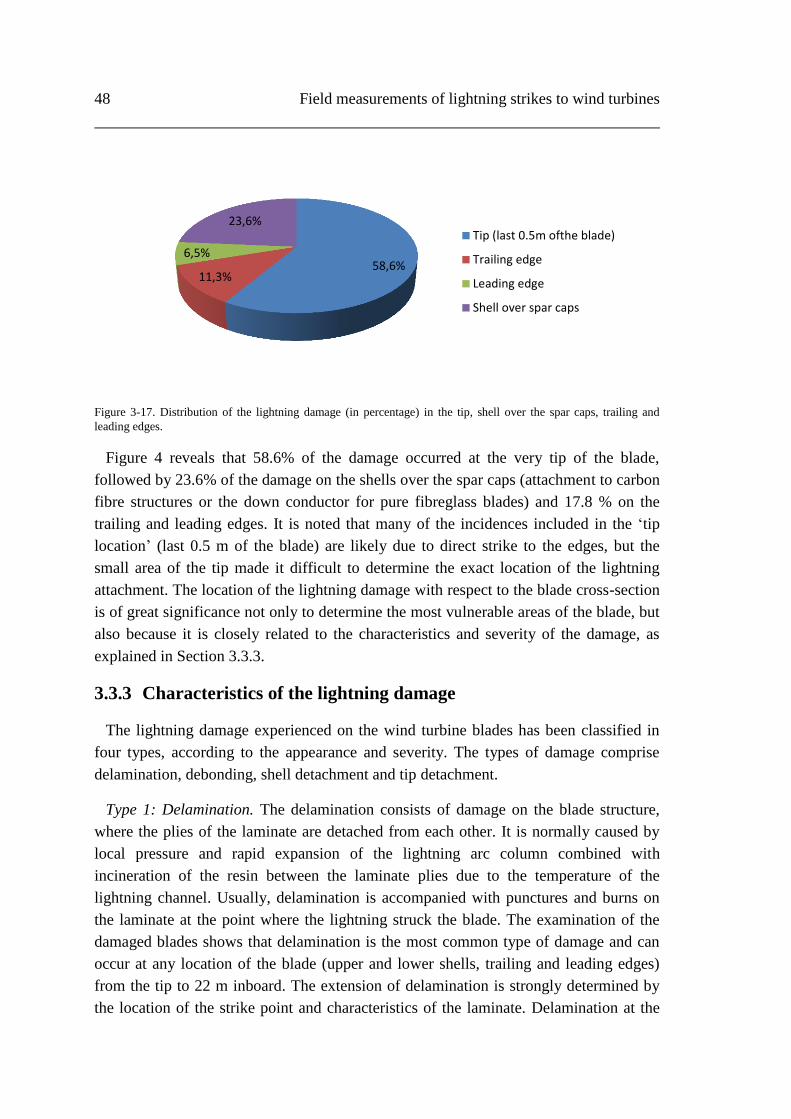
48 Field measurements of lightning strikes to wind turbines
Figure 3-17. Distribution of the lightning damage (in percentage) in the tip, shell over the spar caps, trailing and
leading edges.
Figure 4 reveals that 58.6% of the damage occurred at the very tip of the blade,
followed by 23.6% of the damage on the shells over the spar caps (attachment to carbon
fibre structures or the down conductor for pure fibreglass blades) and 17.8 % on the
trailing and leading edges. It is noted that many of the incidences included in the ‘tip
location’ (last 0.5 m of the blade) are likely due to direct strike to the edges, but the
small area of the tip made it difficult to determine the exact location of the lightning
attachment. The location of the lightning damage with respect to the blade cross-section
is of great significance not only to determine the most vulnerable areas of the blade, but
also because it is closely related to the characteristics and severity of the damage, as
explained in Section 3.3.3.
3.3.3 Characteristics of the lightning damage
The lightning damage experienced on the wind turbine blades has been classified in
four types, according to the appearance and severity. The types of damage comprise
delamination, debonding, shell detachment and tip detachment.
Type 1: Delamination. The delamination consists of damage on the blade structure,
where the plies of the laminate are detached from each other. It is normally caused by
local pressure and rapid expansion of the lightning arc column combined with
incineration of the resin between the laminate plies due to the temperature of the
lightning channel. Usually, delamination is accompanied with punctures and burns on
the laminate at the point where the lightning struck the blade. The examination of the
damaged blades shows that delamination is the most common type of damage and can
occur at any location of the blade (upper and lower shells, trailing and leading edges)
from the tip to 22 m inboard. The extension of delamination is strongly determined by
the location of the strike point and characteristics of the laminate. Delamination at the
58,6% 11,3%
6,5%
23,6% Tip (last 0.5m ofthe blade)
Trailing edge
Leading edge
Shell over spar caps
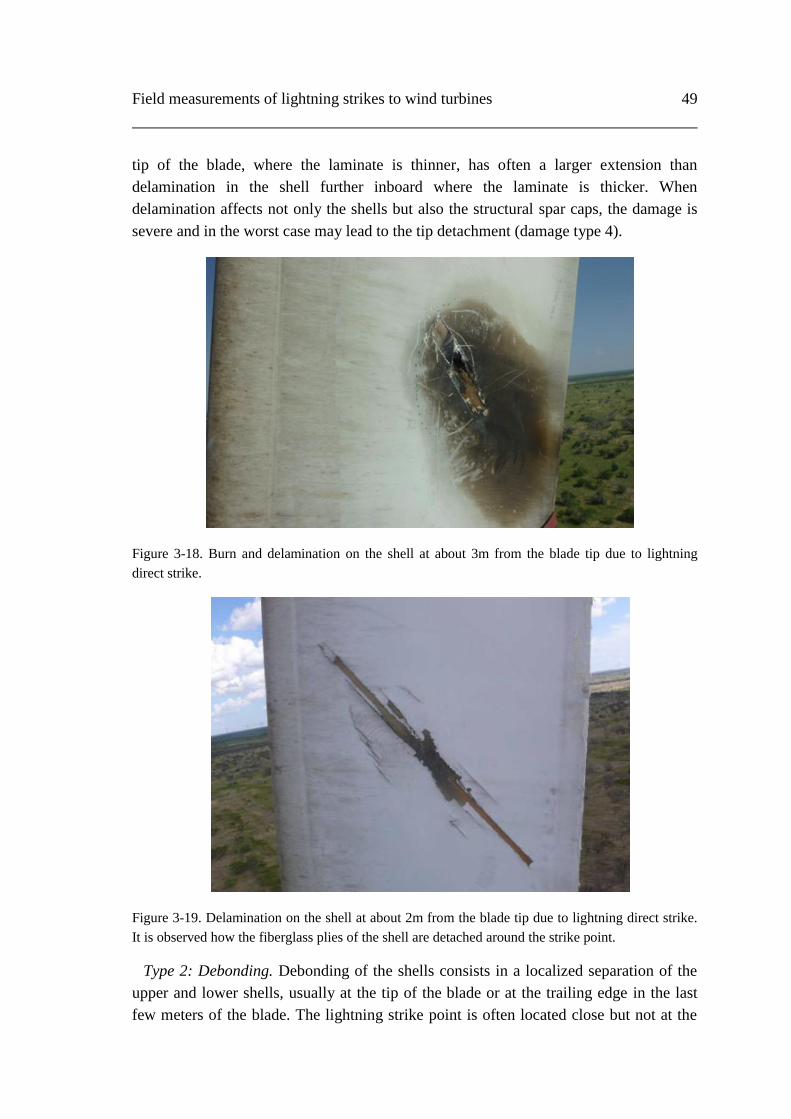
Field measurements of lightning strikes to wind turbines 49
tip of the blade, where the laminate is thinner, has often a larger extension than
delamination in the shell further inboard where the laminate is thicker. When
delamination affects not only the shells but also the structural spar caps, the damage is
severe and in the worst case may lead to the tip detachment (damage type 4).
Figure 3-18. Burn and delamination on the shell at about 3m from the blade tip due to lightning
direct strike.
Figure 3-19. Delamination on the shell at about 2m from the blade tip due to lightning direct strike.
It is observed how the fiberglass plies of the shell are detached around the strike point.
Type 2: Debonding. Debonding of the shells consists in a localized separation of the
upper and lower shells, usually at the tip of the blade or at the trailing edge in the last
few meters of the blade. The lightning strike point is often located close but not at the

50 Field measurements of lightning strikes to wind turbines
debonded area, which suggests that the cause of the debonding is the expansion of the
air inside the blade due to the heat generated by the lightning channel, possibly
combined with vaporization of condensed moisture trapped inside the blade. All the
examined blades that suffered debonding were accompanied with a certain degree of
delamination.
Figure 3-20. Delamination on the shell over the cap and debonding of the trailing edge likely caused
by the expansion of the air caused by the lightning current.
Type 3: Shell detachment. The shell detachment consists of several meters of one or
both shells completely detached from the load carrying structure. The examination of
the affected blades suggests that the damage started with a shell debonding (damage
type 2). The rotation of the blades combined with the strong wind gusts during the
thunderstorm load the debonded area, eventually causing shell detachment. This type of
damage did not occur frequently. It is noted that in the cases of shell detachment
analyzed here, even if the damage affected several meters of the shell, the lightning
attachment point was located within the last 3m of the blade tip.
Figure 3-21. Detachment of the shells from the spar (load carrying structure) at the last meters of the
blade.
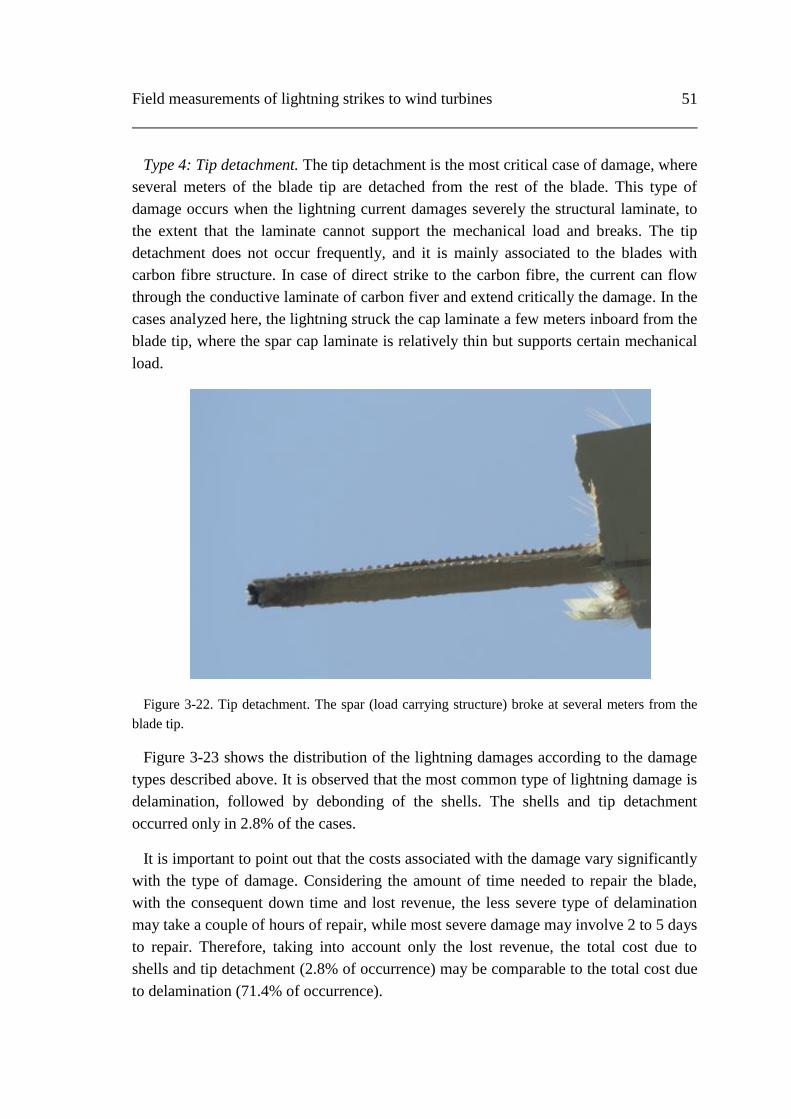
Field measurements of lightning strikes to wind turbines 51
Type 4: Tip detachment. The tip detachment is the most critical case of damage, where
several meters of the blade tip are detached from the rest of the blade. This type of
damage occurs when the lightning current damages severely the structural laminate, to
the extent that the laminate cannot support the mechanical load and breaks. The tip
detachment does not occur frequently, and it is mainly associated to the blades with
carbon fibre structure. In case of direct strike to the carbon fibre, the current can flow
through the conductive laminate of carbon fiver and extend critically the damage. In the
cases analyzed here, the lightning struck the cap laminate a few meters inboard from the
blade tip, where the spar cap laminate is relatively thin but supports certain mechanical
load.
Figure 3-22. Tip detachment. The spar (load carrying structure) broke at several meters from the
blade tip.
Figure 3-23 shows the distribution of the lightning damages according to the damage
types described above. It is observed that the most common type of lightning damage is
delamination, followed by debonding of the shells. The shells and tip detachment
occurred only in 2.8% of the cases.
It is important to point out that the costs associated with the damage vary significantly
with the type of damage. Considering the amount of time needed to repair the blade,
with the consequent down time and lost revenue, the less severe type of delamination
may take a couple of hours of repair, while most severe damage may involve 2 to 5 days
to repair. Therefore, taking into account only the lost revenue, the total cost due to
shells and tip detachment (2.8% of occurrence) may be comparable to the total cost due
to delamination (71.4% of occurrence).
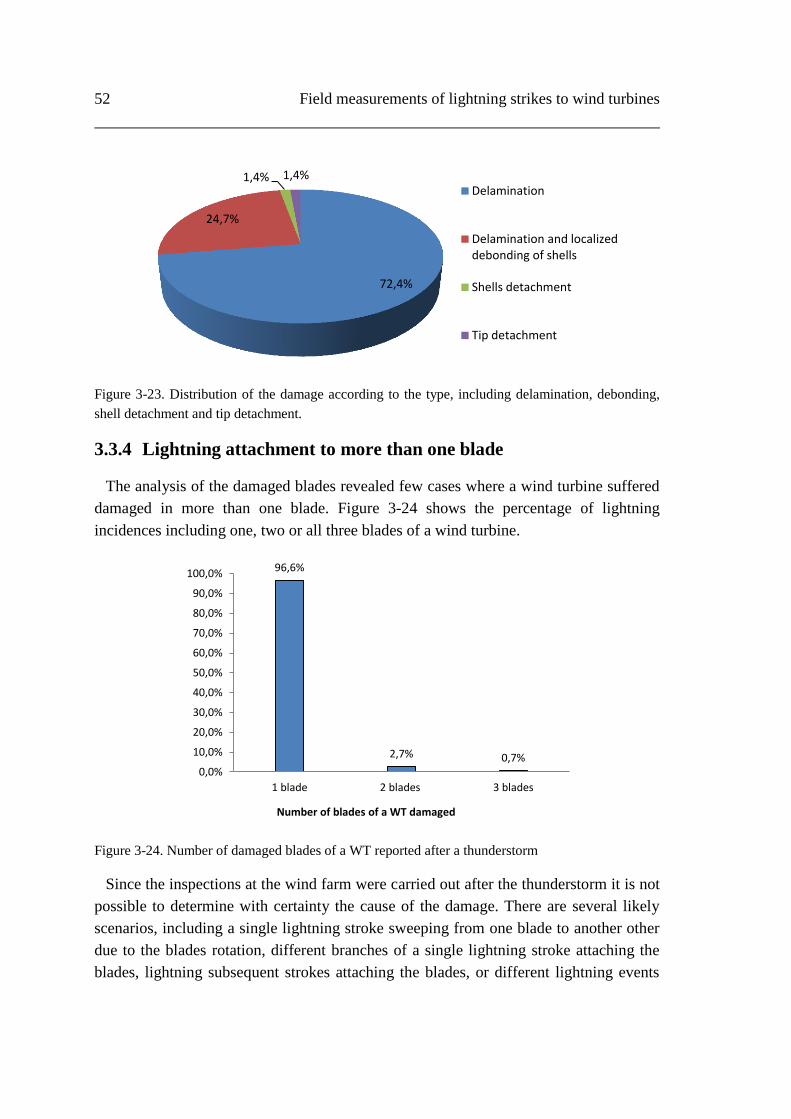
52 Field measurements of lightning strikes to wind turbines
Figure 3-23. Distribution of the damage according to the type, including delamination, debonding,
shell detachment and tip detachment.
3.3.4 Lightning attachment to more than one blade
The analysis of the damaged blades revealed few cases where a wind turbine suffered
damaged in more than one blade. Figure 3-24 shows the percentage of lightning
incidences including one, two or all three blades of a wind turbine.
Figure 3-24. Number of damaged blades of a WT reported after a thunderstorm
Since the inspections at the wind farm were carried out after the thunderstorm it is not
possible to determine with certainty the cause of the damage. There are several likely
scenarios, including a single lightning stroke sweeping from one blade to another other
due to the blades rotation, different branches of a single lightning stroke attaching the
blades, lightning subsequent strokes attaching the blades, or different lightning events
72,4%
24,7%
1,4% 1,4% Delamination
Delamination and localizeddebonding of shells
Shells detachment
Tip detachment
96,6%
2,7% 0,7% 0,0%
10,0%
20,0%
30,0%
40,0%
50,0%
60,0%
70,0%
80,0%
90,0%
100,0%
1 blade 2 blades 3 blades
Number of blades of a WT damaged
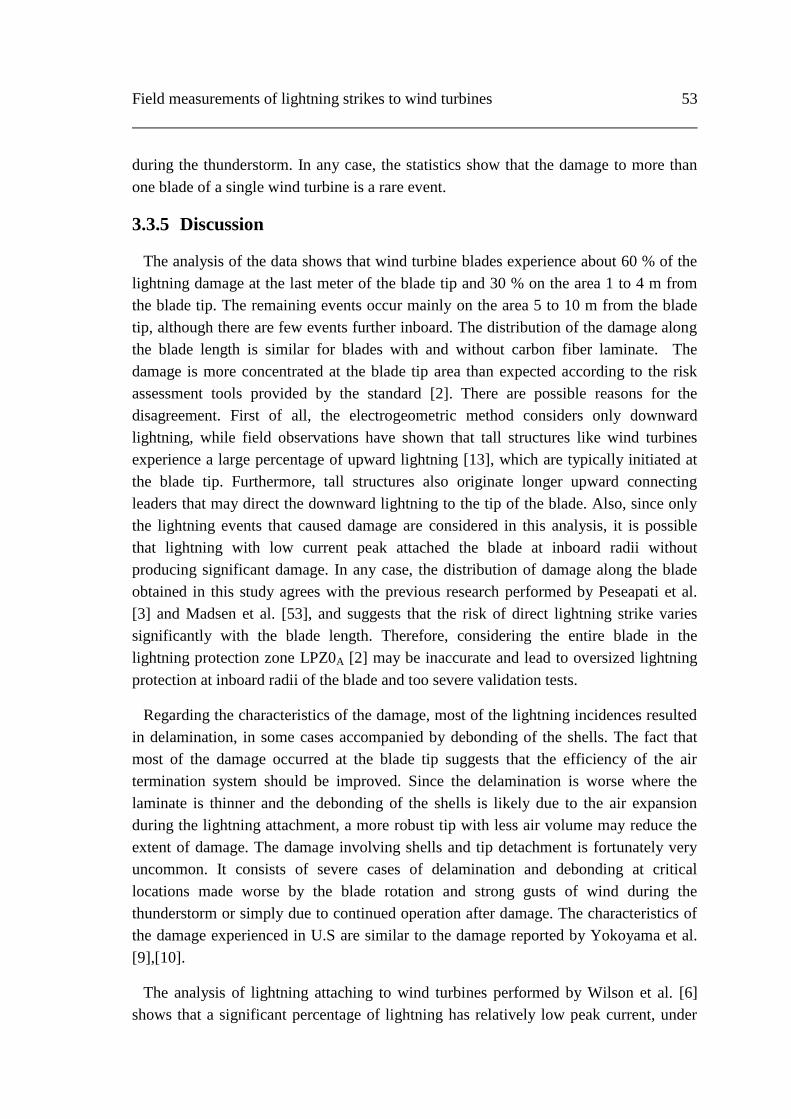
Field measurements of lightning strikes to wind turbines 53
during the thunderstorm. In any case, the statistics show that the damage to more than
one blade of a single wind turbine is a rare event.
3.3.5 Discussion
The analysis of the data shows that wind turbine blades experience about 60 % of the
lightning damage at the last meter of the blade tip and 30 % on the area 1 to 4 m from
the blade tip. The remaining events occur mainly on the area 5 to 10 m from the blade
tip, although there are few events further inboard. The distribution of the damage along
the blade length is similar for blades with and without carbon fiber laminate. The
damage is more concentrated at the blade tip area than expected according to the risk
assessment tools provided by the standard [2]. There are possible reasons for the
disagreement. First of all, the electrogeometric method considers only downward
lightning, while field observations have shown that tall structures like wind turbines
experience a large percentage of upward lightning [13], which are typically initiated at
the blade tip. Furthermore, tall structures also originate longer upward connecting
leaders that may direct the downward lightning to the tip of the blade. Also, since only
the lightning events that caused damage are considered in this analysis, it is possible
that lightning with low current peak attached the blade at inboard radii without
producing significant damage. In any case, the distribution of damage along the blade
obtained in this study agrees with the previous research performed by Peseapati et al.
[3] and Madsen et al. [53], and suggests that the risk of direct lightning strike varies
significantly with the blade length. Therefore, considering the entire blade in the
lightning protection zone LPZ0A [2] may be inaccurate and lead to oversized lightning
protection at inboard radii of the blade and too severe validation tests.
Regarding the characteristics of the damage, most of the lightning incidences resulted
in delamination, in some cases accompanied by debonding of the shells. The fact that
most of the damage occurred at the blade tip suggests that the efficiency of the air
termination system should be improved. Since the delamination is worse where the
laminate is thinner and the debonding of the shells is likely due to the air expansion
during the lightning attachment, a more robust tip with less air volume may reduce the
extent of damage. The damage involving shells and tip detachment is fortunately very
uncommon. It consists of severe cases of delamination and debonding at critical
locations made worse by the blade rotation and strong gusts of wind during the
thunderstorm or simply due to continued operation after damage. The characteristics of
the damage experienced in U.S are similar to the damage reported by Yokoyama et al.
[9],[10].
The analysis of lightning attaching to wind turbines performed by Wilson et al. [6]
shows that a significant percentage of lightning has relatively low peak current, under

54 Field measurements of lightning strikes to wind turbines
30 kA and there are only few events with a peak current higher than 50 kA. This
suggests that lightning with average current parameters may cause severe damage in
some cases, depending on the location of the attachment, characteristics of the blade
laminate and wind conditions at the moment of the lightning damage. Unfortunately,
this study does not include the measurement of the lightning current parameters
attaching the blade to correlate with the extent of the damage.
Chapter 4
Lightning attachment to wind turbine blades
The research carried out in Chapter 3 indicates that the lightning attachment to the
wind turbine blades is not always effectively addressed. In order to understand some of
the failure modes of the blade related to the lightning attachment, the physics of the
electrical discharge needs to be considered. The main methods used to investigate the
lightning attachment are the replication of the field conditions by means of experiments
in the high voltage laboratory or by using analytical simulation models. The
investigation of the lightning attachment to the wind turbines is aimed at improving the
efficiency of the air termination system, thus reducing the risk of lightning damage in
field.
The positioning of lightning air terminations along a wind turbine blade is a complex
issue to address when designing the lightning protection of blades. According to the
IEC 61400-24 [2], the air termination system should be placed on the surface areas of
the blade where upward leaders may originate and cause lightning attachment or
punctures if no air terminations were present. However, the location of possible
lightning strike points on the blade may be difficult to determine, mainly due to the
strong influence of the conductive components inside the blade, such as internal
elements of the lightning protection or the carbon fiber laminate. Furthermore, the
presence of air cavities in the shells adhesive, inhomogeneities in the fiberglass
laminate, accumulation of water inside the blade or pollution on the shell surface have
also a significant effect in the lightning attachment to blades. For all this reasons, the
failure of the air termination system in intercepting the lightning discharge with the
consequent attachment on the shells surface is the most common cause of lightning
damage in blades [11].
56 Lightning attachment to wind turbine blades
The lightning air termination system of a blade may be verified with high voltage
tests, analytical tools and by similarity with another blade with successful service
experience. When the option of verification by similarity is not available, the high
voltage tests are the most reliable method to reproduce the lightning conditions
expected in field. The inconvenience of the verification with testing is that tests are
expensive and usually require complex setups. Furthermore, the tests should be repeated
when a new conducting element is included in the blade with unpredictable effects in
the performance of the lightning protection. In view of this, numerical methods can be a
useful and inexpensive alternative to establish the preliminary design of the lightning
protection of wind turbines. The advantage of the numerical methods is the possibility
to study the lightning exposure both on a macroscopic level and on detailed models
containing the blade internals with multiple streamer initiations, which add great value
to the detailed design process.
This chapter investigates the lightning attachment to wind turbine blades using high
voltage tests and analytical methods based on the Finite Element Method. The chapter is
divided in four sections. Section 4 reviews the physical process of long electrical
discharges, and describes the main characteristics related to positive and negative
discharges. Section 4.2 explains the high voltage tests performed to small-scale samples
and to a full-scale section of blade. Section 4.3 presents three different analytical
methods consisting in FEM numerical simulations to reproduce the high voltage tests in
Section 4.2, and compare the results of simulations and tests. Finally, Section 4.4
discusses the use FEM simulations to assess the effectiveness of the air termination
system and determine the influence of the internal conductive materials.
4.1 Physical process of lightning attachment
This section summarizes the main physical principles related to the origination and
propagation of the streamers and leaders, which will finally determine the location of
the lightning attachment.
4.1.1 Long electrical discharges
The initiation and propagation of the lightning discharges presents great similarities
with the electrical discharges with a length over 1 m produced in a high voltage
laboratory. This similarity is a major advantage for the study of the lightning discharge
in the laboratory. The physical process of the long discharge is briefly explained below.
The interested reader may consult the publications of Gallimberti, Bacchiega et al. [54],
[55], [56] for a detailed description of the phenomenon.

Lightning attachment to wind turbine blades 57
The discharge process consists of a leader channel propagation with a feeding
discharge in its head. The feeding discharge is a continuous corona discharge for
positive polarity and a structure with pilot systems and space leader for negative
polarity.
The positive discharge in a rod-plane gap is initiated by the formation of a first
corona, which consists of several filaments called streamers originated in a common
point. The electric field of the corona is about 4.5-5 kV/mm. After the first corona, and
provided the potential at the electrode is sufficiently high, a leader starts from the root
of the corona streamers. The leader advances towards the grounded plane with a
diffused corona at the tip, which supplies the current necessary for the leader
development. Since the electrons generated at the tip of the corona leader move towards
the increasing field, the leader advances in a continuous way. When the leader corona
reaches the ground plane, the final jump of the leader to the plane occurs, finalizing the
breakdown process. Figure 4-1 shows a sketch of a laboratory positive discharge,
indicating the instants of the first corona formation t1, leader inception t2 and final jump
t3.
The negative discharge in a rod-plane gap is initiated by the formation of a first
corona consisting of filamentary streamers, similarly to the positive discharge. Since the
electrons from the corona move in the direction of decreasing field, the negative corona
cannot supply current to the leader. Therefore, the leader advances in non-continuous
steps consisting of bidirectional discharges. After the first corona, a “pilot system” is
incepted. The pilot system consists of two coronas of opposite polarity where the
positive corona develops towards the electrode while the negative corona propagates
towards the ground plane. After a number of pilot system inception and extinction, a
“space leader” starts from the previous pilot inception point. The space leader also
develops as a bi-directional discharge. Finally, a negative leader is initiated at the
electrode, advances and joins the positive head of the space leader. This procedure
consisting of pilot – space leader – negative leader is repeated several times until the
discharge reaches the grounded plane. Figure 4-2 shows a sketch of a step of a
laboratory negative discharge, indicating the instants of the first corona formation t1,
pilot formation t2, space leader formation t3, leader inception t4 and junction of the
leader and the space leader t5.

58 Lightning attachment to wind turbine blades
HV electrode
Ground plane
First corona
Leader corona
Leader
Leader tip advancement
t1 t2 t3
Figure 4-1 Sketch of the positive discharge in time/gap distance in a rod-plane gap configuration,
where t1 indicates the first corona formation, t2 the leader inception and t3 the final jump completing
the breakdown process. Adapted from [56].
HV electrode
Ground plane
First corona
Leader tip advancement
t1 t2 t5
Pilot
t3
Space leader
t4
Figure 4-2 Sketch of a step of the negative discharge in time/gap distance in a rod-plane gap
configuration, where t1 indicates the first corona formation, t2 the pilot inception, t3 the space leader
inception, t4 the negative leader inception and t5 the junction of the leader and the space leader,
completing one of the steps of the discharge process. Adapted from [56].
4.1.2 Attachment process on wind turbine blades
The process of the discharge initiation and development from a wind turbine blade
follows the same principles as the simple rod-plane configuration described in Section
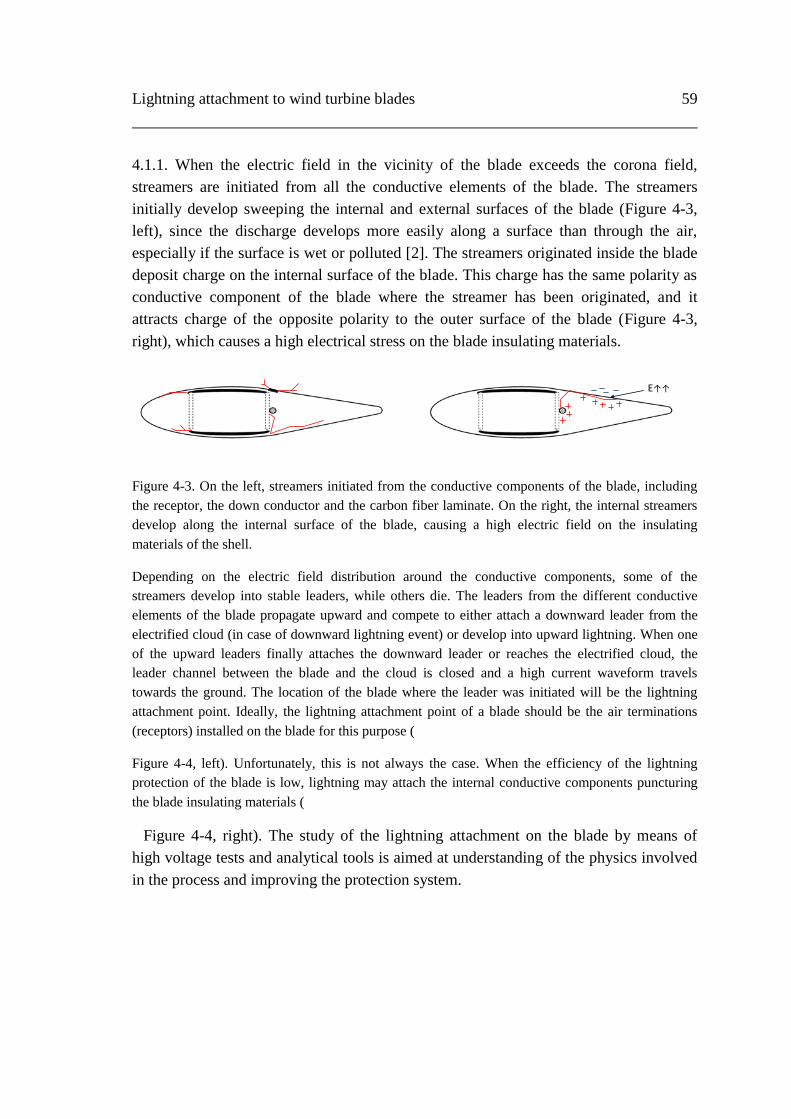
Lightning attachment to wind turbine blades 59
4.1.1. When the electric field in the vicinity of the blade exceeds the corona field,
streamers are initiated from all the conductive elements of the blade. The streamers
initially develop sweeping the internal and external surfaces of the blade (Figure 4-3,
left), since the discharge develops more easily along a surface than through the air,
especially if the surface is wet or polluted [2]. The streamers originated inside the blade
deposit charge on the internal surface of the blade. This charge has the same polarity as
conductive component of the blade where the streamer has been originated, and it
attracts charge of the opposite polarity to the outer surface of the blade (Figure 4-3,
right), which causes a high electrical stress on the blade insulating materials.
E↑↑
Figure 4-3. On the left, streamers initiated from the conductive components of the blade, including
the receptor, the down conductor and the carbon fiber laminate. On the right, the internal streamers
develop along the internal surface of the blade, causing a high electric field on the insulating
materials of the shell.
Depending on the electric field distribution around the conductive components, some of the
streamers develop into stable leaders, while others die. The leaders from the different conductive
elements of the blade propagate upward and compete to either attach a downward leader from the
electrified cloud (in case of downward lightning event) or develop into upward lightning. When one
of the upward leaders finally attaches the downward leader or reaches the electrified cloud, the
leader channel between the blade and the cloud is closed and a high current waveform travels
towards the ground. The location of the blade where the leader was initiated will be the lightning
attachment point. Ideally, the lightning attachment point of a blade should be the air terminations
(receptors) installed on the blade for this purpose (
Figure 4-4, left). Unfortunately, this is not always the case. When the efficiency of the lightning
protection of the blade is low, lightning may attach the internal conductive components puncturing
the blade insulating materials (
Figure 4-4, right). The study of the lightning attachment on the blade by means of
high voltage tests and analytical tools is aimed at understanding of the physics involved
in the process and improving the protection system.
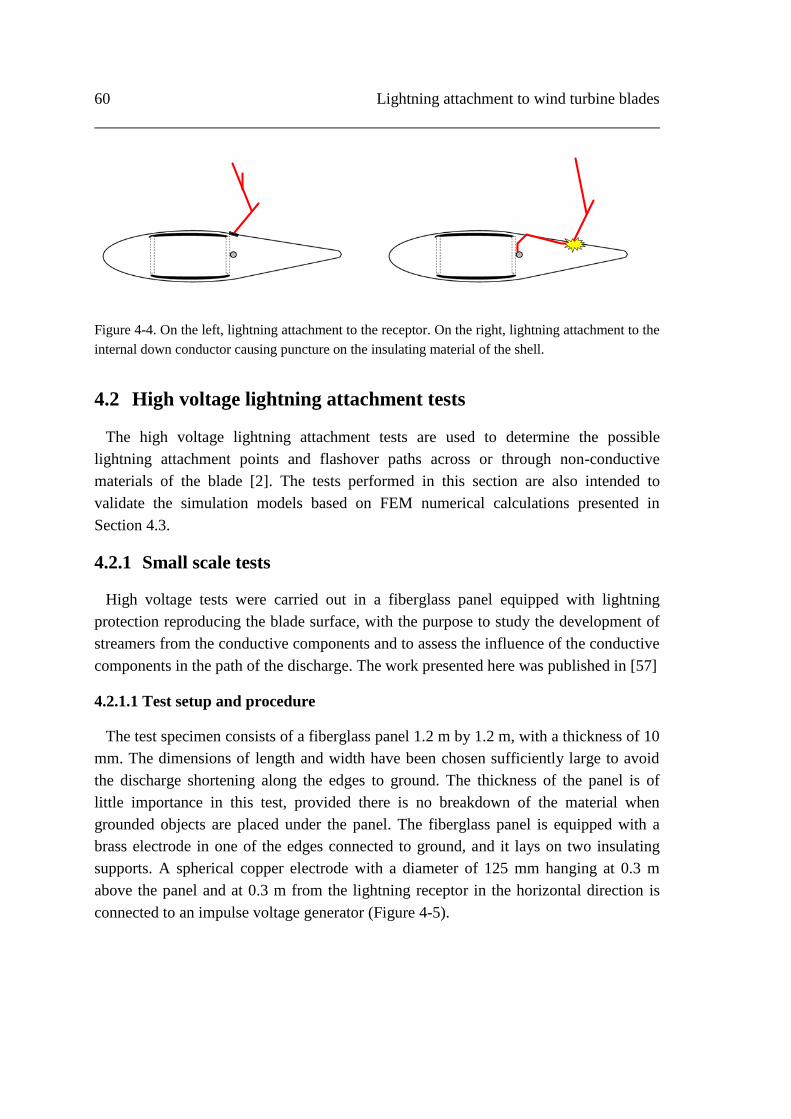
60 Lightning attachment to wind turbine blades
Figure 4-4. On the left, lightning attachment to the receptor. On the right, lightning attachment to the
internal down conductor causing puncture on the insulating material of the shell.
4.2 High voltage lightning attachment tests
The high voltage lightning attachment tests are used to determine the possible
lightning attachment points and flashover paths across or through non-conductive
materials of the blade [2]. The tests performed in this section are also intended to
validate the simulation models based on FEM numerical calculations presented in
Section 4.3.
4.2.1 Small scale tests
High voltage tests were carried out in a fiberglass panel equipped with lightning
protection reproducing the blade surface, with the purpose to study the development of
streamers from the conductive components and to assess the influence of the conductive
components in the path of the discharge. The work presented here was published in [57]
4.2.1.1 Test setup and procedure
The test specimen consists of a fiberglass panel 1.2 m by 1.2 m, with a thickness of 10
mm. The dimensions of length and width have been chosen sufficiently large to avoid
the discharge shortening along the edges to ground. The thickness of the panel is of
little importance in this test, provided there is no breakdown of the material when
grounded objects are placed under the panel. The fiberglass panel is equipped with a
brass electrode in one of the edges connected to ground, and it lays on two insulating
supports. A spherical copper electrode with a diameter of 125 mm hanging at 0.3 m
above the panel and at 0.3 m from the lightning receptor in the horizontal direction is
connected to an impulse voltage generator (Figure 4-5).

Lightning attachment to wind turbine blades 61
Figure 4-5 Test setup: Fiberglass panel equipped with receptor, representing the blade surface. The
spherical electrode is connected to an impulse voltage generator.
The conductive elements used to represent the internal conductive components of the
blade are a cylindrical steel electrode with a diameter of 10 mm and an aluminum
adhesive band with a width of 72.5 mm. The tests are performed on the three test setups
illustrated in Figure 4-6. Test setup 1 consists of the panel equipped with the receptor,
with no internal conductive components. Test setup 2 includes a spherical electrode
connected to ground under the panel, in contact with the inner surface of the panel and
vertically aligned with the high voltage electrode. In test setup 3, the aluminum band is
stuck on the lower surface of the panel, from the electrode to the receptor.
Setup 3
HV Electrode
Receptor
Grounded
electrode
Grounded
aluminum tape
Setup 1 Setup 2
Figure 4-6. Setup configurations with HV electrode and receptor. Setup 1: No internal conductive
components; Setup 2: Grounded electrode under the panel; Setup 3: Grounded aluminum tape under
the panel.
HV Electrode
300 mm
300 mm Receptor
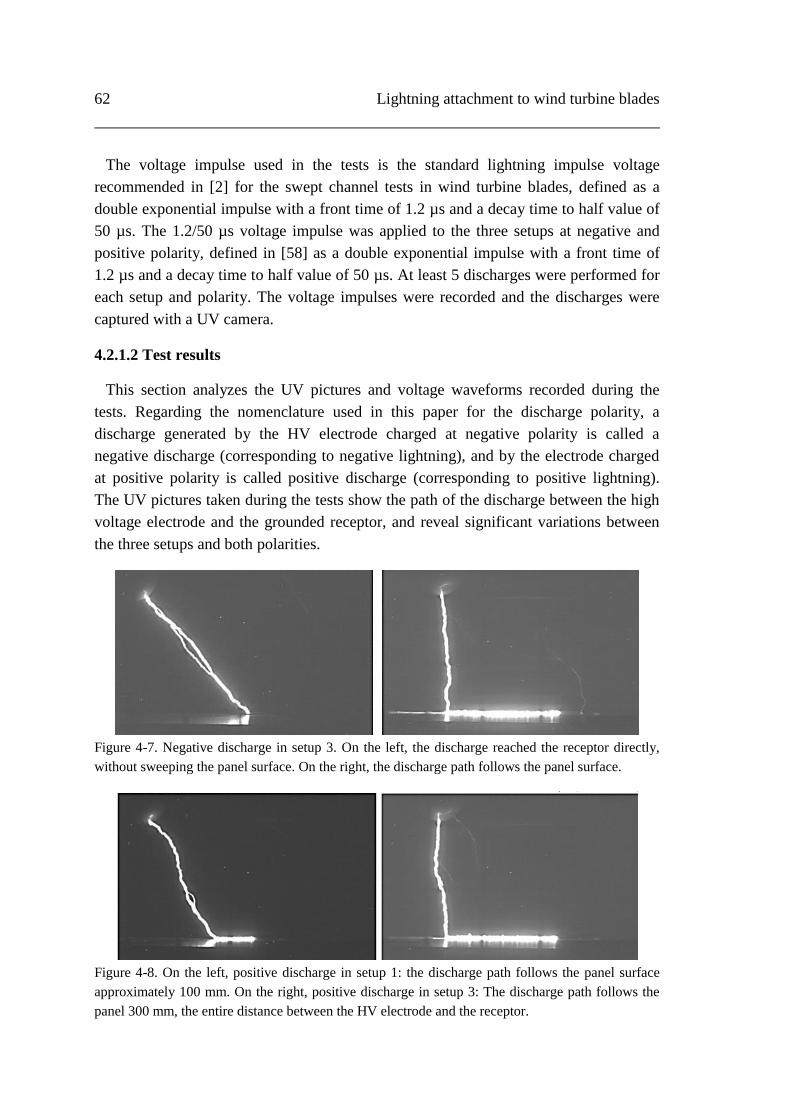
62 Lightning attachment to wind turbine blades
The voltage impulse used in the tests is the standard lightning impulse voltage
recommended in [2] for the swept channel tests in wind turbine blades, defined as a
double exponential impulse with a front time of 1.2 µs and a decay time to half value of
50 µs. The 1.2/50 µs voltage impulse was applied to the three setups at negative and
positive polarity, defined in [58] as a double exponential impulse with a front time of
1.2 µs and a decay time to half value of 50 µs. At least 5 discharges were performed for
each setup and polarity. The voltage impulses were recorded and the discharges were
captured with a UV camera.
4.2.1.2 Test results
This section analyzes the UV pictures and voltage waveforms recorded during the
tests. Regarding the nomenclature used in this paper for the discharge polarity, a
discharge generated by the HV electrode charged at negative polarity is called a
negative discharge (corresponding to negative lightning), and by the electrode charged
at positive polarity is called positive discharge (corresponding to positive lightning).
The UV pictures taken during the tests show the path of the discharge between the high
voltage electrode and the grounded receptor, and reveal significant variations between
the three setups and both polarities.
Figure 4-7. Negative discharge in setup 3. On the left, the discharge reached the receptor directly,
without sweeping the panel surface. On the right, the discharge path follows the panel surface.
Figure 4-8. On the left, positive discharge in setup 1: the discharge path follows the panel surface
approximately 100 mm. On the right, positive discharge in setup 3: The discharge path follows the
panel 300 mm, the entire distance between the HV electrode and the receptor.
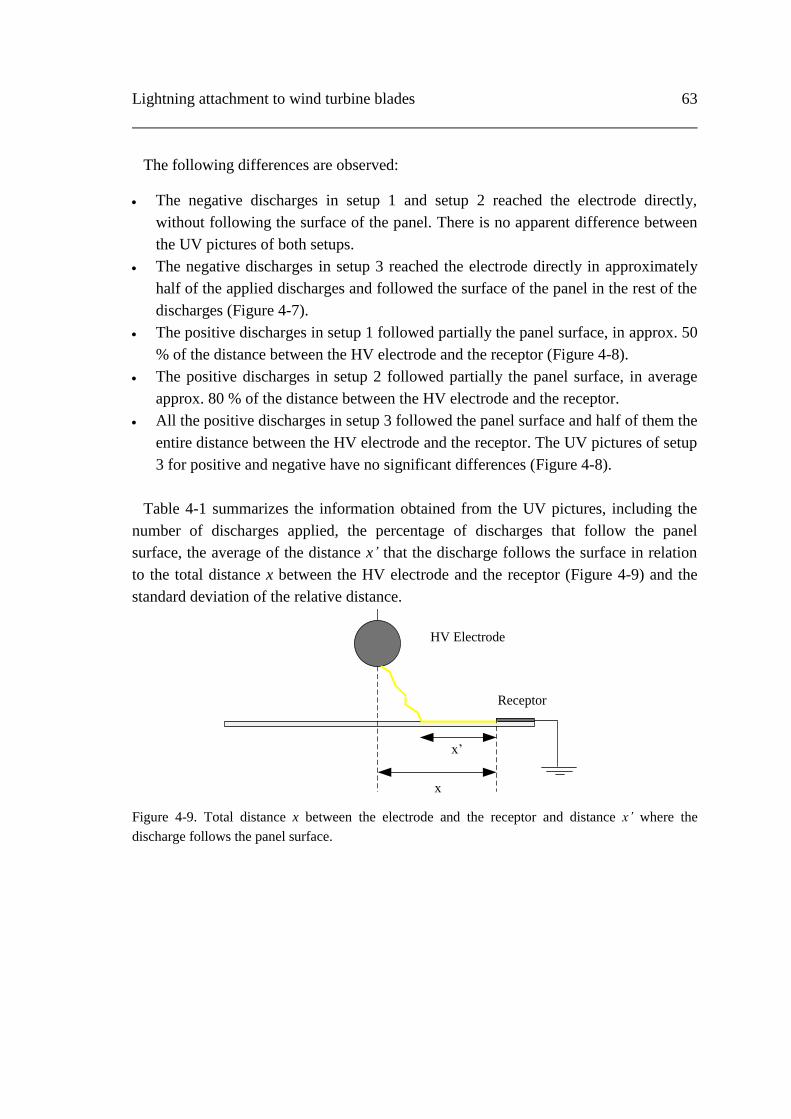
Lightning attachment to wind turbine blades 63
The following differences are observed:
The negative discharges in setup 1 and setup 2 reached the electrode directly,
without following the surface of the panel. There is no apparent difference between
the UV pictures of both setups.
The negative discharges in setup 3 reached the electrode directly in approximately
half of the applied discharges and followed the surface of the panel in the rest of the
discharges (Figure 4-7).
The positive discharges in setup 1 followed partially the panel surface, in approx. 50
% of the distance between the HV electrode and the receptor (Figure 4-8).
The positive discharges in setup 2 followed partially the panel surface, in average
approx. 80 % of the distance between the HV electrode and the receptor.
All the positive discharges in setup 3 followed the panel surface and half of them the
entire distance between the HV electrode and the receptor. The UV pictures of setup
3 for positive and negative have no significant differences (Figure 4-8).
Table 4-1 summarizes the information obtained from the UV pictures, including the
number of discharges applied, the percentage of discharges that follow the panel
surface, the average of the distance x’ that the discharge follows the surface in relation
to the total distance x between the HV electrode and the receptor (Figure 4-9) and the
standard deviation of the relative distance.
HV Electrode
Receptor
x
x’
Figure 4-9. Total distance x between the electrode and the receptor and distance x’ where the
discharge follows the panel surface.

64 Lightning attachment to wind turbine blades
Table 4-1 Summary of UV pictures analysis: No. of discharges applied, % of discharges that follow
the panel surface, the average of the distance x’ and standard deviation of x’.
Polarity Setup No.
Discharges
Discharge
sweeping surface
Av. Relative
Distance x’/x [%]
St. Dev.
[%]
Neg. 1 15 0 - -
Neg. 2 4 0 - -
Neg. 3 17 53 % 74.00 8.97
Pos. 1 10 100 % 52.54 9.72
Pos. 2 5 100 % 80.82 8.55
Pos. 3 5 100 % 81.23 19.68
In order to investigate further the variations in the discharge path in the different
configurations, the shape of the voltage waveform is examined for setup 1 and 3 in both
polarities. The comparison between the voltage waveforms reveals that in all the cases
the voltage reaches the peak of 360 kV, but the time from voltage application to
flashover varies with the polarity and the setup, indicating different formation times
(Figure 4-10).
Figure 4-10. On the left, voltage waveform of positive discharge in setup 3, with voltage peak 360
kV and average formation time of 2.15 µs. On the right, voltage waveform of positive discharge in
setup 3, with voltage peak 360 kV and average formation time of 4.29 µs.
The following information extracted from the waveforms:
The flashover occurs earlier for positive discharges than in the negative.
For positive discharges, the flashover occurs earlier in setup 3 than in setup, while
for negative discharges, the flashover occurs later in setup 3 than in setup 1.
In setup 3 for negative impulses, half of the discharges reach the receptor directly
and half follow the surface. However, there is no significant difference in the
voltage waveforms.
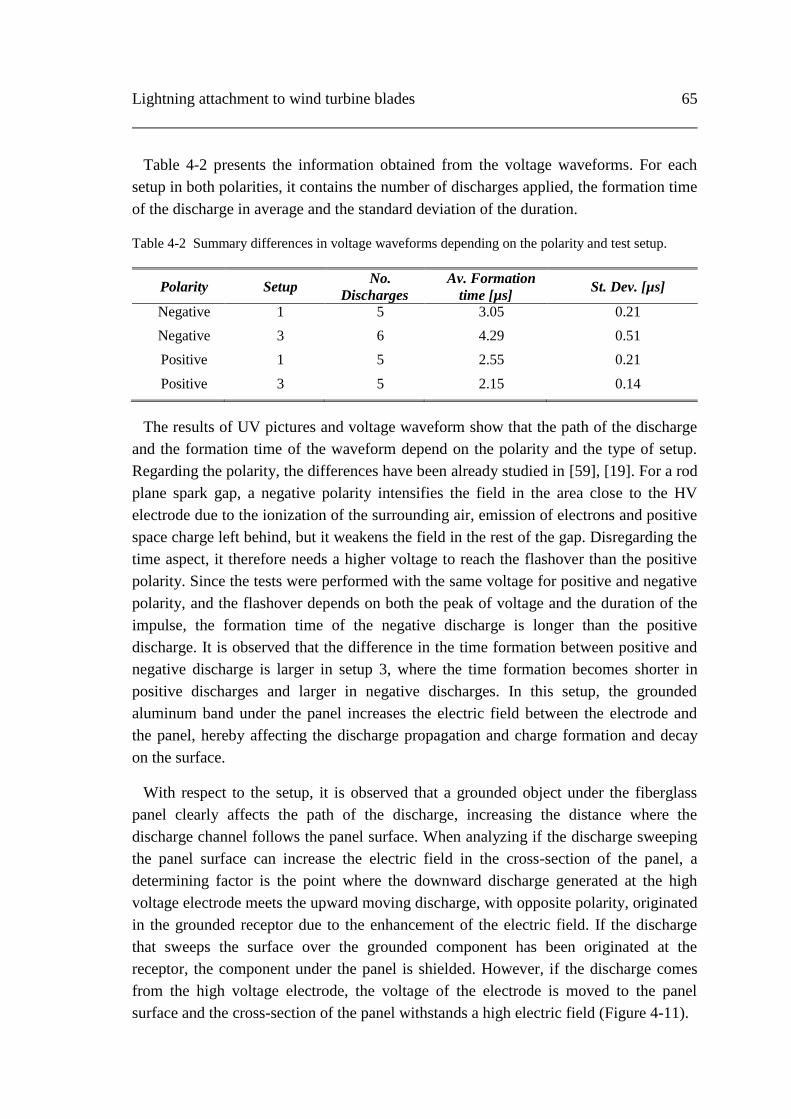
Lightning attachment to wind turbine blades 65
Table 4-2 presents the information obtained from the voltage waveforms. For each
setup in both polarities, it contains the number of discharges applied, the formation time
of the discharge in average and the standard deviation of the duration.
Table 4-2 Summary differences in voltage waveforms depending on the polarity and test setup.
Polarity Setup No.
Discharges
Av. Formation
time [µs] St. Dev. [µs]
Negative 1 5 3.05 0.21
Negative 3 6 4.29 0.51
Positive 1 5 2.55 0.21
Positive 3 5 2.15 0.14
The results of UV pictures and voltage waveform show that the path of the discharge
and the formation time of the waveform depend on the polarity and the type of setup.
Regarding the polarity, the differences have been already studied in [59], [19]. For a rod
plane spark gap, a negative polarity intensifies the field in the area close to the HV
electrode due to the ionization of the surrounding air, emission of electrons and positive
space charge left behind, but it weakens the field in the rest of the gap. Disregarding the
time aspect, it therefore needs a higher voltage to reach the flashover than the positive
polarity. Since the tests were performed with the same voltage for positive and negative
polarity, and the flashover depends on both the peak of voltage and the duration of the
impulse, the formation time of the negative discharge is longer than the positive
discharge. It is observed that the difference in the time formation between positive and
negative discharge is larger in setup 3, where the time formation becomes shorter in
positive discharges and larger in negative discharges. In this setup, the grounded
aluminum band under the panel increases the electric field between the electrode and
the panel, hereby affecting the discharge propagation and charge formation and decay
on the surface.
With respect to the setup, it is observed that a grounded object under the fiberglass
panel clearly affects the path of the discharge, increasing the distance where the
discharge channel follows the panel surface. When analyzing if the discharge sweeping
the panel surface can increase the electric field in the cross-section of the panel, a
determining factor is the point where the downward discharge generated at the high
voltage electrode meets the upward moving discharge, with opposite polarity, originated
in the grounded receptor due to the enhancement of the electric field. If the discharge
that sweeps the surface over the grounded component has been originated at the
receptor, the component under the panel is shielded. However, if the discharge comes
from the high voltage electrode, the voltage of the electrode is moved to the panel
surface and the cross-section of the panel withstands a high electric field (Figure 4-11).

66 Lightning attachment to wind turbine blades
HV Electrode
Receptor
HV Electrode
ReceptorJunctionJunction
E↑↑
Figure 4-11 Left: discharge junction over the panel, the object under the panel is shielded by the discharge from the
receptor. Right: discharge junction on the panel, the voltage of the HV electrode is moved to the surface of the panel.
The point where the discharges from the electrode and the receptor meet can be
determined by the direction of the branches in the discharge. The UV pictures show that
for discharges direct to the receptor the point of junction is approximately in the middle
of the way, while for discharges following the surface, the joint is on the panel (Figure
4-12 and Figure 4-13).
Figure 4-12. Junction point (marked in a circle) in three negative discharges in setups 2 and 3.
Figure 4-13. On the left, positive discharge in setup 3. On the right, zoom of the discharge. The
downward branches of the discharges (marked with a circle) indicate that the junction is on or very
close to the panel.
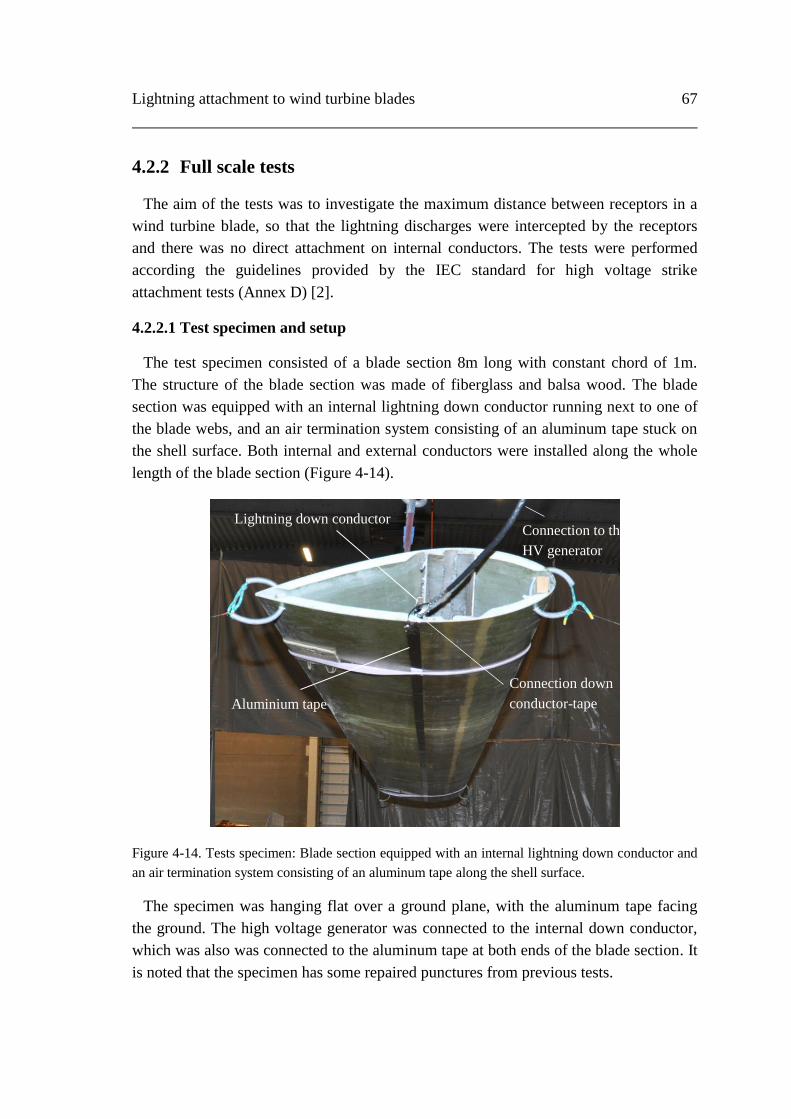
Lightning attachment to wind turbine blades 67
4.2.2 Full scale tests
The aim of the tests was to investigate the maximum distance between receptors in a
wind turbine blade, so that the lightning discharges were intercepted by the receptors
and there was no direct attachment on internal conductors. The tests were performed
according the guidelines provided by the IEC standard for high voltage strike
attachment tests (Annex D) [2].
4.2.2.1 Test specimen and setup
The test specimen consisted of a blade section 8m long with constant chord of 1m.
The structure of the blade section was made of fiberglass and balsa wood. The blade
section was equipped with an internal lightning down conductor running next to one of
the blade webs, and an air termination system consisting of an aluminum tape stuck on
the shell surface. Both internal and external conductors were installed along the whole
length of the blade section (Figure 4-14).
Figure 4-14. Tests specimen: Blade section equipped with an internal lightning down conductor and
an air termination system consisting of an aluminum tape along the shell surface.
The specimen was hanging flat over a ground plane, with the aluminum tape facing
the ground. The high voltage generator was connected to the internal down conductor,
which was also was connected to the aluminum tape at both ends of the blade section. It
is noted that the specimen has some repaired punctures from previous tests.
Lightning down conductor
Aluminium tape
Connection down
conductor-tape
Connection to the
HV generator

68 Lightning attachment to wind turbine blades
The ground plane protruded smoothly in the center, to enhance the electric field and
ensure that most of the discharges occurred in that area. The minimum distance between
the specimen and the ground plane was 1.5 m. Figure 4-15 shows the tests setup for
positive and negative polarity. Since the negative polarity requires higher voltage peak
than the positive, it was necessary to modify the shape of the ground plane by
increasing the protrusion in order to reach flashover with a gap distance of 1.5 m.
Figure 4-15. Blade section test setup, where the specimen is hanging at 1.5m from a ground plane.
Above, setup for positive polarity. Below, setup for negative polarity.
During the tests, the aluminum tape was progressively removed from the center of the
specimen, right over the ground plane protrusion (Figure 4-16). The length d without
aluminum tape was increased in each test in order to determine for which distance d the
discharge would attach the internal down conductor instead of the aluminum tape,
1.5 m
1.5 m
Ground
plane
Ground
plane

Lightning attachment to wind turbine blades 69
puncturing the shell. The tests were conducted for positive and negative polarity, with a
voltage waveform of 250/2500 µs. Three discharges were applied for each distance d in
each polarity. The criteria to finish the tests were either puncturing the shell or reaching
a maximum distance d of 3 m.
Figure 4-16. Aluminum tape stuck on the shell surface. Part of the tape is removed in a length d,
over the protrusion on the grounding plane.
4.2.2.2 Tests results
The tests results are shown in Table 4-3 and
Table 4-4. In the positive tests (blade charged at positive polarity), the discharge
attachment was always at the aluminum tape. The tests ended when d reached 3 m
without any puncture. In the negative tests (blade charged at negative polarity), the
discharge attachment was on the aluminum tape with a tape gap d up to 1.8 m, but at d =
2.1 m the discharge attached the internal down conductor puncturing the shell. The
pictures of the tests (Figure 4-17, Figure 4-18 and Figure 4-19) show significant
differences between the discharges with positive and negative polarity.
d
Al. tape
Ground
plane
Al. tape

70 Lightning attachment to wind turbine blades
Table 4-3. Summary of tests results at positive polarity, including the voltage peak, time to
flashover, and the distance from the ground to the junction point between the upward and downward
leaders.
d [m] Peak value
[kV]
Time to
flashover [µs]
Distance ground
to junction [m] Attachment
0 706.5 160.5 ~ 0 Al tape
0.5 700.7 159.7 ~ 0 Al tape
1 689.3 151 ~ 0 Al tape
1.5 693.0 154 ~ 0 Al tape
2 723.7 180.3 ~ 0 Al tape
2.5 708.7 163.7 ~ 0 Al tape
3 793.7 171.8 ~ 0 Al tape
Table 4-4. Summary of tests results at negative polarity, including the voltage peak, time to
flashover, and the distance from the ground to the junction point between the upward and downward
leaders.
d [m] Peak value
[kV]
Time to
flashover [µs]
Distance ground
to junction [m] Attachment
0 1381 540.3 ~ 0.78 Al tape
0.3 1287.7 399.8 ~ 0.85 Al tape
0.6 1372.3 577.0 ~ 0.8 Al tape
0.9 1203.3 372.0 ~ 0.83 Al tape
1.2 1217.7 405.0 ~ 0.93 Al tape
1.5 1379.7 605.3 ~ 0.73 Al tape
1.8 1453.4 721 ~ 0.70 Al tape
2.1 1370.0 482.5 ~ 0.85 Internal cond.
The discharge at positive polarity had an average breakdown voltage and time to
breakdown of 703.6 kV and 163.6 µs, respectively. The junction point between the
leader initiated at the specimen and the leader originated at the ground plane was very
close to the ground plane. In the pictures, there are not visible streamers from points of
the blade other than the flashover path.
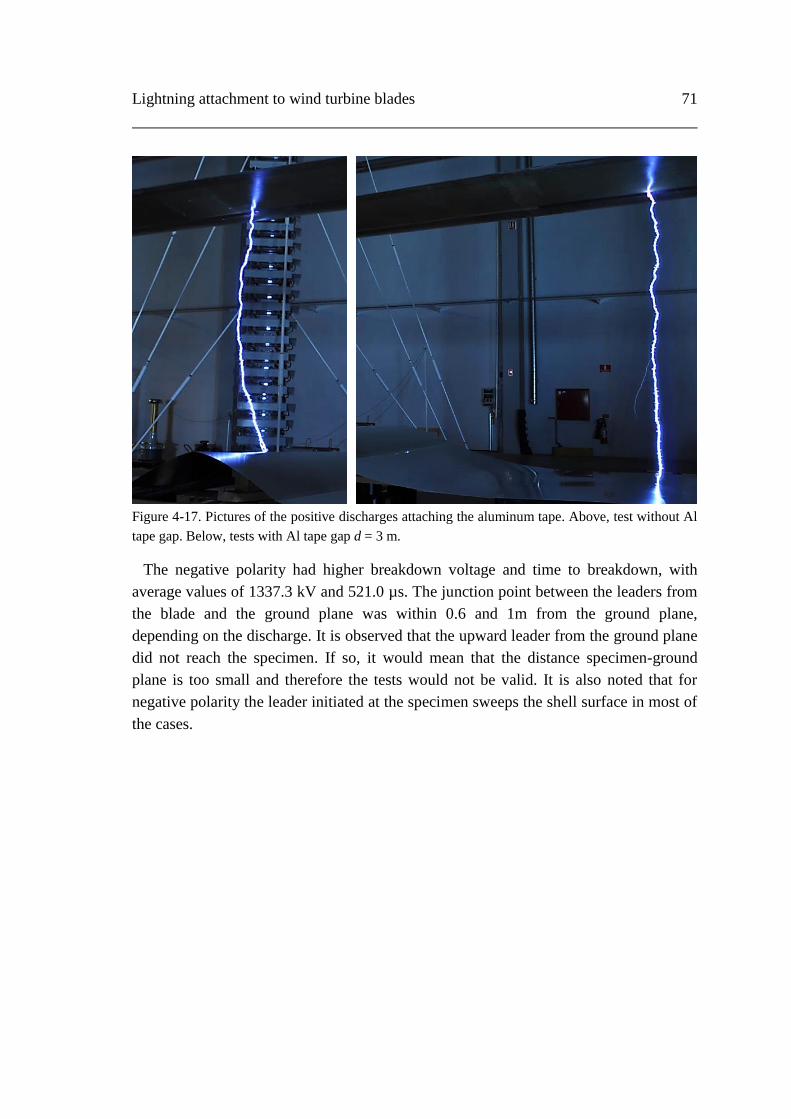
Lightning attachment to wind turbine blades 71
Figure 4-17. Pictures of the positive discharges attaching the aluminum tape. Above, test without Al
tape gap. Below, tests with Al tape gap d = 3 m.
The negative polarity had higher breakdown voltage and time to breakdown, with
average values of 1337.3 kV and 521.0 µs. The junction point between the leaders from
the blade and the ground plane was within 0.6 and 1m from the ground plane,
depending on the discharge. It is observed that the upward leader from the ground plane
did not reach the specimen. If so, it would mean that the distance specimen-ground
plane is too small and therefore the tests would not be valid. It is also noted that for
negative polarity the leader initiated at the specimen sweeps the shell surface in most of
the cases.

72 Lightning attachment to wind turbine blades
Figure 4-18. Pictures of the negative discharges attaching the aluminum tape. Above, test without Al
tape gap. Below, tests with Al tape gap d = 1.8 m.
Figure 4-19. Pictures of a negative discharge with Al tape gap d = 2.1 m. The discharge attached the
internal down conductor puncturing the shell.
In order to investigate further the differences between the tests performed at positive
and negative polarity, a UV camera was used to record the discharges. The UV pictures
of the tests revealed that when the high voltage impulse is applied, streamers are
initiated in different points of the blade suface. It is noted that the streamers for positive
and negative polarities show significant differences. The positive streamers are mainly
Junction point
Junction point
Junction point
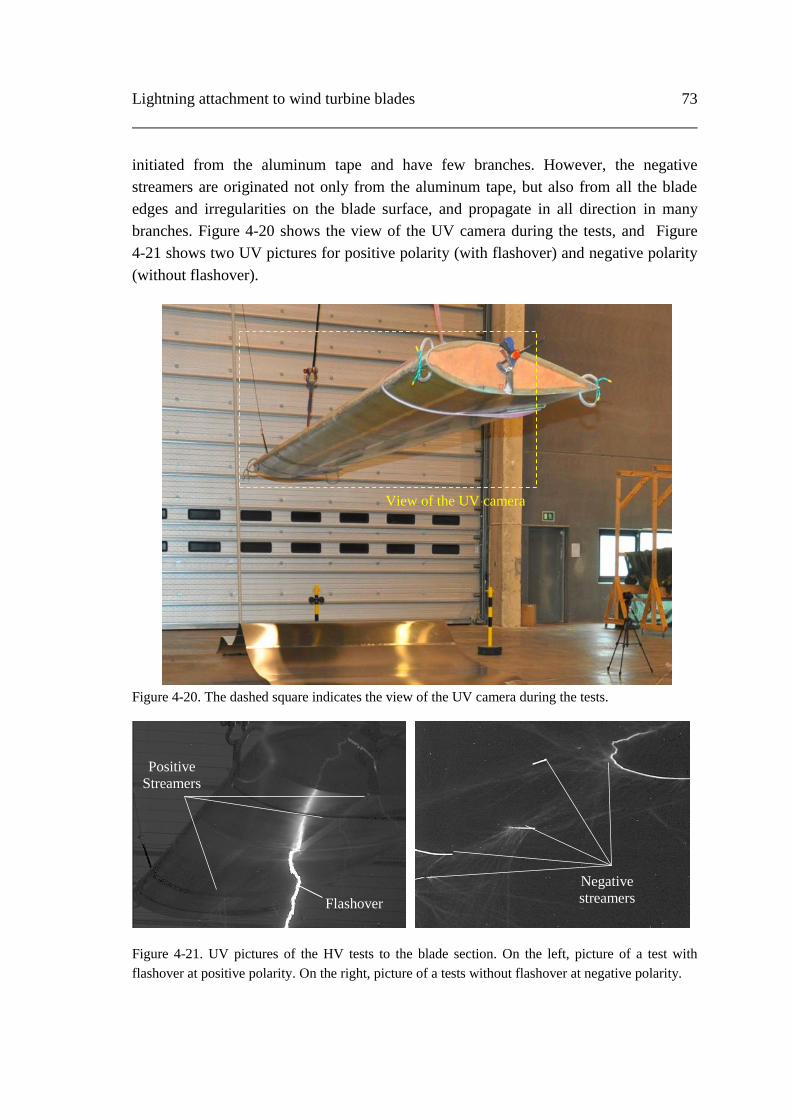
Lightning attachment to wind turbine blades 73
initiated from the aluminum tape and have few branches. However, the negative
streamers are originated not only from the aluminum tape, but also from all the blade
edges and irregularities on the blade surface, and propagate in all direction in many
branches. Figure 4-20 shows the view of the UV camera during the tests, and Figure
4-21 shows two UV pictures for positive polarity (with flashover) and negative polarity
(without flashover).
Figure 4-20. The dashed square indicates the view of the UV camera during the tests.
Figure 4-21. UV pictures of the HV tests to the blade section. On the left, picture of a test with
flashover at positive polarity. On the right, picture of a tests without flashover at negative polarity.
View of the UV camera
Flashover
Positive
Streamers
Negative
streamers

74 Lightning attachment to wind turbine blades
4.2.2.3 Discussion
According to the tests results, the minimum distance between the air terminations of a
blade to avoid direct strike to the internal conductors is about 2 m. The tests have been
performed with the specimen in horizontal position, where the whole length of the
shells is equally exposed to the electric field. This is too severe, since a blade will never
be in that condition in field. Therefore, the minimum distance of 2 m would apply only
to the tip of the blade, which is the zone with higher exposure to the electric field.
The tests also revealed the significant differences between the discharges with positive
polarity and the discharges with negative polarity. As observed in the full-scale tests,
the negative discharge (blade charged at negative polarity) requires a higher breakdown
voltage and has larger formation time. The fact that the blade is exposed to a higher
voltage during a larger time may over stress the structural materials and eventually
cause a puncture. This agrees with the UV pictures, which show that the streamer
activity on the blade surface is considerably higher for negative polarity than for
positive polarity, and with the fact that the puncture of the blade occurred for negative
polarity.
Furthermore, the location of the leader junction point indicates that in negative
polarity the leader from the ground plane gets very close to the specimen increasing the
risk of puncture. However, in positive discharges the leader from the air termination
develops faster and therefore it is likely that the final attachment occurs at the air
termination.
Finally, it is noted that the tests with negative discharges (blade charged at negative
polarity), correspond to the case of positive lightning. The positive lightning is
significantly less common than the negative lightning, only accounting for about 10% of
the total lightning discharges, but on the other hand they have on average higher peak
current, charge and specific energy [13]. Considering that the positive lightning
involves higher electrical stress on the blade surface and the higher current parameters,
it should be regarded as the most dangerous type of lightning for the blade integrity.
4.3 Simulation methods for lightning attachment
The models presented this section are solved by numerical calculations based on the
Finite Element Method (FEM), using the Electrostatics module of the software Comsol
Multiphysics®. The electrostatic equations solved in the simulations are introduced
below. The interested reader may consult the Comsol Multiphysics user guide [60] for
further information about the algorithms used in the computation.
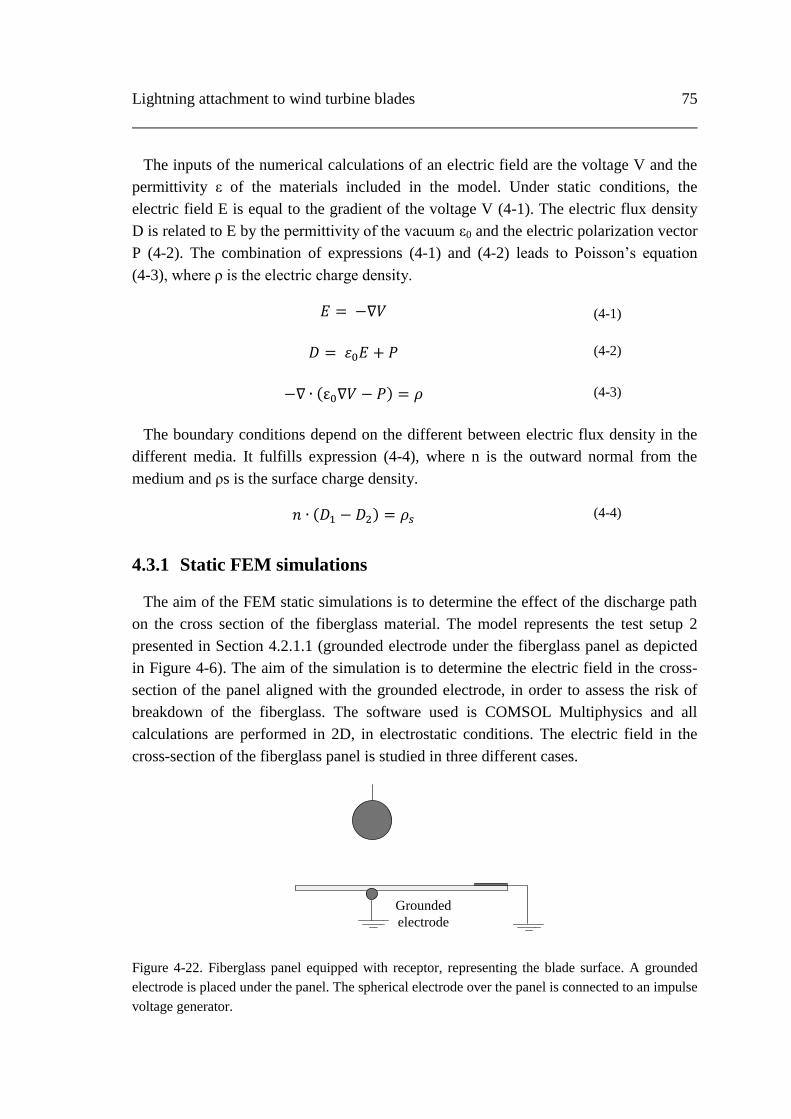
Lightning attachment to wind turbine blades 75
The inputs of the numerical calculations of an electric field are the voltage V and the
permittivity ε of the materials included in the model. Under static conditions, the
electric field E is equal to the gradient of the voltage V (4-1). The electric flux density
D is related to E by the permittivity of the vacuum ε0 and the electric polarization vector
P (4-2). The combination of expressions (4-1) and (4-2) leads to Poisson’s equation
(4-3), where ρ is the electric charge density.
𝐸 = −∇𝑉 (4-1)
𝐷 = 𝜀0𝐸 + 𝑃 (4-2)
−∇ ∙ (ε0∇𝑉 − 𝑃) = 𝜌 (4-3)
The boundary conditions depend on the different between electric flux density in the
different media. It fulfills expression (4-4), where n is the outward normal from the
medium and ρs is the surface charge density.
𝑛 ∙ (𝐷1 − 𝐷2) = 𝜌𝑠 (4-4)
4.3.1 Static FEM simulations
The aim of the FEM static simulations is to determine the effect of the discharge path
on the cross section of the fiberglass material. The model represents the test setup 2
presented in Section 4.2.1.1 (grounded electrode under the fiberglass panel as depicted
in Figure 4-6). The aim of the simulation is to determine the electric field in the cross-
section of the panel aligned with the grounded electrode, in order to assess the risk of
breakdown of the fiberglass. The software used is COMSOL Multiphysics and all
calculations are performed in 2D, in electrostatic conditions. The electric field in the
cross-section of the fiberglass panel is studied in three different cases.
Grounded
electrode
Figure 4-22. Fiberglass panel equipped with receptor, representing the blade surface. A grounded
electrode is placed under the panel. The spherical electrode over the panel is connected to an impulse
voltage generator.
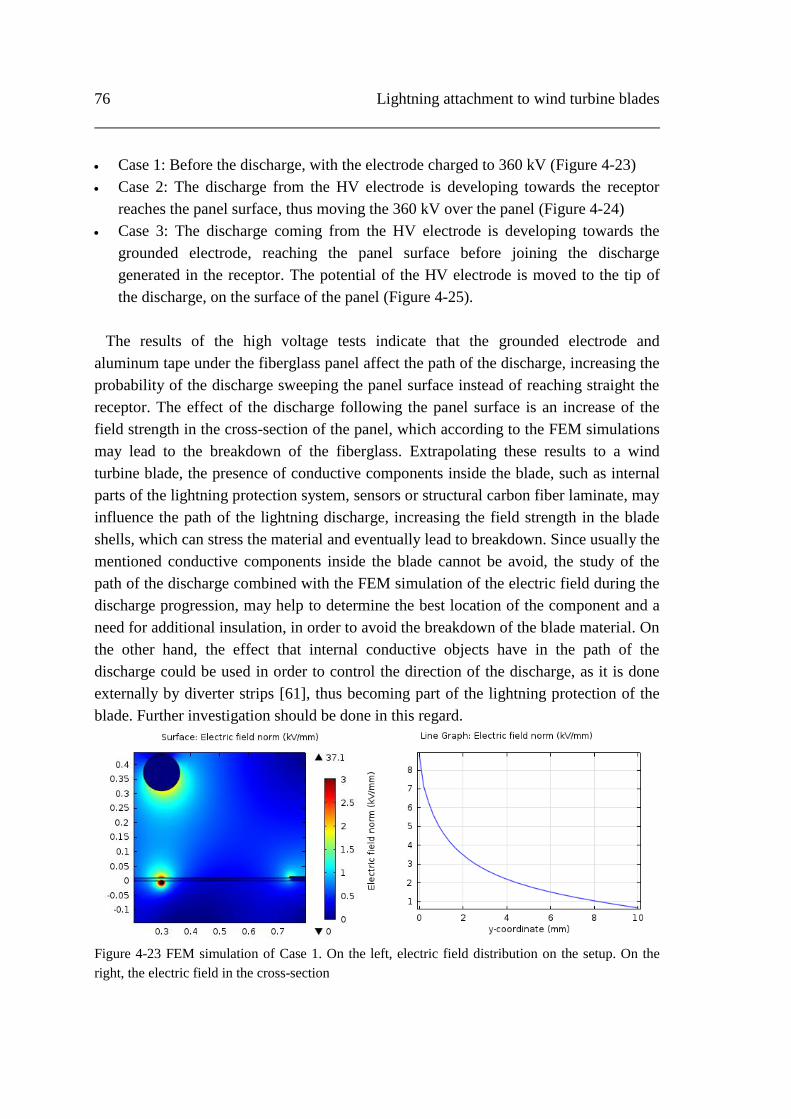
76 Lightning attachment to wind turbine blades
Case 1: Before the discharge, with the electrode charged to 360 kV (Figure 4-23)
Case 2: The discharge from the HV electrode is developing towards the receptor
reaches the panel surface, thus moving the 360 kV over the panel (Figure 4-24)
Case 3: The discharge coming from the HV electrode is developing towards the
grounded electrode, reaching the panel surface before joining the discharge
generated in the receptor. The potential of the HV electrode is moved to the tip of
the discharge, on the surface of the panel (Figure 4-25).
The results of the high voltage tests indicate that the grounded electrode and
aluminum tape under the fiberglass panel affect the path of the discharge, increasing the
probability of the discharge sweeping the panel surface instead of reaching straight the
receptor. The effect of the discharge following the panel surface is an increase of the
field strength in the cross-section of the panel, which according to the FEM simulations
may lead to the breakdown of the fiberglass. Extrapolating these results to a wind
turbine blade, the presence of conductive components inside the blade, such as internal
parts of the lightning protection system, sensors or structural carbon fiber laminate, may
influence the path of the lightning discharge, increasing the field strength in the blade
shells, which can stress the material and eventually lead to breakdown. Since usually the
mentioned conductive components inside the blade cannot be avoid, the study of the
path of the discharge combined with the FEM simulation of the electric field during the
discharge progression, may help to determine the best location of the component and a
need for additional insulation, in order to avoid the breakdown of the blade material. On
the other hand, the effect that internal conductive objects have in the path of the
discharge could be used in order to control the direction of the discharge, as it is done
externally by diverter strips [61], thus becoming part of the lightning protection of the
blade. Further investigation should be done in this regard.
Figure 4-23 FEM simulation of Case 1. On the left, electric field distribution on the setup. On the
right, the electric field in the cross-section

Lightning attachment to wind turbine blades 77
Figure 4-24 FEM simulation of Case 2. On the left, electric field distribution on the setup. On the
right, the electric field in the cross-section
Figure 4-25 FEM simulation of Case 3. On the left, electric field distribution on the setup. On the
right, the electric field in the cross-section
4.3.2 Quasi-dynamic FEM simulations
This section presents a method to investigate the origin and propagation of streamers
from different conductive elements of the blade when exposed to a high electric field.
The calculations are performed using FEM quasi-dynamic simulations, and the results
have been correlated with high voltage tests in the laboratory. The algorithms developed
are intended to be a new and improved tool for the design of the blade lightning
protection system, in particular to assess the effectiveness of the air termination system
and the effects of internal conductive materials. The simulation models can involve a
high level of detail and therefore be used to investigate the electrical conditions inside a
blade exposed to high electric field, as well as determine the detailed positioning of air
terminations in blades equipped with conductive elements such as carbon fiber or
electrical monitoring systems (load, temperature, etc.). This simulation method was
developed in collaboration with GLPS [62]. The work presented in this section is
published in [63].
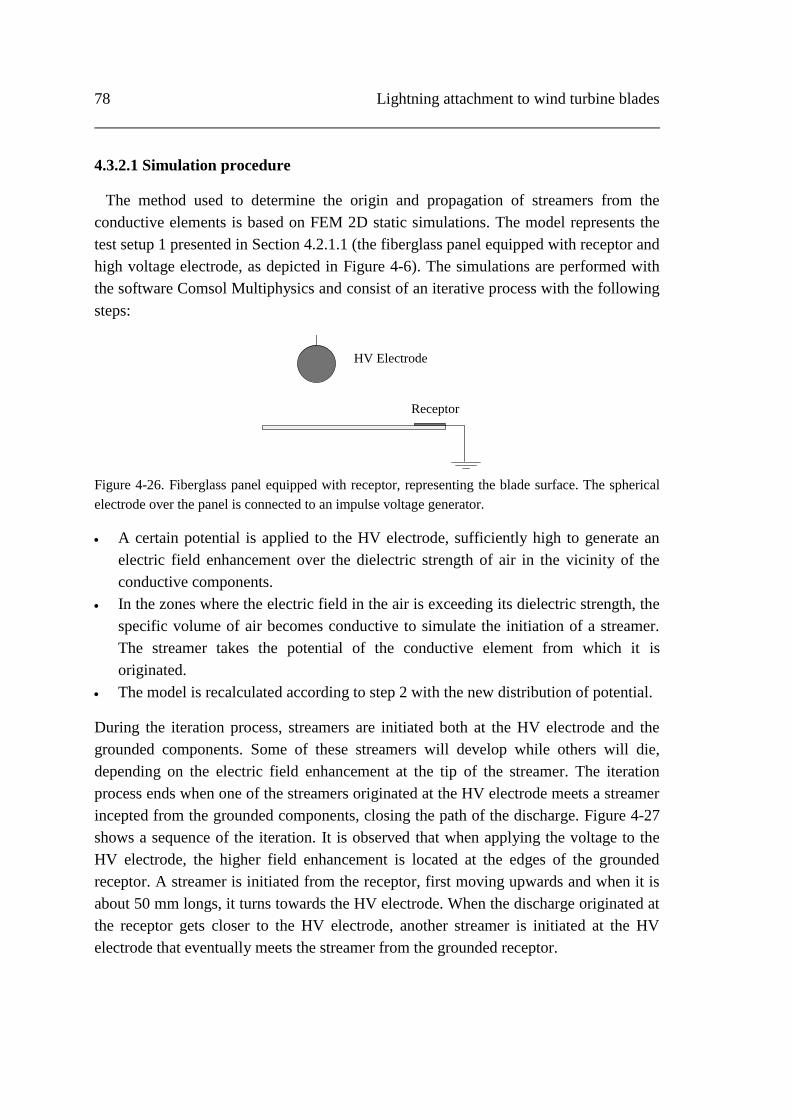
78 Lightning attachment to wind turbine blades
4.3.2.1 Simulation procedure
The method used to determine the origin and propagation of streamers from the
conductive elements is based on FEM 2D static simulations. The model represents the
test setup 1 presented in Section 4.2.1.1 (the fiberglass panel equipped with receptor and
high voltage electrode, as depicted in Figure 4-6). The simulations are performed with
the software Comsol Multiphysics and consist of an iterative process with the following
steps:
HV Electrode
Receptor
Figure 4-26. Fiberglass panel equipped with receptor, representing the blade surface. The spherical
electrode over the panel is connected to an impulse voltage generator.
A certain potential is applied to the HV electrode, sufficiently high to generate an
electric field enhancement over the dielectric strength of air in the vicinity of the
conductive components.
In the zones where the electric field in the air is exceeding its dielectric strength, the
specific volume of air becomes conductive to simulate the initiation of a streamer.
The streamer takes the potential of the conductive element from which it is
originated.
The model is recalculated according to step 2 with the new distribution of potential.
During the iteration process, streamers are initiated both at the HV electrode and the
grounded components. Some of these streamers will develop while others will die,
depending on the electric field enhancement at the tip of the streamer. The iteration
process ends when one of the streamers originated at the HV electrode meets a streamer
incepted from the grounded components, closing the path of the discharge. Figure 4-27
shows a sequence of the iteration. It is observed that when applying the voltage to the
HV electrode, the higher field enhancement is located at the edges of the grounded
receptor. A streamer is initiated from the receptor, first moving upwards and when it is
about 50 mm longs, it turns towards the HV electrode. When the discharge originated at
the receptor gets closer to the HV electrode, another streamer is initiated at the HV
electrode that eventually meets the streamer from the grounded receptor.

Lightning attachment to wind turbine blades 79
Figure 4-27 Sequence of iteration of the streamer origination and propagation from the receptor and
the HV electrode (From left to right and down)
4.3.2.2 Simulation method applied to wind turbine blades
The quasi-dynamic FEM simulation method based on an iterative calculation of the
electric field exceeding the breakdown strength of the insulating materials has been
applied to a model of the blade section specimen described in Section 4.2.2.1.
Considering that the blade section used in the full-scale tests has constant geometry
along the axis of the blade, a 2D model has been considered suitable for the simulation.
The model reproduces the geometry and material of the test specimen. Figure 4-28
shows the blade section tested in the laboratory and the FEM 2-D model representing
the blade section. In the FEM model, a constant potential of 500 kV is applied to the
lightning down conductor and to the aluminum tape. A relative permittivity of the
fiberglass εFG = 4.5 is considered for the simulation, and a breakdown strength of 2
kV/mm for the air and 15 kV/mm for the fiberglass material of the shells. Two different
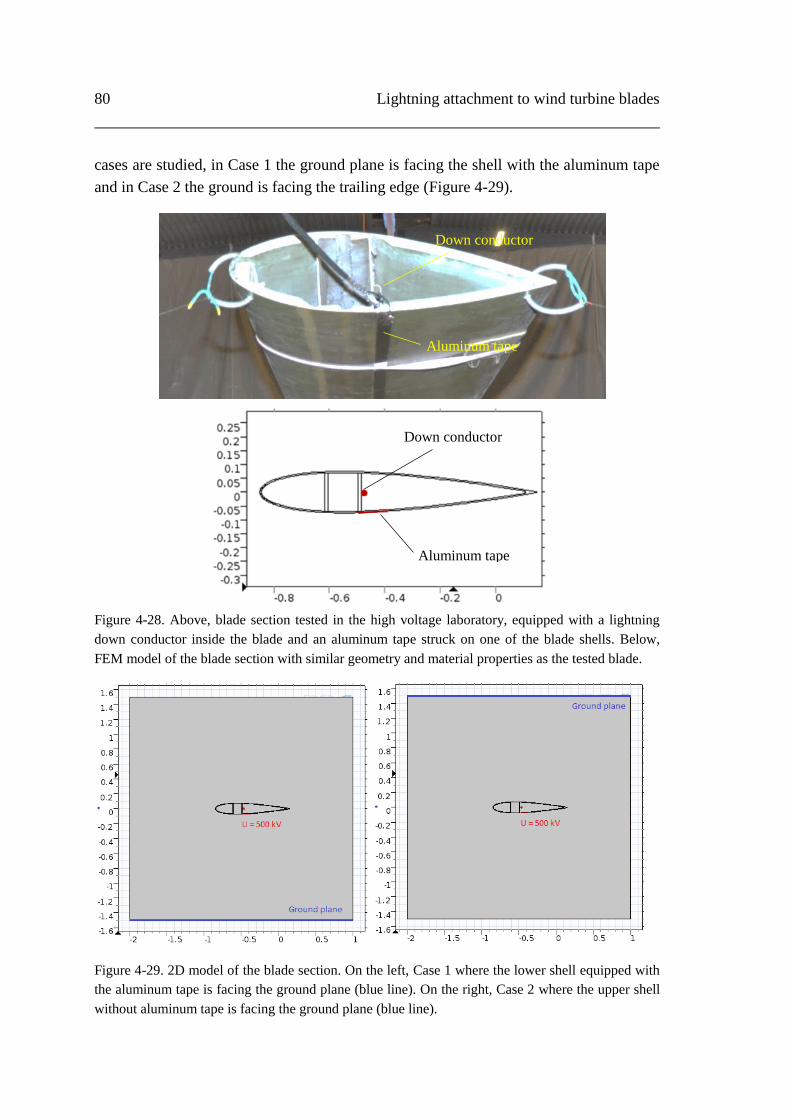
80 Lightning attachment to wind turbine blades
cases are studied, in Case 1 the ground plane is facing the shell with the aluminum tape
and in Case 2 the ground is facing the trailing edge (Figure 4-29).
Figure 4-28. Above, blade section tested in the high voltage laboratory, equipped with a lightning
down conductor inside the blade and an aluminum tape struck on one of the blade shells. Below,
FEM model of the blade section with similar geometry and material properties as the tested blade.
Figure 4-29. 2D model of the blade section. On the left, Case 1 where the lower shell equipped with
the aluminum tape is facing the ground plane (blue line). On the right, Case 2 where the upper shell
without aluminum tape is facing the ground plane (blue line).
Down conductor
Aluminum tape
Down conductor
Aluminum tape

Lightning attachment to wind turbine blades 81
The initiation and propagation of streamers from the internal down conductor and the
aluminum tape stuck on the lower shell for Case 1 and Case 2 is shown Figure 4-30 and
Figure 4-31, respectively.
Figure 4-30. Propagation of streamers from the blade conductors in Case 1 with the ground plane
facing the lower shell equipped with aluminum tape (iteration sequence from left to right and down)
Figure 4-31. Propagation of streamers from the blade conductors in Case 2 with the ground plane
facing the upper shell without aluminum tape (iteration sequence from left to right and down)
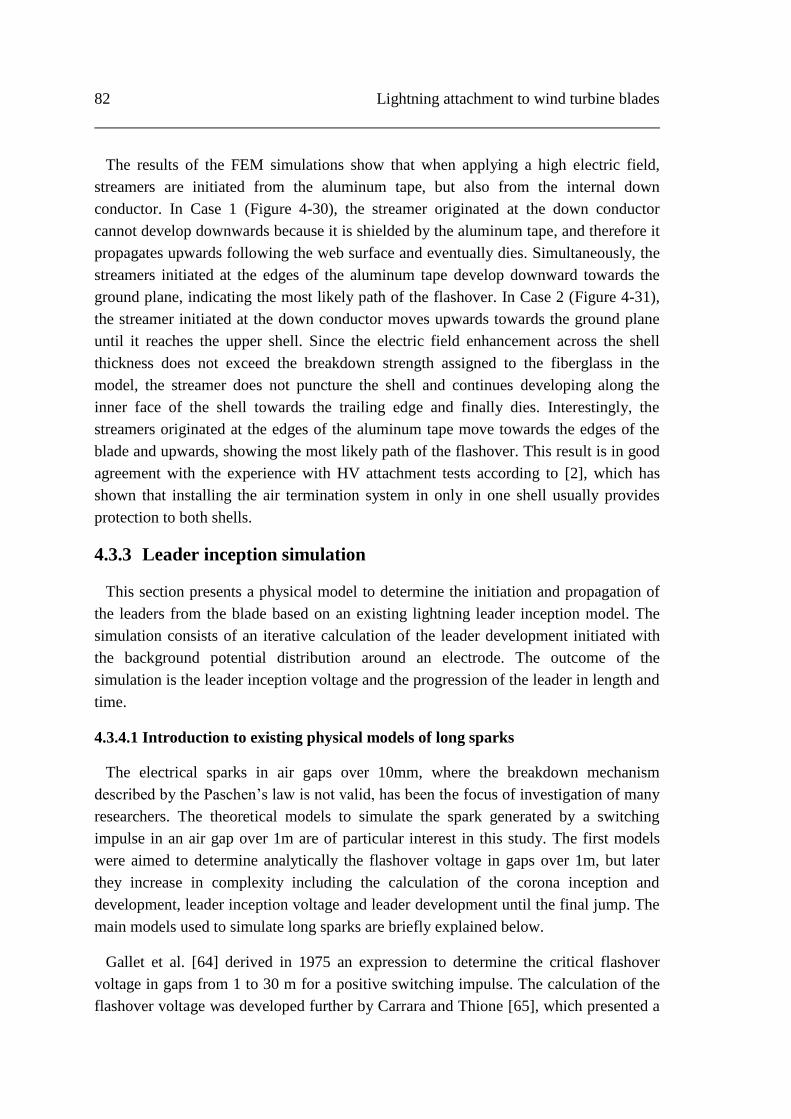
82 Lightning attachment to wind turbine blades
The results of the FEM simulations show that when applying a high electric field,
streamers are initiated from the aluminum tape, but also from the internal down
conductor. In Case 1 (Figure 4-30), the streamer originated at the down conductor
cannot develop downwards because it is shielded by the aluminum tape, and therefore it
propagates upwards following the web surface and eventually dies. Simultaneously, the
streamers initiated at the edges of the aluminum tape develop downward towards the
ground plane, indicating the most likely path of the flashover. In Case 2 (Figure 4-31),
the streamer initiated at the down conductor moves upwards towards the ground plane
until it reaches the upper shell. Since the electric field enhancement across the shell
thickness does not exceed the breakdown strength assigned to the fiberglass in the
model, the streamer does not puncture the shell and continues developing along the
inner face of the shell towards the trailing edge and finally dies. Interestingly, the
streamers originated at the edges of the aluminum tape move towards the edges of the
blade and upwards, showing the most likely path of the flashover. This result is in good
agreement with the experience with HV attachment tests according to [2], which has
shown that installing the air termination system in only in one shell usually provides
protection to both shells.
4.3.3 Leader inception simulation
This section presents a physical model to determine the initiation and propagation of
the leaders from the blade based on an existing lightning leader inception model. The
simulation consists of an iterative calculation of the leader development initiated with
the background potential distribution around an electrode. The outcome of the
simulation is the leader inception voltage and the progression of the leader in length and
time.
4.3.4.1 Introduction to existing physical models of long sparks
The electrical sparks in air gaps over 10mm, where the breakdown mechanism
described by the Paschen’s law is not valid, has been the focus of investigation of many
researchers. The theoretical models to simulate the spark generated by a switching
impulse in an air gap over 1m are of particular interest in this study. The first models
were aimed to determine analytically the flashover voltage in gaps over 1m, but later
they increase in complexity including the calculation of the corona inception and
development, leader inception voltage and leader development until the final jump. The
main models used to simulate long sparks are briefly explained below.
Gallet et al. [64] derived in 1975 an expression to determine the critical flashover
voltage in gaps from 1 to 30 m for a positive switching impulse. The calculation of the
flashover voltage was developed further by Carrara and Thione [65], which presented a
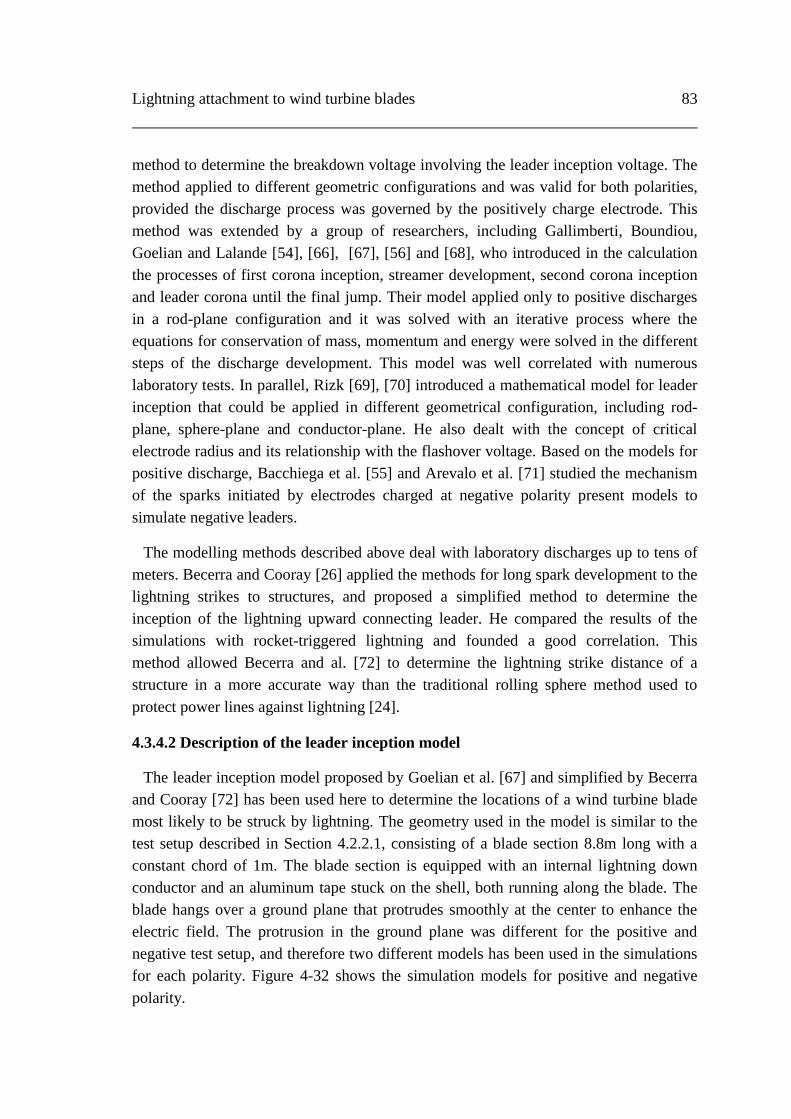
Lightning attachment to wind turbine blades 83
method to determine the breakdown voltage involving the leader inception voltage. The
method applied to different geometric configurations and was valid for both polarities,
provided the discharge process was governed by the positively charge electrode. This
method was extended by a group of researchers, including Gallimberti, Boundiou,
Goelian and Lalande [54], [66], [67], [56] and [68], who introduced in the calculation
the processes of first corona inception, streamer development, second corona inception
and leader corona until the final jump. Their model applied only to positive discharges
in a rod-plane configuration and it was solved with an iterative process where the
equations for conservation of mass, momentum and energy were solved in the different
steps of the discharge development. This model was well correlated with numerous
laboratory tests. In parallel, Rizk [69], [70] introduced a mathematical model for leader
inception that could be applied in different geometrical configuration, including rod-
plane, sphere-plane and conductor-plane. He also dealt with the concept of critical
electrode radius and its relationship with the flashover voltage. Based on the models for
positive discharge, Bacchiega et al. [55] and Arevalo et al. [71] studied the mechanism
of the sparks initiated by electrodes charged at negative polarity present models to
simulate negative leaders.
The modelling methods described above deal with laboratory discharges up to tens of
meters. Becerra and Cooray [26] applied the methods for long spark development to the
lightning strikes to structures, and proposed a simplified method to determine the
inception of the lightning upward connecting leader. He compared the results of the
simulations with rocket-triggered lightning and founded a good correlation. This
method allowed Becerra and al. [72] to determine the lightning strike distance of a
structure in a more accurate way than the traditional rolling sphere method used to
protect power lines against lightning [24].
4.3.4.2 Description of the leader inception model
The leader inception model proposed by Goelian et al. [67] and simplified by Becerra
and Cooray [72] has been used here to determine the locations of a wind turbine blade
most likely to be struck by lightning. The geometry used in the model is similar to the
test setup described in Section 4.2.2.1, consisting of a blade section 8.8m long with a
constant chord of 1m. The blade section is equipped with an internal lightning down
conductor and an aluminum tape stuck on the shell, both running along the blade. The
blade hangs over a ground plane that protrudes smoothly at the center to enhance the
electric field. The protrusion in the ground plane was different for the positive and
negative test setup, and therefore two different models has been used in the simulations
for each polarity. Figure 4-32 shows the simulation models for positive and negative
polarity.
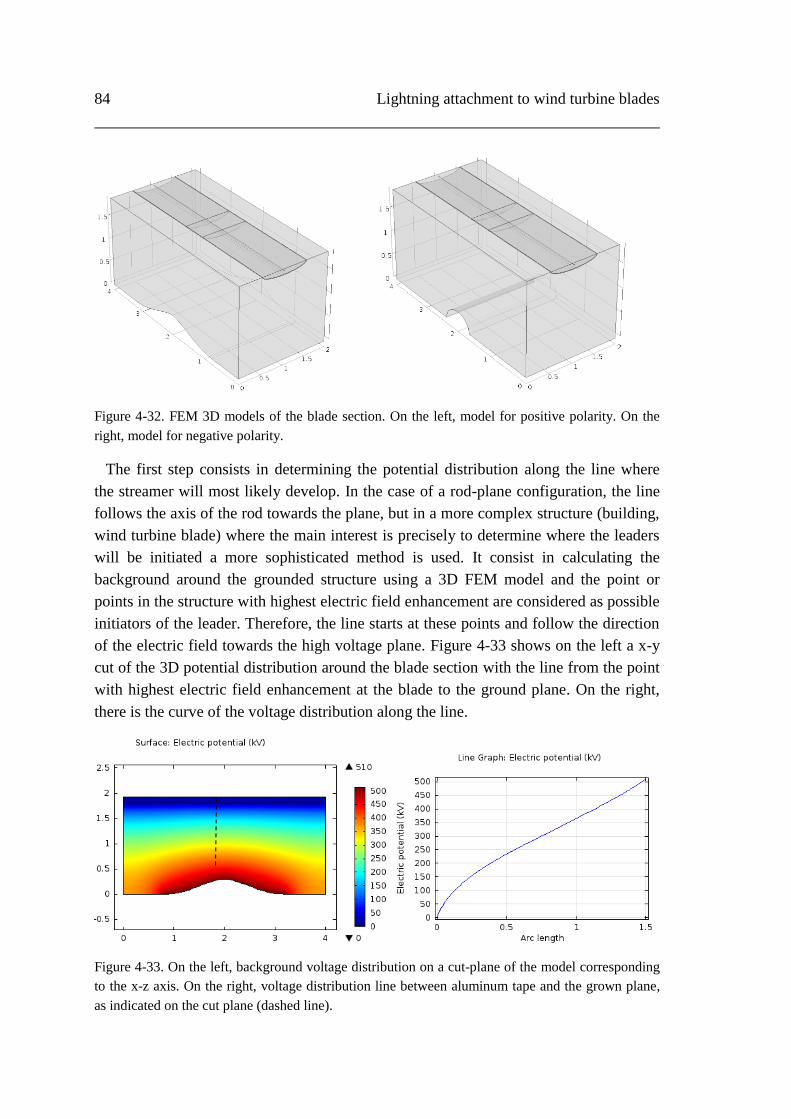
84 Lightning attachment to wind turbine blades
Figure 4-32. FEM 3D models of the blade section. On the left, model for positive polarity. On the
right, model for negative polarity.
The first step consists in determining the potential distribution along the line where
the streamer will most likely develop. In the case of a rod-plane configuration, the line
follows the axis of the rod towards the plane, but in a more complex structure (building,
wind turbine blade) where the main interest is precisely to determine where the leaders
will be initiated a more sophisticated method is used. It consist in calculating the
background around the grounded structure using a 3D FEM model and the point or
points in the structure with highest electric field enhancement are considered as possible
initiators of the leader. Therefore, the line starts at these points and follow the direction
of the electric field towards the high voltage plane. Figure 4-33 shows on the left a x-y
cut of the 3D potential distribution around the blade section with the line from the point
with highest electric field enhancement at the blade to the ground plane. On the right,
there is the curve of the voltage distribution along the line.
Figure 4-33. On the left, background voltage distribution on a cut-plane of the model corresponding
to the x-z axis. On the right, voltage distribution line between aluminum tape and the grown plane,
as indicated on the cut plane (dashed line).
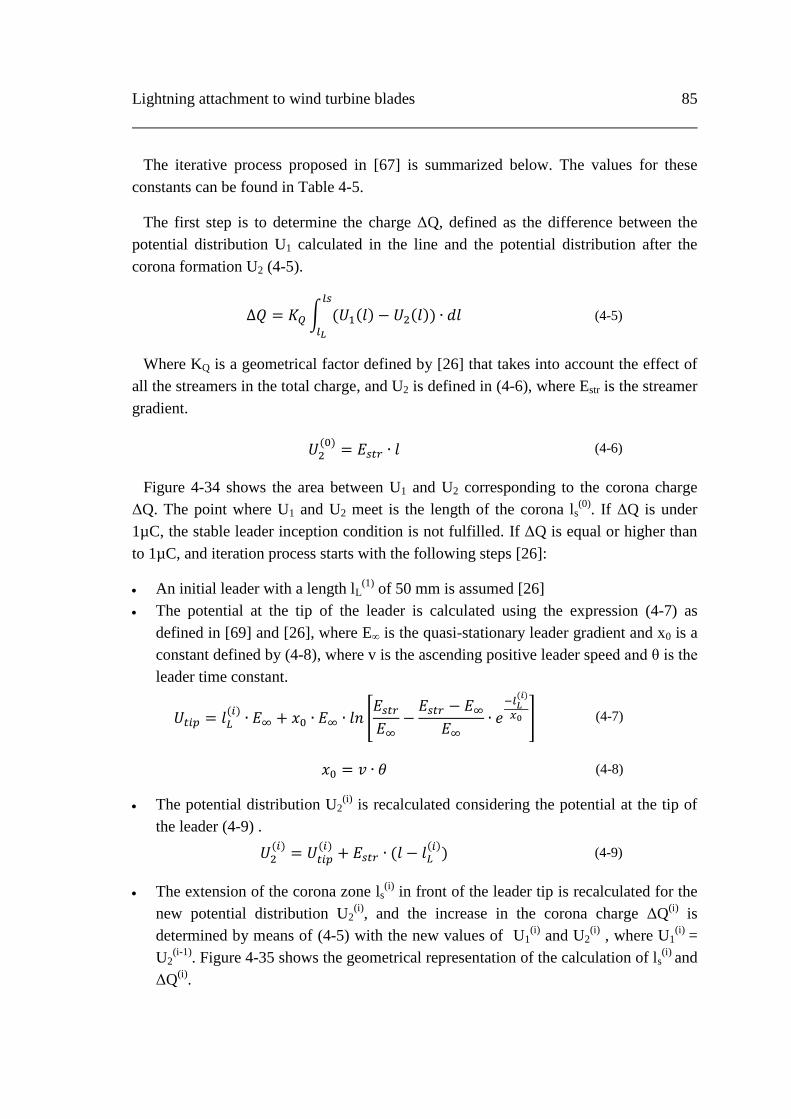
Lightning attachment to wind turbine blades 85
The iterative process proposed in [67] is summarized below. The values for these
constants can be found in Table 4-5.
The first step is to determine the charge ΔQ, defined as the difference between the
potential distribution U1 calculated in the line and the potential distribution after the
corona formation U2 (4-5).
∆𝑄 = 𝐾𝑄 ∫ (𝑈1(𝑙) − 𝑈2(𝑙)) ∙ 𝑑𝑙𝑙𝑠
𝑙𝐿
(4-5)
Where KQ is a geometrical factor defined by [26] that takes into account the effect of
all the streamers in the total charge, and U2 is defined in (4-6), where Estr is the streamer
gradient.
𝑈2(0)
= 𝐸𝑠𝑡𝑟 ∙ 𝑙 (4-6)
Figure 4-34 shows the area between U1 and U2 corresponding to the corona charge
ΔQ. The point where U1 and U2 meet is the length of the corona ls(0)
. If ΔQ is under
1µC, the stable leader inception condition is not fulfilled. If ΔQ is equal or higher than
to 1µC, and iteration process starts with the following steps [26]:
An initial leader with a length lL(1)
of 50 mm is assumed [26]
The potential at the tip of the leader is calculated using the expression (4-7) as
defined in [69] and [26], where E∞ is the quasi-stationary leader gradient and x0 is a
constant defined by (4-8), where v is the ascending positive leader speed and θ is the
leader time constant.
𝑈𝑡𝑖𝑝 = 𝑙𝐿(𝑖)
∙ 𝐸∞ + 𝑥0 ∙ 𝐸∞ ∙ 𝑙𝑛 [𝐸𝑠𝑡𝑟
𝐸∞−
𝐸𝑠𝑡𝑟 − 𝐸∞
𝐸∞∙ 𝑒
−𝑙𝐿(𝑖)
𝑥0 ] (4-7)
𝑥0 = 𝑣 ∙ 𝜃 (4-8)
The potential distribution U2(i)
is recalculated considering the potential at the tip of
the leader (4-9) .
𝑈2(𝑖)
= 𝑈𝑡𝑖𝑝(𝑖)
+ 𝐸𝑠𝑡𝑟 ∙ (𝑙 − 𝑙𝐿(𝑖)
) (4-9)
The extension of the corona zone ls(i)
in front of the leader tip is recalculated for the
new potential distribution U2(i)
, and the increase in the corona charge ΔQ(i)
is
determined by means of (4-5) with the new values of U1(i)
and U2(i)
, where U1(i)
=
U2(i-1)
. Figure 4-35 shows the geometrical representation of the calculation of ls(i)
and
ΔQ(i)
.
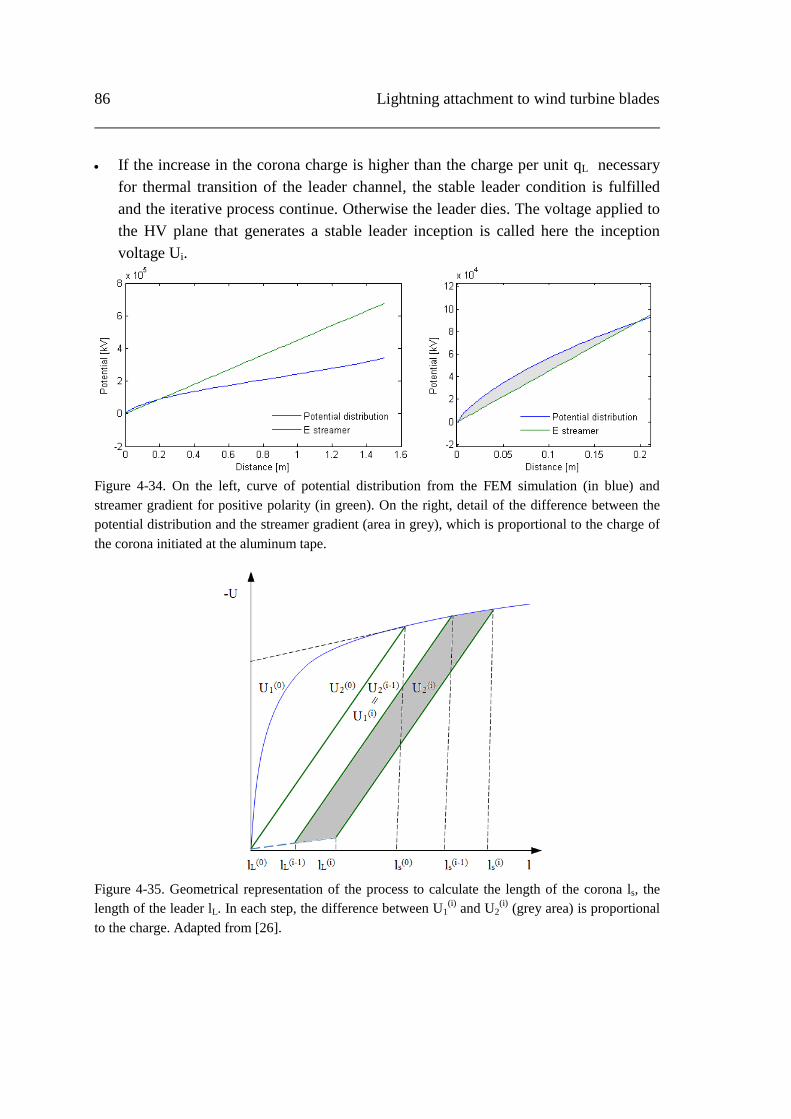
86 Lightning attachment to wind turbine blades
If the increase in the corona charge is higher than the charge per unit qL necessary
for thermal transition of the leader channel, the stable leader condition is fulfilled
and the iterative process continue. Otherwise the leader dies. The voltage applied to
the HV plane that generates a stable leader inception is called here the inception
voltage Ui.
Figure 4-34. On the left, curve of potential distribution from the FEM simulation (in blue) and
streamer gradient for positive polarity (in green). On the right, detail of the difference between the
potential distribution and the streamer gradient (area in grey), which is proportional to the charge of
the corona initiated at the aluminum tape.
Figure 4-35. Geometrical representation of the process to calculate the length of the corona ls, the
length of the leader lL. In each step, the difference between U1(i)
and U2(i)
(grey area) is proportional
to the charge. Adapted from [26].
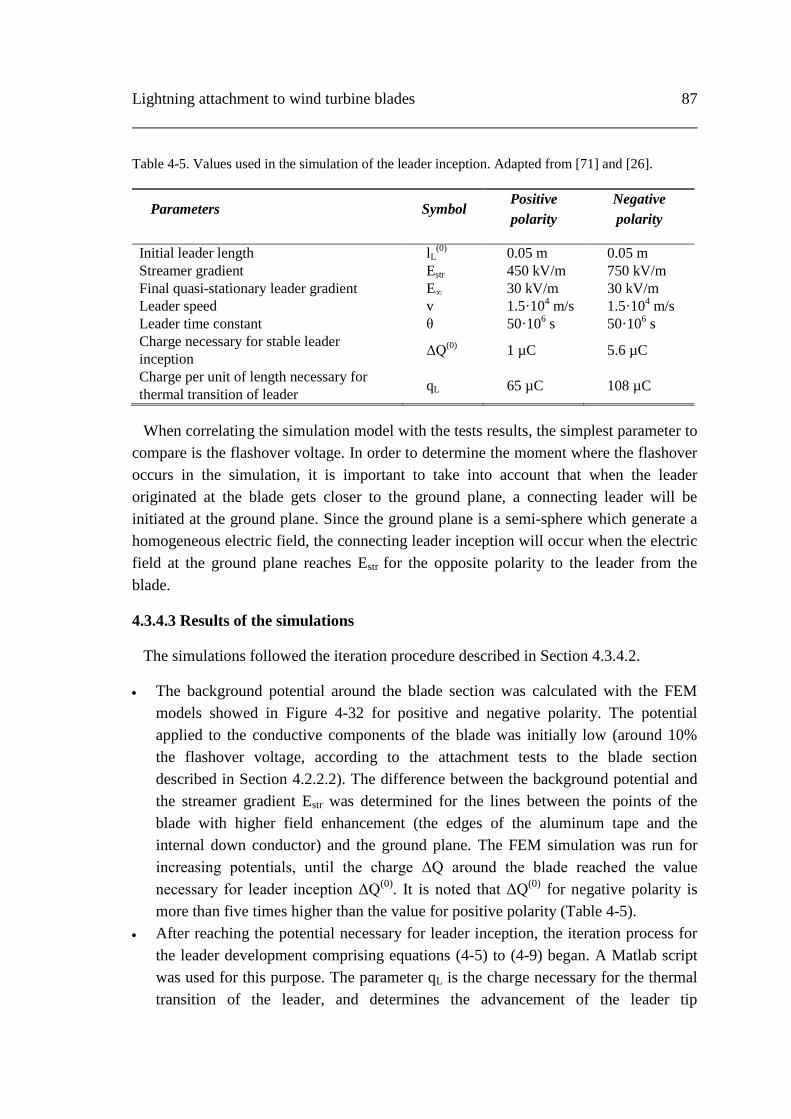
Lightning attachment to wind turbine blades 87
Table 4-5. Values used in the simulation of the leader inception. Adapted from [71] and [26].
Parameters Symbol Positive
polarity
Negative
polarity
Initial leader length lL(0)
0.05 m 0.05 m
Streamer gradient Estr 450 kV/m 750 kV/m
Final quasi-stationary leader gradient E∞ 30 kV/m 30 kV/m
Leader speed v 1.5·104 m/s 1.5·10
4 m/s
Leader time constant θ 50·106 s 50·10
6 s
Charge necessary for stable leader
inception ΔQ
(0) 1 µC 5.6 µC
Charge per unit of length necessary for
thermal transition of leader qL 65 µC 108 µC
When correlating the simulation model with the tests results, the simplest parameter to
compare is the flashover voltage. In order to determine the moment where the flashover
occurs in the simulation, it is important to take into account that when the leader
originated at the blade gets closer to the ground plane, a connecting leader will be
initiated at the ground plane. Since the ground plane is a semi-sphere which generate a
homogeneous electric field, the connecting leader inception will occur when the electric
field at the ground plane reaches Estr for the opposite polarity to the leader from the
blade.
4.3.4.3 Results of the simulations
The simulations followed the iteration procedure described in Section 4.3.4.2.
The background potential around the blade section was calculated with the FEM
models showed in Figure 4-32 for positive and negative polarity. The potential
applied to the conductive components of the blade was initially low (around 10%
the flashover voltage, according to the attachment tests to the blade section
described in Section 4.2.2.2). The difference between the background potential and
the streamer gradient Estr was determined for the lines between the points of the
blade with higher field enhancement (the edges of the aluminum tape and the
internal down conductor) and the ground plane. The FEM simulation was run for
increasing potentials, until the charge ΔQ around the blade reached the value
necessary for leader inception ΔQ(0)
. It is noted that ΔQ(0)
for negative polarity is
more than five times higher than the value for positive polarity (Table 4-5).
After reaching the potential necessary for leader inception, the iteration process for
the leader development comprising equations (4-5) to (4-9) began. A Matlab script
was used for this purpose. The parameter qL is the charge necessary for the thermal
transition of the leader, and determines the advancement of the leader tip
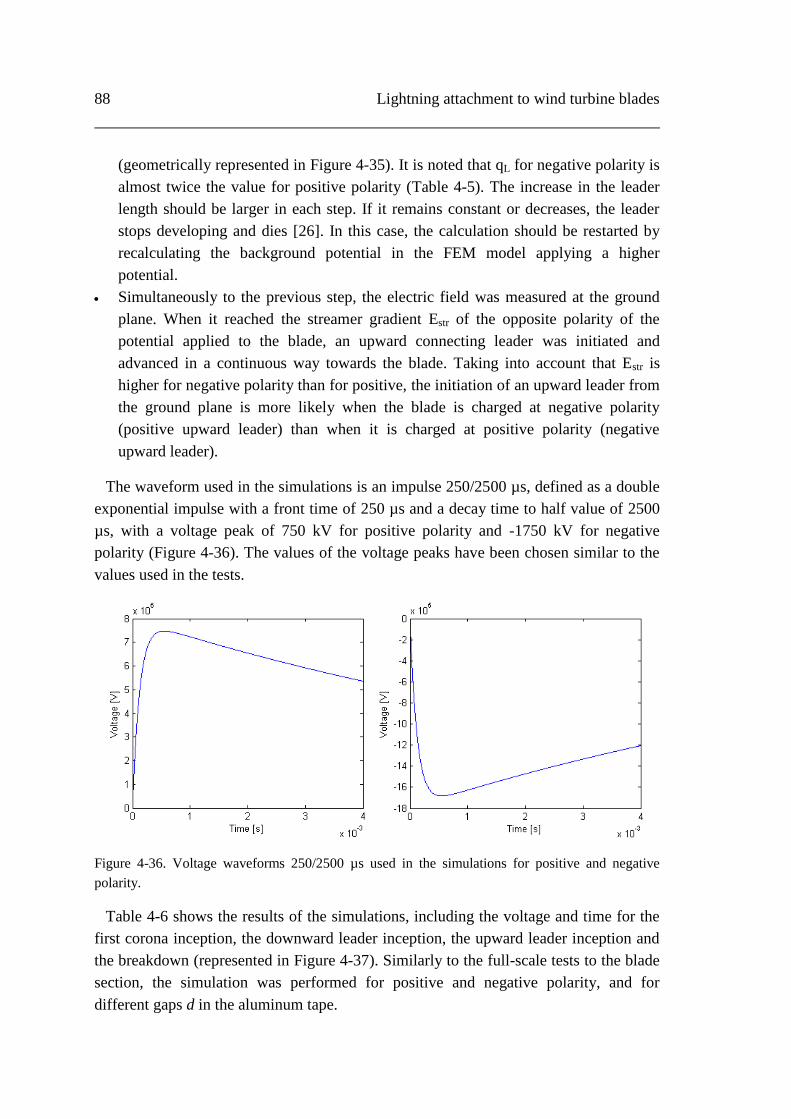
88 Lightning attachment to wind turbine blades
(geometrically represented in Figure 4-35). It is noted that qL for negative polarity is
almost twice the value for positive polarity (Table 4-5). The increase in the leader
length should be larger in each step. If it remains constant or decreases, the leader
stops developing and dies [26]. In this case, the calculation should be restarted by
recalculating the background potential in the FEM model applying a higher
potential.
Simultaneously to the previous step, the electric field was measured at the ground
plane. When it reached the streamer gradient Estr of the opposite polarity of the
potential applied to the blade, an upward connecting leader was initiated and
advanced in a continuous way towards the blade. Taking into account that Estr is
higher for negative polarity than for positive, the initiation of an upward leader from
the ground plane is more likely when the blade is charged at negative polarity
(positive upward leader) than when it is charged at positive polarity (negative
upward leader).
The waveform used in the simulations is an impulse 250/2500 µs, defined as a double
exponential impulse with a front time of 250 µs and a decay time to half value of 2500
µs, with a voltage peak of 750 kV for positive polarity and -1750 kV for negative
polarity (Figure 4-36). The values of the voltage peaks have been chosen similar to the
values used in the tests.
Figure 4-36. Voltage waveforms 250/2500 µs used in the simulations for positive and negative
polarity.
Table 4-6 shows the results of the simulations, including the voltage and time for the
first corona inception, the downward leader inception, the upward leader inception and
the breakdown (represented in Figure 4-37). Similarly to the full-scale tests to the blade
section, the simulation was performed for positive and negative polarity, and for
different gaps d in the aluminum tape.
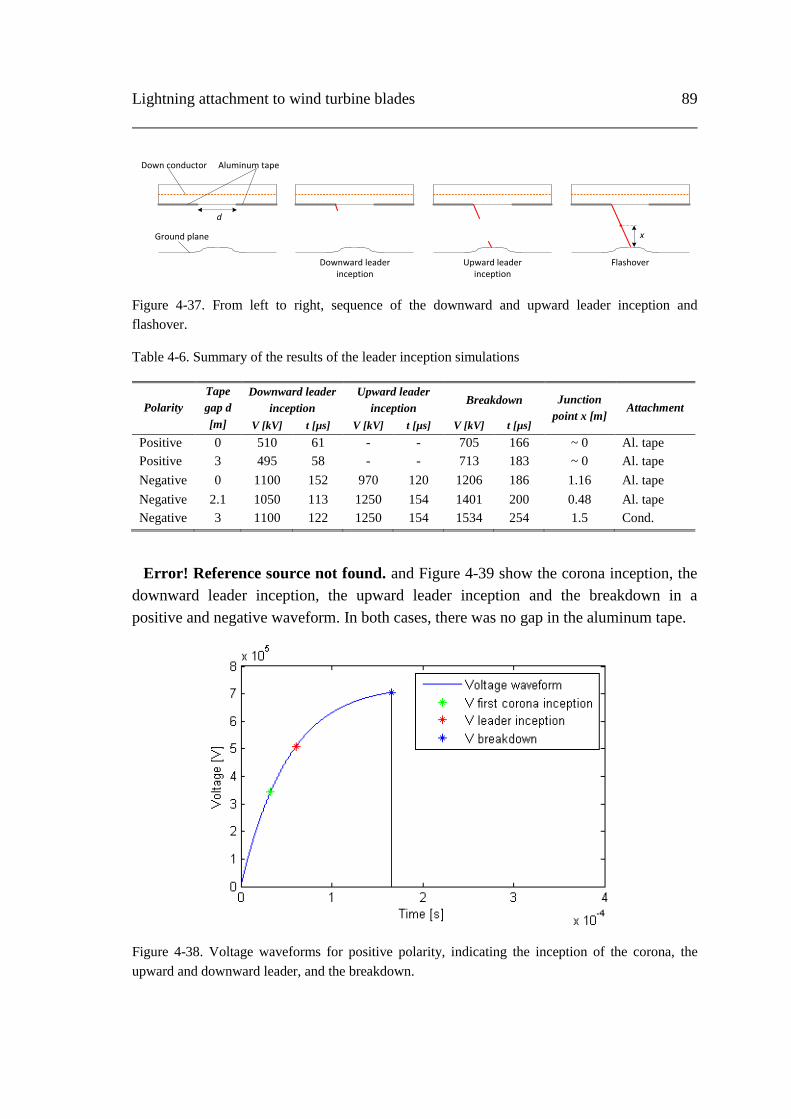
Lightning attachment to wind turbine blades 89
Down conductor
Ground plane
Aluminum tape
d
Downward leader inception
Upward leader inception
Flashover
x
Figure 4-37. From left to right, sequence of the downward and upward leader inception and
flashover.
Table 4-6. Summary of the results of the leader inception simulations
Polarity
Tape
gap d
[m]
Downward leader
inception
Upward leader
inception Breakdown Junction
point x [m] Attachment
V [kV] t [µs] V [kV] t [µs] V [kV] t [µs]
Positive 0 510 61 - - 705 166 ~ 0 Al. tape
Positive 3 495 58 - - 713 183 ~ 0 Al. tape
Negative 0 1100 152 970 120 1206 186 1.16 Al. tape
Negative 2.1 1050 113 1250 154 1401 200 0.48 Al. tape
Negative 3 1100 122 1250 154 1534 254 1.5 Cond.
Error! Reference source not found. and Figure 4-39 show the corona inception, the
downward leader inception, the upward leader inception and the breakdown in a
positive and negative waveform. In both cases, there was no gap in the aluminum tape.
Figure 4-38. Voltage waveforms for positive polarity, indicating the inception of the corona, the
upward and downward leader, and the breakdown.

90 Lightning attachment to wind turbine blades
Figure 4-39. Voltage waveforms for negative polarity, indicating the inception of the corona, the
upward and downward leader, and the breakdown.
Table 4-7 compares the simulation results with the tests results to a blade section
reported in Section 4.2.2.2
Table 4-7. Comparison between the simulations results based on the leader inception method and
tests results
Simulation results
Polarity Tape gap
d [m]
Flashover
Peak value
[kV]
Time to
flashover [µs]
Distance
ground to
junction [m]
Attachment
Positive 0 705 166 0 Al. tape
3 713 183 0 Al. tape
Negative 0 1206 186 1.16 Al. tape
2.1 1401 200 0.48 Al. tape
Test results
Polarity Tape gap
d [m]
Flashover
Peak value
[kV]
Time to
flashover [µs]
Distance
ground to
junction [m]
Attachment
Positive 0 706.5 160.5 ~ 0 Al. tape
3 793.7 171.8 ~ 0 Al. tape
Negative
0 1381 540.3 ~ 0.78 Al. tape
2.1 1370.0 482.5 ~ 0.85 Internal
cond.
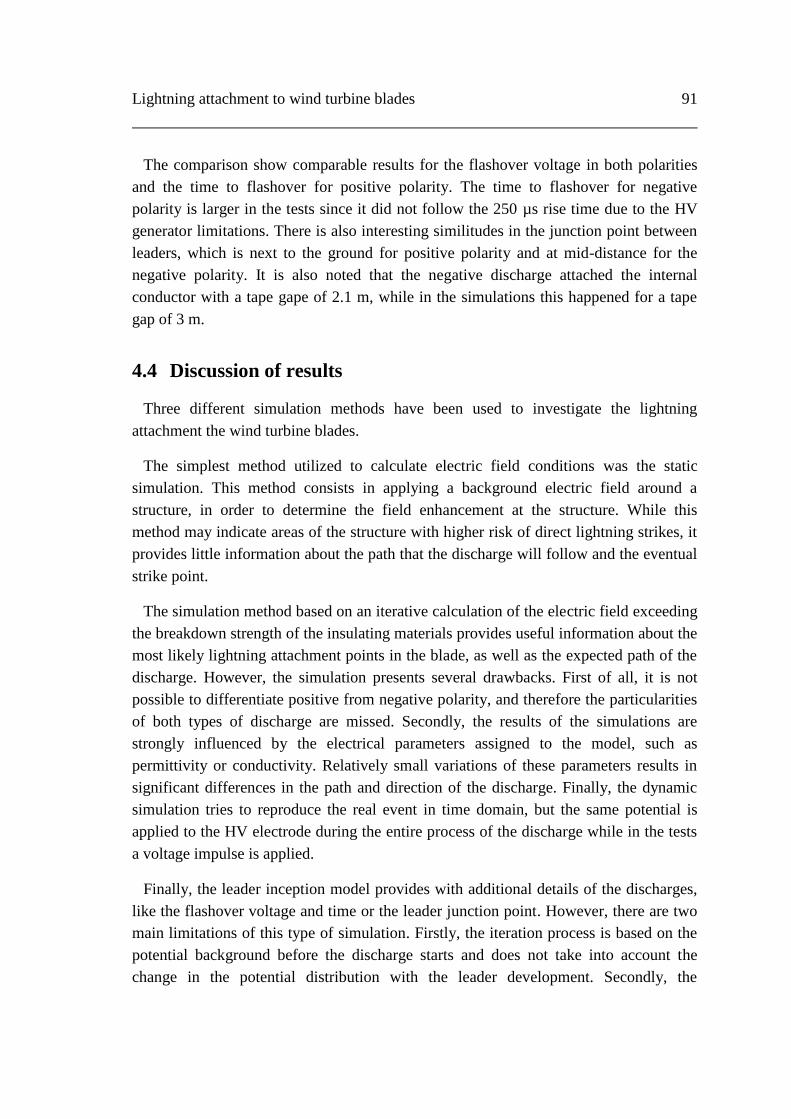
Lightning attachment to wind turbine blades 91
The comparison show comparable results for the flashover voltage in both polarities
and the time to flashover for positive polarity. The time to flashover for negative
polarity is larger in the tests since it did not follow the 250 µs rise time due to the HV
generator limitations. There is also interesting similitudes in the junction point between
leaders, which is next to the ground for positive polarity and at mid-distance for the
negative polarity. It is also noted that the negative discharge attached the internal
conductor with a tape gape of 2.1 m, while in the simulations this happened for a tape
gap of 3 m.
4.4 Discussion of results
Three different simulation methods have been used to investigate the lightning
attachment the wind turbine blades.
The simplest method utilized to calculate electric field conditions was the static
simulation. This method consists in applying a background electric field around a
structure, in order to determine the field enhancement at the structure. While this
method may indicate areas of the structure with higher risk of direct lightning strikes, it
provides little information about the path that the discharge will follow and the eventual
strike point.
The simulation method based on an iterative calculation of the electric field exceeding
the breakdown strength of the insulating materials provides useful information about the
most likely lightning attachment points in the blade, as well as the expected path of the
discharge. However, the simulation presents several drawbacks. First of all, it is not
possible to differentiate positive from negative polarity, and therefore the particularities
of both types of discharge are missed. Secondly, the results of the simulations are
strongly influenced by the electrical parameters assigned to the model, such as
permittivity or conductivity. Relatively small variations of these parameters results in
significant differences in the path and direction of the discharge. Finally, the dynamic
simulation tries to reproduce the real event in time domain, but the same potential is
applied to the HV electrode during the entire process of the discharge while in the tests
a voltage impulse is applied.
Finally, the leader inception model provides with additional details of the discharges,
like the flashover voltage and time or the leader junction point. However, there are two
main limitations of this type of simulation. Firstly, the iteration process is based on the
potential background before the discharge starts and does not take into account the
change in the potential distribution with the leader development. Secondly, the
92 Lightning attachment to wind turbine blades
propagation of the leader follows a path that is chosen only based on the initial potential
background.
Although the drawbacks in the simulation methods, they show good correlation with
the tests results and, even if the high voltage tests are still necessary for a final
validation of the blade lightning protection, the simulations can be used as a useful
auxiliary tool during the process of design.

Chapter 5
Lightning current and voltage distribution in
wind turbine blades
After the lightning attachment to the blade, the current of the return strokes flows
through the conductive components of the blade towards the ground. The current
distribution in the blade is determined by its internal impedances, and can be calculated
by means of engineering analysis, numerical tools and knowledge about the discharge
physics. The calculation of the current distribution determines the voltage differences
between the conductive elements of the blade, which is essential to design the necessary
equipotential connections so that there is no risk of internal sparking [2].
This chapter investigates the transient behavior of lightning surges in wind turbine
blades equipped with lightning protection system and including other conductive
elements, such as the trailing edge flap system, electrical wiring for measuring
purposes, de-icing systems and carbon fiber laminate as part of the blade structure.
Considering that internal arcing between the down conductor and the other conductors
can involve severe damages in the blade structure, the separation distances and
equipotential bonding between conductors must be carefully studied.
The study is based on simulation models consisting of electric equivalent circuits with
lumped and distributed parameters involving different lightning current waveforms.
When building the equivalent circuit of the lightning down conductor, the question of
whether to model it with lumped circuit or as transmission line arises. In general, the
necessity of a transmission line model is dependent on the steepness of the
voltage/current signal applied and the length of the line. Field measurements have
shown that when there is a lightning strike at the top of a tall tower, the current
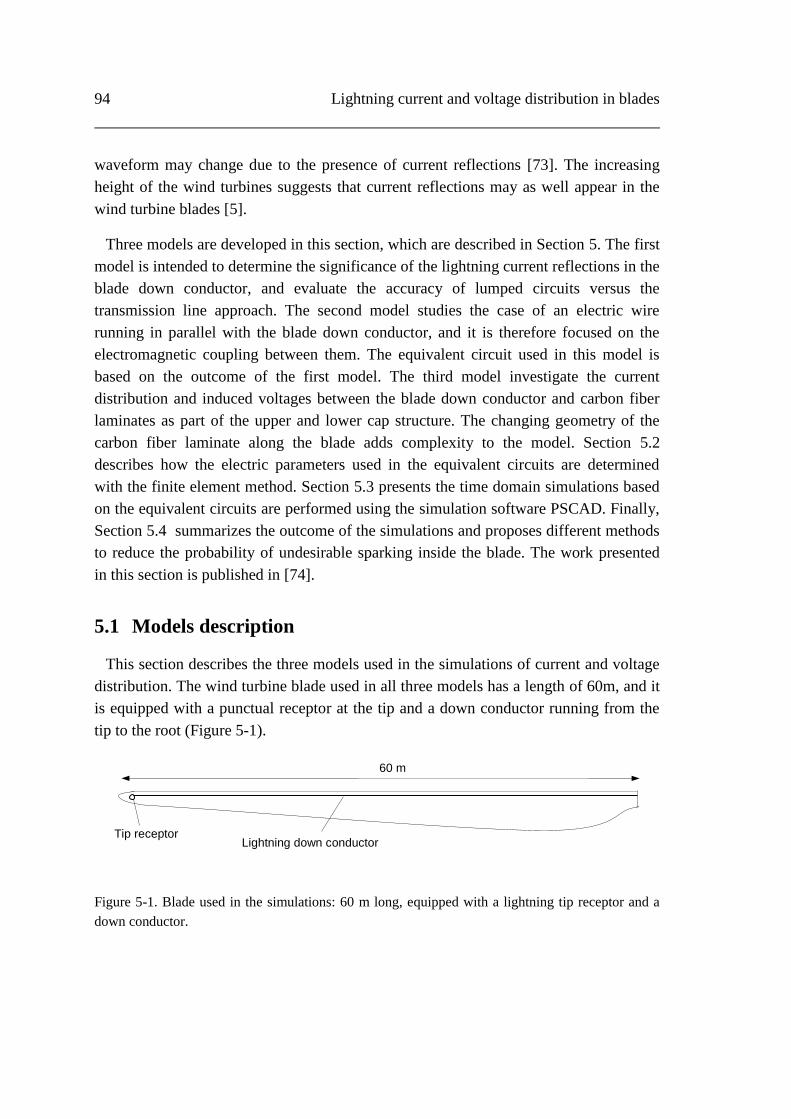
94 Lightning current and voltage distribution in blades
waveform may change due to the presence of current reflections [73]. The increasing
height of the wind turbines suggests that current reflections may as well appear in the
wind turbine blades [5].
Three models are developed in this section, which are described in Section 5. The first
model is intended to determine the significance of the lightning current reflections in the
blade down conductor, and evaluate the accuracy of lumped circuits versus the
transmission line approach. The second model studies the case of an electric wire
running in parallel with the blade down conductor, and it is therefore focused on the
electromagnetic coupling between them. The equivalent circuit used in this model is
based on the outcome of the first model. The third model investigate the current
distribution and induced voltages between the blade down conductor and carbon fiber
laminates as part of the upper and lower cap structure. The changing geometry of the
carbon fiber laminate along the blade adds complexity to the model. Section 5.2
describes how the electric parameters used in the equivalent circuits are determined
with the finite element method. Section 5.3 presents the time domain simulations based
on the equivalent circuits are performed using the simulation software PSCAD. Finally,
Section 5.4 summarizes the outcome of the simulations and proposes different methods
to reduce the probability of undesirable sparking inside the blade. The work presented
in this section is published in [74].
5.1 Models description
This section describes the three models used in the simulations of current and voltage
distribution. The wind turbine blade used in all three models has a length of 60m, and it
is equipped with a punctual receptor at the tip and a down conductor running from the
tip to the root (Figure 5-1).
Figure 5-1. Blade used in the simulations: 60 m long, equipped with a lightning tip receptor and a
down conductor.
60 m
Lightning down conductor Tip receptor
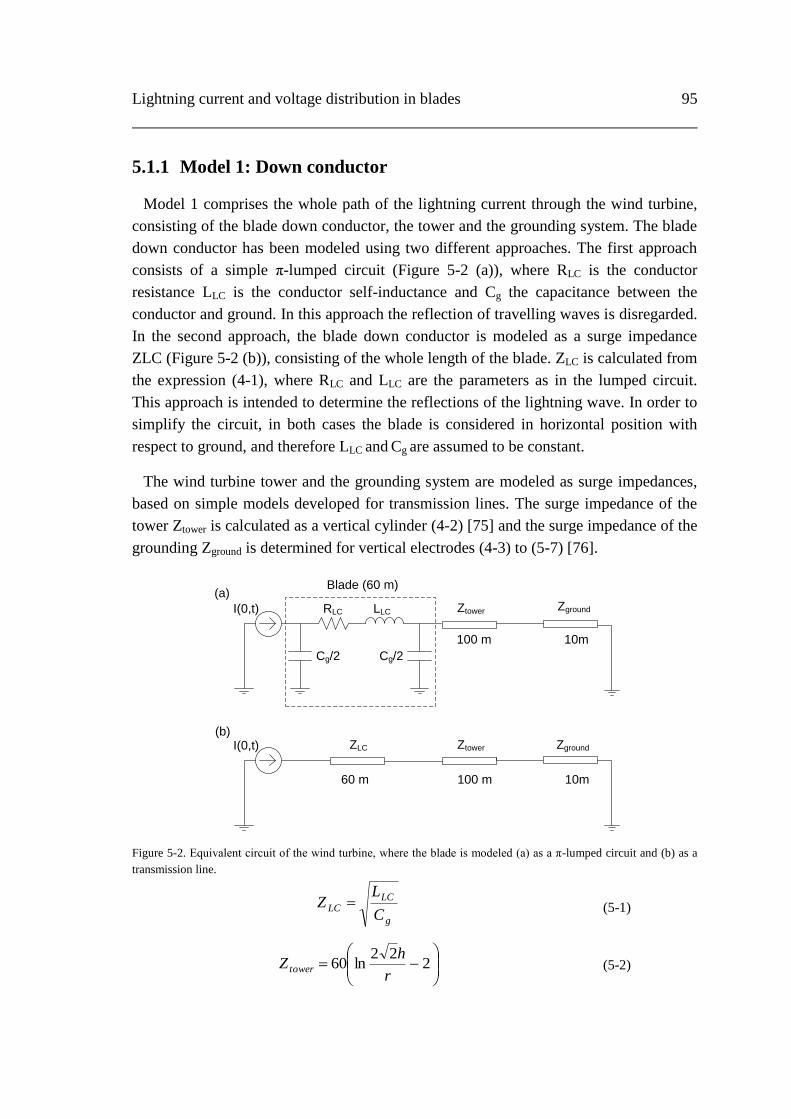
Lightning current and voltage distribution in blades 95
5.1.1 Model 1: Down conductor
Model 1 comprises the whole path of the lightning current through the wind turbine,
consisting of the blade down conductor, the tower and the grounding system. The blade
down conductor has been modeled using two different approaches. The first approach
consists of a simple π-lumped circuit (Figure 5-2 (a)), where RLC is the conductor
resistance LLC is the conductor self-inductance and Cg the capacitance between the
conductor and ground. In this approach the reflection of travelling waves is disregarded.
In the second approach, the blade down conductor is modeled as a surge impedance
ZLC (Figure 5-2 (b)), consisting of the whole length of the blade. ZLC is calculated from
the expression (4-1), where RLC and LLC are the parameters as in the lumped circuit.
This approach is intended to determine the reflections of the lightning wave. In order to
simplify the circuit, in both cases the blade is considered in horizontal position with
respect to ground, and therefore LLC and Cg are assumed to be constant.
The wind turbine tower and the grounding system are modeled as surge impedances,
based on simple models developed for transmission lines. The surge impedance of the
tower Ztower is calculated as a vertical cylinder (4-2) [75] and the surge impedance of the
grounding Zground is determined for vertical electrodes (4-3) to (5-7) [76].
ZtowerI(0,t)
RLC LLC
Cg/2 Cg/2
ZtowerI(0,t)
Blade (60 m)
ZLC
(a)
(b)
Zground
Zground
60 m 100 m 10m
100 m 10m
Figure 5-2. Equivalent circuit of the wind turbine, where the blade is modeled (a) as a π-lumped circuit and (b) as a
transmission line.
g
LCLC
C
LZ
(5-1)
2
22ln60
r
hZ tower
(5-2)
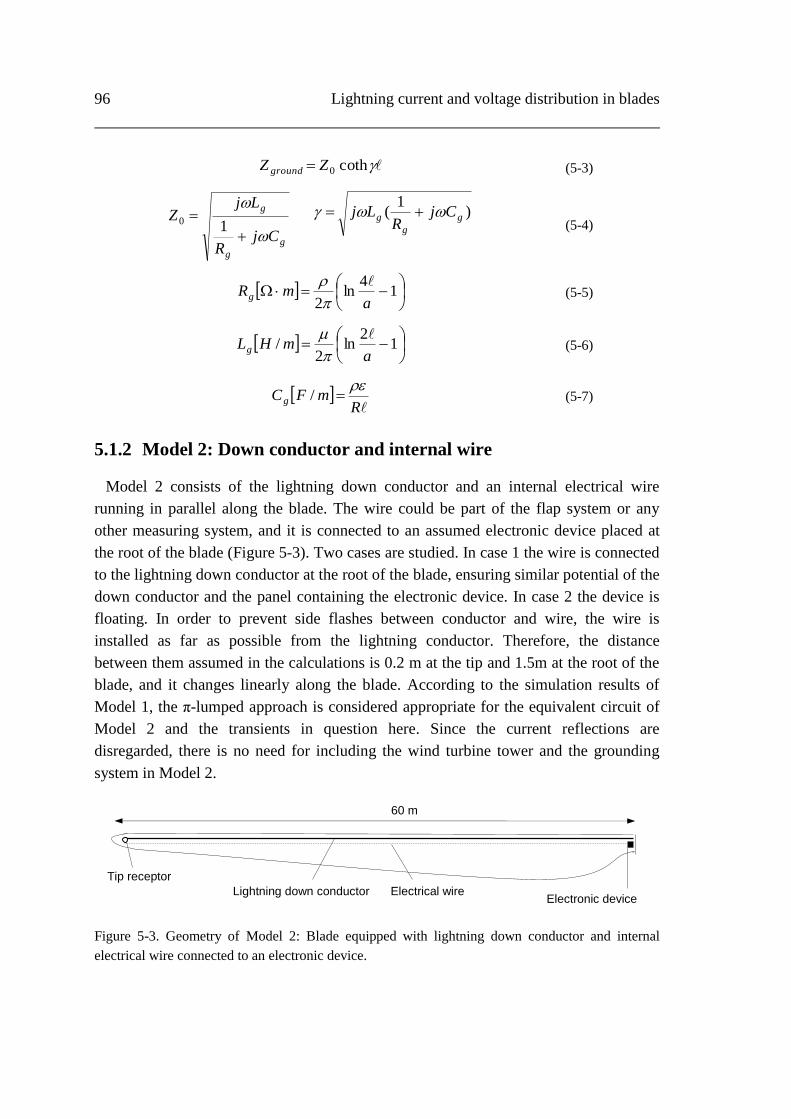
96 Lightning current and voltage distribution in blades
coth0ZZ ground (5-3)
g
g
g
CjR
LjZ
10
)1
( g
g
g CjR
Lj (5-4)
1
4ln
2 amRg
(5-5)
1
2ln
2/
amHLg
(5-6)
R
mFCg
/ (5-7)
5.1.2 Model 2: Down conductor and internal wire
Model 2 consists of the lightning down conductor and an internal electrical wire
running in parallel along the blade. The wire could be part of the flap system or any
other measuring system, and it is connected to an assumed electronic device placed at
the root of the blade (Figure 5-3). Two cases are studied. In case 1 the wire is connected
to the lightning down conductor at the root of the blade, ensuring similar potential of the
down conductor and the panel containing the electronic device. In case 2 the device is
floating. In order to prevent side flashes between conductor and wire, the wire is
installed as far as possible from the lightning conductor. Therefore, the distance
between them assumed in the calculations is 0.2 m at the tip and 1.5m at the root of the
blade, and it changes linearly along the blade. According to the simulation results of
Model 1, the π-lumped approach is considered appropriate for the equivalent circuit of
Model 2 and the transients in question here. Since the current reflections are
disregarded, there is no need for including the wind turbine tower and the grounding
system in Model 2.
Figure 5-3. Geometry of Model 2: Blade equipped with lightning down conductor and internal
electrical wire connected to an electronic device.
60 m
Lightning down conductor
Tip receptor
Electrical wire Electronic device
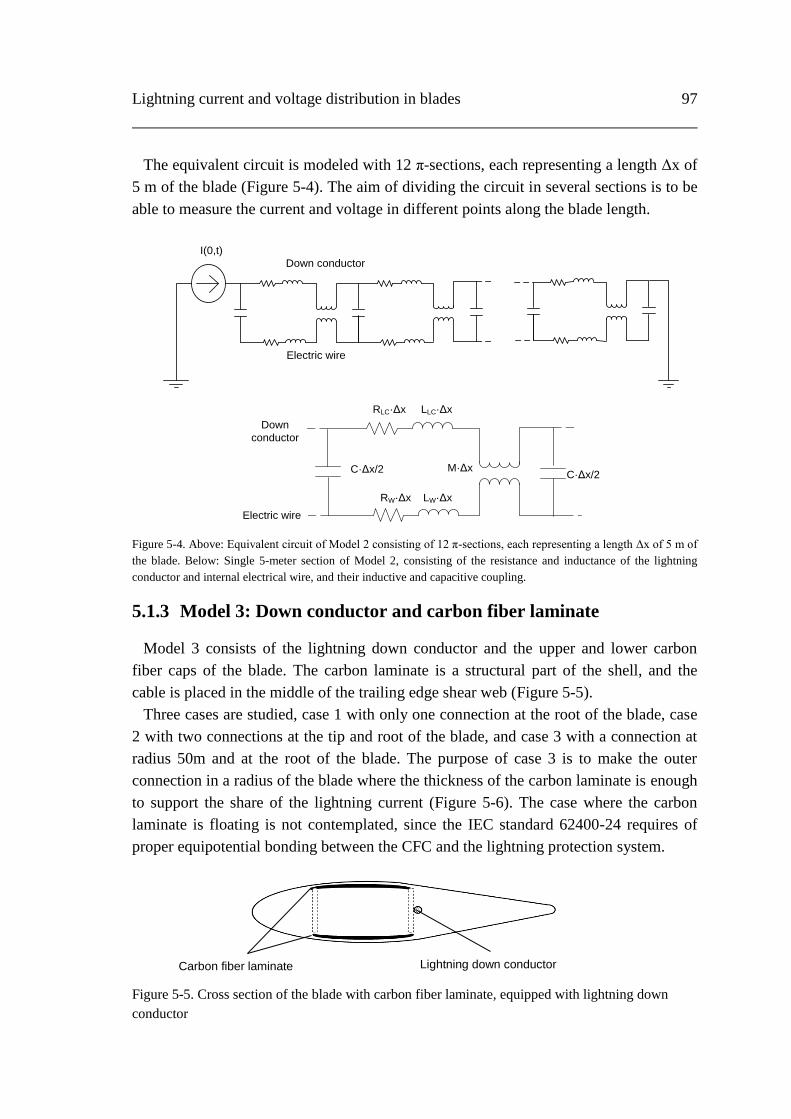
Lightning current and voltage distribution in blades 97
The equivalent circuit is modeled with 12 π-sections, each representing a length Δx of
5 m of the blade (Figure 5-4). The aim of dividing the circuit in several sections is to be
able to measure the current and voltage in different points along the blade length.
I(0,t)
Down conductor
Electric wire
RLC·Δx LLC·Δx
RW·Δx LW·Δx
M·ΔxC·Δx/2C·Δx/2
Down
conductor
Electric wire
Figure 5-4. Above: Equivalent circuit of Model 2 consisting of 12 π-sections, each representing a length Δx of 5 m of
the blade. Below: Single 5-meter section of Model 2, consisting of the resistance and inductance of the lightning
conductor and internal electrical wire, and their inductive and capacitive coupling.
5.1.3 Model 3: Down conductor and carbon fiber laminate
Model 3 consists of the lightning down conductor and the upper and lower carbon
fiber caps of the blade. The carbon laminate is a structural part of the shell, and the
cable is placed in the middle of the trailing edge shear web (Figure 5-5).
Three cases are studied, case 1 with only one connection at the root of the blade, case
2 with two connections at the tip and root of the blade, and case 3 with a connection at
radius 50m and at the root of the blade. The purpose of case 3 is to make the outer
connection in a radius of the blade where the thickness of the carbon laminate is enough
to support the share of the lightning current (Figure 5-6). The case where the carbon
laminate is floating is not contemplated, since the IEC standard 62400-24 requires of
proper equipotential bonding between the CFC and the lightning protection system.
Figure 5-5. Cross section of the blade with carbon fiber laminate, equipped with lightning down
conductor
Carbon fiber laminate Lightning down conductor

98 Lightning current and voltage distribution in blades
Figure 5-6. Connections between the lightning down conductor and the carbon fiber laminate. In
Case 1, there is only one connection at R0 (root of the blade). In Case 2, there are two connections at
R0 and R60. In Case 3, there are 2 connections at R0 and R50.
The carbon fiber laminate has a width of 0.2m and a thickness of 2mm at the tip of the
blade, and increases linearly until the root where the width is 2mm and the thickness is
50mm. The upper and lower CF laminates are symmetric. The distance between the
lightning conductor and the closest edge of the laminate is 0.05m at the tip and 1.5m at
the root.
The equivalent circuit is modeled with 12 π sections, each one representing 5m of
blade. Similarly to Model 2, each section is modelled with the resistance and self-
inductance of each conductor, and the mutual inductive and capacitive couplings
between them (Figure 5-7). The connections between the lightning down conductor and
the carbon fiber laminate are represented as ideal short circuits.
RCF·Δx LCF·Δx
RLC·Δx LLC·Δx
M·ΔxC·Δx/2 C·Δx/2
RCF·Δx LCF·Δx
M·ΔxC·Δx/2 C·Δx/2
CFC laminate
Down
conductor
CFC laminate
Figure 5-7 Single 5-meter section of Model 3, consisting of the resistance and inductance of the lightning conductor
and carbon fiber laminate, and their inductive and capacitive coupling .
CFC laminate – conductor connections
R60
60 m
R50 R0
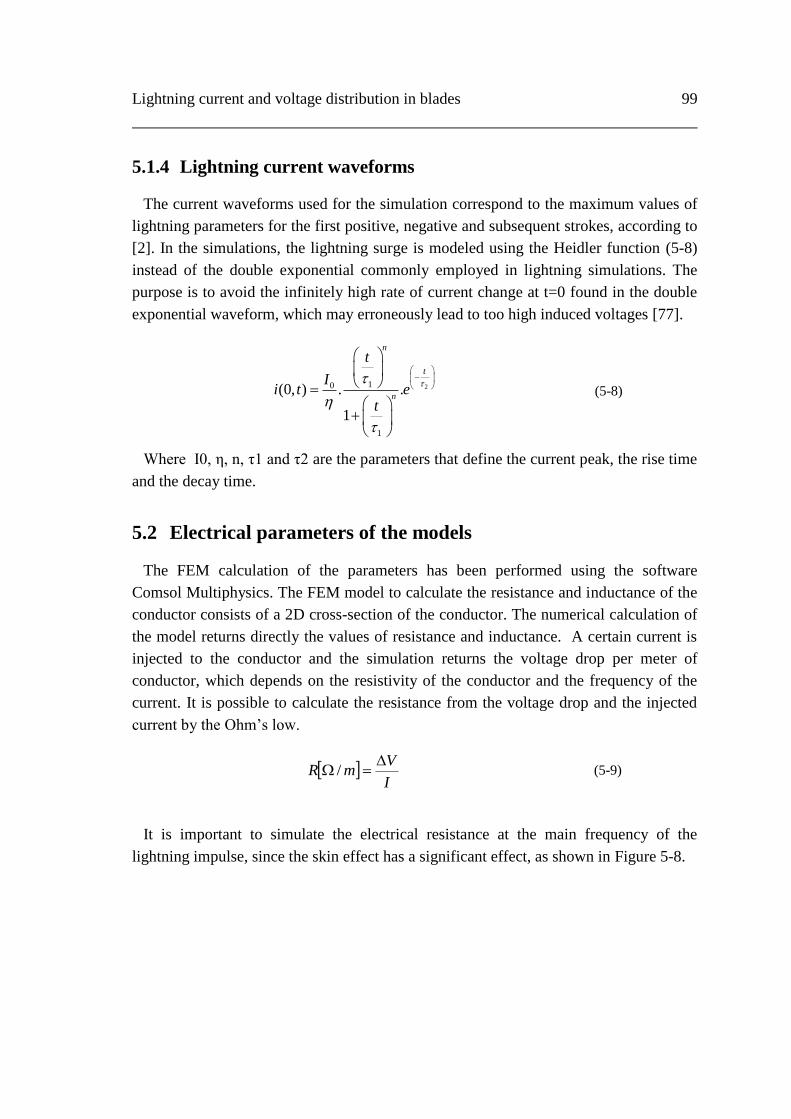
Lightning current and voltage distribution in blades 99
5.1.4 Lightning current waveforms
The current waveforms used for the simulation correspond to the maximum values of
lightning parameters for the first positive, negative and subsequent strokes, according to
[2]. In the simulations, the lightning surge is modeled using the Heidler function (5-8)
instead of the double exponential commonly employed in lightning simulations. The
purpose is to avoid the infinitely high rate of current change at t=0 found in the double
exponential waveform, which may erroneously lead to too high induced voltages [77].
210
1
(0, ) . .
1
n
t
n
t
Ii t e
t
(5-8)
Where I0, η, n, τ1 and τ2 are the parameters that define the current peak, the rise time
and the decay time.
5.2 Electrical parameters of the models
The FEM calculation of the parameters has been performed using the software
Comsol Multiphysics. The FEM model to calculate the resistance and inductance of the
conductor consists of a 2D cross-section of the conductor. The numerical calculation of
the model returns directly the values of resistance and inductance. A certain current is
injected to the conductor and the simulation returns the voltage drop per meter of
conductor, which depends on the resistivity of the conductor and the frequency of the
current. It is possible to calculate the resistance from the voltage drop and the injected
current by the Ohm’s low.
I
VmR
/ (5-9)
It is important to simulate the electrical resistance at the main frequency of the
lightning impulse, since the skin effect has a significant effect, as shown in Figure 5-8.
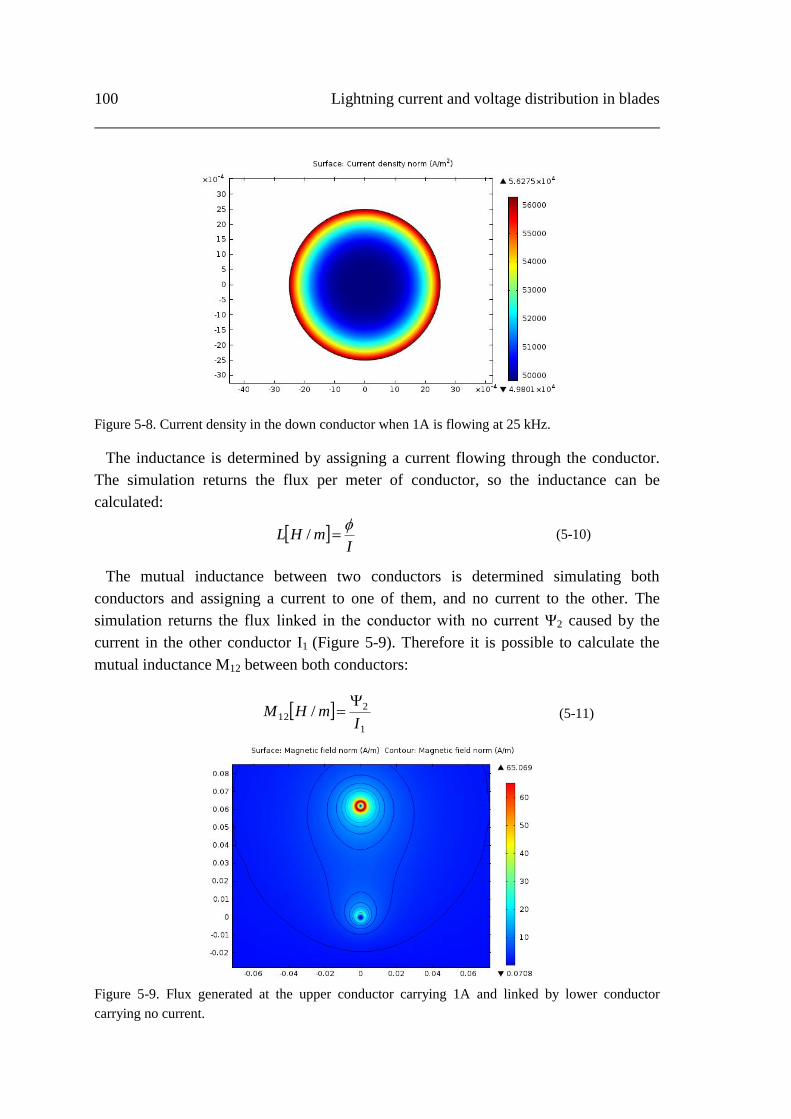
100 Lightning current and voltage distribution in blades
Figure 5-8. Current density in the down conductor when 1A is flowing at 25 kHz.
The inductance is determined by assigning a current flowing through the conductor.
The simulation returns the flux per meter of conductor, so the inductance can be
calculated:
I
mHL
/ (5-10)
The mutual inductance between two conductors is determined simulating both
conductors and assigning a current to one of them, and no current to the other. The
simulation returns the flux linked in the conductor with no current Ψ2 caused by the
current in the other conductor I1 (Figure 5-9). Therefore it is possible to calculate the
mutual inductance M12 between both conductors:
1
212 /
ImHM
(5-11)
Figure 5-9. Flux generated at the upper conductor carrying 1A and linked by lower conductor
carrying no current.
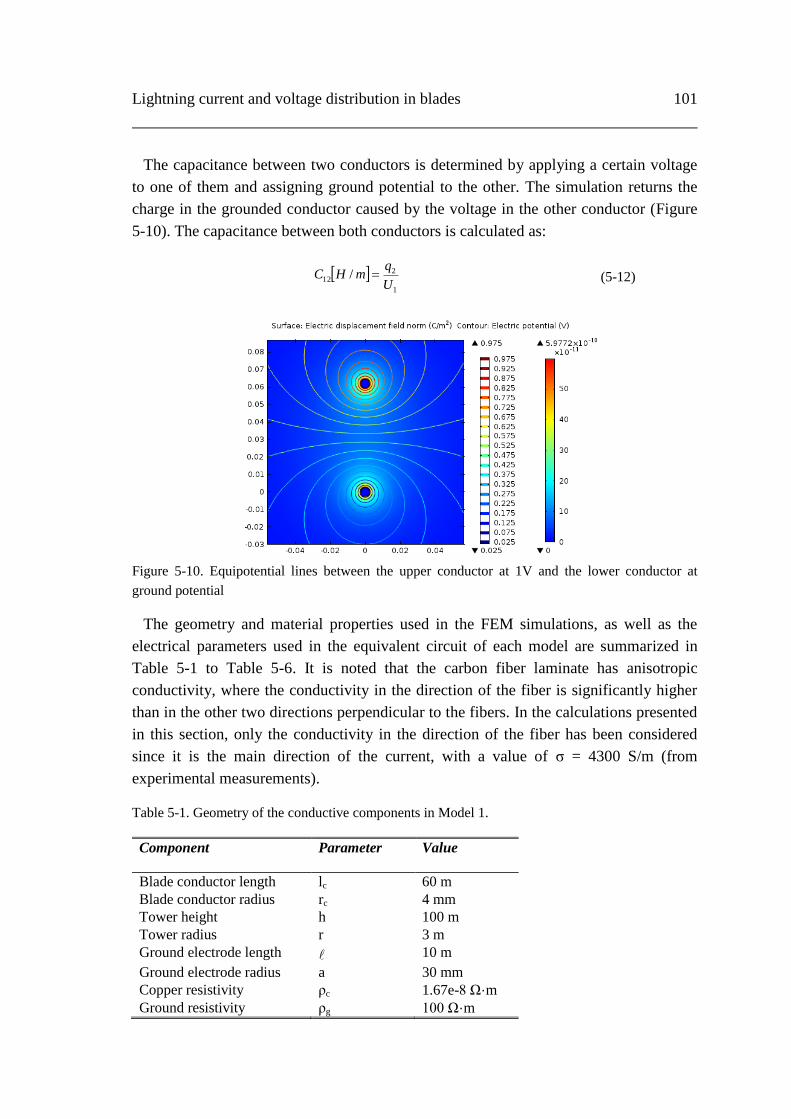
Lightning current and voltage distribution in blades 101
The capacitance between two conductors is determined by applying a certain voltage
to one of them and assigning ground potential to the other. The simulation returns the
charge in the grounded conductor caused by the voltage in the other conductor (Figure
5-10). The capacitance between both conductors is calculated as:
1
212 /
U
qmHC (5-12)
Figure 5-10. Equipotential lines between the upper conductor at 1V and the lower conductor at
ground potential
The geometry and material properties used in the FEM simulations, as well as the
electrical parameters used in the equivalent circuit of each model are summarized in
Table 5-1 to Table 5-6. It is noted that the carbon fiber laminate has anisotropic
conductivity, where the conductivity in the direction of the fiber is significantly higher
than in the other two directions perpendicular to the fibers. In the calculations presented
in this section, only the conductivity in the direction of the fiber has been considered
since it is the main direction of the current, with a value of σ = 4300 S/m (from
experimental measurements).
Table 5-1. Geometry of the conductive components in Model 1.
Component Parameter Value
Blade conductor length lc 60 m
Blade conductor radius rc 4 mm
Tower height h 100 m
Tower radius r 3 m
Ground electrode length 10 m
Ground electrode radius a 30 mm
Copper resistivity ρc 1.67e-8 Ω·m
Ground resistivity ρg 100 Ω·m
102 Lightning current and voltage distribution in blades
Table 5-2. Electrical parameters of Model 1.
Parameter Value
RLC 25kHz 1.73 mΩ/m
RLC 250kHz 5.44 mΩ/m
RLC 1MHz 11.4 mΩ/m
LLC 1.55 µH/m
Cg 7.21 pF/m
ZLC 463.66 Ω
Ztower 152.78 Ω
Rtower 0.028 mΩ/m
Zground 63.93 Ω
Rground 0.98 Ω/m
Table 5-3. Geometry of the conductive components in Model 2.
Component Parameter Value
Blade conductor length lc 60 m
Blade conductor radius rc 4 mm
Blade electrical wire length lw 60 m
Blade electrical wire radius rw 1 mm
Distance conductor-wire at tip of the blade dtip 0.2 m
Distance conductor-wire at root of the blade droot 1.5 m
Copper resistivity ρc 1.67e-8 Ω·m
Table 5-4. Electrical parameters of Model 2.
Parameter Value
RLC 25kHz 1.73 mΩ/m
RLC 250kHz 5.44 mΩ/m
RLC 1MHz 11.4 mΩ/m
LLC 1.55 µH/m
Cg 7.21 pF/m
RW 25kHz 7.95 mΩ/m
RW 250kHz 22.2 mΩ/m
RW 1MHz 43.0 mΩ/m
LW 1.85 µH/m
M at dtip 0.78 µH/m
M at droot 0.38 µH/m
C at dtip 3.94 pF/m
C at droot 1.60 pF/m
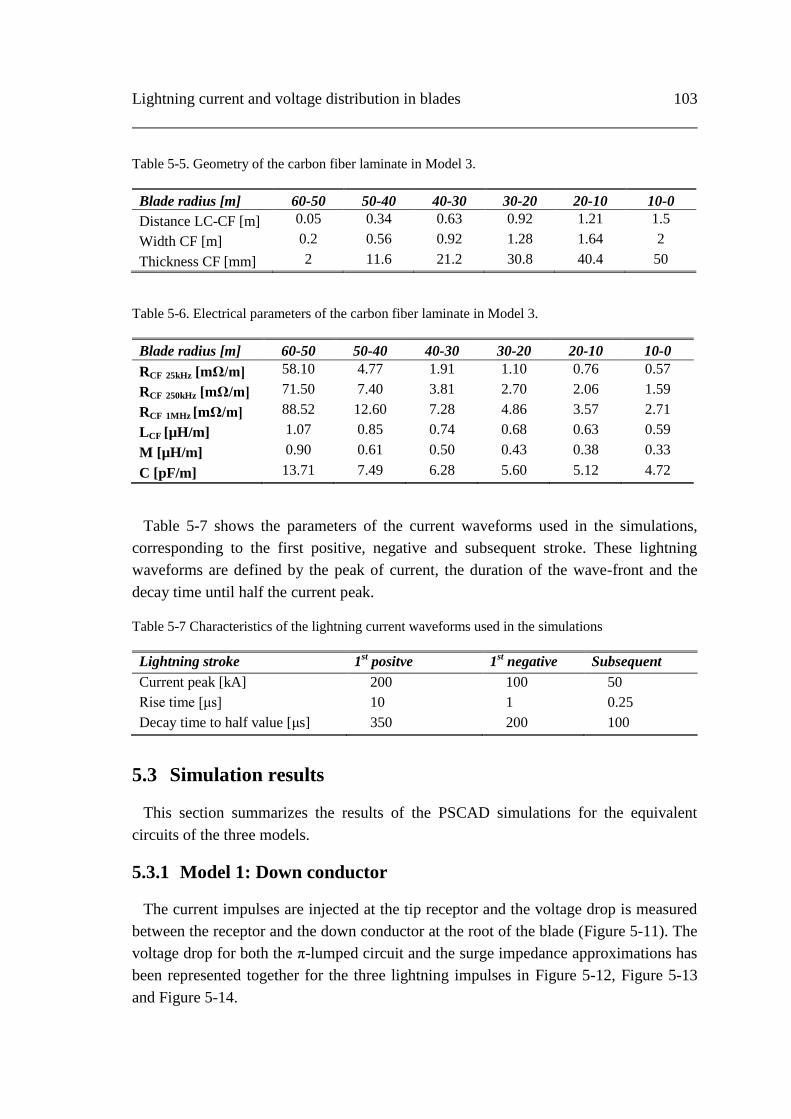
Lightning current and voltage distribution in blades 103
Table 5-5. Geometry of the carbon fiber laminate in Model 3.
Blade radius [m] 60-50 50-40 40-30 30-20 20-10 10-0
Distance LC-CF [m] 0.05 0.34 0.63 0.92 1.21 1.5
Width CF [m] 0.2 0.56 0.92 1.28 1.64 2
Thickness CF [mm] 2 11.6 21.2 30.8 40.4 50
Table 5-6. Electrical parameters of the carbon fiber laminate in Model 3.
Blade radius [m] 60-50 50-40 40-30 30-20 20-10 10-0
RCF 25kHz [mΩ/m] 58.10 4.77 1.91 1.10 0.76 0.57
RCF 250kHz [mΩ/m] 71.50 7.40 3.81 2.70 2.06 1.59
RCF 1MHz [mΩ/m] 88.52 12.60 7.28 4.86 3.57 2.71
LCF [µH/m] 1.07 0.85 0.74 0.68 0.63 0.59
M [µH/m] 0.90 0.61 0.50 0.43 0.38 0.33
C [pF/m] 13.71 7.49 6.28 5.60 5.12 4.72
Table 5-7 shows the parameters of the current waveforms used in the simulations,
corresponding to the first positive, negative and subsequent stroke. These lightning
waveforms are defined by the peak of current, the duration of the wave-front and the
decay time until half the current peak.
Table 5-7 Characteristics of the lightning current waveforms used in the simulations
Lightning stroke 1st positve 1
st negative Subsequent
Current peak [kA] 200 100 50
Rise time [μs] 10 1 0.25
Decay time to half value [μs] 350 200 100
5.3 Simulation results
This section summarizes the results of the PSCAD simulations for the equivalent
circuits of the three models.
5.3.1 Model 1: Down conductor
The current impulses are injected at the tip receptor and the voltage drop is measured
between the receptor and the down conductor at the root of the blade (Figure 5-11). The
voltage drop for both the π-lumped circuit and the surge impedance approximations has
been represented together for the three lightning impulses in Figure 5-12, Figure 5-13
and Figure 5-14.
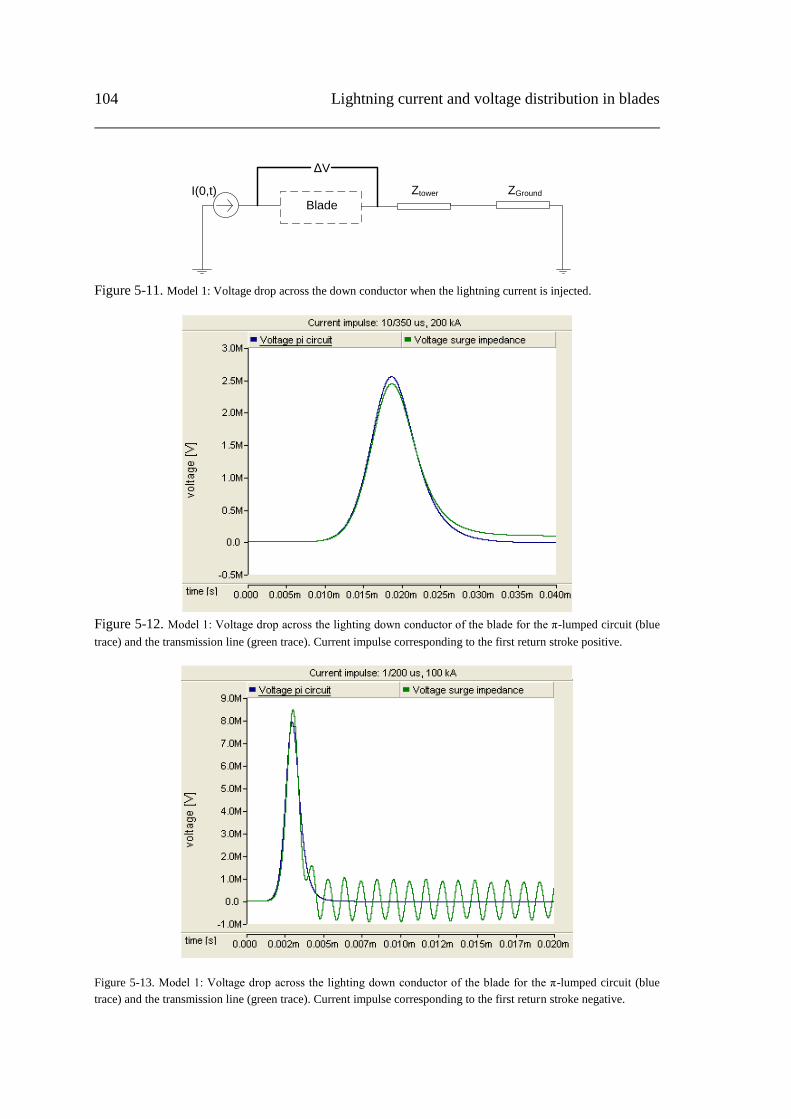
104 Lightning current and voltage distribution in blades
ΔV
ZtowerI(0,t) ZGround
Blade
Figure 5-11. Model 1: Voltage drop across the down conductor when the lightning current is injected.
Figure 5-12. Model 1: Voltage drop across the lighting down conductor of the blade for the π-lumped circuit (blue
trace) and the transmission line (green trace). Current impulse corresponding to the first return stroke positive.
Figure 5-13. Model 1: Voltage drop across the lighting down conductor of the blade for the π-lumped circuit (blue
trace) and the transmission line (green trace). Current impulse corresponding to the first return stroke negative.
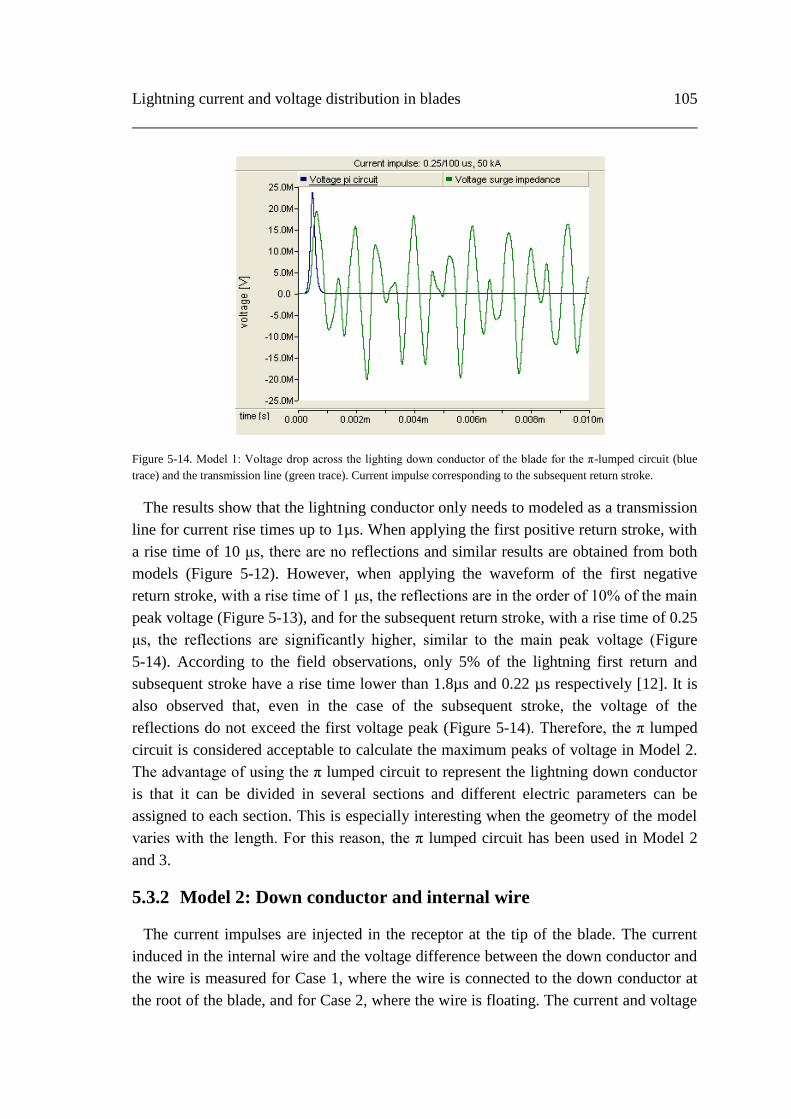
Lightning current and voltage distribution in blades 105
Figure 5-14. Model 1: Voltage drop across the lighting down conductor of the blade for the π-lumped circuit (blue
trace) and the transmission line (green trace). Current impulse corresponding to the subsequent return stroke.
The results show that the lightning conductor only needs to modeled as a transmission
line for current rise times up to 1µs. When applying the first positive return stroke, with
a rise time of 10 μs, there are no reflections and similar results are obtained from both
models (Figure 5-12). However, when applying the waveform of the first negative
return stroke, with a rise time of 1 μs, the reflections are in the order of 10% of the main
peak voltage (Figure 5-13), and for the subsequent return stroke, with a rise time of 0.25
μs, the reflections are significantly higher, similar to the main peak voltage (Figure
5-14). According to the field observations, only 5% of the lightning first return and
subsequent stroke have a rise time lower than 1.8µs and 0.22 µs respectively [12]. It is
also observed that, even in the case of the subsequent stroke, the voltage of the
reflections do not exceed the first voltage peak (Figure 5-14). Therefore, the π lumped
circuit is considered acceptable to calculate the maximum peaks of voltage in Model 2.
The advantage of using the π lumped circuit to represent the lightning down conductor
is that it can be divided in several sections and different electric parameters can be
assigned to each section. This is especially interesting when the geometry of the model
varies with the length. For this reason, the π lumped circuit has been used in Model 2
and 3.
5.3.2 Model 2: Down conductor and internal wire
The current impulses are injected in the receptor at the tip of the blade. The current
induced in the internal wire and the voltage difference between the down conductor and
the wire is measured for Case 1, where the wire is connected to the down conductor at
the root of the blade, and for Case 2, where the wire is floating. The current and voltage
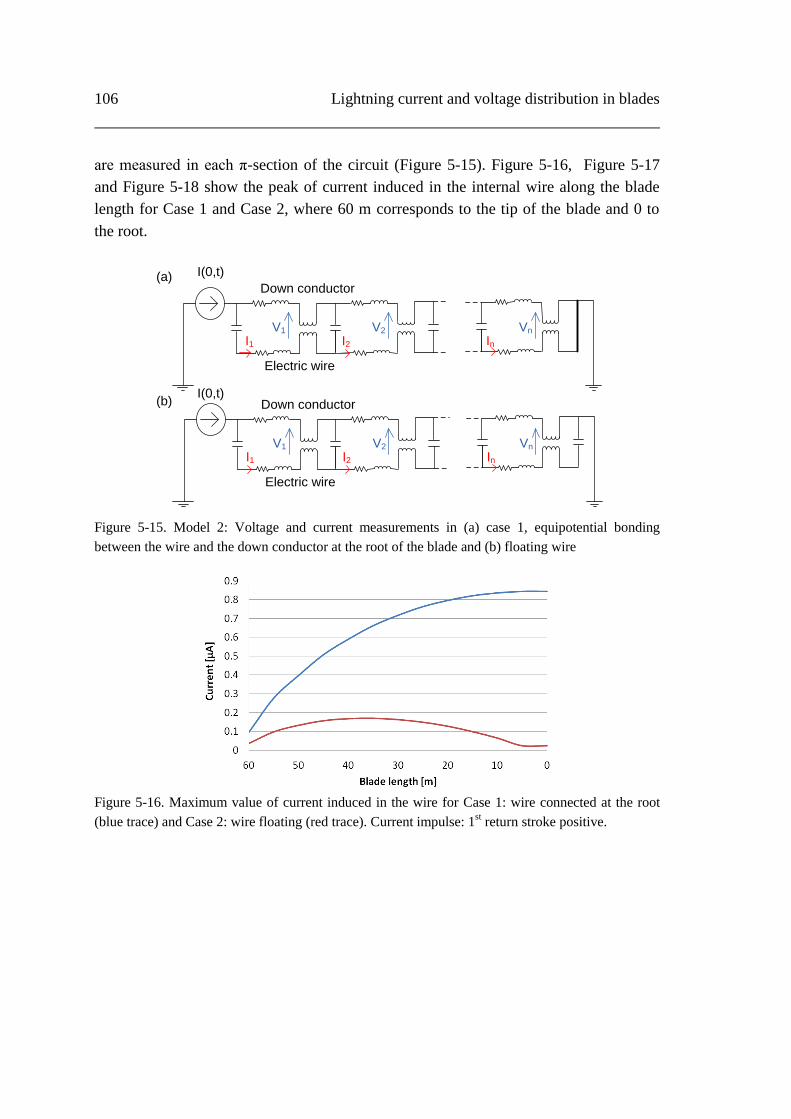
106 Lightning current and voltage distribution in blades
are measured in each π-section of the circuit (Figure 5-15). Figure 5-16, Figure 5-17
and Figure 5-18 show the peak of current induced in the internal wire along the blade
length for Case 1 and Case 2, where 60 m corresponds to the tip of the blade and 0 to
the root.
I(0,t)
Down conductor
Electric wire
I1 I2 In
V1 V2 Vn
I(0,t)Down conductor
Electric wire
I1 I2 In
V1 V2 Vn
(a)
(b)
Figure 5-15. Model 2: Voltage and current measurements in (a) case 1, equipotential bonding
between the wire and the down conductor at the root of the blade and (b) floating wire
Figure 5-16. Maximum value of current induced in the wire for Case 1: wire connected at the root
(blue trace) and Case 2: wire floating (red trace). Current impulse: 1st return stroke positive.
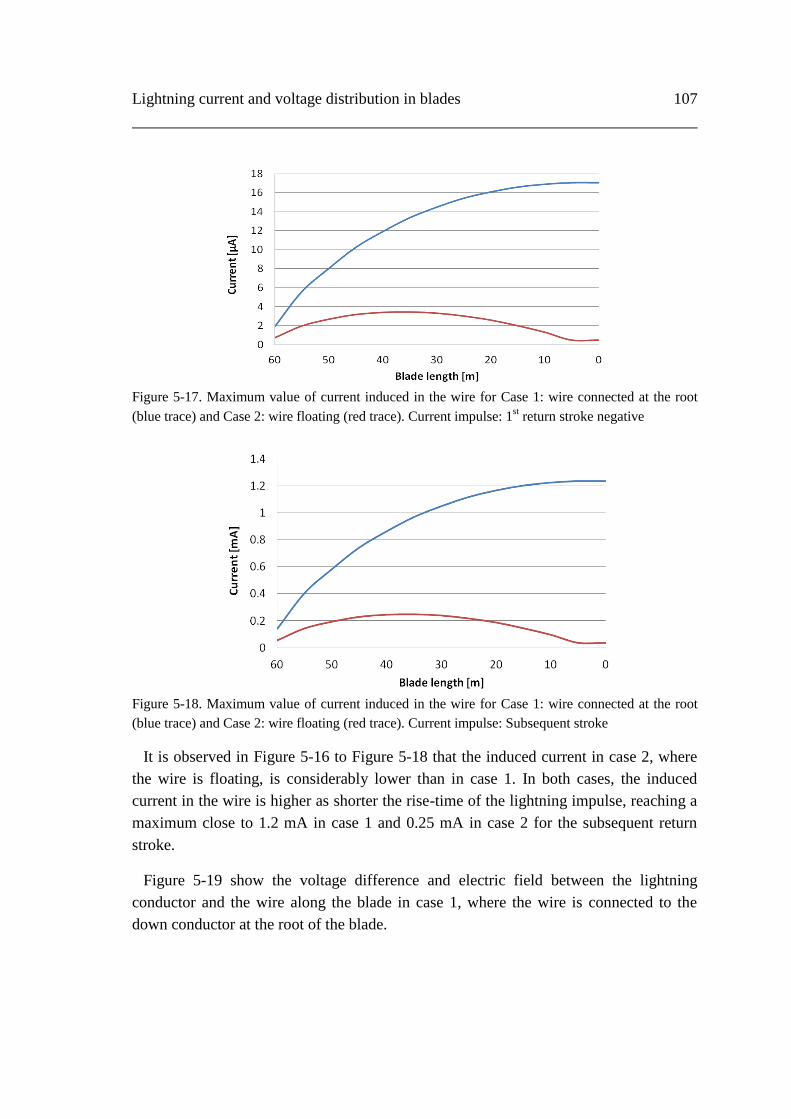
Lightning current and voltage distribution in blades 107
Figure 5-17. Maximum value of current induced in the wire for Case 1: wire connected at the root
(blue trace) and Case 2: wire floating (red trace). Current impulse: 1st return stroke negative
Figure 5-18. Maximum value of current induced in the wire for Case 1: wire connected at the root
(blue trace) and Case 2: wire floating (red trace). Current impulse: Subsequent stroke
It is observed in Figure 5-16 to Figure 5-18 that the induced current in case 2, where
the wire is floating, is considerably lower than in case 1. In both cases, the induced
current in the wire is higher as shorter the rise-time of the lightning impulse, reaching a
maximum close to 1.2 mA in case 1 and 0.25 mA in case 2 for the subsequent return
stroke.
Figure 5-19 show the voltage difference and electric field between the lightning
conductor and the wire along the blade in case 1, where the wire is connected to the
down conductor at the root of the blade.
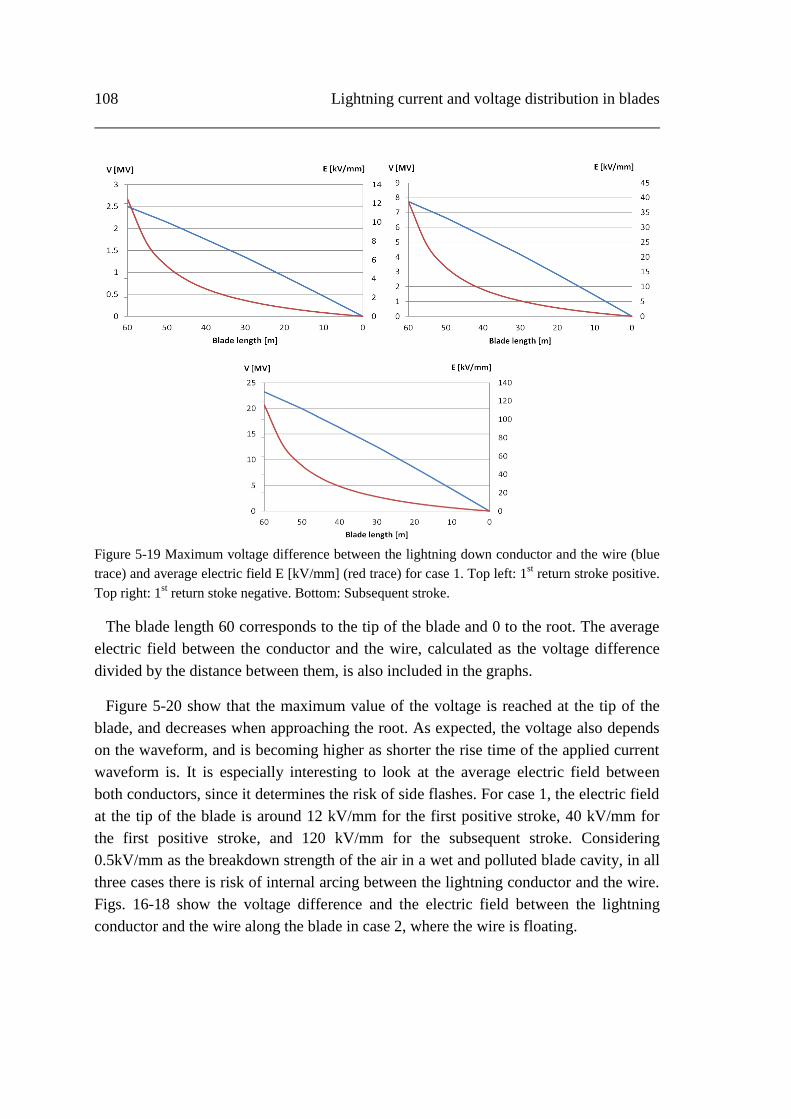
108 Lightning current and voltage distribution in blades
Figure 5-19 Maximum voltage difference between the lightning down conductor and the wire (blue
trace) and average electric field E [kV/mm] (red trace) for case 1. Top left: 1st return stroke positive.
Top right: 1st return stoke negative. Bottom: Subsequent stroke.
The blade length 60 corresponds to the tip of the blade and 0 to the root. The average
electric field between the conductor and the wire, calculated as the voltage difference
divided by the distance between them, is also included in the graphs.
Figure 5-20 show that the maximum value of the voltage is reached at the tip of the
blade, and decreases when approaching the root. As expected, the voltage also depends
on the waveform, and is becoming higher as shorter the rise time of the applied current
waveform is. It is especially interesting to look at the average electric field between
both conductors, since it determines the risk of side flashes. For case 1, the electric field
at the tip of the blade is around 12 kV/mm for the first positive stroke, 40 kV/mm for
the first positive stroke, and 120 kV/mm for the subsequent stroke. Considering
0.5kV/mm as the breakdown strength of the air in a wet and polluted blade cavity, in all
three cases there is risk of internal arcing between the lightning conductor and the wire.
Figs. 16-18 show the voltage difference and the electric field between the lightning
conductor and the wire along the blade in case 2, where the wire is floating.

Lightning current and voltage distribution in blades 109
Figure 5-20 Maximum voltage difference between the lightning down conductor and the wire (blue
trace) and average electric field E [kV/mm] (red trace) for case 2. Top left: 1st return stroke positive.
Top right: 1st return stoke negative. Bottom: Subsequent stroke.
It is observed that the voltage difference between conductors in case 2 is lower than in
case 1 and that it changes polarity in the middle of the blade. Due to this change of
polarity, the electric field between conductors is lower than in case 1. However, the
electric field at the tip of the blade is around 5 kV/mm, 16 kV/mm and 50 kV/mm for
the positive, negative and subsequent stroke respectively. Therefore, in all three cases
there is still risk of internal arcing between the lightning conductor and the wire.
5.3.3 Model 3: Down conductor and carbon fiber laminate
The current impulses are injected in the receptor at the tip of the blade. In case 1,
where there is only one connection between the down conductor and the CFC laminate,
almost the totality of the current impulse flows through the down conductor. In case 2
and 3, the current is distributed between the CFC laminate and the down conductor
(Figure 5-21). Since both caps are considered symmetrical, the current has been
measured only in one cap. Figure 5-22 to Figure 5-22Figure 5-23 show the voltage
difference and electric field between the lightning conductor and the wire along the
blade for the three cases.
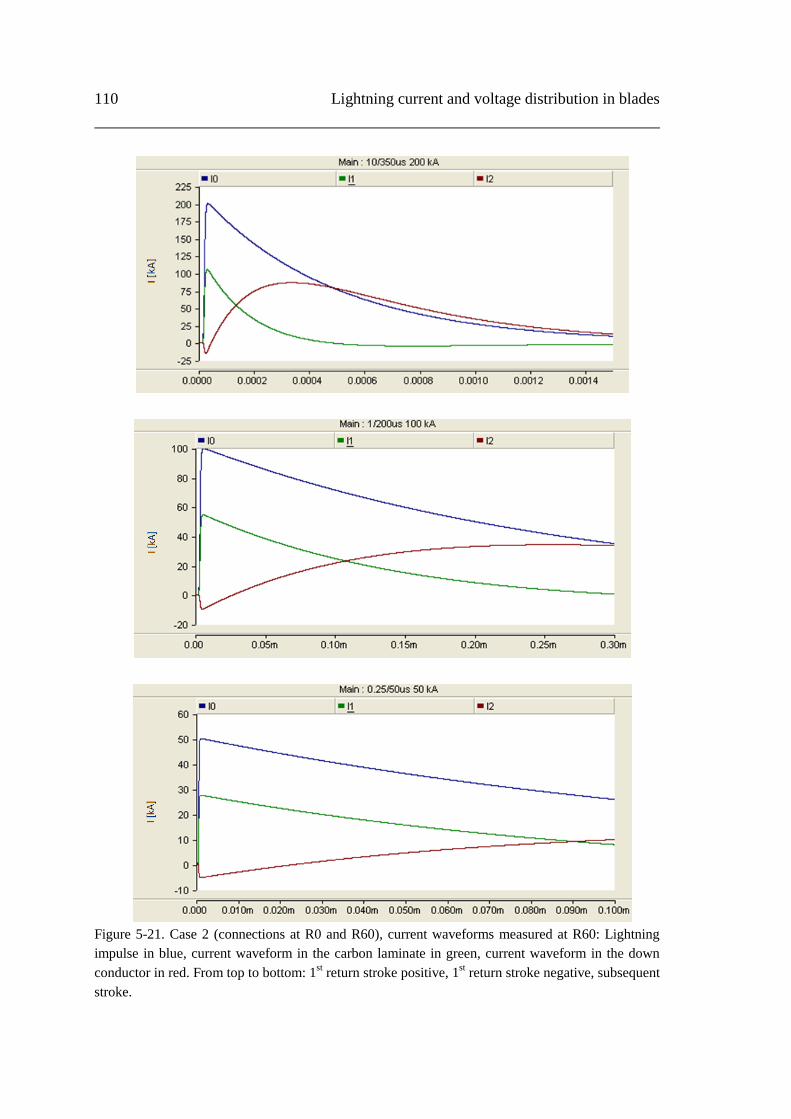
110 Lightning current and voltage distribution in blades
Figure 5-21. Case 2 (connections at R0 and R60), current waveforms measured at R60: Lightning
impulse in blue, current waveform in the carbon laminate in green, current waveform in the down
conductor in red. From top to bottom: 1st return stroke positive, 1
st return stroke negative, subsequent
stroke.
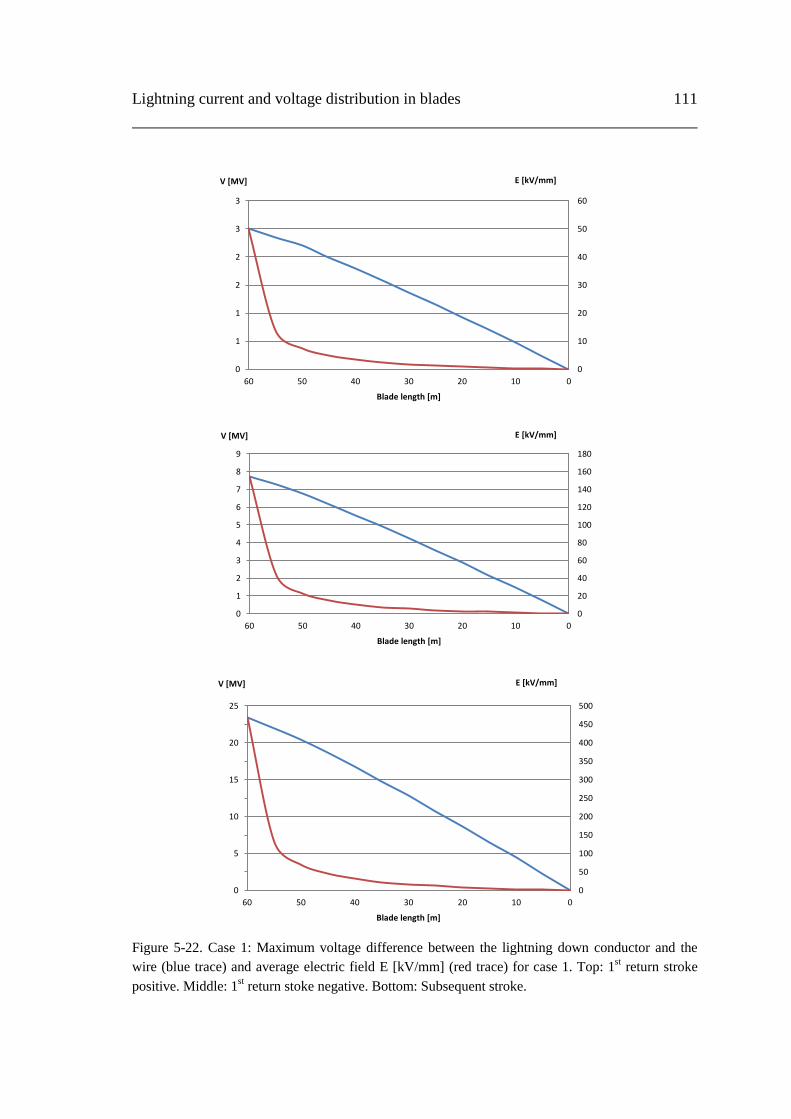
Lightning current and voltage distribution in blades 111
Figure 5-22. Case 1: Maximum voltage difference between the lightning down conductor and the
wire (blue trace) and average electric field E [kV/mm] (red trace) for case 1. Top: 1st return stroke
positive. Middle: 1st return stoke negative. Bottom: Subsequent stroke.
0
10
20
30
40
50
60
0
1
1
2
2
3
3
0102030405060
E [kV/mm] V [MV]
Blade length [m]
0
20
40
60
80
100
120
140
160
180
0
1
2
3
4
5
6
7
8
9
0102030405060
E [kV/mm] V [MV]
Blade length [m]
0
50
100
150
200
250
300
350
400
450
500
0
5
10
15
20
25
0102030405060
E [kV/mm] V [MV]
Blade length [m]

112 Lightning current and voltage distribution in blades
Figure 5-23. Case 2: Maximum voltage difference between the lightning down conductor and the
wire (blue trace) and average electric field E [kV/mm] (red trace) for case 1. Top: 1st return stroke
positive. Middle: 1st return stoke negative. Bottom: Subsequent stroke.
0
0,02
0,04
0,06
0,08
0,1
0,12
0,14
0,16
0,18
0,2
0
10
20
30
40
50
60
70
80
0102030405060
E [kV/mm] V [kV]
Blade length [m]
0
0,1
0,2
0,3
0,4
0,5
0,6
0,7
0,8
0,9
0
50
100
150
200
250
300
0102030405060
E [kV/mm] V [kV]
Blade length [m]
0
0,5
1
1,5
2
2,5
3
0
100
200
300
400
500
600
700
800
900
1000
0102030405060
E [kV/mm] V [kV]
Blade length [m]
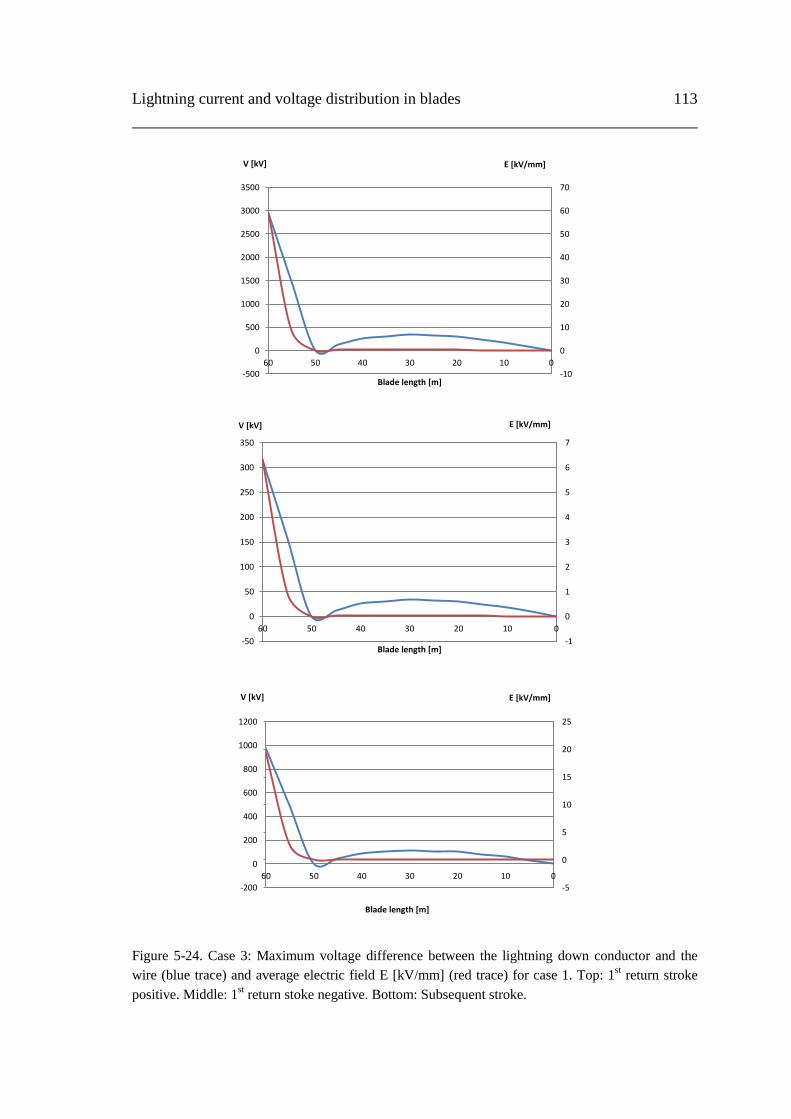
Lightning current and voltage distribution in blades 113
Figure 5-24. Case 3: Maximum voltage difference between the lightning down conductor and the
wire (blue trace) and average electric field E [kV/mm] (red trace) for case 1. Top: 1st return stroke
positive. Middle: 1st return stoke negative. Bottom: Subsequent stroke.
-10
0
10
20
30
40
50
60
70
-500
0
500
1000
1500
2000
2500
3000
3500
0102030405060
E [kV/mm] V [kV]
Blade length [m]
-1
0
1
2
3
4
5
6
7
-50
0
50
100
150
200
250
300
350
0102030405060
E [kV/mm] V [kV]
Blade length [m]
-5
0
5
10
15
20
25
-200
0
200
400
600
800
1000
1200
0102030405060
E [kV/mm] V [kV]
Blade length [m]

114 Lightning current and voltage distribution in blades
5.4 Discussion
The simulations of Model 1 reveal that voltage reflections are only significant when
the applied current waveform has a rise time less than 1 µs. The probability of a natural
lightning with such a fast rise time is low and the maximum voltage level of the
reflections in the worst case does not exceed the first voltage peak. Therefore, the π-
lumped approximation is considered acceptable for the simulation of the blade
conductors, in order to determine the maximum peaks of voltage.
In Model 2, the electric field between conductors generated by the current impulses
exceeds the breakdown strength of the air in all cases. Therefore insulation should be
provided all along the conductors. Considering that the fiberglass has a dielectric
strength around 20kV/mm [19], installing the cable in opposite sides of the blade
structural webs would be a possible solution to avoid flashover. It is also observed that
the rise time of the applied current waveform has a strong influence both on the induced
current and the voltage difference between conductors due to their inductive coupling.
In this sense, the subsequent return stroke could be regarded as the most dangerous
regarding internal arcing, even with a current peak lower than the first return stroke.
However, the voltages in the wire induced by the subsequent return stroke have an
approximate duration of 0.1 µs. The electric breakdown depends both on the voltage
level and the duration of the impulse, therefore it has to be studied if this extremely fast
voltage peak may generate flashover between the two conductors.
Comparing the results of Model 2 case 1 and 2, it is observed that both the induced
current and the voltage differences are significantly lower when the electronic device is
floating. However, in case of high current flowing along the wire due to direct lightning
strike or side flashes from the lightning cable, the current may be transmitted to the
electronic device causing severe damage. This situation is prevented in case 1, where
the current would be derived to the lightning protection system before reaching the
electronic device. An intermediate solution to keep the wire floating but being able to
derive the high current from the wire to the down conductor could be to replace the
equipotential connection with a surge arrester.
In Model 3 case 1, where the CFC laminate is connected to the down conductor only
in the root of the blade, the current flowing through the carbon fiber laminate is very
low, reaching a highest peak of tens of mA. This may be seen as an advantage since the
CF laminate is a relatively poor conductor, and a high current density heats up the resin
of the laminate and affect the mechanical properties of the structure. However, the
electric field reaches high values in the tip of the blade, with a peak of 450 kV/mm for
the subsequent stroke impulse. Therefore connecting the laminate only at the root of the
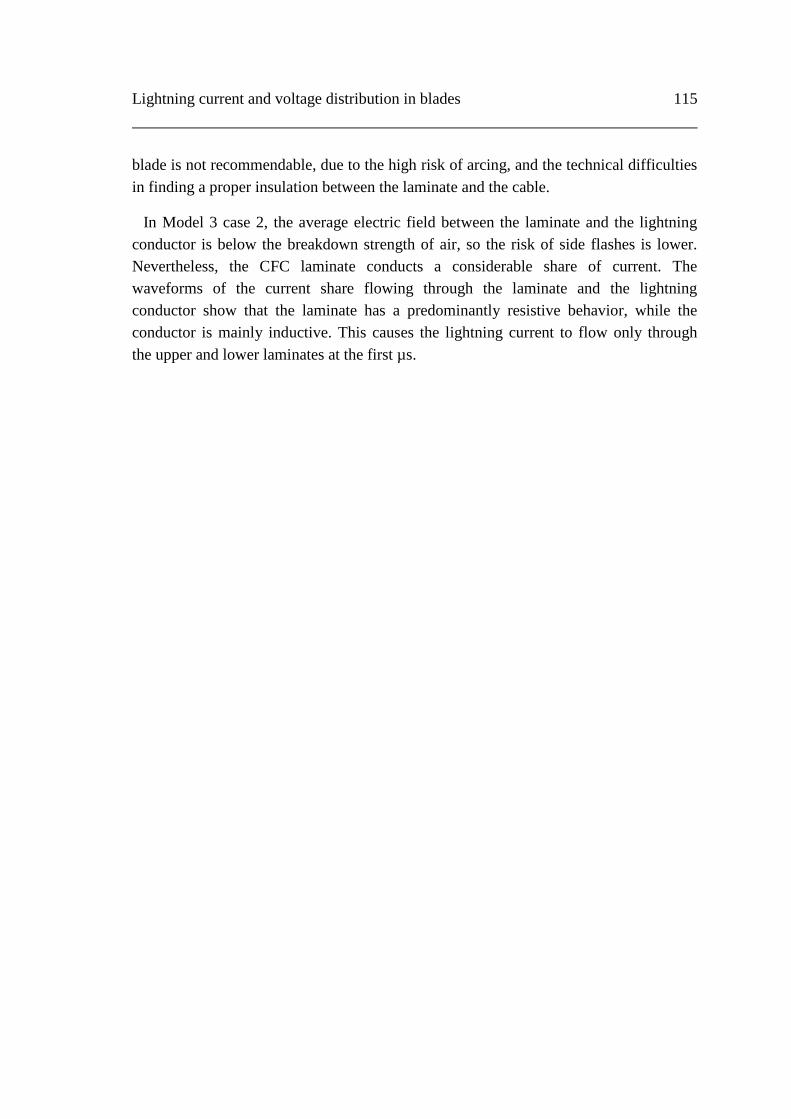
Lightning current and voltage distribution in blades 115
blade is not recommendable, due to the high risk of arcing, and the technical difficulties
in finding a proper insulation between the laminate and the cable.
In Model 3 case 2, the average electric field between the laminate and the lightning
conductor is below the breakdown strength of air, so the risk of side flashes is lower.
Nevertheless, the CFC laminate conducts a considerable share of current. The
waveforms of the current share flowing through the laminate and the lightning
conductor show that the laminate has a predominantly resistive behavior, while the
conductor is mainly inductive. This causes the lightning current to flow only through
the upper and lower laminates at the first µs.

116 Lightning current and voltage distribution in blades

Chapter 6
Degradation of rubber materials exposed to high
electric fields
As found in the preceding chapters, lightning protection of WT blades requires careful
consideration of the lightning environment, and the blade design and materials. All the
exposure treated so far considers the effect from the lightning discharges occurring
frequently to wind turbines, but still presenting individual short term impacts. During
special weather conditions and particularly during thunderstorms, the turbine will be
affected by a static electric field, becoming time varying in the case of the blades due to
the rotation of the turbine rotor. The materials involved in manufacturing of the blade
performance optimization components (rubber for the active trailing edge) will be
affected by this static or slowly time varying field, as discussed in this section. The
consequent streamer activity may degrade prematurely the construction parts.
Therefore, the behavior of the blade materials under heavy exposure to electric fields
and electrical discharges become important to assess.
The IEC standard on lightning protection of wind turbines [2] defines the tests to be
performed in wind turbines to reproduce the effects of direct lightning strike. However,
there is a need for tests aimed at assessing the effects of repeated high electric field and
discharge exposure on the insulating materials of the blade. Madsen [19] carried out a
thorough investigation of the degradation of fiberglass materials used in wind turbine
blades by performing breakdown and tracking resistance tests on small samples. The
purpose of the tests was to affect the materials in a similar way as it had been observed
on blades in operation.

118 Degradation of rubber materials exposed to high electric fields
In this chapter, the degradation of the rubber material due to corona and streamer
formation on the tip of the blade has been investigated by performing breakdown and
tracking resistance tests similarly to [19]. The results of the tests on rubber materials are
compared to the results of the tests on fiberglass performed by Madsen in order to
assess the capability of rubber materials to withstand the electric stress caused by
lightning on the blades. The experiments described in this section are published in [78]
and [79].
6.1 Materials description
Four different rubber materials are used for both the breakdown and the tracking
resistance tests. These materials are a representative selection of different types of
rubber:
Santoprene 121-73W175 (Polyolefin elastomer). It is a thermoplastic vulcanized
polymer, in the family of thermoplastic elastomers, suitable for controllable flaps
applications due to its good properties in fatigue and UV resistance. According to
the manufacturer, the dielectric strength of the material is 30 kV/mm, tests at power
frequency based on ASTM D149 [80] with sample thickness of 2.03mm.
Silicone rubber 5060-5
Polyurethane PUR 8070-3
Ethylene Propylene Diene monomer EPDM 2165-1 (M-class)
The specimens used for this test are square shaped, with a side length of 100 mm.
Each material has been tested with a thickness of 1, 2, 3 and 4 mm.
6.2 Tests description
This section describes the tests procedure and evaluation for breakdown strength tests
and tracking resistance tests, according to the IEC standards [81], [82] and [58].
6.2.1 Breakdown strength tests
The sample is placed between two electrodes inside a container filled with silicone oil
(Figure 6-1). The upper electrode is spherical, with a diameter of 12.5 mm, and it is
connected to the high impulse voltage generator. The lower electrode is cylindrical with
rounded edges, with a diameter of 70 mm, and is connected to ground. The purpose of
the silicone oil is to increase the electrical breakdown of the media around the
specimen, in order to prevent side flashovers.
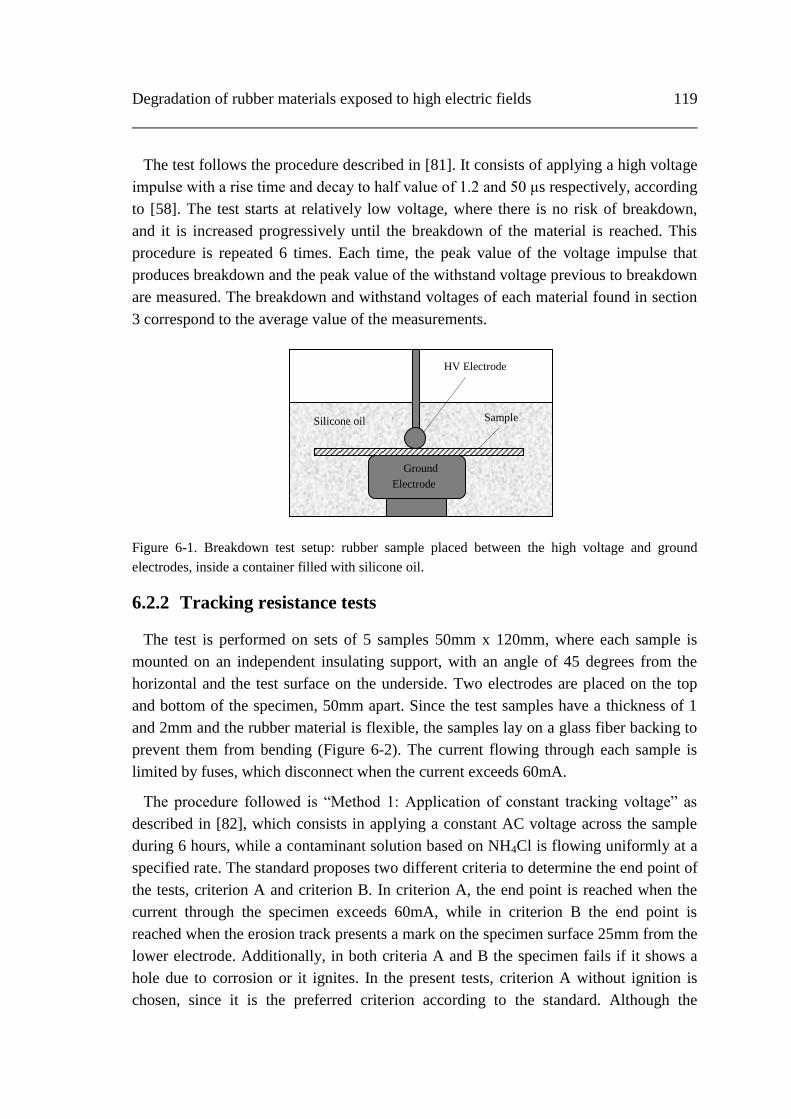
Degradation of rubber materials exposed to high electric fields 119
The test follows the procedure described in [81]. It consists of applying a high voltage
impulse with a rise time and decay to half value of 1.2 and 50 μs respectively, according
to [58]. The test starts at relatively low voltage, where there is no risk of breakdown,
and it is increased progressively until the breakdown of the material is reached. This
procedure is repeated 6 times. Each time, the peak value of the voltage impulse that
produces breakdown and the peak value of the withstand voltage previous to breakdown
are measured. The breakdown and withstand voltages of each material found in section
3 correspond to the average value of the measurements.
Figure 6-1. Breakdown test setup: rubber sample placed between the high voltage and ground
electrodes, inside a container filled with silicone oil.
6.2.2 Tracking resistance tests
The test is performed on sets of 5 samples 50mm x 120mm, where each sample is
mounted on an independent insulating support, with an angle of 45 degrees from the
horizontal and the test surface on the underside. Two electrodes are placed on the top
and bottom of the specimen, 50mm apart. Since the test samples have a thickness of 1
and 2mm and the rubber material is flexible, the samples lay on a glass fiber backing to
prevent them from bending (Figure 6-2). The current flowing through each sample is
limited by fuses, which disconnect when the current exceeds 60mA.
The procedure followed is “Method 1: Application of constant tracking voltage” as
described in [82], which consists in applying a constant AC voltage across the sample
during 6 hours, while a contaminant solution based on NH4Cl is flowing uniformly at a
specified rate. The standard proposes two different criteria to determine the end point of
the tests, criterion A and criterion B. In criterion A, the end point is reached when the
current through the specimen exceeds 60mA, while in criterion B the end point is
reached when the erosion track presents a mark on the specimen surface 25mm from the
lower electrode. Additionally, in both criteria A and B the specimen fails if it shows a
hole due to corrosion or it ignites. In the present tests, criterion A without ignition is
chosen, since it is the preferred criterion according to the standard. Although the
HV Electrode
Ground
Electrode
Sample Silicone oil
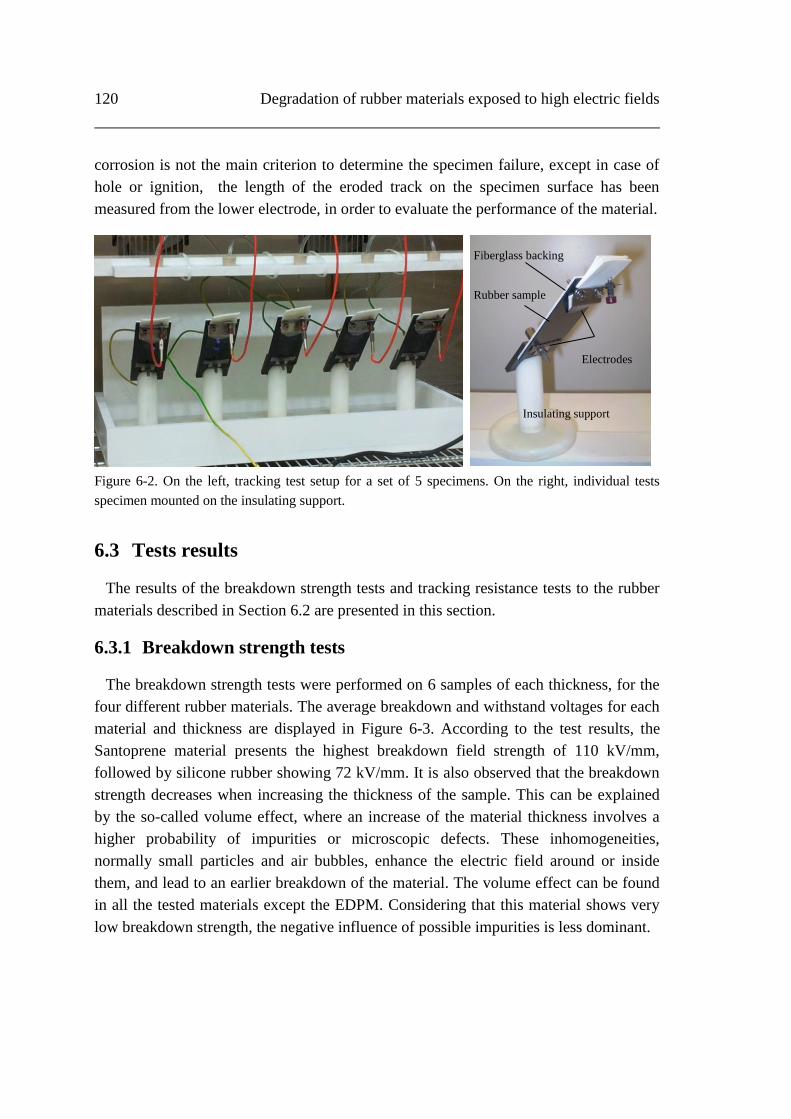
120 Degradation of rubber materials exposed to high electric fields
corrosion is not the main criterion to determine the specimen failure, except in case of
hole or ignition, the length of the eroded track on the specimen surface has been
measured from the lower electrode, in order to evaluate the performance of the material.
Figure 6-2. On the left, tracking test setup for a set of 5 specimens. On the right, individual tests
specimen mounted on the insulating support.
6.3 Tests results
The results of the breakdown strength tests and tracking resistance tests to the rubber
materials described in Section 6.2 are presented in this section.
6.3.1 Breakdown strength tests
The breakdown strength tests were performed on 6 samples of each thickness, for the
four different rubber materials. The average breakdown and withstand voltages for each
material and thickness are displayed in Figure 6-3. According to the test results, the
Santoprene material presents the highest breakdown field strength of 110 kV/mm,
followed by silicone rubber showing 72 kV/mm. It is also observed that the breakdown
strength decreases when increasing the thickness of the sample. This can be explained
by the so-called volume effect, where an increase of the material thickness involves a
higher probability of impurities or microscopic defects. These inhomogeneities,
normally small particles and air bubbles, enhance the electric field around or inside
them, and lead to an earlier breakdown of the material. The volume effect can be found
in all the tested materials except the EDPM. Considering that this material shows very
low breakdown strength, the negative influence of possible impurities is less dominant.
Fiberglass backing
Rubber sample
Electrodes
Insulating support
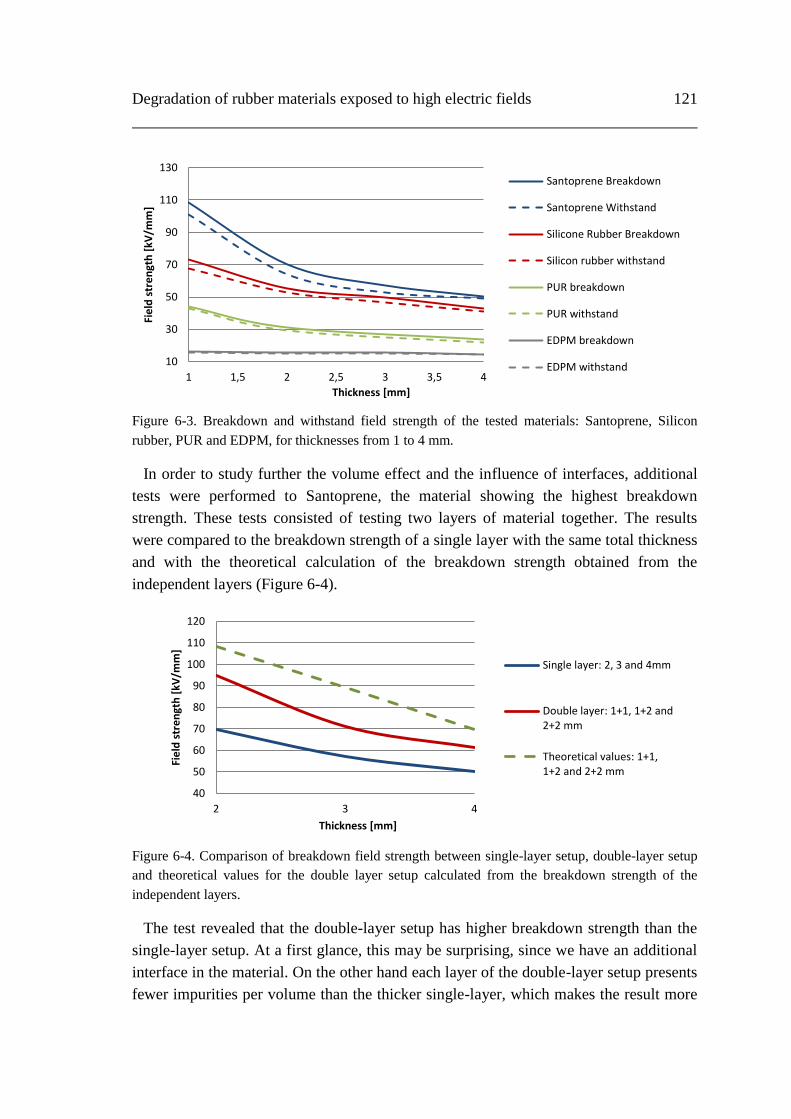
Degradation of rubber materials exposed to high electric fields 121
Figure 6-3. Breakdown and withstand field strength of the tested materials: Santoprene, Silicon
rubber, PUR and EDPM, for thicknesses from 1 to 4 mm.
In order to study further the volume effect and the influence of interfaces, additional
tests were performed to Santoprene, the material showing the highest breakdown
strength. These tests consisted of testing two layers of material together. The results
were compared to the breakdown strength of a single layer with the same total thickness
and with the theoretical calculation of the breakdown strength obtained from the
independent layers (Figure 6-4).
Figure 6-4. Comparison of breakdown field strength between single-layer setup, double-layer setup
and theoretical values for the double layer setup calculated from the breakdown strength of the
independent layers.
The test revealed that the double-layer setup has higher breakdown strength than the
single-layer setup. At a first glance, this may be surprising, since we have an additional
interface in the material. On the other hand each layer of the double-layer setup presents
fewer impurities per volume than the thicker single-layer, which makes the result more
10
30
50
70
90
110
130
1 1,5 2 2,5 3 3,5 4
Fie
ld s
tre
ngt
h [
kV/m
m]
Thickness [mm]
Santoprene Breakdown
Santoprene Withstand
Silicone Rubber Breakdown
Silicon rubber withstand
PUR breakdown
PUR withstand
EDPM breakdown
EDPM withstand
40
50
60
70
80
90
100
110
120
2 3 4
Fie
ld s
tre
ngt
h [
kV/m
m]
Thickness [mm]
Single layer: 2, 3 and 4mm
Double layer: 1+1, 1+2 and2+2 mm
Theoretical values: 1+1,1+2 and 2+2 mm
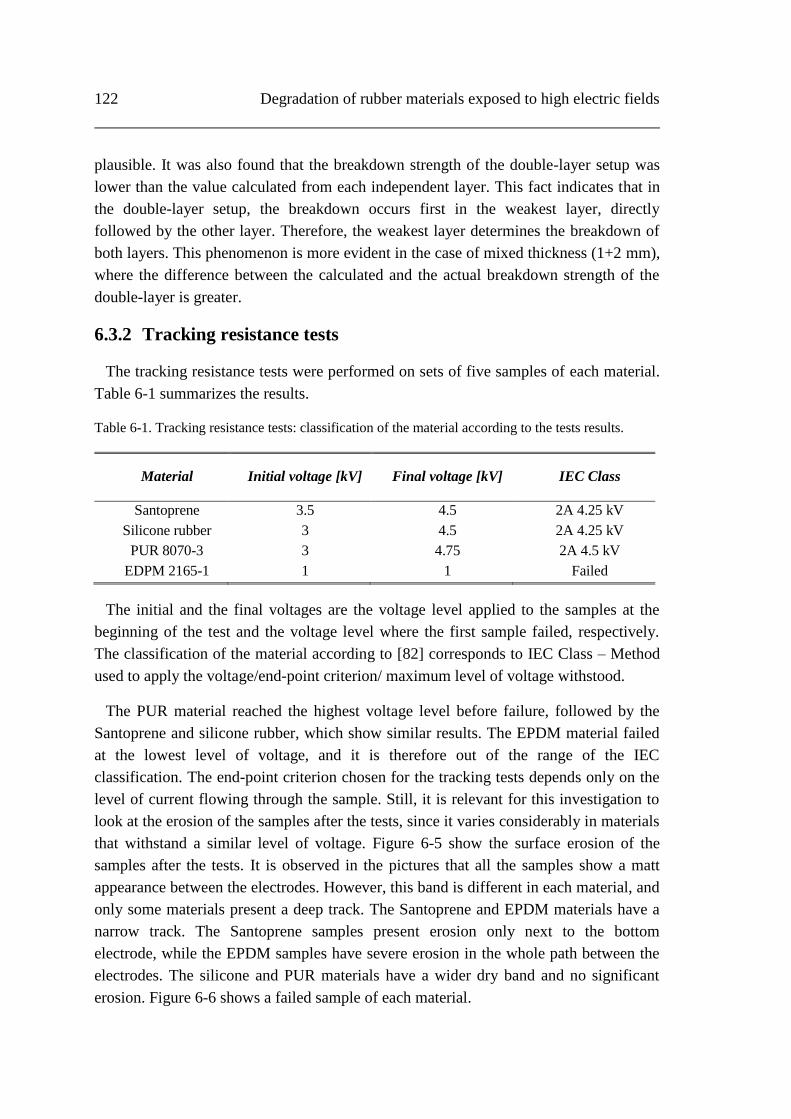
122 Degradation of rubber materials exposed to high electric fields
plausible. It was also found that the breakdown strength of the double-layer setup was
lower than the value calculated from each independent layer. This fact indicates that in
the double-layer setup, the breakdown occurs first in the weakest layer, directly
followed by the other layer. Therefore, the weakest layer determines the breakdown of
both layers. This phenomenon is more evident in the case of mixed thickness (1+2 mm),
where the difference between the calculated and the actual breakdown strength of the
double-layer is greater.
6.3.2 Tracking resistance tests
The tracking resistance tests were performed on sets of five samples of each material.
Table 6-1 summarizes the results.
Table 6-1. Tracking resistance tests: classification of the material according to the tests results.
Material Initial voltage [kV] Final voltage [kV] IEC Class
Santoprene 3.5 4.5 2A 4.25 kV
Silicone rubber 3 4.5 2A 4.25 kV
PUR 8070-3 3 4.75 2A 4.5 kV
EDPM 2165-1 1 1 Failed
The initial and the final voltages are the voltage level applied to the samples at the
beginning of the test and the voltage level where the first sample failed, respectively.
The classification of the material according to [82] corresponds to IEC Class – Method
used to apply the voltage/end-point criterion/ maximum level of voltage withstood.
The PUR material reached the highest voltage level before failure, followed by the
Santoprene and silicone rubber, which show similar results. The EPDM material failed
at the lowest level of voltage, and it is therefore out of the range of the IEC
classification. The end-point criterion chosen for the tracking tests depends only on the
level of current flowing through the sample. Still, it is relevant for this investigation to
look at the erosion of the samples after the tests, since it varies considerably in materials
that withstand a similar level of voltage. Figure 6-5 show the surface erosion of the
samples after the tests. It is observed in the pictures that all the samples show a matt
appearance between the electrodes. However, this band is different in each material, and
only some materials present a deep track. The Santoprene and EPDM materials have a
narrow track. The Santoprene samples present erosion only next to the bottom
electrode, while the EPDM samples have severe erosion in the whole path between the
electrodes. The silicone and PUR materials have a wider dry band and no significant
erosion. Figure 6-6 shows a failed sample of each material.

Degradation of rubber materials exposed to high electric fields 123
Figure 6-5. Surface erosion on the samples of the rubber materials after the tracking resistance tests.
From top to bottom: Santoprene: Samples 1 and 3 failed, Silicone rubber: Sample 1 failed, PUR:
Sample 1 failed, and EPDM: All the samples failed.
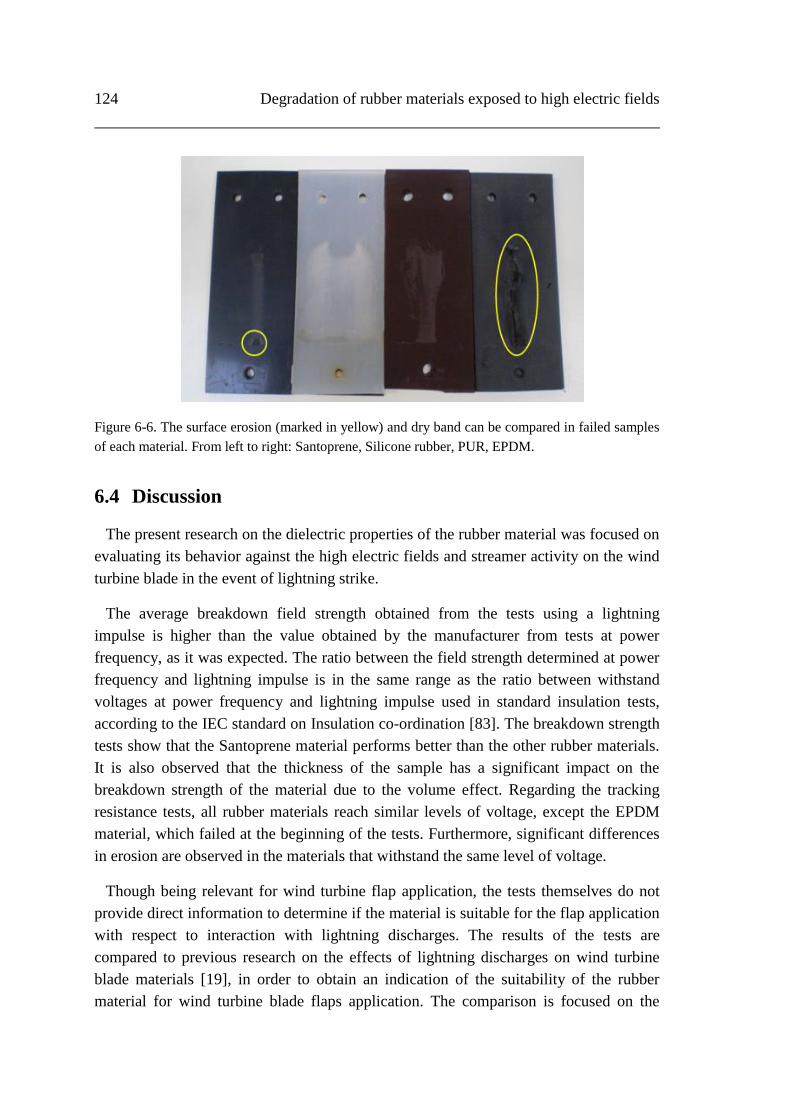
124 Degradation of rubber materials exposed to high electric fields
Figure 6-6. The surface erosion (marked in yellow) and dry band can be compared in failed samples
of each material. From left to right: Santoprene, Silicone rubber, PUR, EPDM.
6.4 Discussion
The present research on the dielectric properties of the rubber material was focused on
evaluating its behavior against the high electric fields and streamer activity on the wind
turbine blade in the event of lightning strike.
The average breakdown field strength obtained from the tests using a lightning
impulse is higher than the value obtained by the manufacturer from tests at power
frequency, as it was expected. The ratio between the field strength determined at power
frequency and lightning impulse is in the same range as the ratio between withstand
voltages at power frequency and lightning impulse used in standard insulation tests,
according to the IEC standard on Insulation co-ordination [83]. The breakdown strength
tests show that the Santoprene material performs better than the other rubber materials.
It is also observed that the thickness of the sample has a significant impact on the
breakdown strength of the material due to the volume effect. Regarding the tracking
resistance tests, all rubber materials reach similar levels of voltage, except the EPDM
material, which failed at the beginning of the tests. Furthermore, significant differences
in erosion are observed in the materials that withstand the same level of voltage.
Though being relevant for wind turbine flap application, the tests themselves do not
provide direct information to determine if the material is suitable for the flap application
with respect to interaction with lightning discharges. The results of the tests are
compared to previous research on the effects of lightning discharges on wind turbine
blade materials [19], in order to obtain an indication of the suitability of the rubber
material for wind turbine blade flaps application. The comparison is focused on the
Degradation of rubber materials exposed to high electric fields 125
results of the breakdown and tracking resistance tests of uncoated GFRP materials.
Regarding the breakdown tests, the breakdown strength at negative polarity of GFRP
samples 2 mm thick was found to be close to 50 kV/mm, with an air gap between the
upper electrode and the specimen surface of 50mm, while the breakdown strength
obtained from the 2 mm thick rubber samples is 69 kV/mm on average, with the
electrode in contact with the specimen surface. Concerning the tracking resistance tests,
IEC 60587 method 2 was followed for GFRP materials, consisting in increasing the
voltage applied to the samples in 250V each hour until failure. According to the results,
in more than 90% of the GFRP materials, the first sample failed at a voltage equal or
lower than 3.5 kV, while the rubber samples survived 6h at 3.5 kV.
The comparison of tests results for rubber and GFRP materials reveals that the tested
Santoprene material has comparable properties with respect to tracking resistance and
breakdown strength, and it can therefore be considered a suitable candidate for wind
turbine blade flaps application, regarding its interaction with lightning discharges.
Finally, it has to be considered that a rubber flap installed in a blade in service will be
subjected to mechanical fatigue. Therefore mechanical tests should be done with the
tested samples in order to evaluate how the erosion due to tracking affects the
performance of the material in general.

126 Degradation of rubber materials exposed to high electric fields
Chapter 7
Design and validation of lightning protection for
flap system of wind turbine blades
The analysis tools provided in the previous chapters are applied to the design and
validation processes of the lightning protection system for the rubber flap for active
flow control. As seen in the present chapter, the different experimental and numerical
tools presented all contribute to a thorough evaluation of the design. The chapter is
divided into four sections. Section 7 describes the different components of the flap
system and its operational principles. Section 7.2 explains the requirements followed to
prevent lightning damage on the flap system and describes the design of the lightning
protection for the flap system. Section 7.3 summarizes the results of the lightning
protection validation by means of laboratory tests and analytical tools and Section 7.4
discusses the results.
Due to a considerable delay in the manufacturing the flap system, which was delivered
for lightning tests only two weeks before the end of the three year period of this PhD,
the high voltage tests necessary for the validation of the lightning protection system
could not be completed. Furthermore, it was not possible to iterate with the lightning
protection system according to the tests results as planned initially, since only a
preliminary design could be tested. Consequently, the analysis of the lightning
interaction with the flap system is only partial and further work needs to be done on the
design and verification of the lightning protection of the flap, as specified in Chapter 8.
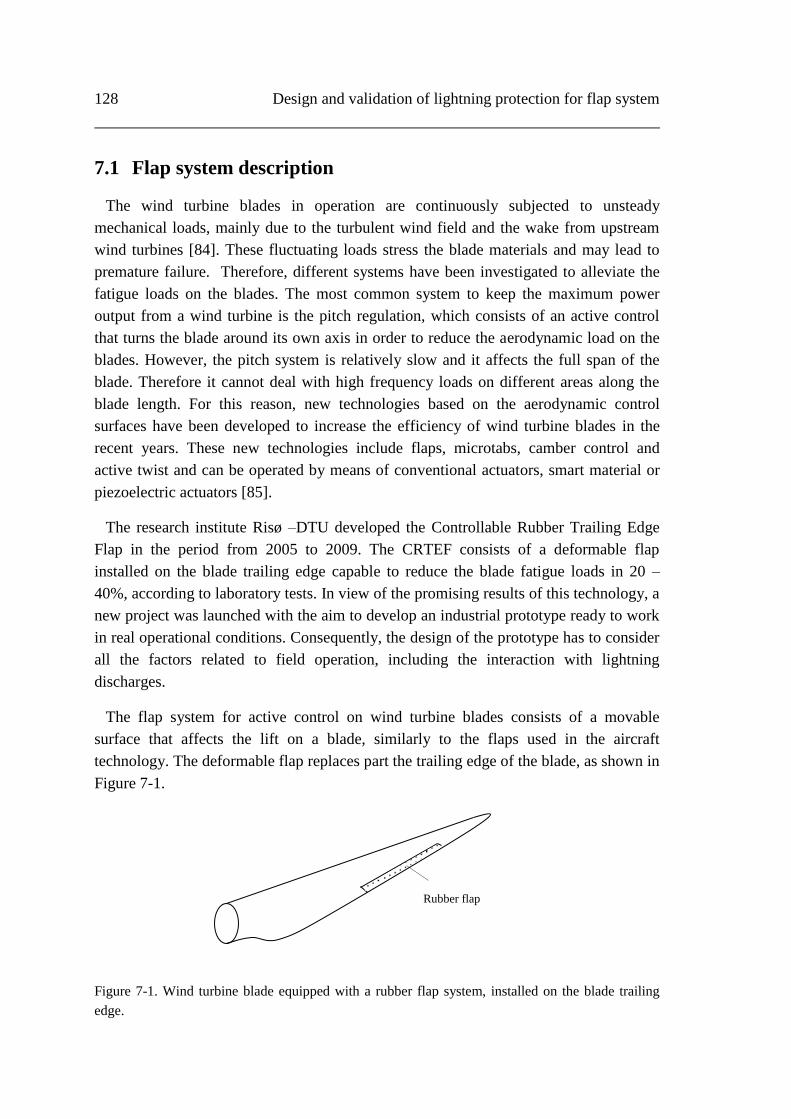
128 Design and validation of lightning protection for flap system
7.1 Flap system description
The wind turbine blades in operation are continuously subjected to unsteady
mechanical loads, mainly due to the turbulent wind field and the wake from upstream
wind turbines [84]. These fluctuating loads stress the blade materials and may lead to
premature failure. Therefore, different systems have been investigated to alleviate the
fatigue loads on the blades. The most common system to keep the maximum power
output from a wind turbine is the pitch regulation, which consists of an active control
that turns the blade around its own axis in order to reduce the aerodynamic load on the
blades. However, the pitch system is relatively slow and it affects the full span of the
blade. Therefore it cannot deal with high frequency loads on different areas along the
blade length. For this reason, new technologies based on the aerodynamic control
surfaces have been developed to increase the efficiency of wind turbine blades in the
recent years. These new technologies include flaps, microtabs, camber control and
active twist and can be operated by means of conventional actuators, smart material or
piezoelectric actuators [85].
The research institute Risø –DTU developed the Controllable Rubber Trailing Edge
Flap in the period from 2005 to 2009. The CRTEF consists of a deformable flap
installed on the blade trailing edge capable to reduce the blade fatigue loads in 20 –
40%, according to laboratory tests. In view of the promising results of this technology, a
new project was launched with the aim to develop an industrial prototype ready to work
in real operational conditions. Consequently, the design of the prototype has to consider
all the factors related to field operation, including the interaction with lightning
discharges.
The flap system for active control on wind turbine blades consists of a movable
surface that affects the lift on a blade, similarly to the flaps used in the aircraft
technology. The deformable flap replaces part the trailing edge of the blade, as shown in
Figure 7-1.
Figure 7-1. Wind turbine blade equipped with a rubber flap system, installed on the blade trailing
edge.
Rubber flap

Design and validation of lightning protection for flap system 129
The CRTEF developed by Risø – DTU consists of a rubber flap operated by a
hydraulic system [84]. The main components of the flap are of two rubber elements
with voids in the spanwise direction that can be pressurized with a gas o liquid medium
by means of the hydraulic system in order to control the deflection. The rubber material
chosen used for the flap is Santoprene EMPP for its mechanical properties and high
resistance to environmental conditions. The rubber elements with voids are
manufactured by extrusion and bonded to a rigid PVC support consisting of a fixation
stand, a stabilization sheet and a top sheet, as illustrated in Figure 7-2. Two pressure
connectors supply the pressurized medium to the voids.
Figure 7-2. Components of the Controllable Rubber Trailing Edge Flap (Adapted from Rehau –
Dynamized turbine blades 2014).
The flap actuation concept consists in pressurizing alternately the upper and lower row
of voids, in order to obtain a downward and upward deflection, respectively (Figure
7-3). The time constant of the actuation is in the order of 0.1s using a pneumatic
pressurizing system [86].
Figure 7-3. Upward and downward deflection of the flap by pressurizing the lower and upper row of
voids, respectively (Adapted from [86]).
In order to tests the mechanical properties of the flap system a prototype was
manufactured, consisting of a blade section of 2 m span and 1 m chord, where the flap is
Top fin
PVC
Rubber elements
Santoprene EMPP
Spanwise
pressurized voids
Stabilization sheet
PVC
Fixation stand
PVC
Pressure
connectors

130 Design and validation of lightning protection for flap system
installed. The drawing in Figure 7-4 shows the different components of the prototype
and the prototype mounted on the test rig. The rubber flap replaces the trailing edge in
15% of the blade chord. Three cylindrical accumulators of the hydraulic system are
mounted next to the flap. A central hollow tube is installed all along the span in order to
mount the prototype in rotating test rig for mechanical tests. The blade section has both
edges covered for aerodynamic purposes.
Figure 7-4. On the left, prototype for testing consisting of a blade section of 2 m span and 1 m chord
equipped with the flap system. On the right, prototype mounted on the rotating test rig based on a
100 kW turbine platform (adapted from [86]).
7.2 Lightning protection design
The first step in the design of the lightning protection of the flap system is to identify
the risk of lightning damage. After assessing the risk of damage, a lightning protection
system is proposed with the aim of intercepting the direct lightning strikes and
conducting the current safely to ground.
7.2.1 Requirements and recommendations
The flap system is a new technology that integrates new components and materials in
the blade structure. Therefore, there are no specific requirements regarding its lightning
protection and no field experience on the effects of lightning on its components.
Considering that the blade is installed in the blade, it is expected to be exposed to the
same direct and indirect effects of lightning as the blade. Consequently, the criteria to
design the lightning protection will be based on the methods used for protection of
blades from the standard [2], previous research on the interaction of electrical
discharges and blade materials and literature on high voltage rubber insulators used in
outer electrical equipment. The final design will be verified by means of tests and
simulation tools.
Rubber flap
Accumulators
Tube for mounting the
prototype on the test rig

Design and validation of lightning protection for flap system 131
The main requirements according to the standard [2] are summarized below:
The flap system, as part of the blade, is located in the Lightning Protection Zone 0
(LPZ0), and therefore fully exposed to the effects of lightning strikes. Consequently,
the lightning protection shall be sufficient to enable the blade to accept lightning
strikes categorized as Lightning Protection Level 1 (LPL1) of 200 kA and 10 MJ/Ω
without structural damage that would impair the functioning of the blade.
The lightning protection of the flap system must include an air termination system,
which intercepts the lightning strikes, a down conductor, which conducts the current
to ground, and equipotential connections to the main lightning protection of the
blade. The materials and geometry of the protection components must fulfill the
requirements of LPL 1.
The storm electrical field and the lightning attachment process stress and degrade
the composite materials. The lightning protection in these materials should consider
the high voltage insulation design principles.
The lightning protection of a blade (or blade section) with the flap system has to be
validated by means of tests or analytical tools previously verified with tests.
The research on the effects of lightning on wind turbines in field and the results of
high voltage tests in the laboratory has shown further measures to consider in order to
reducing the risk of lightning damages in the blade:
Most of the lightning strikes attach the last three meters of the blade, according to
the field experience [4]. Therefore, if outermost part of the flap system is located
within the last three meters of the blade, the presence of an air termination system is
critical to avoid direct strikes to the flap system.
According to the high voltage tests presented in Section 4.2.2, the minimum
distance between discrete air terminations in the last meters of the blade should be
around 2m.
When a blade is subjected to a sufficiently high electric field, streamers will be
emitted from all conductive components. Considering that the streamers may lead to
lightning attachment, in the flap system it is preferable the use of non-conductive
materials for reinforcement or bonding components whenever possible, in order to
avoid lightning attachment in areas with no air-termination. The conductive parts
that cannot be replaced by with non-conductive materials should be encapsulated so
that the air terminations are the only uncovered elements of the blade.
High voltage experiments have shown that arc attachments occur to a non-
conducting blade sprayed with saline water practically as if the blade was metallic
[19]. Therefore, in the flap system it is recommended to use materials with high
hydrophobicity to avoid moist and dirt on the flap surface.
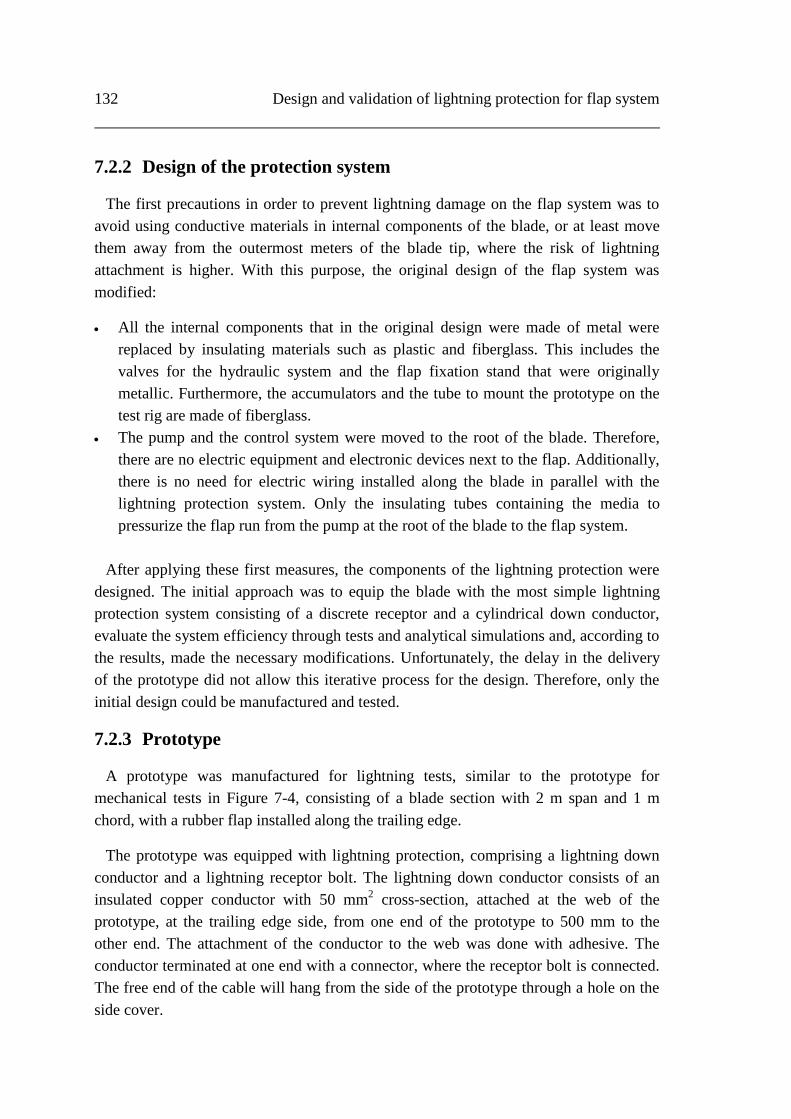
132 Design and validation of lightning protection for flap system
7.2.2 Design of the protection system
The first precautions in order to prevent lightning damage on the flap system was to
avoid using conductive materials in internal components of the blade, or at least move
them away from the outermost meters of the blade tip, where the risk of lightning
attachment is higher. With this purpose, the original design of the flap system was
modified:
All the internal components that in the original design were made of metal were
replaced by insulating materials such as plastic and fiberglass. This includes the
valves for the hydraulic system and the flap fixation stand that were originally
metallic. Furthermore, the accumulators and the tube to mount the prototype on the
test rig are made of fiberglass.
The pump and the control system were moved to the root of the blade. Therefore,
there are no electric equipment and electronic devices next to the flap. Additionally,
there is no need for electric wiring installed along the blade in parallel with the
lightning protection system. Only the insulating tubes containing the media to
pressurize the flap run from the pump at the root of the blade to the flap system.
After applying these first measures, the components of the lightning protection were
designed. The initial approach was to equip the blade with the most simple lightning
protection system consisting of a discrete receptor and a cylindrical down conductor,
evaluate the system efficiency through tests and analytical simulations and, according to
the results, made the necessary modifications. Unfortunately, the delay in the delivery
of the prototype did not allow this iterative process for the design. Therefore, only the
initial design could be manufactured and tested.
7.2.3 Prototype
A prototype was manufactured for lightning tests, similar to the prototype for
mechanical tests in Figure 7-4, consisting of a blade section with 2 m span and 1 m
chord, with a rubber flap installed along the trailing edge.
The prototype was equipped with lightning protection, comprising a lightning down
conductor and a lightning receptor bolt. The lightning down conductor consists of an
insulated copper conductor with 50 mm2 cross-section, attached at the web of the
prototype, at the trailing edge side, from one end of the prototype to 500 mm to the
other end. The attachment of the conductor to the web was done with adhesive. The
conductor terminated at one end with a connector, where the receptor bolt is connected.
The free end of the cable will hang from the side of the prototype through a hole on the
side cover.
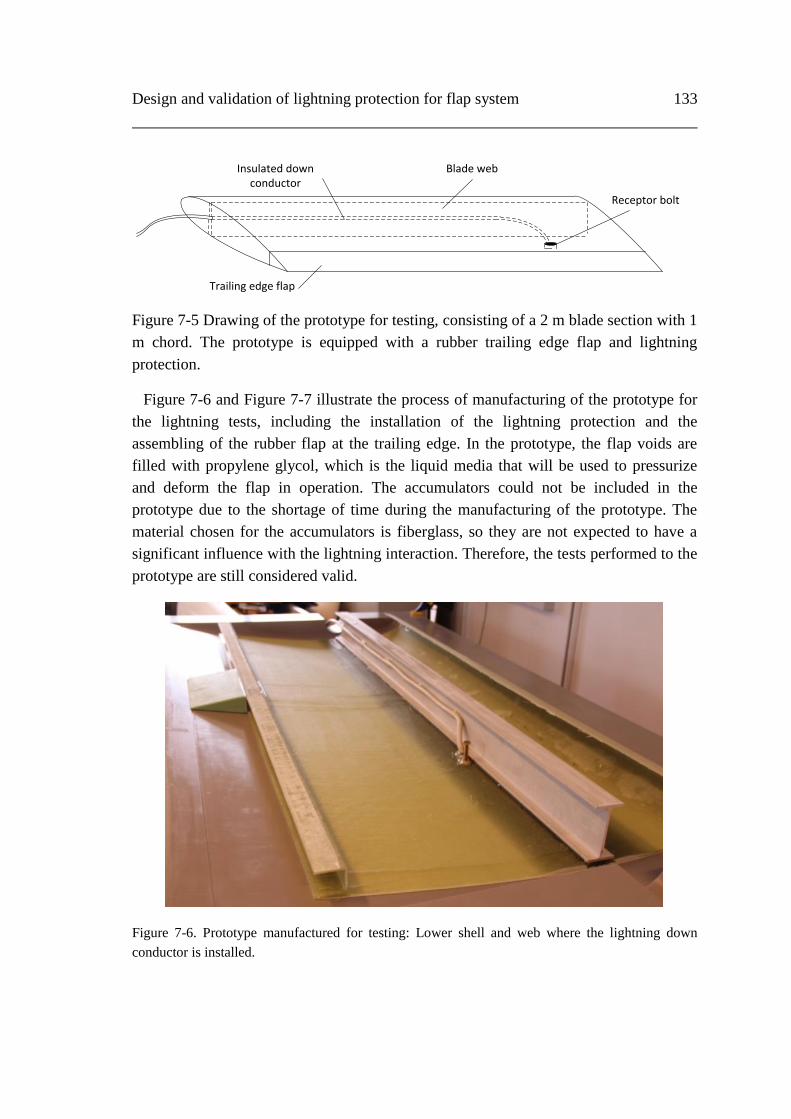
Design and validation of lightning protection for flap system 133
Receptor bolt
Insulated down conductor
Blade web
Trailing edge flap
Figure 7-5 Drawing of the prototype for testing, consisting of a 2 m blade section with 1
m chord. The prototype is equipped with a rubber trailing edge flap and lightning
protection.
Figure 7-6 and Figure 7-7 illustrate the process of manufacturing of the prototype for
the lightning tests, including the installation of the lightning protection and the
assembling of the rubber flap at the trailing edge. In the prototype, the flap voids are
filled with propylene glycol, which is the liquid media that will be used to pressurize
and deform the flap in operation. The accumulators could not be included in the
prototype due to the shortage of time during the manufacturing of the prototype. The
material chosen for the accumulators is fiberglass, so they are not expected to have a
significant influence with the lightning interaction. Therefore, the tests performed to the
prototype are still considered valid.
Figure 7-6. Prototype manufactured for testing: Lower shell and web where the lightning down
conductor is installed.
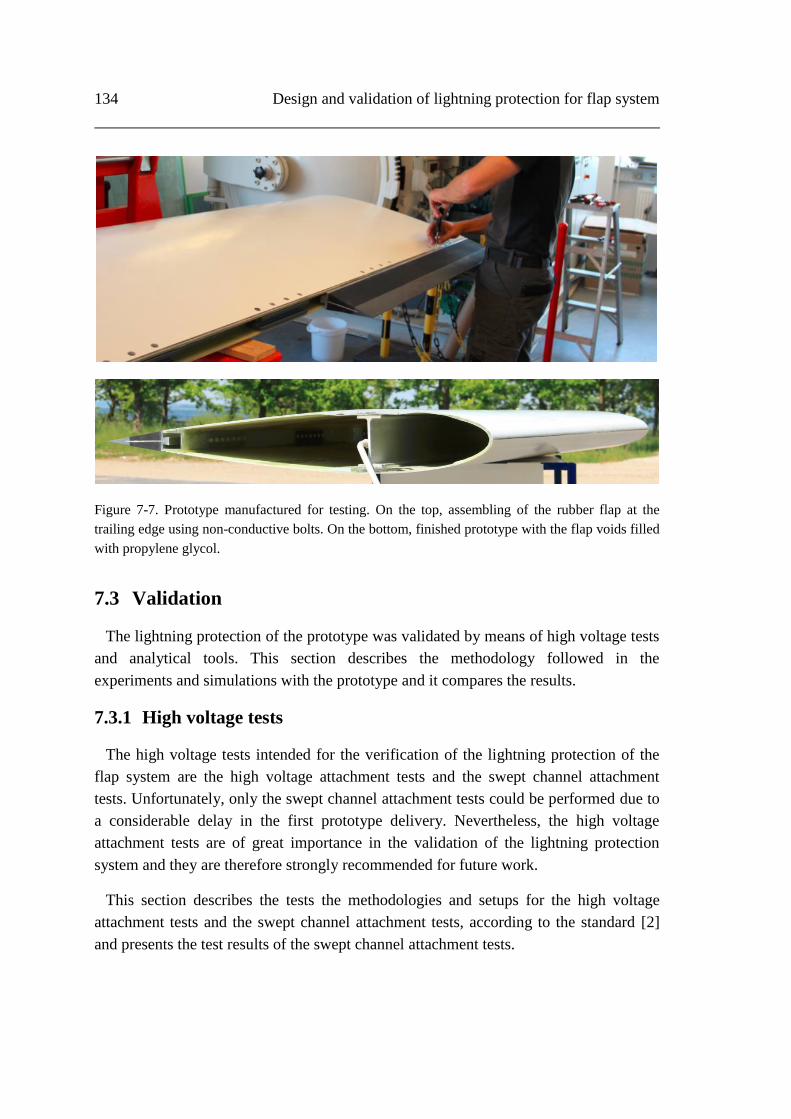
134 Design and validation of lightning protection for flap system
Figure 7-7. Prototype manufactured for testing. On the top, assembling of the rubber flap at the
trailing edge using non-conductive bolts. On the bottom, finished prototype with the flap voids filled
with propylene glycol.
7.3 Validation
The lightning protection of the prototype was validated by means of high voltage tests
and analytical tools. This section describes the methodology followed in the
experiments and simulations with the prototype and it compares the results.
7.3.1 High voltage tests
The high voltage tests intended for the verification of the lightning protection of the
flap system are the high voltage attachment tests and the swept channel attachment
tests. Unfortunately, only the swept channel attachment tests could be performed due to
a considerable delay in the first prototype delivery. Nevertheless, the high voltage
attachment tests are of great importance in the validation of the lightning protection
system and they are therefore strongly recommended for future work.
This section describes the tests the methodologies and setups for the high voltage
attachment tests and the swept channel attachment tests, according to the standard [2]
and presents the test results of the swept channel attachment tests.
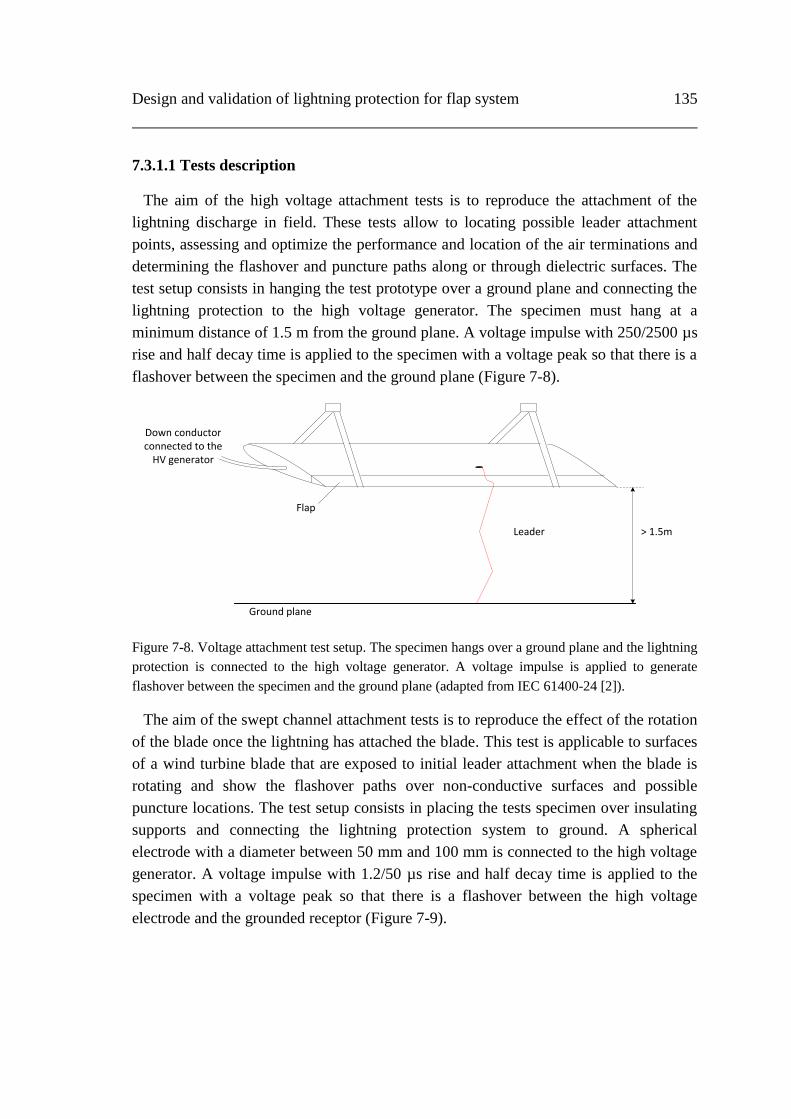
Design and validation of lightning protection for flap system 135
7.3.1.1 Tests description
The aim of the high voltage attachment tests is to reproduce the attachment of the
lightning discharge in field. These tests allow to locating possible leader attachment
points, assessing and optimize the performance and location of the air terminations and
determining the flashover and puncture paths along or through dielectric surfaces. The
test setup consists in hanging the test prototype over a ground plane and connecting the
lightning protection to the high voltage generator. The specimen must hang at a
minimum distance of 1.5 m from the ground plane. A voltage impulse with 250/2500 µs
rise and half decay time is applied to the specimen with a voltage peak so that there is a
flashover between the specimen and the ground plane (Figure 7-8).
Ground plane
Down conductor connected to the
HV generator
> 1.5mLeader
Flap
Figure 7-8. Voltage attachment test setup. The specimen hangs over a ground plane and the lightning
protection is connected to the high voltage generator. A voltage impulse is applied to generate
flashover between the specimen and the ground plane (adapted from IEC 61400-24 [2]).
The aim of the swept channel attachment tests is to reproduce the effect of the rotation
of the blade once the lightning has attached the blade. This test is applicable to surfaces
of a wind turbine blade that are exposed to initial leader attachment when the blade is
rotating and show the flashover paths over non-conductive surfaces and possible
puncture locations. The test setup consists in placing the tests specimen over insulating
supports and connecting the lightning protection system to ground. A spherical
electrode with a diameter between 50 mm and 100 mm is connected to the high voltage
generator. A voltage impulse with 1.2/50 µs rise and half decay time is applied to the
specimen with a voltage peak so that there is a flashover between the high voltage
electrode and the grounded receptor (Figure 7-9).

136 Design and validation of lightning protection for flap system
High voltage electrode
Insulating supports
Grounded receptor
Grounded down conductor
50 mm
Rubber flap
Swept leader channel
Internal swept leaders
Figure 7-9. Swept channel test setup. The specimen stands on insulating supports. The lightning
protection system is grounded and a spherical electrode is connected to the high voltage generator
(adapted from IEC 61400-24 [2]).
The high voltage electrode is placed 50 mm over the shell surface and it is moved
from the lightning receptor towards the trailing edge to simulate the leader sweeping the
rotating blade. The voltage peak necessary to generate flashover increases with the
distance between the high voltage electrode and the grounded receptor and it may
overstress the blade material and cause a punctures that would not occur when real
lightning sweeps the blade surface. The standard IEC 61400-24 [2] does not specify a
maximum voltage peak for the swept channel tests. However, similar tests are
performed in aircraft, where the standard SAE ARP 5416 – Aircraft Lightning Tests
Methods [87] recommends an electric field of 140 kV/m in order to perform realistic
swept channel tests.
7.3.1.2 Tests procedure and results
The high voltage swept channel tests were performed on the prototype with the
trailing edge flap filled with polypropylene glycol and equipped with lightning
protection.
The test setup followed the description in Section 7.3.1.1. The prototype was standing
over two wooden supports, and a spherical high voltage electrode with a 100 mm
diameter was placed 50 mm over the shell surface (Figure 7-10). The tests started with
the HV electrode vertically aligned with the grounded receptor, and it was moved in
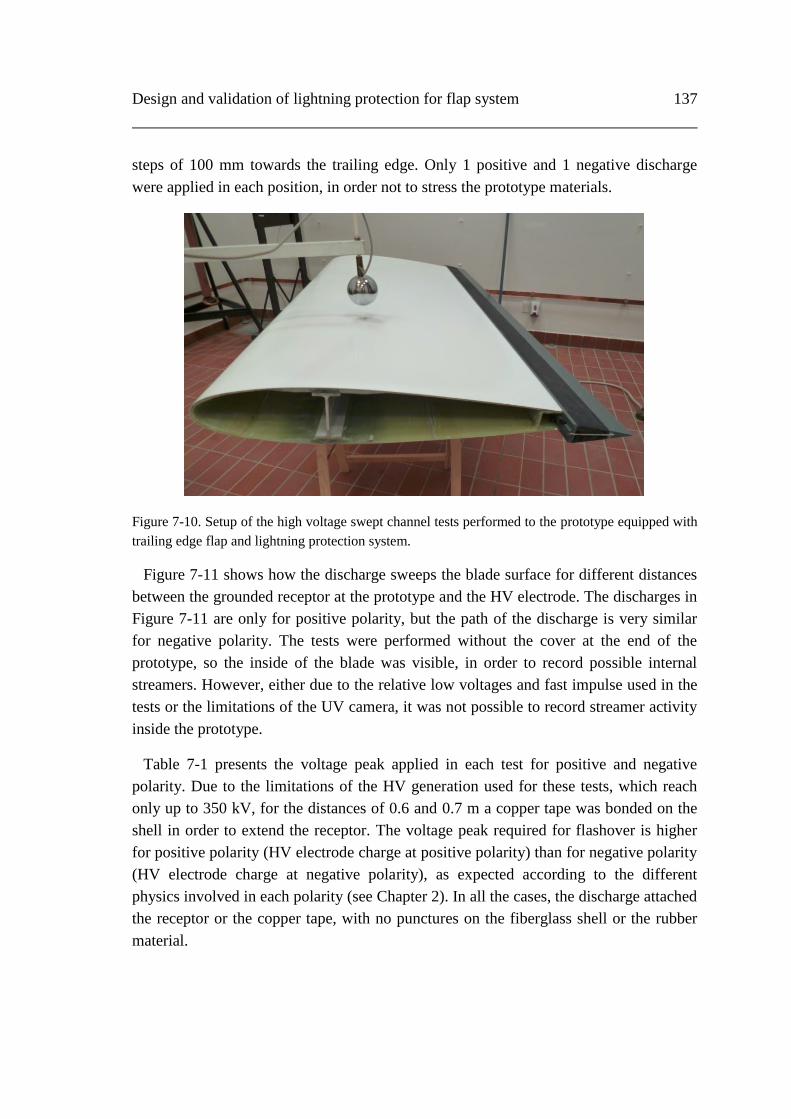
Design and validation of lightning protection for flap system 137
steps of 100 mm towards the trailing edge. Only 1 positive and 1 negative discharge
were applied in each position, in order not to stress the prototype materials.
Figure 7-10. Setup of the high voltage swept channel tests performed to the prototype equipped with
trailing edge flap and lightning protection system.
Figure 7-11 shows how the discharge sweeps the blade surface for different distances
between the grounded receptor at the prototype and the HV electrode. The discharges in
Figure 7-11 are only for positive polarity, but the path of the discharge is very similar
for negative polarity. The tests were performed without the cover at the end of the
prototype, so the inside of the blade was visible, in order to record possible internal
streamers. However, either due to the relative low voltages and fast impulse used in the
tests or the limitations of the UV camera, it was not possible to record streamer activity
inside the prototype.
Table 7-1 presents the voltage peak applied in each test for positive and negative
polarity. Due to the limitations of the HV generation used for these tests, which reach
only up to 350 kV, for the distances of 0.6 and 0.7 m a copper tape was bonded on the
shell in order to extend the receptor. The voltage peak required for flashover is higher
for positive polarity (HV electrode charge at positive polarity) than for negative polarity
(HV electrode charge at negative polarity), as expected according to the different
physics involved in each polarity (see Chapter 2). In all the cases, the discharge attached
the receptor or the copper tape, with no punctures on the fiberglass shell or the rubber
material.
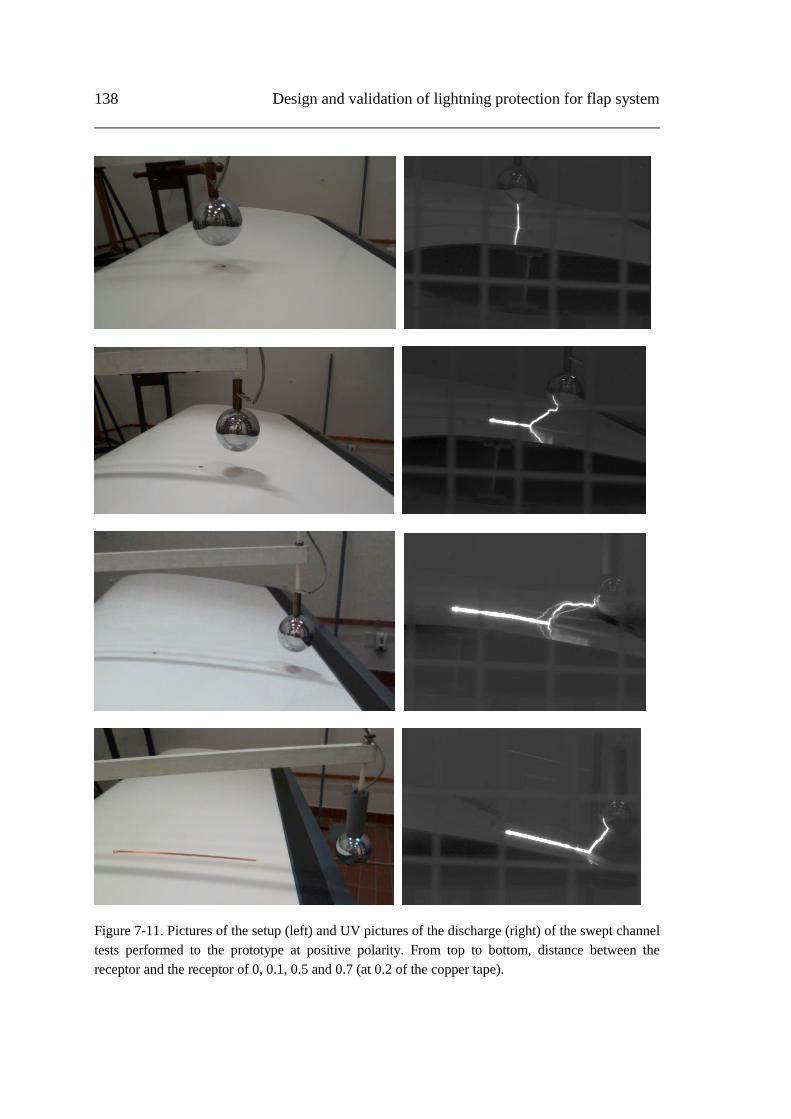
138 Design and validation of lightning protection for flap system
Figure 7-11. Pictures of the setup (left) and UV pictures of the discharge (right) of the swept channel
tests performed to the prototype at positive polarity. From top to bottom, distance between the
receptor and the receptor of 0, 0.1, 0.5 and 0.7 (at 0.2 of the copper tape).

Design and validation of lightning protection for flap system 139
Table 7-1. Summary of swept channel tests results. Voltage peak for positive and negative polarity
for the different distances between the receptor on the prototype and the HV electrode.
Distance between
receptor and HV
electrode [m]
Voltage peak
Negative polarity
[kV]
Voltage peak
Positive polarity
[kV]
Attachment
0 100 140 Receptor
0.1 187 225 Receptor
0.2 220 235 Receptor
0.3 237 252 Receptor
0.4 280 320 Receptor
0.5 310 346 Receptor
0.6 (*) 196 220 Copper tape
0.7 (*) 275 280 Copper tape
(*) A copper band was used to extend the receptor 0.5 m towards the HV electrode
Neither the shell coating nor the rubber surface suffer any burn during the tests. Only
the silicone junction between the shell and the flap shows faint tracks (Figure 7-12).
Considering that the voltage applied was significantly higher than the voltage expected
when lightning sweeps the blade surface according to the SAE ARP 5416 [87], it is
considered that the prototype has successfully passed the tests.
Figure 7-12. Tracks of the discharges on the silicone junction between the glass fiber shell and the
flap.
7.3.2 Numerical tools
According to the swept channel attachment tests performed in the laboratory, the
rubber flap is not expected to suffer punctures or external burns when the leader sweeps
its surface. However, possible internal discharges, in particular in the flap voids, cannot
be detected with the swept channel tests. Therefore, the analytical simulations can be a
useful tool to determine what is taking place inside the flap during the process of the
discharge.
The analytical method used for the verification of the prototype is the quasi-dynamic
FEM simulations presented in Chapter 4, Section 4.3.2. The method consists of an
Shell Rubber
flap
Track paths

140 Design and validation of lightning protection for flap system
iterative procedure that determines the origin and propagation of streamers from the
conductive elements. The 2D model of the model of the swept channel tests is shown in
Figure 7-13, and represents the case when the receptor is extended 0.5 m with a copper
tape. Two cases are simulated, when the flap voids are filled with air (initial design of
the flap system) and when they are filled with polypropylene glycol (final design, used
in the laboratory tests). Figure 7-14 and Figure 7-15 show the results, for air and
polypropylene glycol, respectively.
Figure 7-13. FEM 2D simulation model of the setup for the swept channel attachment tests on the
prototype, for the case where the receptor is extended 0.5 m with copper tape.
Figure 7-14 shows that the electric field inside the voids filled with air (ε=1) is already
high in the initial field distribution and it increases when the streamer originated at the
HV electrode comes closer to the flap, eventually reaching the electric strength of the
air. When the flashover occurs, there are internal discharges in almost all the voids.
In Figure 7-15, the electric field inside the voids filled with polypropylene glycol
(ε=37 at room temperature [88]) is near zero during all the process of the discharge,
caused by its conductivity. Therefore there are no internal discharges in the voids.
It is observed that, since the permittivity of the polypropylene glycol is higher than the
permittivity of the flap rubber material (ε=3.5), the electric field is enhanced in the
rubber material, stressing the rubber significantly more than in the case of air-filled
voids. However, considering that the electric field in the rubber is far lower than the
dielectric strength field of the rubber (according to the laboratory measurements
performed in Chapter 6), the case where the flap voids are filled with polypropylene
glycol performs better than the case with air-filled voids.

Design and validation of lightning protection for flap system 141
Figure 7-14. Different iterations of the FEM simulation when the flap voids are filled with air. From
top to bottom: initial electric field distribution, propagation of the discharges from the copper tape
and from the receptor and flashover. On the right, zoomed view of the flap.
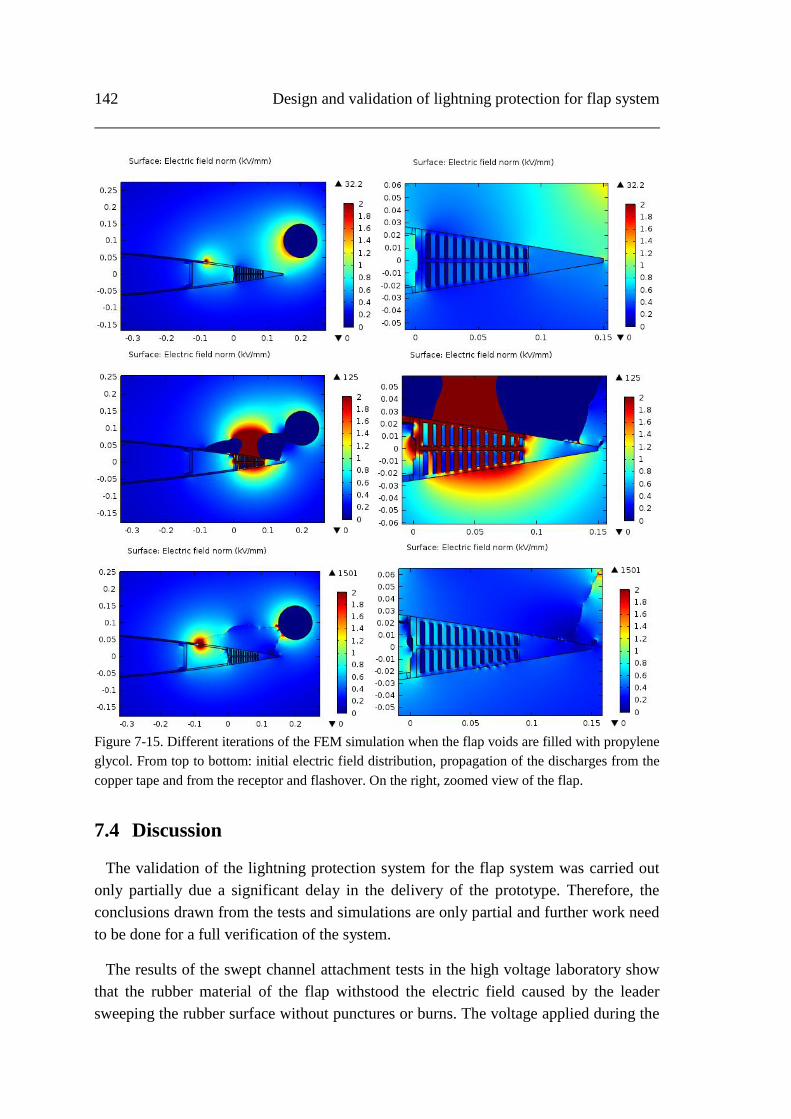
142 Design and validation of lightning protection for flap system
Figure 7-15. Different iterations of the FEM simulation when the flap voids are filled with propylene
glycol. From top to bottom: initial electric field distribution, propagation of the discharges from the
copper tape and from the receptor and flashover. On the right, zoomed view of the flap.
7.4 Discussion
The validation of the lightning protection system for the flap system was carried out
only partially due a significant delay in the delivery of the prototype. Therefore, the
conclusions drawn from the tests and simulations are only partial and further work need
to be done for a full verification of the system.
The results of the swept channel attachment tests in the high voltage laboratory show
that the rubber material of the flap withstood the electric field caused by the leader
sweeping the rubber surface without punctures or burns. The voltage applied during the
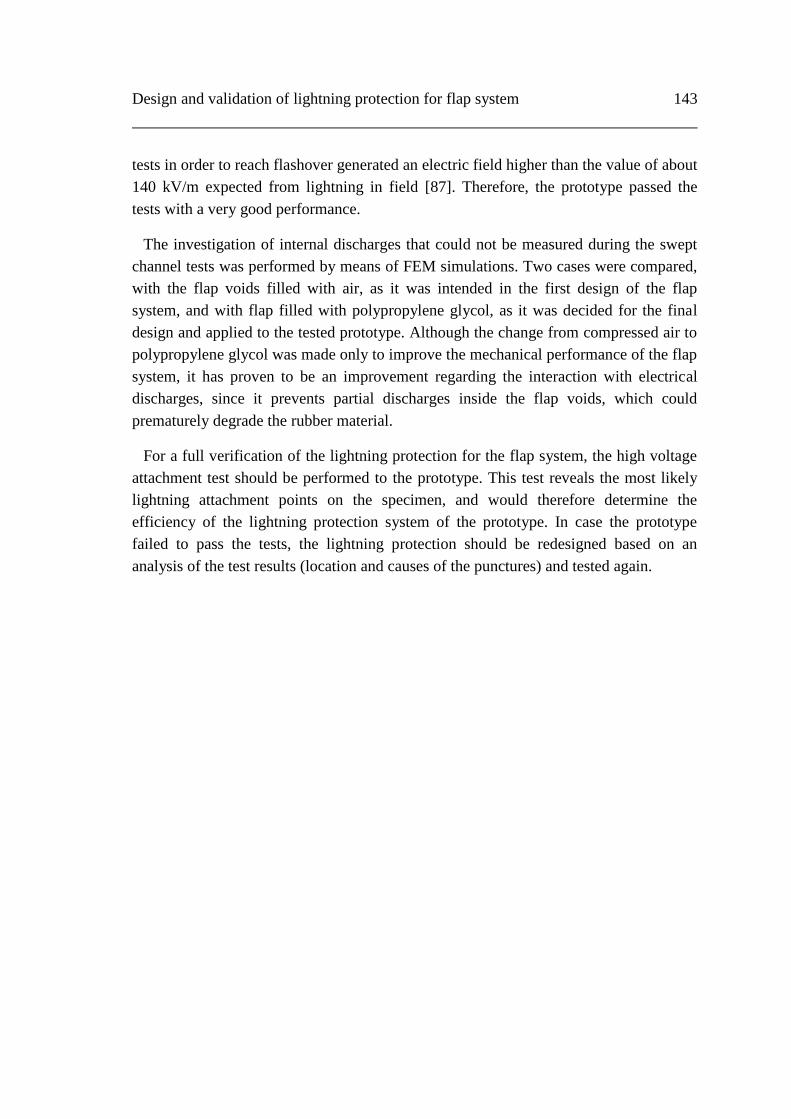
Design and validation of lightning protection for flap system 143
tests in order to reach flashover generated an electric field higher than the value of about
140 kV/m expected from lightning in field [87]. Therefore, the prototype passed the
tests with a very good performance.
The investigation of internal discharges that could not be measured during the swept
channel tests was performed by means of FEM simulations. Two cases were compared,
with the flap voids filled with air, as it was intended in the first design of the flap
system, and with flap filled with polypropylene glycol, as it was decided for the final
design and applied to the tested prototype. Although the change from compressed air to
polypropylene glycol was made only to improve the mechanical performance of the flap
system, it has proven to be an improvement regarding the interaction with electrical
discharges, since it prevents partial discharges inside the flap voids, which could
prematurely degrade the rubber material.
For a full verification of the lightning protection for the flap system, the high voltage
attachment test should be performed to the prototype. This test reveals the most likely
lightning attachment points on the specimen, and would therefore determine the
efficiency of the lightning protection system of the prototype. In case the prototype
failed to pass the tests, the lightning protection should be redesigned based on an
analysis of the test results (location and causes of the punctures) and tested again.

144 Design and validation of lightning protection for flap system

Chapter 8
Conclusions
The present research is part of a broader project funded by EUDP and leaded by Risø
– DTU. The thesis compiles the work carried out during the last three years at the
Technical University of Denmark in Kgs. Lyngby, the headquarters of EDP-
Renewables North America in Texas, USA, and at the GLPS testing facilities in
Herning. The outcome of the PhD has contributed with new knowledge on field data,
simulation models, experimental work, and on the interaction between lightning and a
flap system for wind turbine blades. This section presents the main conclusions in each
area of research and makes some recommendations for future work.
8.1 Characteristics of the lightning activity in wind farms
The research related to field data comprises a statistical analysis of the lightning
activity in a wind farm from field observations and an investigation of the lightning
damages on blades from different wind farms in US. The data was collected during a
period of five years. The results of the analysis provide relevant information about the
lightning effects on wind turbines and may help to verify the methods used by the IEC
61400-24 [2] to evaluate the risk of lightning strikes and to validate the protection
system. The most relevant findings concern the upward lightning initiated at the wind
turbines, the peak current of downward lightning attaching wind turbines and the
location of the damages along the blade span.
Regarding the upward lightning initiated at the wind turbines, the analysis of the field
observations shows that about 22% of the lightning strikes reported at the wind turbines
correspond to upward discharges. This value is in good agreement with the main models
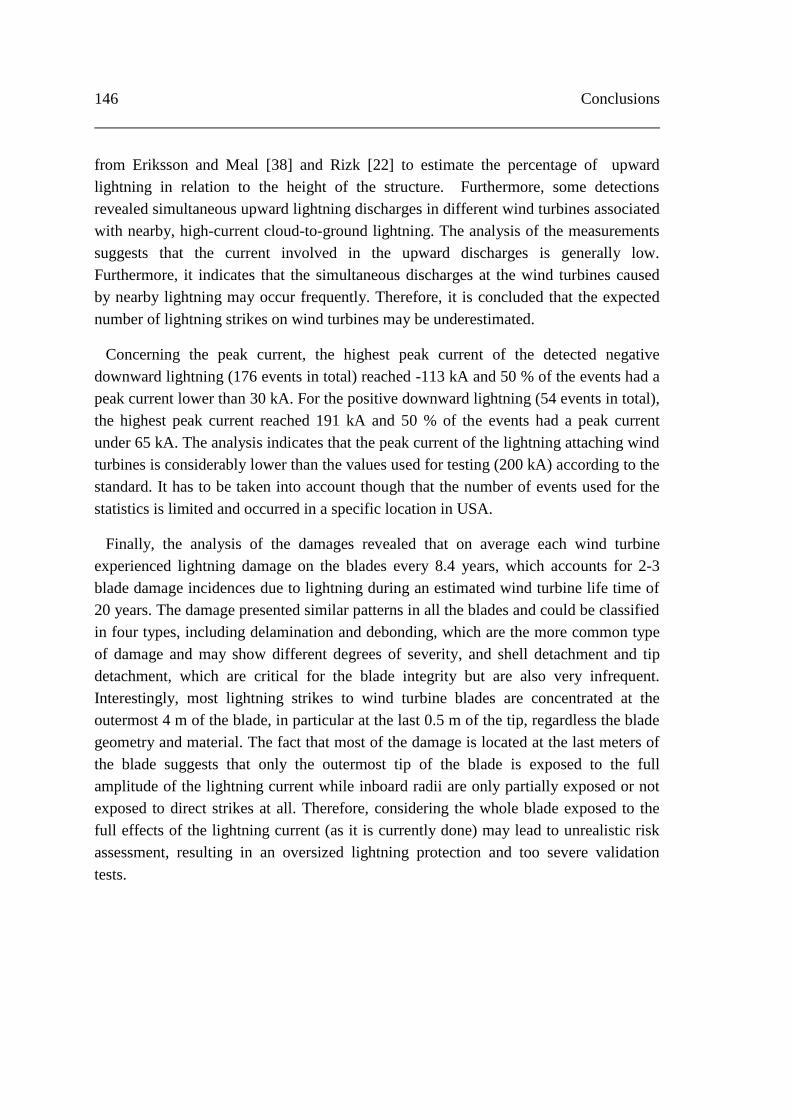
146 Conclusions
from Eriksson and Meal [38] and Rizk [22] to estimate the percentage of upward
lightning in relation to the height of the structure. Furthermore, some detections
revealed simultaneous upward lightning discharges in different wind turbines associated
with nearby, high-current cloud-to-ground lightning. The analysis of the measurements
suggests that the current involved in the upward discharges is generally low.
Furthermore, it indicates that the simultaneous discharges at the wind turbines caused
by nearby lightning may occur frequently. Therefore, it is concluded that the expected
number of lightning strikes on wind turbines may be underestimated.
Concerning the peak current, the highest peak current of the detected negative
downward lightning (176 events in total) reached -113 kA and 50 % of the events had a
peak current lower than 30 kA. For the positive downward lightning (54 events in total),
the highest peak current reached 191 kA and 50 % of the events had a peak current
under 65 kA. The analysis indicates that the peak current of the lightning attaching wind
turbines is considerably lower than the values used for testing (200 kA) according to the
standard. It has to be taken into account though that the number of events used for the
statistics is limited and occurred in a specific location in USA.
Finally, the analysis of the damages revealed that on average each wind turbine
experienced lightning damage on the blades every 8.4 years, which accounts for 2-3
blade damage incidences due to lightning during an estimated wind turbine life time of
20 years. The damage presented similar patterns in all the blades and could be classified
in four types, including delamination and debonding, which are the more common type
of damage and may show different degrees of severity, and shell detachment and tip
detachment, which are critical for the blade integrity but are also very infrequent.
Interestingly, most lightning strikes to wind turbine blades are concentrated at the
outermost 4 m of the blade, in particular at the last 0.5 m of the tip, regardless the blade
geometry and material. The fact that most of the damage is located at the last meters of
the blade suggests that only the outermost tip of the blade is exposed to the full
amplitude of the lightning current while inboard radii are only partially exposed or not
exposed to direct strikes at all. Therefore, considering the whole blade exposed to the
full effects of the lightning current (as it is currently done) may lead to unrealistic risk
assessment, resulting in an oversized lightning protection and too severe validation
tests.
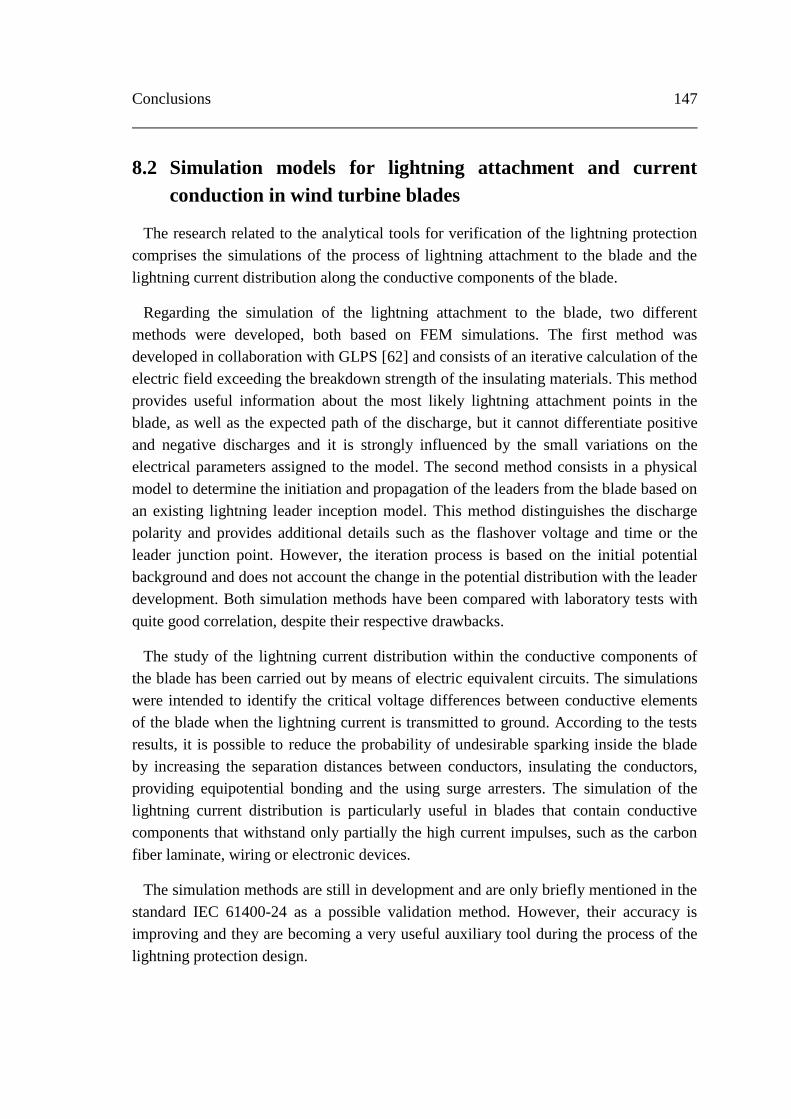
Conclusions 147
8.2 Simulation models for lightning attachment and current
conduction in wind turbine blades
The research related to the analytical tools for verification of the lightning protection
comprises the simulations of the process of lightning attachment to the blade and the
lightning current distribution along the conductive components of the blade.
Regarding the simulation of the lightning attachment to the blade, two different
methods were developed, both based on FEM simulations. The first method was
developed in collaboration with GLPS [62] and consists of an iterative calculation of the
electric field exceeding the breakdown strength of the insulating materials. This method
provides useful information about the most likely lightning attachment points in the
blade, as well as the expected path of the discharge, but it cannot differentiate positive
and negative discharges and it is strongly influenced by the small variations on the
electrical parameters assigned to the model. The second method consists in a physical
model to determine the initiation and propagation of the leaders from the blade based on
an existing lightning leader inception model. This method distinguishes the discharge
polarity and provides additional details such as the flashover voltage and time or the
leader junction point. However, the iteration process is based on the initial potential
background and does not account the change in the potential distribution with the leader
development. Both simulation methods have been compared with laboratory tests with
quite good correlation, despite their respective drawbacks.
The study of the lightning current distribution within the conductive components of
the blade has been carried out by means of electric equivalent circuits. The simulations
were intended to identify the critical voltage differences between conductive elements
of the blade when the lightning current is transmitted to ground. According to the tests
results, it is possible to reduce the probability of undesirable sparking inside the blade
by increasing the separation distances between conductors, insulating the conductors,
providing equipotential bonding and the using surge arresters. The simulation of the
lightning current distribution is particularly useful in blades that contain conductive
components that withstand only partially the high current impulses, such as the carbon
fiber laminate, wiring or electronic devices.
The simulation methods are still in development and are only briefly mentioned in the
standard IEC 61400-24 as a possible validation method. However, their accuracy is
improving and they are becoming a very useful auxiliary tool during the process of the
lightning protection design.
148 Conclusions
8.3 Results of tests aimed at reproducing lightning attachment to
wind turbine blades
This PhD project contains a significant amount of laboratory work. The experiments
have been used both to investigate the effects of lightning on samples and prototypes
and to assess the accuracy of the simulation methods used along the thesis.
Most of the experiments consisted in standard high voltage tests to reproduce the
lightning attachment on the blade and were carried out according to the
recommendations from the IEC 61400-24. The high voltage tests were performed in
small-scale specimens consisting of fiberglass panels equipped with lightning protection
to reproduce the blade surface, and full-scale specimens consisting in sections of blade
of 2 and 8 meters span. The main interest of the tests was to explore the initiation and
propagation of the streamers from the conductive elements of the blade, in order to
validate the results of the simulation models, including location of striking points, path
of the leader, breakdown voltage or formation time.
Furthermore, non-standard tests were performed on rubber materials suitable for the
flap system in order to evaluate the ageing effect of the high electric field caused by
lightning. The tests methods were based on previous work on the electrical properties of
fiberglass materials from Madsen [19], and included breakdown strength tests and
tracking resistance tests. The aim of the tests was to affect the rubber material in a
similar way than in field conditions.
8.4 Performance of the flap system exposed to lightning
The investigation of the lightning effects on the flap system and the design and
validation of its lightning protection was based on the research performed within this
thesis on the field data, simulation tools and laboratory tests.
The design of the lightning protection were based on the recommendations of the IEC
61400-24, but also took into consideration the areas of the blade most likely to be struck
by lightning according to the statistics on field data and the minimum distances between
receptors according to the research on the lightning attachment process on blades. The
performance of the rubber material when exposed to the lightning high electric fields
was assessed according to the results of the breakdown and tracking resistance tests.
The validation of the lightning protection was carried out by means of tests and
simulations. The high voltage tests performed the prototype of the flap system were the
swept channel attachment tests, which reproduce the leader channel sweeping along the
blade surface due to the blade rotation. FEM simulations were used to investigate of
Conclusions 149
internal discharges that could not be measured during the swept channel tests. The blade
prototype equipped with the flap system and lightning protection passed the tests
satisfactorily. However, due to a significant delay in the delivery of the prototype, the
conclusions drawn from the tests and simulations are only partial and further work need
to be done for a full verification of the system.
Regarding the tests related to the degradation of the flap rubber material exposed to
the lightning high electric field, which include breakdown and tracking resistance tests,
the rubber material used for the flap system performed at least as well as the tested
fiberglass materials and better than other rubber materials such as PUR, EPDM or
silicone rubber. Therefore, rubber material used for the flap is expected to have at least
the same capability as the fiberglass materials to withstand the high electric fields
caused by lightning.
8.5 Future work
This PhD project was intended to investigate the effects of lightning on wind turbines,
in particular on blades equipped with a trailing edge flap system, and it covered
different areas of research related to lightning attachment, current conduction and
protection design. However, there is still an important work to do in the future to fully
understand the interaction between lightning and wind turbines, and thus eliminate
altogether the risk of lightning damage on wind turbines.
Further observations of the lightning activity in wind farms are necessary to obtain
more reliable statistics of the parameters of the lightning current attaching wind turbines
(including peak current, charge and specific energy) and for a better understanding of
the mechanisms involved in the initiation of the upward lightning from wind turbines.
The simulation tools should continue to develop, in particular those intended to
simulate the process of lightning attachment to blades. The use of more detailed 3D
models and the characterization of flashover in solid materials and along interfaces are
issues that could not be investigated in detail in this PhD.
Finally, regarding the particular case of the trailing edge flap system, the high voltage
attachment test should be performed to the prototype in order to validate the lightning
protection system. This test will determine the most likely lightning attachment points
on the prototype, and the overall efficiency of the lightning protection. In case the
prototype does not to pass the tests, the lightning protection design should be modified
according to the causes of the failure and tested again.

150 Conclusions
References
[1] “Global wind report annual market update 2013.” Global Wind
Energy Council, 2013.
[2] “IEC 61400-24 Ed.1.0: Wind turbines – Part 24: Lightning
protection,” 2010.
[3] V. Peesapati, I. Cotton, T. Sorensen, T. Krogh, and N. Kokkinos,
“Lightning protection of wind turbines – a comparison of measured data with
required protection levels,” IET Renew. Power Gener., vol. 5, no. 1, p. 48, 2011.
[4] A. Candela Garolera, S. F. Madsen, K. L. Cummins, J. Myers, and J.
Holboell, “Observations of Lightning Discharges to wind turbines in Kansas,
US.,” To be Publ.
[5] F. Rachidi, M. Rubinstein, J. Montanyà, J. Bermúdez, R. R. Sola, G.
Solà, and N. Korovkin, “A Review of Current Issues in Lightning Protection,”
vol. 55, no. 6, pp. 2489–2496, 2008.
[6] N. Wilson, J. Myers, and M. Hutchinson, “Lightning attachment to
eind turbines in central Kansas: video observations, correlation with the NLDN
and in-situ peak current measurements,” in European Wind Energy Association,
2013.
[7] J. Montanyà, O. van der Velde, and E. R. Williams, “Lightning
discharges produced by wind turbines,” J. Geophys. Res. Atmos., pp. 1–8, 2014.
[8] A. Candela Garolera, K. L. Cummins, S. F. Madsen, J. Holboell, and
J. Myers, “Multiple lightning discharges in wind turbines associated with nearby
cloud-to-ground lightning,” To be Publ.
[9] S. Yokoyama, Y. Yasuda, M. Minowa, S. Sekioka, K. Yamamoto,
N. Honjo, and T. Sato, “Clarification of the mechanism of wind turbine blade
damage taking lightning characteristics into consideration and relevant research
project,” 2012 Int. Conf. Light. Prot., pp. 1–6, Sep. 2012.

152 References
[10] Y. Yoh and Y. Shigeru, “Proposal of lightning damage classification
to wind turbine blades,” 2011 7th Asia-Pacific Int. Conf. Light., vol. 2, no. 1, pp.
368–371, Nov. 2011.
[11] A. Candela Garolera, S. F. Madsen, M. Nissim, J. Myers, and J.
Holboell, “Lightning damage to wind turbine blades from wind farms in US,” To
be Publ.
[12] M. A. Uman, The lightning discharge. Dover Publications, Inc.,
2001.
[13] V. A. Rakov and M. A. Uman, Lightning, Physics and Effects.
Cambridge: Cambridge Univ. Press, 2003.
[14] V. Cooray, The Lightning Flash. The Institution of Engineering and
Technology, Michael Faraday House, Six Hills Way, Stevenage SG1 2AY, UK:
IET, 2003.
[15] “IEC 62305-1 Ed. 2.0: Protection against lightning – Part 1: General
principles.” IEC, 2012.
[16] “IEC 62305-2 Ed. 2.0: Protection against lightning – Part 1: Risk
management.” IEC, 2011.
[17] “IEC 62305-3 Ed. 2.0: Protection against lightning – Part 3: Physical
damage of structures and life hazard.” IEC, 2011.
[18] “IEC 62305-4 Ed. 2.0: Protection against lightning – Part 4:
Electrical and electronic systems within structures.” IEC, 2011.
[19] S. F. Madsen, “Interaction between electrical discharges and
materials for wind turbine blades – particularly related to lightning protection,”
Technical University of Denmark, 2006.
[20] A. J. Eriksson, “Lightning and tall structures,” Trans S Afr Inst
Electr Eng, vol. 69, pp. 238 – 252, 1978.
[21] V. Rakov and A. O. Lutz, “A new technique for estimating
equivalent attractive radius for downward lightning flashes,” in International
Conference On Ligthning Protection, 1990.
References 153
[22] F. A. M. Rizk, “Modelling of Lihgtning Incidences to Tall
Structures Part I: Theory,” vol. 9, no. 1, pp. 162–171, 1994.
[23] F. A. M. Rizk, “Modelling of Lihgtning Incidences to Tall
Structures Part II: Application,” vol. 9, no. 1, pp. 172–193, 1994.
[24] R. H. Golde, “On the frequency of occurrence and distribution of
lightning strokes to transmission lines,” Trans AIEE 6.4, vol. vol. III p, p. pp.902
–910, 1945.
[25] A. J. Eriksson, “An Improved Electrogeometric Model for
Transmission Line Shielding Analysis,” IEEE Power Eng. Rev., vol. PER-7, no.
7, pp. 67–68, Jul. 1987.
[26] M. Becerra and V. Cooray, “A Simplified Physical Model to
Determine the Lightning Upward Connecting Leader Inception,” IEEE Trans.
Power Deliv., vol. 21, no. 2, pp. 897–908, Apr. 2006.
[27] K. L. Cummins, M. G. Quick, W. Rison, and J. Myers, “Overview
of the Kansas Windfarm2013 Field Program,” in XV International Conference on
Atmospheric Electricity, 2009.
[28] R. E. Orville, G. R. Huffines, W. R. Burrows, and K. L. Cummins,
“The North American Lightning Detection Network (NALDN)—Analysis of
Flash Data: 2001–09,” Mon. Weather Rev., vol. 139, no. 5, pp. 1305–1322, May
2011.
[29] K. L. Cummins and M. J. Murphy, “An Overview of Lightning
Locating Systems: History, Techniques, and Data Uses, With an In-Depth Look at
the U.S. NLDN,” IEEE Trans. Electromagn. Compat., vol. 51, no. 3, pp. 499–
518, Aug. 2009.
[30] K. L. Cummins, D. Zhang, M. G. Quick, A. Candela Garolera, and J.
Myers, “Performance of the U.S. NLDN during the Kansas Windfarm2012 and
2013 Field Programs,” in International Lightning Detection Conference, 2014.
[31] J. A. Cramer and K. L. Cummins, “Evaluating Location Accuracy of
Lightning Location Networks Using Tall Towers,” in International Lightning
Detection Conference, 2014.
154 References
[32] N. Honma, K. L. Cummins, M. J. Murphy, A. E. Pifer, and T.
Rogers, “Improved Lightning Locations in the Tohoku Region of Japan using
Propagation and Waveform Onset Corrections,” IEEJ Trans. Power Energy, vol.
133, no. 2, pp. 195–202, 2013.
[33] W. Rison, R. J. Thomas, P. R. Krehbiel, T. Hamlin, and J. Harlin,
“A GPS-based three-dimensional lightning mapping system: Initial observations
in central New Mexico,” Geophys. Res. Lett., vol. 26, no. 23, pp. 3573–3576, Dec.
1999.
[34] R. J. Thomas, “Accuracy of the Lightning Mapping Array,” J.
Geophys. Res., vol. 109, no. D14, 2004.
[35] D. Wang, N. Takagi, T. Watanabe, H. Sakurano, and M. Hashimoto,
“Observed characteristics of upward leaders that are initiated from a windmill and
its lightning protection tower,” Geophys. Res. Lett., vol. 35, no. 2, p. L02803, Jan.
2008.
[36] T. a. Warner, K. L. Cummins, and R. E. Orville, “Upward lightning
observations from towers in Rapid City, South Dakota and comparison with
National Lightning Detection Network data, 2004-2010,” J. Geophys. Res.
Atmos., vol. 117, no. D19, p. n/a–n/a, Oct. 2012.
[37] M. A. Stanley and M. J. Haevner, “Tall structure lightning induced
by sprite-producing discharges,” in International Conference on Athmospheric
Electricity, 2003.
[38] J. A. Eriksson and D. V. Meal, “The Incidence of Lightning Strikes
to Power Lines,” no. 3, 1987.
[39] P. Chowdhuri, J. G. Anderson, and W. A. Chisholm, “Parameters of
Lightning Strokes: A Review,” IEEE Trans. Power Deliv., vol. 20, no. 1, pp. 346–
358, Jan. 2005.
[40] L. D. Carey, “Characteristics of cloud-to-ground lightning in severe
and nonsevere storms over the central United States from 1989–1998,” J.
Geophys. Res., vol. 108, no. D15, p. 4483, 2003.
[41] A. Nag, “First versus subsequent return-stroke current and field
peaks in negative cloud-to-ground lightning discharges,” J. Geophys. Res. - Part
F - Solid Earth, vol. 113, no. D19, 2008.
References 155
[42] K. Berger, “Novel Observations on Lightning Dicharges : Results of
Research on Mount San Salvatore,” J. Franklin Inst., vol. Volume 283, no. Issue
6, pp. 478–525, 1967.
[43] G. Diendorfer, H. Pichler, and M. Mair, “Some Parameters of
Negative Upward-Initiated Lightning to the Gaisberg Tower (2000–2007),” IEEE
Trans. Electromagn. Compat., vol. 51, no. 3, pp. 443–452, Aug. 2009.
[44] T. A. Warner, “Observations of simultaneous upward lightning
leaders from multiple tall structures,” Atmos. Res., vol. 117, pp. 45–54, Nov.
2012.
[45] V. . Thottappillil, V. A. Rakov, M. A. Uman, W. H. Beasley, M. J.
Master, and D. V. Shelukhin, “Lightning subsequent-stroke electric field peak
greater than the first stroke peak and multiple ground terminations,” J. Geophys.
Res., vol. 97, 1992.
[46] W. C. Valine, “Statistics and characteristics of cloud-to-ground
lightning with multiple ground contacts,” J. Geophys. Res., vol. 107, no. D20, p.
4441, 2002.
[47] M. G. Ballaroti, M. M. F. Saba, and O. Pinto Jr, “High-speed camera
observations of negative ground flashes on a millisecond-scale,” Geophys. Res.
Lett., vol. 32, 2005.
[48] X. Z. Kong, X. S. Qie, Y. Zhao, and T. Zhang, “Characteristics of
negative lightning flashes presenting multiple-ground terminations on a
millisecond-scale,” Atmos. Res., vol. 91, no. 2–4, pp. 381–386, Feb. 2009.
[49] M. Stolzenburg, T. C. Marshall, S. Karunarathne, N. Karunarathna,
T. a. Warner, R. E. Orville, and H.-D. Betz, “Strokes of upward illumination
occurring within a few milliseconds after typical lightning return strokes,” J.
Geophys. Res., vol. 117, no. D15, p. D15203, Aug. 2012.
[50] M. Ishii and M. Saito, “Lightning Electric Field Characteristics
Associated With Transmission-Line Faults in Winter,” IEEE Trans. Electromagn.
Compat., vol. 51, no. 3, pp. 459–465, Aug. 2009.
[51] M. Becerra and V. Cooray, “Time dependent evaluation of the
lightning upward connecting leader inception,” J. Phys. D. Appl. Phys., vol. 39,
no. 21, pp. 4695–4702, Nov. 2006.
156 References
[52] N. Honma, “Detection of characteristic LEMP waveforms by
Tohoku IMPACT sensor network in winter,” in Int. Workshop of High Voltage
Engineering, 2007.
[53] S. F. Madsen, K. Bertelsen, T. H. Krogh, H. V Erichsen, A. N.
Hansen, and K. B. Lønbæk, “Proposal of New Zoning Concept Considering
Lightning Protection of Wind Turbine Blades,” pp. 108–117, 2012.
[54] I. Gallimberti, “The mechanism of the long spark formation,” Le J.
Phys., vol. 40, no. C7, pp. C7–193–C7–250, Jul. 1979.
[55] G. L. Bacchiega, A. Gazzani, M. Bernardi, I. Gallimberti, and A.
Bondiou, “Theoretical modelling of the laboratory negative stepped leader,” in
Proceedings of the International Aerospace and Ground conferenceon Lightning
and static electricity, 1994.
[56] I. Gallimberti, G. Bacchiega, A. Bondiou-Clergerie, and P. Lalande,
“Fundamental processes in long air gap discharges,” Comptes Rendus Phys., vol.
3, no. 10, pp. 1335–1359, Dec. 2002.
[57] A. Candela Garolera, J. Holboell, and S. F. Madsen, “Lightning
attachment to wind turbine surfaces affected by internal blade conditions,” 2012
Int. Conf. Light. Prot., pp. 1–7, Sep. 2012.
[58] “IEC 60060-1 Ed.3.0: High voltage test tecniques – Part 1: General
definitions and test requirements.” IEC, 2010.
[59] L. Gao, “Characteristics of Streamer Discharges in Air and along
Insulating Surfaces,” Uppsala University, 2000.
[60] “COMSOL Multiphysics Modeling Guide.” COMSOL AB., 2008.
[61] F. A. Fisher, J. A. Plumer, and R. A. Perala, Lightning protection of
Aircraft, 2nd ed. 1999.
[62] S. F. Madsen, C. F. Miertiz, and A. Candela Garolera, “Numerical
tools for lightning protection of wind turbines,” in International Conference On
Ligthning and Static Electricity, 2013.
[63] A. Candela Garolera, J. Holboell, S. F. Madsen, and C. F. Miertiz,
“Modeling of lightning streamer formation and propagation in wind turbine
References 157
blades,” in International Conference On Ligthning and Static Electricity, 2013,
no. 1, pp. 1–7.
[64] G. Gallet, G. Leroy, R. Lacey, and I. Kromer, “General expression
for positive switching impulse strength valid up to extra long air gaps,” IEEE
Trans. Power Appar. Syst., vol. PAS-94, no. December, 1975.
[65] G. Carrara and L. Thione, “Switching surge strength of large air
gaps: A physical approach,” IEEE Trans. Power Appar. Syst., vol. PAS-95, no. 2,
1976.
[66] A. Bondiou and I. Gallimberti, “Theoretical modelling of the
development of the positive spark in long gaps.pdf,” J. Phys. D. Appl. Phys., vol.
27, 1993.
[67] N. Goelian, P. Lalande, a Bondiou-Clergerie, G. L. Bacchiega, a
Gazzani, and I. Gallimberti, “A simplified model for the simulation of positive-
spark development in long air gaps,” J. Phys. D. Appl. Phys., vol. 30, no. 17, pp.
2441–2452, Sep. 1997.
[68] P. Lalande, A. Bondiou-Clergerie, G. Bacchiega, and I. Gallimberti,
“Observations and modeling of lightning leaders,” J. Aplplied Phys., vol. 3, pp.
1375–1392, 2002.
[69] F. Rizk, “A model for switching impulse leader inception and
breakdown of long air gaps,” IEEE Trans. Power Deliv., vol. 4, no. 1, 1989.
[70] F. Rizk, “Switching impulse strength of air insulation: Leader
inception criterion,” IEEE Trans. Power Deliv., vol. 4, no. 4, pp. 2187–2195,
1989.
[71] L. Arevalo and V. Cooray, “Preliminary study on the modelling of
negative leader discharges,” J. Phys. D. Appl. Phys., vol. 44, no. 31, p. 315204,
Aug. 2011.
[72] M. Becerra, V. Cooray, and F. Roman, “Lightning striking distance
of complex structures,” vol. m, no. Cvm, pp. 131–138.
[73] V. A. Rakov, “Transient response of a tall object to lightning,” IEEE
Trans. Electromagn. Compat., vol. 43, no. 4, pp. 654–661, 2001.
158 References
[74] A. Candela Garolera, J. Holboell, and S. F. Madsen, “Lightning
transient analysis in wind turbine blades,” Proc. Int. Conf. Power Syst. Transients,
2013.
[75] T. Hara and O. Yamamoto, “Modelling of a transmission tower for
lightning-surge analysis,” IEE Proc. - Gener. Transm. Distrib., vol. 143, no. 3, p.
283, 1996.
[76] L. Grcev, “Modeling of Grounding Electrodes Under Lightning
Currents,” IEEE Trans. Electromagn. Compat., vol. 51, no. 3, pp. 559–571, Aug.
2009.
[77] F. Heidler, J. M. Cvetic, and B. V. Stanic, “Calculation of lightning
current parameters,” IEEE Trans. Power Deliv., vol. 14, no. 2, pp. 399–404, Apr.
1999.
[78] A. Candela Garolera, J. Holboell, and M. Henriksen, “Breakdown
and Tracking Properties of Rubber Materials for Wind Turbine Blades,” Conf.
Rec. 2012 IEEE Int. Symp. Electr. Insul., pp. 516 – 519, 2012.
[79] A. Candela Garolera, J. Holboell, and M. Henriksen, “Behavior of
Rubber Materials under Exposure to High Electric Fields,” Proc. 23rd Nord.
Insul. Symp., pp. 175 – 178, 2013.
[80] “ASTM D149-09: Standard test method for dielectric breakdown
voltage and dielectric strength of solid electrical insulating materials at
commercial power frequencies.” ASTM, 2009.
[81] “IEC 60243-3 Ed.2.0: Electric strength of insulating materials – Test
methods – Part 3: Additional requirements for 1,2/50 impulse tests.” IEC, 2010.
[82] “IEC 60587 Ed.3.0: Electrical insulating materials used under severe
ambient conditions – Test methods for evaluating resistance to tracking and
erosion.” IEC, 2007.
[83] “IEC 60071-1 Ed.8.0: Insulation co-ordination. – Part 1: Definitions,
principles and rules.” IEC, 2006.
[84] P. B. Andersen, Advanced load alleviation for wind turbines using
adaptative trailing edge flaps: sensoring and control. PhD thesis, DTU-Risø,
2010.
References 159
[85] T. K. Barlas and G. a. M. van Kuik, “Review of state of the art in
smart rotor control research for wind turbines,” Prog. Aerosp. Sci., vol. 46, no. 1,
pp. 1–27, Jan. 2010.
[86] H. A. Madsen, T. L. Andersen, L. Bergami, J. E. Jørgensen, A.
Candela Garolera, and J. Holbøll, “Towards an Industrial Manufactured Morphing
Trailing Edge Flap System for Wind Turbines,” in European Wind Energy
Conference & Exhibition 2014, 2014.
[87] “SAE ARP 5416 - Aircraft Lightning Test Methods.” .
[88] Davidson, “Dielectric relaxation in glycerol, propylene glycol and n-
propanol,” J. Chem. Phys., vol. 19, pp. 1484 – 1491, 1951.

160 References

Appendix
Appendix A – List of publications
Journal papers:
A. Candela Garolera, S. F. Madsen, K. L. Cummins, J. Myers, and J. Holboell,
“Observations of Lightning Discharges to wind turbines in Kansas, US.,” Submitted,
waiting for acceptance
A. Candela Garolera, K. L. Cummins, S. F. Madsen, J. Holboell, and J. Myers,
“Multiple lightning discharges in wind turbines associated with nearby cloud-to-ground
lightning,” Submitted, waiting for acceptance
A. Candela Garolera, S. F. Madsen, M. Nissim, J. Myers, and J. Holboell, “Lightning
damage to wind turbine blades from wind farms in US,” Accepted on 26.10.2014 at
IEEE Transaction on Power delivery
Conference papers:
A. Candela Garolera, J. Holboell, and M. Henriksen, “Breakdown and Tracking
Properties of Rubber Materials for Wind Turbine Blades,” Conf. Rec. 2012 IEEE Int.
Symp. Electr. Insul., pp. 516 – 519, Puerto Rico, June 2012.
A. Candela Garolera, J. Holboell, and S. F. Madsen, “Lightning attachment to wind
turbine surfaces affected by internal blade conditions,” 2012 Int. Conf. Light. Prot., pp.
1–7, Vienna, September 2012.
A. Candela Garolera, J. Holboell, and M. Henriksen, “Behavior of Rubber Materials
under Exposure to High Electric Fields,” Proc. 23rd Nord. Insul. Symp., pp. 175 – 178,
Trondheim, June 2013.
A. Candela Garolera, J. Holboell, and S. F. Madsen, “Lightning transient analysis in
wind turbine blades,” Proc. Int. Conf. Power Syst. Transients, Vancouver, July 2013.
A. Candela Garolera, J. Holboell, S. F. Madsen, and C. F. Miertiz, “Modeling of
lightning streamer formation and propagation in wind turbine blades,” in International
Conference On Ligthning and Static Electricity, 2013, Seattle, September 2013

162 Appendix
S. F. Madsen, C. F. Miertiz and A. Candela Garolera, “Numerical tools for lightning
protection of wind turbines” in International Conference On Ligthning and Static
Electricity, 2013, Seattle, September 2013
H. A. Madsen, T. L. Andersen, L. Bergami, J. E. Jørgensen, A. Candela Garolera, and J.
Holbøll, “Towards an Industrial Manufactured Morphing Trailing Edge Flap System for
Wind Turbines,” in European Wind Energy Conference & Exhibition 2014, Barcelona,
March 2014.
K. L. Cummins, D. Zhang, M. G. Quick, A. Candela Garolera, and J. Myers,
“Performance of the U.S. NLDN during the Kansas Windfarm2012 and 2013 Field
Programs,” in International Lightning Detection Conference, Tucson, March 2014

Appendix 163
Appendix B – Numerical Modelling
Finite Elements Method:
The simulations of the lightning attachment included in Chapter 4 and Chapter 7 were
performed with the software COMSOL Multiphysics 4.4. The iterative processes were
carried out by means of a livelink with Matlab R2012b.
The AC/DC module – Electrostatic interface was used to solve the models. This
interface solves electric field and space charge distributions from the electric potentials
and relative permitivity of the elements of the model.
The type of mesh used in the models was Free tetrahedral, with refinements in the small
elements. In the 2D models, the feature Adaptive mesh refinement was used in order to
adapt the mesh to the conditions of each iteration, so it was possible to have a changing
mesh, which was finer close to the discharge (Figure A.1) . The models had a mesh
between 500,000 and 1,000,000 nodes.
Figure A.1. Example of adaptive mesh refinement next to the discharge path in a 2D model. Above, iteration of the
model where the discharge is developing towards the electrode. Below, on the left regular mesh, on the right adaptive
mesh refinement.

164 Appendix
Appendix C – Equipment of the high voltage laboratory
High voltage laboratory of the Technical University of Denmark, Kgs. Lyngby
Marx generator – 16 steps
- Type of waveform: impulse: 250/2500 µs
- Maximum voltage output: 1.2 MV
- Positive and negative polarity
Marx generator – 8 steps
- Type of waveform: impulse: 1.2/50 µs
- Maximum voltage output: 400 kV
- Positive and negative polarity
UV camera Hamamatsu C8484-05G
- High sensitivity in VIS-NIR region
- Progressive scan interline CCD chip with no mechanical shutter
- Anti-blooming function
- Wide dynamic range
- Effective number of pixels: 1344 (H)×1024 (V)
- Effective area: 8.67 mm (H)×6.60 mm (V)
- Read out speed: 8.9 frames/s
- Exposure time: 10 µs to 1 s
- Spectral response (Figure A.2)
Figure A.2. Spectral response of UV camera Hamamatsu C8484-05G

Appendix 165
High voltage laboratory of Global Lightning Protection Services, A/S
Marx generator
- Type of waveform: impulse: 250/2500 µs
- Maximum voltage output: 2.5 MV
- Positive and negative polarity
Camera Nikon D5000
- Effective pixels: 22.3 M
- Sensor size: 23.6 mm x 15.8 mm
- ISO sensitivity: ISO 200 - 3200