Embed Size (px)
Citation preview
Lightweight Concrete Modification Factor for Shear Friction
by
Lesley H. Sneed and
Dane M. Shaw
A National University Transportation Center at Missouri University of Science and Technology
NUTC R276 / R317

Disclaimer
The contents of this report reflect the views of the author(s), who are responsible for the facts and the
accuracy of information presented herein. This document is disseminated under the sponsorship of
the Department of Transportation, University Transportation Centers Program and the Center for
Transportation Infrastructure and Safety NUTC program at the Missouri University of Science and
Technology, in the interest of information exchange. The U.S. Government and Center for
Transportation Infrastructure and Safety assumes no liability for the contents or use thereof.
NUTC ###
Technical Report Documentation Page
1. Report No.
NUTC R276 / R317
2. Government Accession No. 3. Recipient's Catalog No.
4. Title and Subtitle
Lightweight Concrete Modification Factor for Shear Friction 5. Report Date
October 2013
6. Performing Organization Code
7. Author/s
Lesley Sneed
8. Performing Organization Report No.
Project #00034650 / 00040840
9. Performing Organization Name and Address
Center for Transportation Infrastructure and Safety/NUTC program Missouri University of Science and Technology 220 Engineering Research Lab Rolla, MO 65409
10. Work Unit No. (TRAIS)
11. Contract or Grant No.
DTRT06-G-0014
12. Sponsoring Organization Name and Address
U.S. Department of Transportation Research and Innovative Technology Administration 1200 New Jersey Avenue, SE Washington, DC 20590
13. Type of Report and Period Covered
Final
14. Sponsoring Agency Code
15. Supplementary Notes
16. Abstract
This report describes the results of a study initiated to examine the influence of concrete unit weight on the direct shear transfer across an interface of concretes cast at different times. This type of interface is common with structural precast concrete connections, such as corbels, for which shear friction design provisions are commonly used. Increasing use of lightweight aggregate concretes prompted this investigation to determine the appropriateness of current shear friction design provisions with respect to all-lightweight and sand-lightweight concrete. The experimental investigation included thirty-six push-off test specimens, each of which was constructed with a cold-joint at the interface shear plane. Test variables included unit weight of concrete (108, 120, and 145 pcf), target compressive strength of concrete (5000 and 8000 psi), and interface condition (smooth or roughened). A constant amount of reinforcing steel was provided across the shear plane. Results suggest that concrete unit weight did not play a significant role in the interface shear strength for the cold-joint specimens in this study. Results were also compared with shear friction design provisions in both the ACI 318 code and the PCI Design Handbook. Shear strengths computed using the coefficient of friction approach was conservative for the sand-lightweight and all-lightweight cold-joint specimens in this study. The value of the effective coefficient of friction e computed using the PCI Design Handbook approach was found to be conservative for both roughened and smooth non-monolithic interfaces for each concrete type. Finally, the use of the lightweight concrete modification factor in the calculation for the effective coefficient of friction �e was found to be conservative for the sand-lightweight and all-lightweight cold-joint specimens in this study. This study is sponsored by the Precast/Prestressed Concrete Institute Daniel P. Jenny Fellowship Program and the National University Transportation Center at the Missouri University of Science and Technology in Rolla, Missouri.
17. Key Words
Bridge superstructures, lightweight concrete
18. Distribution Statement
No restrictions. This document is available to the public through the National Technical Information Service, Springfield, Virginia 22161.
19. Security Classification (of this report)
unclassified
20. Security Classification (of this page)
unclassified
21. No. Of Pages
132
22. Price
Form DOT F 1700.7 (8-72)
ii
ABSTRACT
This report describes the results of a study initiated to examine the influence of concrete unit
weight on the direct shear transfer across an interface of concretes cast at different times. This
type of interface is common with structural precast concrete connections, such as corbels, for
which shear friction design provisions are commonly used. Increasing use of lightweight
aggregate concretes prompted this investigation to determine the appropriateness of current shear
friction design provisions with respect to all-lightweight and sand-lightweight concrete. The
experimental investigation included thirty-six push-off test specimens, each of which was
constructed with a cold-joint at the interface shear plane. Test variables included unit weight of
concrete (108, 120, and 145 pcf), target compressive strength of concrete (5000 and 8000 psi),
and interface condition (smooth or roughened). A constant amount of reinforcing steel was
provided across the shear plane. Results suggest that concrete unit weight did not play a
significant role in the interface shear strength for the cold-joint specimens in this study. Results
were also compared with shear friction design provisions in both the ACI 318 code and the PCI
Design Handbook. Shear strengths computed using the coefficient of friction approach were
conservative for the sand-lightweight and all-lightweight cold-joint specimens in this study. The
value of the effective coefficient of friction e computed using the PCI Design Handbook
approach was found to be conservative for both roughened and smooth non-monolithic interfaces
for each concrete type. Finally, the use of the lightweight concrete modification factor in the
calculation for the effective coefficient of friction e was found to be conservative for the sand-
lightweight and all-lightweight cold-joint specimens in this study. This study is sponsored by the
Precast/Prestressed Concrete Institute Daniel P. Jenny Fellowship Program and the National
University Transportation Center at the Missouri University of Science and Technology in Rolla,
Missouri.
iii
TABLE OF CONTENTS
Page
ABSTRACT .................................................................................................................................... ii
LIST OF FIGURES ...................................................................................................................... vii
LIST OF TABLES ........................................................................................................................ xii
NOMENCLATURE .................................................................................................................... xiii
1. INTRODUCTION .......................................................................................................................1
1.1. PROBLEM STATEMENT .........................................................................................1
1.2. GOAL AND OBJECTIVES ........................................................................................3
1.3. SCOPE .........................................................................................................................3
1.4. SUMMARY OF CONTENT.......................................................................................3
2. BACKGROUND INVESTIGATION .........................................................................................4
2.1. INTRODUCTION .......................................................................................................4
2.2. INTERFACE SHEAR FRICTION .............................................................................4
2.2.1. Shear Friction. ...................................................................................................4
2.2.2. Shear Friction Mechanism. ...............................................................................5
2.2.2.1. Coefficient of friction. .........................................................................6
2.2.2.2. Effective coefficient of friction. ..........................................................7
2.3. SHEAR FRICTION DESIGN PROVISIONS ............................................................7
2.3.1. PCI Design Handbook. .....................................................................................7
2.3.1.1. PCI Design Handbook 6th
Edition. ......................................................7
2.3.1.2. PCI Design Handbook 7th
Edition. ......................................................8
2.3.1.3. ACI 318 Code. .....................................................................................9
2.4. PREVIOUS STUDIES ..............................................................................................10
2.4.1. Hanson, 1960. .................................................................................................10
2.4.2. Birkeland and Birkeland, 1966 .......................................................................10
2.4.3. Mast, 1968.......................................................................................................11
2.4.4. Hofbeck, Ibrahim, and Mattock, 1969 ............................................................11
2.4.5. Mattock and Hawkins, 1972 ...........................................................................12
2.4.6. Paulay, Park, and Phillips, 1974 .....................................................................14
2.4.7. Mattock, Johal, and Chow, 1975. .................................................................. 14
iv
2.4.8. Mattock, Li, and Wang, 1976. ........................................................................15
2.4.9. Shaihk, 1978. ..................................................................................................16
2.4.10. Hsu, Mau, and Chen, 1987............................................................................16
2.4.11. Hoff, 1993. ....................................................................................................16
2.4.12. Mattock, 2001. .............................................................................................17
2.4.13. Kahn and Mitchell, 2002...............................................................................17
2.4.14. Tanner, 2008. ................................................................................................18
2.4.15. Harries, Zeno, and Shahrooz, 2012. ..............................................................18
2.5. PRECAST PRODUCER SURVEY ..........................................................................19
3. EXPERIMENTAL PROGRAM ................................................................................................21
3.1. INTRODUCTION .....................................................................................................21
3.2. SPECIMEN DESIGN ................................................................................................21
3.3. MATERIALS ............................................................................................................22
3.3.1. Aggregates. .....................................................................................................23
3.3.1.1. Normalweight aggregates ..................................................................23
3.3.1.2. Lightweight aggregates. ....................................................................23
3.3.1.2.1. Lightweight aggregate saturation. ...........................................23
3.3.1.2.2. Lightweight aggregate gradations. ..........................................24
3.3.1.2.3. Lightweight aggregate properties. ..........................................24
3.3.2. Concrete Mixtures. ..........................................................................................25
3.3.2.1. Normalweight concrete. ....................................................................28
3.3.2.2. Sand-lightweight concrete. ................................................................28
3.3.2.3. All-lightweight concrete. ...................................................................28
3.3.3. Reinforcing Steel Bars. ...................................................................................30
3.4. SPECIMEN FABRICATION. ..................................................................................31
3.4.1. Reinforcing Steel Bar Cage Preparation. ........................................................31
3.4.2. Formwork and Assembly. .............................................................................. 32
3.4.3. Concrete Placement and Shear Interface Preparation .....................................32
3.4.4. Curing. ............................................................................................................34
3.5. TEST SETUP ............................................................................................................35
3.5.1. Support Conditions. ........................................................................................35
v
3.5.2. Loading Protocol. ............................................................................................37
3.5.3. Flange Prestressing/Confinement Systems. ....................................................37
3.5.3.1. Primary flange prestressing/confinement system. .............................37
3.5.3.2. Secondary flange prestressing/confinement system. .........................37
3.5.4. Data Acquisition and Instrumentation. ...........................................................40
3.5.4.1. Direct current-LVDTs .......................................................................40
3.5.4.2. Strain gages. ......................................................................................41
3.6. TEST RESULTS .......................................................................................................42
3.6.1. Normalweight Concrete Specimens. ...............................................................44
3.6.1.1. 5000 psi specimens. ...........................................................................44
3.6.1.2. 8000 psi specimens. ...........................................................................47
3.6.2. Sand-lightweight Concrete Specimens. ..........................................................50
3.6.2.1. 5000 psi specimens. ...........................................................................50
3.6.2.2. 8000 psi specimens. ...........................................................................52
3.6.3. All-lightweight Concrete Specimens. .............................................................56
3.6.3.1. 5000 psi specimens. .........................................................................56
3.6.3.2. 8000 psi specimens. ...........................................................................57
4. ANALYSIS AND DISCUSSION..............................................................................................61
4.1. INTRODUCTION .....................................................................................................61
4.2. GENERAL BEHAVIOR ...........................................................................................61
4.2.1. Cracking. .........................................................................................................61
4.2.2. Applied Shear Force – Slip Relations. ............................................................61
4.2.3. Applied Shear Force – Interface Strain Relations. ......................................... 62
4.3. INFLUENCE OF TEST VARIABLES .....................................................................64
4.3.1. Effect of Concrete Unit Weight. .....................................................................66
4.3.2. Effect of Concrete Compressive Strength.......................................................70
4.3.3. Effect of Shear Interface Preparation. .............................................................75
4.4. COMPARISON TO PCI AND ACI DESIGN PROVISIONS .................................79
4.4.1. Shear Friction Design Provisions....................................................................79
4.4.1.1. PCI Design Handbook 6th
Edition (2004). ........................................80
4.4.1.2. PCI Design Handbook 7th
Edition (2011). ........................................81
vi
4.4.1.3. ACI 318-11. .......................................................................................82
4.4.2. Shear Strength. ................................................................................................83
4.4.3. Effective Coefficient of Friction, μe................................................................87
4.5. COMPARISON TO PREVIOUS STUDIES ............................................................92
5. SUMMARY, CONCLUSIONS, AND RECOMMENDATIONS ............................................94
5.1. SUMMARY ..............................................................................................................94
5.2. CONCLUSIONS .......................................................................................................94
5.3. RECOMMENDATIONS FOR DESIGN EQUATIONS ..........................................95
5.4. RECOMMENDATIONS FOR FUTURE WORK ....................................................95
REFERENCES ..............................................................................................................................97
ACKNOWLEDGMENTS ...........................................................................................................101
APPENDIX ..................................................................................................................................102
vii
LIST OF FIGURES
Page
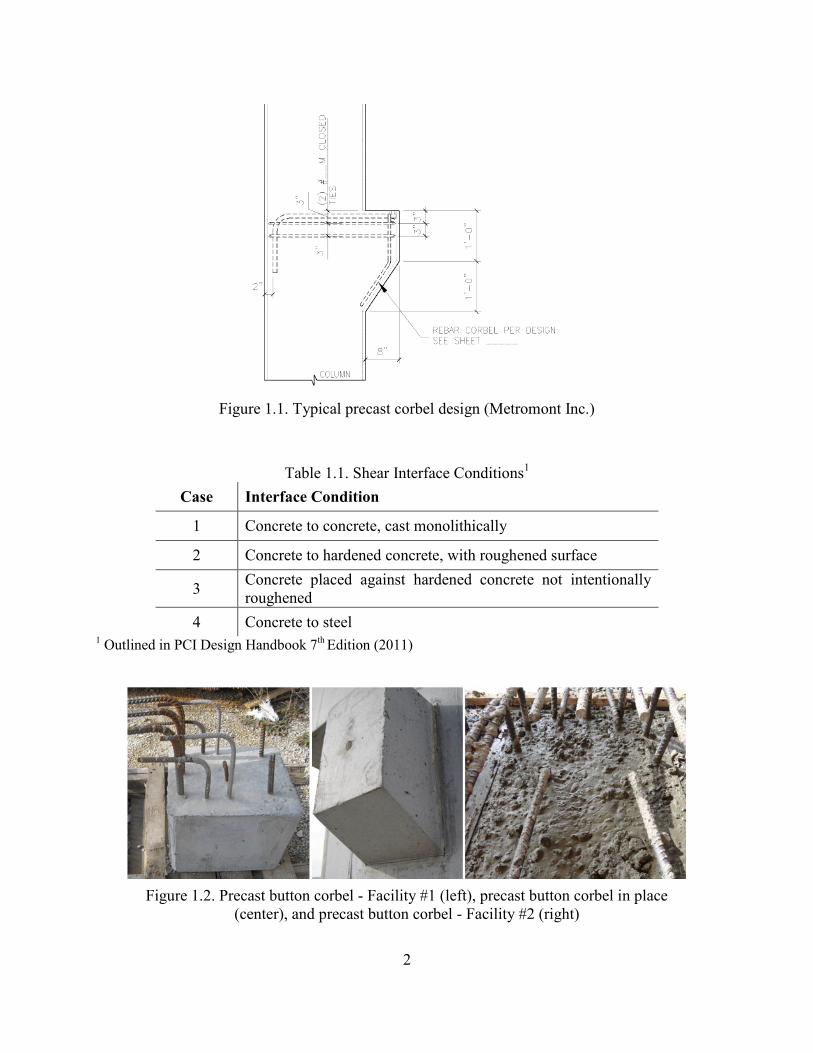
Figure 1.1. Typical precast corbel design (Metromont Inc.) ......................................................2
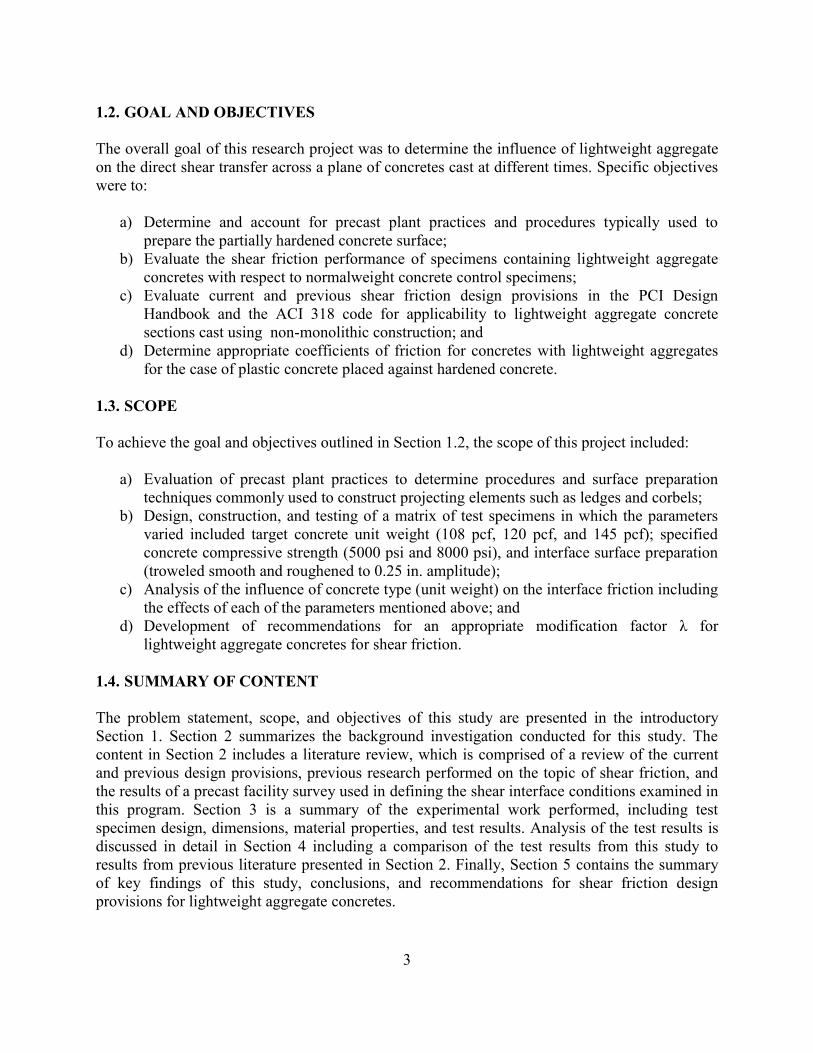
Figure 1.2. Precast button corbel - Facility #1 (left), precast button corbel in place (center),
and precast button corbel - Facility #2 (right) .........................................................2
Figure 2.1. Shear friction hypothesis adapted from Birkeland and Birkeland (Birkeland and
Birkeland 1966) .......................................................................................................5
Figure 2.2. Simplified shear friction mechanism .......................................................................6
Figure 2.3. Separation due to shear along a crack (Mast 1968) ...............................................11
Figure 2.4. Shear transfer test specimens by Mattock and Hawkins (1972):
push-off, pull-off, and modified push-off from left to right ..................................13
Figure 2.5. Shear transfer in initially uncracked concrete
(Mattock and Hawkins 1972).................................................................................13
Figure 2.6. Test specimen used by Pauley et al. (1974) ...........................................................14
Figure 2.7. Corbel type push-off specimen, left, and compression with applied
tension push-off specimen, right, by Mattock et al. (1975) ...................................15
Figure 2.8. Typical design of push-off specimens by Kahn and Mitchell (2002) ....................18
Figure 2.9. Test specimen and instrumentation arrangement by Harries et al. (2012) ............19
Figure 2.10. Precast facility #1 button corbel (top-left), final placement of corbel
(top-right), and precast facility #2 button corbel (bottom) ....................................20
Figure 3.1. Specimen designation notation ..............................................................................21
Figure 3.2. Aggregate saturation tank ......................................................................................24
Figure 3.3. Rotary drum mixer .................................................................................................26
Figure 3.4. Pressure meter, volumetric meter, and modulus of elasticity yoke
(from left to right) ..................................................................................................27
Figure 3.5. Tinius Olsen load frame .........................................................................................27
Figure 3.6. Typical stress vs. strain for reinforcing steel bar tensile coupon tests. ..................31
Figure 3.7. Reinforcing steel bar cage detail ............................................................................32
Figure 3.8. Test specimen formwork........................................................................................32
Figure 3.9. Specialized roughening instrument and technique ................................................33
Figure 3.10. Surface roughness measurement ............................................................................34
viii
Figure 3.11. Initial specimen fixity conditions and instrumentation ..........................................36
Figure 3.12. Premature flange failure .........................................................................................36
Figure 3.13. Primary and secondary flange confinement systems .............................................38
Figure 3.14. DC-LVDT instrumentation setup ..........................................................................40
Figure 3.15. DC-LVDT integral mounting bolts ........................................................................41
Figure 3.16. Strain gage protection and locations ......................................................................42
Figure 3.17. Applied shear force vs. slip relations for 5000 psi normalweight concrete
specimens. ..............................................................................................................44
Figure 3.18. Applied shear force vs. interface dilation for 5000 psi normalweight concrete
specimens. ..............................................................................................................45
Figure 3.19. Slip vs. dilation for 5000 psi normalweight concrete specimens. ..........................45
Figure 3.20. Applied shear force vs. interface steel strain for 5000 psi normalweight concrete
specimens. ..............................................................................................................46
Figure 3.21. Slip vs. interface steel strain for 5000 psi normalweight concrete specimens. ......46
Figure 3.22. Applied shear force vs. slip relations for 8000 psi normalweight concrete
specimens. ..............................................................................................................47
Figure 3.23. Applied shear force vs. interface dilation for 8000 psi normalweight concrete
specimens. ..............................................................................................................48
Figure 3.24. Slip vs. dilation for 8000 psi normalweight concrete specimens. ..........................48
Figure 3.25. Applied shear force vs. interface steel strain for 8000 psi normalweight concrete
specimens. ..............................................................................................................49
Figure 3.26. Slip vs. interface steel strain for 8000 psi normalweight concrete specimens. ......49
Figure 3.27. Applied shear force vs. slip relations for 5000 psi sand-lightweight concrete
specimens. ..............................................................................................................50
Figure 3.28. Applied shear force vs. interface dilation for 5000 psi sand-lightweight concrete
specimens. ..............................................................................................................51
Figure 3.29. Slip vs. dilation for 5000 psi sand-lightweight concrete specimens. .....................51
Figure 3.30. Applied shear force vs. interface steel strain for 5000 psi sand-lightweight
concrete specimens. ...............................................................................................52
Figure 3.31. Slip vs. interface steel strain for 5000 psi sand-lightweight concrete specimens ..52
Figure 3.32. Flange failure of specimen S-8-R-1 .......................................................................53
ix
Figure 3.33. Applied shear force vs. slip relations for 8000 psi sand-lightweight concrete
specimens. ..............................................................................................................53
Figure 3.34. Applied shear force vs. interface dilation for 8000 psi sand-lightweight concrete
specimens. ..............................................................................................................54
Figure 3.35. Slip vs. dilation for 8000 psi sand-lightweight concrete specimens. .....................54
Figure 3.36. Applied shear force vs. interface steel strain for 8000 psi sand-lightweight
concrete specimens. ...............................................................................................55
Figure 3.37. Slip vs. interface steel strain for 8000 psi sand-lightweight concrete specimens. .55
Figure 3.38. Applied shear force vs. slip relations for 5000 psi all-lightweight concrete
specimens. ..............................................................................................................56
Figure 3.39. Applied shear force vs. dilation of 5000 psi all-lightweight concrete specimens. 57
Figure 3.40. Slip vs. dilation for 5000 psi all-lightweight concrete specimens. ........................57
Figure 3.41. Applied shear force vs. interface steel strain for 5000 psi all-lightweight concrete
specimens. ..............................................................................................................58
Figure 3.42. Slip vs. interface steel strain for 5000 psi all-lightweight concrete specimens. ....58
Figure 3.43. Applied shear force vs. slip relations for 8000 psi all-lightweight concrete
specimens. ..............................................................................................................59
Figure 3.44. Applied shear force vs. dilation relations for 8000 psi all-lightweight concrete
specimens. ..............................................................................................................60
Figure 3.45. Slip vs. dilation for 8000 psi all-lightweight concrete specimens. ........................60
Figure 4.1. Typical failure crack along shear plane for specimens with smooth interface (left)
and roughened interface (right) ..............................................................................61
Figure 4.2. Typical shear stress-interface reinforcement strain plots for the determination of
interface cracking stress (Specimens N-8-S-2 and N-8-R-1 shown) .....................63
Figure 4.3. Average interface cracking stress, vcr for all series ................................................63
Figure 4.4. Shear strength vu versus concrete unit weight for all specimens ...........................67
Figure 4.5. Average shear strength vu versus concrete unit weight for each series ..................67
Figure 4.6. Normalized shear strength vu versus concrete unit weight for all specimens ........68
Figure 4.7. Normalized average shear strength vu versus concrete unit weight for each
series ......................................................................................................................68
Figure 4.8. Residual shear strength vur versus concrete unit weight for all specimens ............69
x
Figure 4.9. Average residual shear strength vur versus concrete unit weight for each series. ..69
Figure 4.10. Normalized residual shear strength vur versus concrete unit weight for all
specimens ...............................................................................................................70
Figure 4.11. Normalized average residual shear strength vur versus concrete unit weight for
each series ..............................................................................................................70
Figure 4.12. Effect of concrete strength for normalweight smooth interface specimens. ..........71
Figure 4.13. Effect of concrete strength for normalweight roughened interface specimens. .....72
Figure 4.14. Effect of concrete strength for sand-lightweight smooth interface specimens. .....72
Figure 4.15. Effect of concrete strength for sand-lightweight roughened interface specimens. 73
Figure 4.16. Effect of concrete strength for all-lightweight smooth interface specimens. ........73
Figure 4.17. Effect of concrete strength for all-lightweight roughened interface specimens. ...74
Figure 4.18. Effect of concrete compressive strength on the average ultimate shear stress for
each specimen series ..............................................................................................75
Figure 4.19. Effect of interface roughness on the applied shear force for 5000 psi
normalweight concrete specimens .........................................................................76
Figure 4.20. Effect of interface roughness on the applied shear force for 8000 psi
normalweight concrete specimens .........................................................................77
Figure 4.21. Effect of interface roughness on the applied shear force for 5000 psi
sand-lightweight concrete specimens ....................................................................77
Figure 4.22. Effect of interface roughness on the applied shear force for 8000 psi
sand-lightweight concrete specimens ....................................................................78
Figure 4.23. Effect of interface roughness on the applied shear force for 5000 psi
all-lightweight concrete specimens ........................................................................78
Figure 4.24. Effect of interface roughness on the applied shear force for 8000 psi
all-lightweight concrete specimens ........................................................................79
Figure 4.25. Comparison of shear strength vu with Equations 4.6 and 4.10 for normalweight
concrete specimens with a smooth interface ..........................................................84
Figure 4.26. Comparison of shear strength vu with Equations 4.6 and 4.10 for normalweight
concrete specimens with a roughened interface .....................................................84
Figure 4.27. Comparison of shear strength vu with Equations 4.6 and 4.10 for sand-lightweight
concrete specimens with a smooth interface ..........................................................85
xi
Figure 4.28. Comparison of shear strength vu with Equations 4.6 and 4.10 for sand-lightweight
concrete specimens with a roughened interface .....................................................85
Figure 4.29. Comparison of shear strength vu with Equations 4.6 and 4.10 for all-lightweight
concrete specimens with a smooth interface ..........................................................86
Figure 4.30. Comparison of shear strength vu with Equations 4.6 and 4.10 for all-lightweight
concrete specimens with a roughened interface .....................................................86
Figure 4.31. Evaluation of the effective coefficient of friction for normalweight smooth
interface concrete ...................................................................................................88
Figure 4.32. Evaluation of the effective coefficient of friction for normalweight roughened
interface concrete ...................................................................................................88
Figure 4.33. Evaluation of the effective coefficient of friction for sand-lightweight smooth
interface concrete ...................................................................................................89
Figure 4.34. Evaluation of the effective coefficient of friction for sand-lightweight roughened
interface concrete ...................................................................................................89
Figure 4.35. Evaluation of the effective coefficient of friction for all-lightweight smooth
interface concrete ...................................................................................................90
Figure 4.36. Evaluation of the effective coefficient of friction for all-lightweight roughened
interface concrete ...................................................................................................90
Figure 4.37. Evaluation of the effective coefficient of friction for smooth interface specimens
(μ=0.6) where λ=1.0 for all concrete types. ...........................................................91
Figure 4.38. Evaluation of the effective coefficient of friction for roughened interface
specimens (μ=1.0) where λ=1.0 for all concrete types. .........................................92
Figure 4.39. Comparison of shear strength vu for specimens with different interface conditions
for sand-lightweight concrete ................................................................................93
Figure 4.40. Comparison of shear strength vu for specimens with different interface conditions
for all-lightweight concrete ....................................................................................93
xii
LIST OF TABLES
Page
Table 1.1. Shear Interface Conditions .......................................................................................2
Table 2.1. Shear Friction Coefficients for PCI Design Handbook 6th
Edition (2004) ..............8
Table 2.2. Shear Friction Coefficients for PCI Design Handbook 7th
Edition (2011) ..............9
Table 3.1. Test Specimen Matrix ............................................................................................22
Table 3.2. Lightweight Aggregate Gradations ........................................................................25
Table 3.3. Lightweight Aggregate Material Properties ...........................................................25
Table 3.4. Concrete Mixture Proportions ................................................................................29
Table 3.5. Plastic Concrete Properties ....................................................................................29
Table 3.6. Hardened Concrete Properties ...............................................................................30
Table 3.7. Reinforcing Steel Bar Properties ...........................................................................30
Table 3.8. Average Measured Surface Roughness .................................................................34
Table 3.9. Specimen Casting and Test Dates ..........................................................................35
Table 3.10. Prestressing System Application............................................................................39
Table 3.11. Summary of Testing Results ..................................................................................43
Table 4.1. Average Interface Cracking Stress for All Series ..................................................64
Table 4.2. Summary of Test Results and Analysis .................................................................65
Table 4.3. Effect of Concrete Compressive Strength on the Average Ultimate Shear Stres for
Each Specimen Series ............................................................................................74
Table 4.4. Effect of Interface Preparation on the Ultimate Shear Capacity ............................79
Table 4.5. Limits for Applied Shear of Shear Friction Elements. ..........................................80
Table 4.6. Shear Friction Coefficients Recommended for Design .........................................80
Table 4.7. Values for µ and λ with Respect to Concrete Type and Interface Condition ........80
xiii
NOMENCLATURE
Symbol Description
Acr area of concrete shear interface, in2
Avf area of shear reinforcement across shear plane, in2
f'c 28-day concrete compressive strength, lb/in2
fct tensile strength of concrete, measured by splitting tensile strength, lb/in2
fs stress in reinforcement, lb/in2
fy yield stress of reinforcement, lb/in2
Pc active clamping force, lb
V shear force, lb
Vn nominal shear strength, lb
vn nominal shear stress, lb/in2
Vu ultimate shear strength, lb
vu ultimate shear stress, lb/in2
angle relative to interface
λ modification factor reflecting the reduced mechanical properties of lightweight
concrete, relative to normalweight concrete of the same compressive strength.
µ coefficient of friction
µe effective coefficient of friction
µk coefficient of kinetic friction
µs coefficient of static friction
ρ shear friction reinforcement ratio, Av/Ac
normal stress, lb/in2
shear stress, lb/in2
ϕ capacity reduction factor
ACI American Concrete Institute
ASCE American Society of Civil Engineers
ASTM American Society for Testing and Materials
DC-LVDT direct current - linear voltage displacement transducer
PCI Precast/Prestressed Concrete Institute
1
1. INTRODUCTION
1.1. PROBLEM STATEMENT
Lightweight aggregate concretes are being used increasingly in precast concrete construction to
reduce member weight and shipping costs. Precast concrete elements commonly incorporate
connections that are designed based on the shear friction concept to transfer forces across an
interface, such as the column corbel shown in Figure 1.1. Previous studies discussed in Section 2
have shown that interface surface preparation, reinforcement ratio, concrete strength, and
concrete type in terms of unit weight (normalweight, sand-lightweight, or all-lightweight) have
significant impacts on the shear transfer strength. The shear friction design provisions presented
in the PCI Design Handbook 7th
Edition (2011) and the ACI 318 code (2011) are largely
empirical and are based on physical test data, yet little data exist on specimens constructed with
lightweight aggregate concretes, especially for non-monolithic construction of the interface.
Shear friction design provisions in both the ACI 318 code (2011) and the PCI Design Handbook
7th
Edition (2011) include a modification factor λ that is intended to account for influence of
concrete unit weight on the resulting interface friction. In particular, the modification factor λ is
intended to account for reduced values of the mechanical properties of lightweight aggregate
concretes relative to normalweight concrete of the same compressive strength. The modification
factor λ is incorporated into the coefficient of friction µ in the PCI Design Handbook and the
ACI 318 code and into the effective coefficient of friction µe in the PCI Design Handbook.
To account for the influence of interface surface preparation, current shear friction design
provisions presented in the PCI Design Handbook 7th
Edition (2011) and the ACI 318 code
(2011) define four interface conditions (cases) summarized in Table 1.1. For each case, specific
values and limits on the coefficient of friction and maximum shear capacity are given. Cases 2
and 3 refer to a non-monolithic, or “cold-joint,” interface. Cold-joint conditions can be the result
of precast plant practices where a projecting element is cast in advance and then inserted into the
fresh concrete when the supporting element is cast or in the opposite sequence. For example,
Figure 1.2 shows precast column corbels that have been cast in advance of the supporting precast
column element. The far left and far right figures represent two corbels cast at two different
facilities. The resulting interface roughness contributes to two distinctly different shear interface
conditions shown in terms of surface roughness. The PCI Design Handbook also notes that the
use of self-consolidating concrete (SCC) can lead to conditions in which projecting elements are
cast against supporting elements after the concrete has partially hardened. The result may be a
cold-joint condition with a relatively smooth interface on the SCC concrete face on which fresh
concrete is placed.
This study examines the shear transfer of lightweight aggregate concretes across a cold-joint
with a roughened or smooth interface (Cases 2 and 3 in Table 1.1). Results are compared to
normalweight concrete of the same concrete strength and interface condition. This work is
needed to fill in a gap in the literature with respect to the direct shear transfer strength of
lightweight aggregate concretes across a non-monolithic interface. The topic of this research was
identified by the Precast/Prestressed Concrete Institute (PCI) as a key research need for the
precast concrete industry.
2
Figure 1.1. Typical precast corbel design (Metromont Inc.)
Table 1.1. Shear Interface Conditions1
Case Interface Condition
1 Concrete to concrete, cast monolithically
2 Concrete to hardened concrete, with roughened surface
3 Concrete placed against hardened concrete not intentionally
roughened
4 Concrete to steel 1 Outlined in PCI Design Handbook 7
th Edition (2011)
Figure 1.2. Precast button corbel - Facility #1 (left), precast button corbel in place
(center), and precast button corbel - Facility #2 (right)
3
1.2. GOAL AND OBJECTIVES
The overall goal of this research project was to determine the influence of lightweight aggregate
on the direct shear transfer across a plane of concretes cast at different times. Specific objectives
were to:
a) Determine and account for precast plant practices and procedures typically used to
prepare the partially hardened concrete surface;
b) Evaluate the shear friction performance of specimens containing lightweight aggregate
concretes with respect to normalweight concrete control specimens;
c) Evaluate current and previous shear friction design provisions in the PCI Design
Handbook and the ACI 318 code for applicability to lightweight aggregate concrete
sections cast using non-monolithic construction; and
d) Determine appropriate coefficients of friction for concretes with lightweight aggregates
for the case of plastic concrete placed against hardened concrete.
1.3. SCOPE
To achieve the goal and objectives outlined in Section 1.2, the scope of this project included:
a) Evaluation of precast plant practices to determine procedures and surface preparation
techniques commonly used to construct projecting elements such as ledges and corbels;
b) Design, construction, and testing of a matrix of test specimens in which the parameters
varied included target concrete unit weight (108 pcf, 120 pcf, and 145 pcf); specified
concrete compressive strength (5000 psi and 8000 psi), and interface surface preparation
(troweled smooth and roughened to 0.25 in. amplitude);
c) Analysis of the influence of concrete type (unit weight) on the interface friction including
the effects of each of the parameters mentioned above; and
d) Development of recommendations for an appropriate modification factor λ for
lightweight aggregate concretes for shear friction.
1.4. SUMMARY OF CONTENT
The problem statement, scope, and objectives of this study are presented in the introductory
Section 1. Section 2 summarizes the background investigation conducted for this study. The
content in Section 2 includes a literature review, which is comprised of a review of the current
and previous design provisions, previous research performed on the topic of shear friction, and
the results of a precast facility survey used in defining the shear interface conditions examined in
this program. Section 3 is a summary of the experimental work performed, including test
specimen design, dimensions, material properties, and test results. Analysis of the test results is
discussed in detail in Section 4 including a comparison of the test results from this study to
results from previous literature presented in Section 2. Finally, Section 5 contains the summary
of key findings of this study, conclusions, and recommendations for shear friction design
provisions for lightweight aggregate concretes.
4
2. BACKGROUND INVESTIGATION
2.1. INTRODUCTION
The design of reinforced concrete connections has been studied since the mid-20th
century. In
concrete elements such as corbels and ledger beams, discrete cracks may develop at an interface,
and the transfer of forces must bridge that crack. There are several mechanisms to transfer these
forces at these locations, one of which is friction of the interface. The transfer of shear at the
interface via friction is discussed in detail in Section 2.2. Shear friction studies that were
reviewed for this project are summarized in Section 2.3. Current and previous design provisions
for design using shear friction principles are presented in Section 2.4. Finally, findings from a
precast facility survey are presented in Section 2.5.
2.2. INTERFACE SHEAR FRICTION
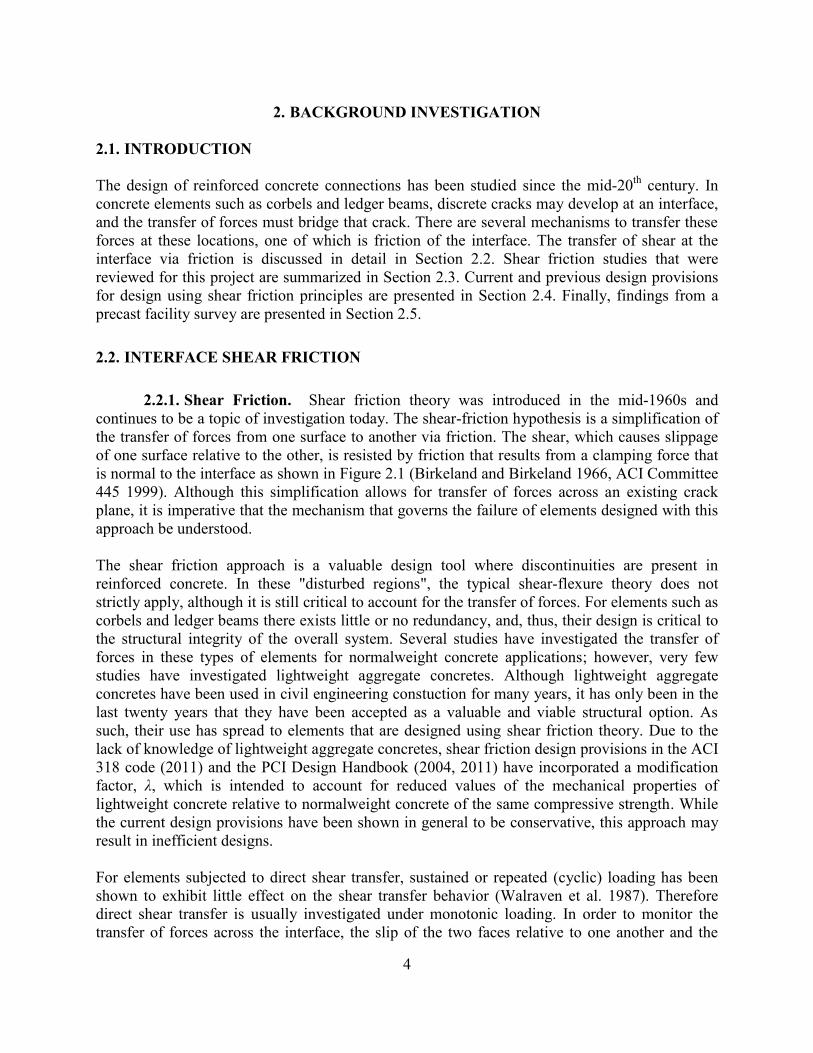
2.2.1. Shear Friction. Shear friction theory was introduced in the mid-1960s and
continues to be a topic of investigation today. The shear-friction hypothesis is a simplification of
the transfer of forces from one surface to another via friction. The shear, which causes slippage
of one surface relative to the other, is resisted by friction that results from a clamping force that
is normal to the interface as shown in Figure 2.1 (Birkeland and Birkeland 1966, ACI Committee
445 1999). Although this simplification allows for transfer of forces across an existing crack
plane, it is imperative that the mechanism that governs the failure of elements designed with this
approach be understood.
The shear friction approach is a valuable design tool where discontinuities are present in
reinforced concrete. In these "disturbed regions", the typical shear-flexure theory does not
strictly apply, although it is still critical to account for the transfer of forces. For elements such as
corbels and ledger beams there exists little or no redundancy, and, thus, their design is critical to
the structural integrity of the overall system. Several studies have investigated the transfer of
forces in these types of elements for normalweight concrete applications; however, very few
studies have investigated lightweight aggregate concretes. Although lightweight aggregate
concretes have been used in civil engineering constuction for many years, it has only been in the
last twenty years that they have been accepted as a valuable and viable structural option. As
such, their use has spread to elements that are designed using shear friction theory. Due to the
lack of knowledge of lightweight aggregate concretes, shear friction design provisions in the ACI
318 code (2011) and the PCI Design Handbook (2004, 2011) have incorporated a modification
factor, λ, which is intended to account for reduced values of the mechanical properties of
lightweight concrete relative to normalweight concrete of the same compressive strength. While
the current design provisions have been shown in general to be conservative, this approach may
result in inefficient designs.
For elements subjected to direct shear transfer, sustained or repeated (cyclic) loading has been
shown to exhibit little effect on the shear transfer behavior (Walraven et al. 1987). Therefore
direct shear transfer is usually investigated under monotonic loading. In order to monitor the
transfer of forces across the interface, the slip of the two faces relative to one another and the
5
dilation of the crack that develops along the shear plane must be measured. In addition to these
measurements, it is beneficial to monitor strain levels in any reinforcing steel crossing the plane.
In doing so, it is possible to determine the clamping force normal to the shear plane, as well as
cohesion of the two surfaces of the interface.
Figure 2.1. Shear friction hypothesis adapted from Birkeland and Birkeland (Birkeland and
Birkeland 1966)
2.2.2. Shear Friction Mechanism. Interface shear transfer is a function of the shear
interface condition. While concrete is generally strong in direct shear, cracks may form at any
location under various loading conditions. The current ACI 318 code provisions assume that
such a crack will form along the shear plane and that reinforcement is provided across the crack
location (ACI Committee 318 2011). Accordingly, for the case of monolithic concrete, the shear
plane may be either initially uncracked or cracked (also referred to as precracked). On the other
hand, a non-monolithic (or cold-joint) condition may exist as a result of concrete placement
practices where the concrete on either side of the shear plane was placed at different times.
In addition to interface condition, several factors have been shown to influence the ultimate shear
transfer strength across an interface. These factors include aggregate interlock, the presence of
shear reinforcement and any resulting dowel action, the interface surface preparation, the type of
aggregate used, and any constraints applied normal to the shear plane (Hsu, Mau, and Chen
1987). Other researchers including Mattock, Raths, and Walraven have determined that cohesion
of the interface plays a significant role in the shear friction mechanism. An example of the
evaluation of the cohesion component is shown in Section 2.4.5.
It should be noted that for concrete elements cast monolithically, the shear friction model is not
applicable until a crack develops along the interface and the two surfaces “engage” one another.
In order to engage the two surfaces, the concrete from one surface must interact with that of the
other surface. The aggregate present along the shear plane will cause roughness that will in turn
cause separation of the two faces. This interaction mechanism is only possible if the separation
of the two faces is restrained either internally or with some external system. If this restraint is
provided, friction between the two surfaces is introduced, and the shear is transferred via shear
friction. This interaction is important for two reasons with respect to elements without a crack
along the shear plane. First, a relatively high force is required to induce the crack and engage the
6
two surfaces. After the crack develops, the aggregate will interlock, and friction is introduced. As
a result, the peak load applied (Vu) may be significantly higher than the residual capacity (Vur).
Second, after the crack is induced, further reduction in load will occur as the slip increases due to
the shearing of aggregate along the shear plane resulting in a smoother interface. The presence or
absence of a crack at the shear friction interface represents a challenge when determining the
appropriate coefficient of friction for use in the shear friction model.
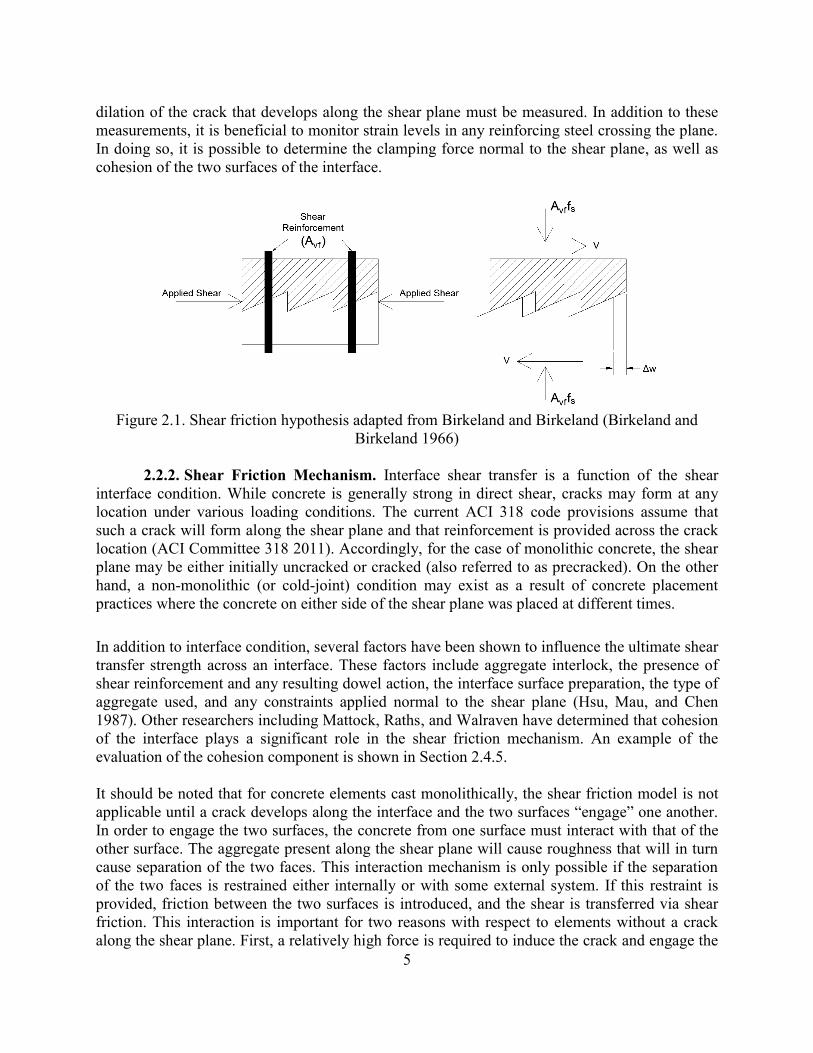
2.2.2.1. Coefficient of friction. While the traditional coefficient of friction is not
applicable for concrete elements cast monolithically, the shear friction design provisions are
based on the assumption that a crack will form along the shear plane and that friction will
develop. Equation 2.1 can be derived from classical mechanics where F is the peak applied shear
force, μ is coefficient of friction, and N is the normal clamping force. This relationship is shown
in Figure 2.2 (note that μ can also be referred to the static coefficient of friction μs as indicated in
Figure 2.2.).
fF N (2.1)
The coefficient of friction μ is equal to the ratio of the shear stress τ to the normal stress σ acting
across the shear interface. Manipulation of these parameters leads to the calculation shown in
Equation 2.2, where Acv is the area of the shear interface, Avffs is the passive clamping force
provided by the reinforcing steel, V is the shear applied to the interface, and Pc is the active
clamping force (external), if present.
( )
cv
vf s c sf s c
cv
VVA
A f P A f PA
(2.2)
Normal Clamping Force, N
Frictional
Force, Ff
Applied Shear
Force, F
Ff = μsN
Figure 2.2. Simplified shear friction mechanism
Normal Clamping Force, N
7
2.2.2.2. Effective coefficient of friction. Design provisions for shear friction in the PCI
Design Handbook 7th
Edition (2011) refer to an “effective coefficient of friction” term μe. This
term was introduced to include the cohesion between surfaces and to better predict the shear
transfer capacity based on available test data. The use of the effective coefficient of friction is
discussed in further detail in Section 2.3.1.1.
2.3. SHEAR FRICTION DESIGN PROVISIONS
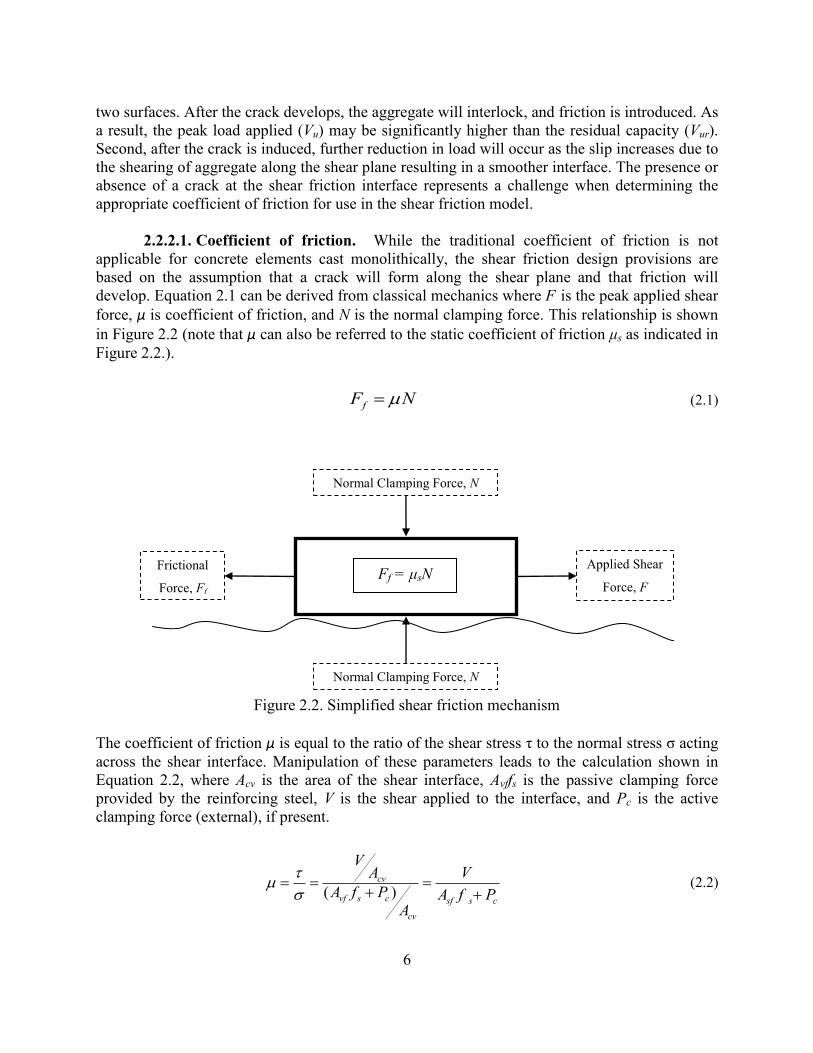
For design purposes, if there is no external clamping force, Equation 2.2 be rearranged in the
form of Equation 2.3 in terms of the area of shear reinforcement required across the shear plane,
noting that the design shear force is limited to V=Vn =Vu/ϕ, and the stress in the reinforcement fs
is limited to the yield stress fy.
u
vf
y
VA
f (2.3)
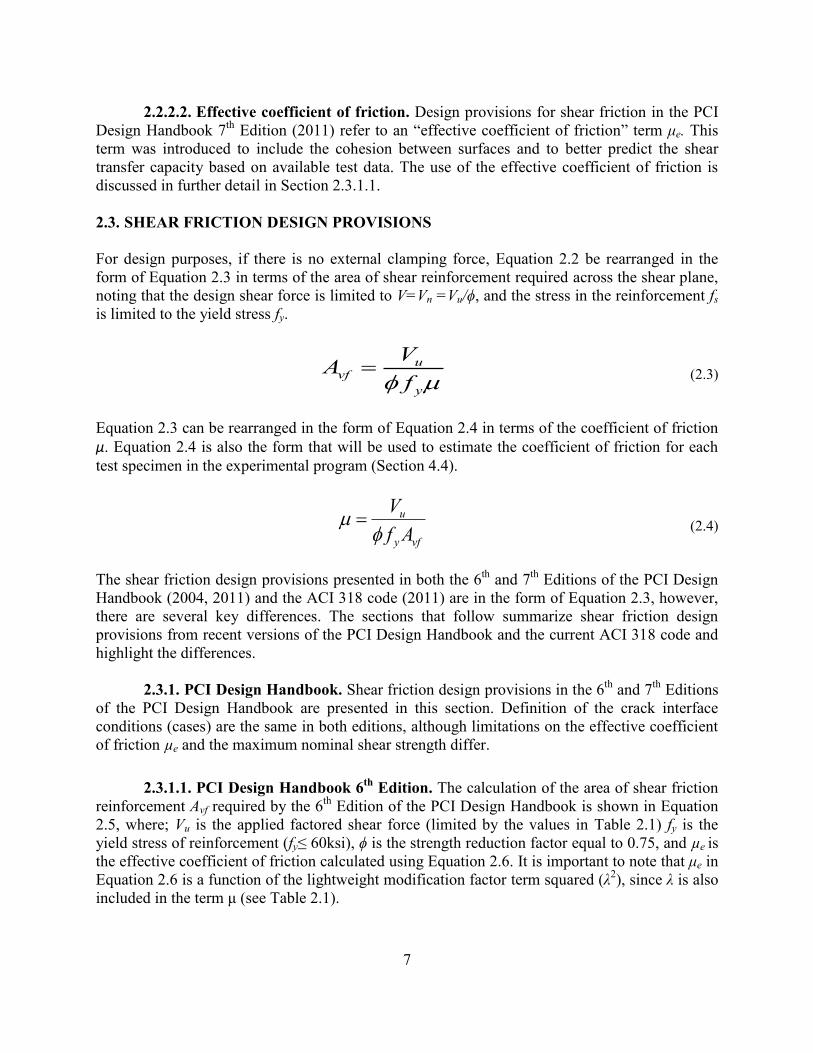
Equation 2.3 can be rearranged in the form of Equation 2.4 in terms of the coefficient of friction
μ. Equation 2.4 is also the form that will be used to estimate the coefficient of friction for each
test specimen in the experimental program (Section 4.4).
u
y vf
V
f A
(2.4)
The shear friction design provisions presented in both the 6th
and 7th
Editions of the PCI Design
Handbook (2004, 2011) and the ACI 318 code (2011) are in the form of Equation 2.3, however,
there are several key differences. The sections that follow summarize shear friction design
provisions from recent versions of the PCI Design Handbook and the current ACI 318 code and
highlight the differences.
2.3.1. PCI Design Handbook. Shear friction design provisions in the 6th
and 7th
Editions
of the PCI Design Handbook are presented in this section. Definition of the crack interface
conditions (cases) are the same in both editions, although limitations on the effective coefficient
of friction µe and the maximum nominal shear strength differ.
2.3.1.1. PCI Design Handbook 6
th Edition. The calculation of the area of shear friction
reinforcement Avf required by the 6th
Edition of the PCI Design Handbook is shown in Equation
2.5, where; Vu is the applied factored shear force (limited by the values in Table 2.1) fy is the
yield stress of reinforcement (fy≤ 60ksi), ϕ is the strength reduction factor equal to 0.75, and µe is
the effective coefficient of friction calculated using Equation 2.6. It is important to note that μe in
Equation 2.6 is a function of the lightweight modification factor term squared (λ2), since λ is also
included in the term μ (see Table 2.1).
8
u
vf
y e
VA
f (2.5)
1000 cre
u
A
V
(2.6)
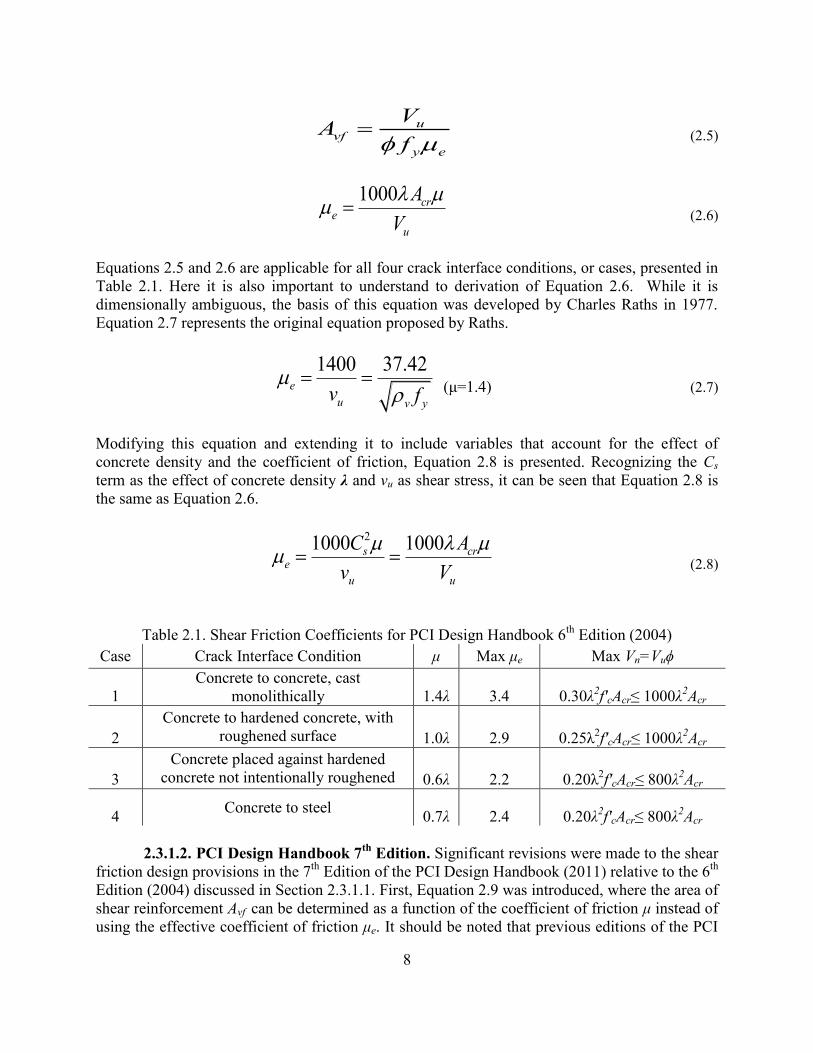
Equations 2.5 and 2.6 are applicable for all four crack interface conditions, or cases, presented in
Table 2.1. Here it is also important to understand to derivation of Equation 2.6. While it is
dimensionally ambiguous, the basis of this equation was developed by Charles Raths in 1977.
Equation 2.7 represents the original equation proposed by Raths.
1400 37.42e
u v yv f
(μ=1.4) (2.7)
Modifying this equation and extending it to include variables that account for the effect of
concrete density and the coefficient of friction, Equation 2.8 is presented. Recognizing the Cs
term as the effect of concrete density λ and vu as shear stress, it can be seen that Equation 2.8 is
the same as Equation 2.6.
21000 1000s cre
u u
C A
v V
(2.8)
Table 2.1. Shear Friction Coefficients for PCI Design Handbook 6th
Edition (2004)
Case Crack Interface Condition μ Max μe Max Vn=Vuϕ
1
Concrete to concrete, cast
monolithically 1.4λ 3.4 0.30λ2f'cAcr≤ 1000λ
2Acr
2
Concrete to hardened concrete, with
roughened surface 1.0λ 2.9 0.25λ2f'cAcr≤ 1000λ
2Acr
3
Concrete placed against hardened
concrete not intentionally roughened 0.6λ 2.2 0.20λ2f'cAcr≤ 800λ
2Acr
4 Concrete to steel
0.7λ 2.4 0.20λ2f'cAcr≤ 800λ
2Acr
2.3.1.2. PCI Design Handbook 7th
Edition. Significant revisions were made to the shear
friction design provisions in the 7th
Edition of the PCI Design Handbook (2011) relative to the 6th
Edition (2004) discussed in Section 2.3.1.1. First, Equation 2.9 was introduced, where the area of
shear reinforcement Avf can be determined as a function of the coefficient of friction μ instead of
using the effective coefficient of friction μe. It should be noted that previous editions of the PCI
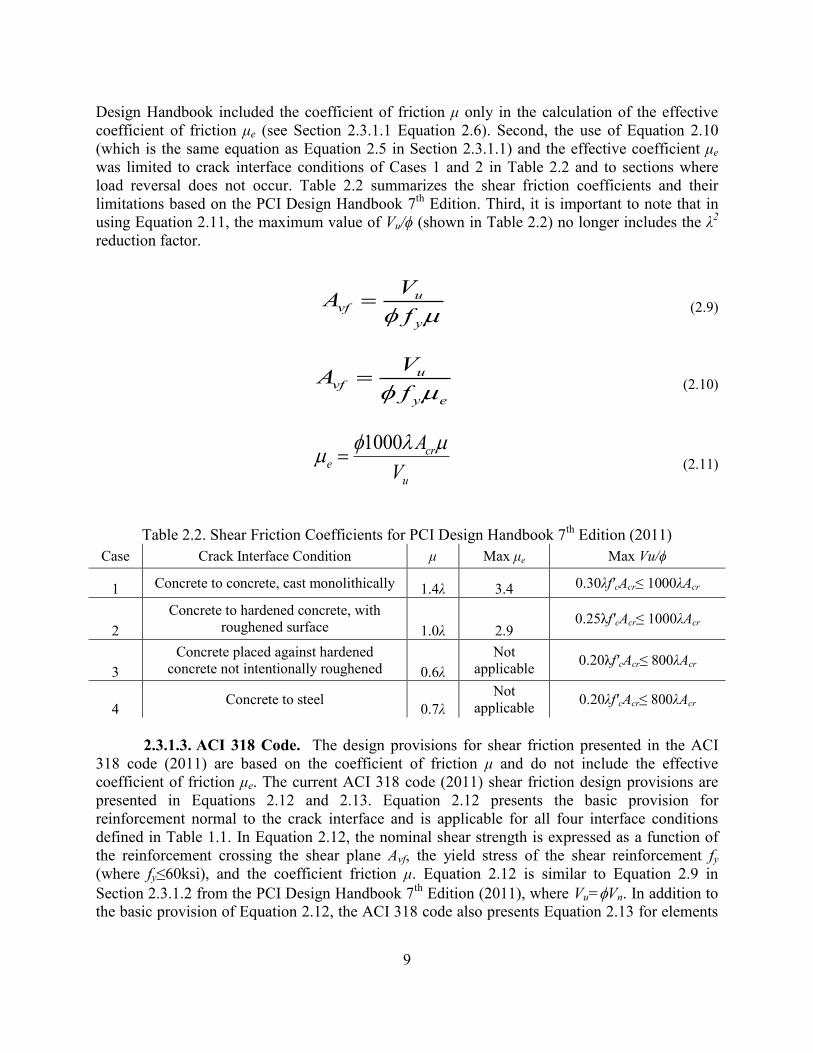
9
Design Handbook included the coefficient of friction μ only in the calculation of the effective
coefficient of friction μe (see Section 2.3.1.1 Equation 2.6). Second, the use of Equation 2.10
(which is the same equation as Equation 2.5 in Section 2.3.1.1) and the effective coefficient μe
was limited to crack interface conditions of Cases 1 and 2 in Table 2.2 and to sections where
load reversal does not occur. Table 2.2 summarizes the shear friction coefficients and their
limitations based on the PCI Design Handbook 7th
Edition. Third, it is important to note that in
using Equation 2.11, the maximum value of Vu/ϕ (shown in Table 2.2) no longer includes the λ2
reduction factor.
u
vf
y
VA
f (2.9)
u
vf
y e
VA
f (2.10)
1000 cre
u
A
V
(2.11)
Table 2.2. Shear Friction Coefficients for PCI Design Handbook 7th
Edition (2011)
Case Crack Interface Condition μ Max μe Max Vu/ϕ
1 Concrete to concrete, cast monolithically 1.4λ 3.4 0.30λf'cAcr≤ 1000λAcr
2
Concrete to hardened concrete, with
roughened surface 1.0λ 2.9 0.25λf'cAcr≤ 1000λAcr
3
Concrete placed against hardened
concrete not intentionally roughened 0.6λ
Not
applicable 0.20λf'cAcr≤ 800λAcr
4 Concrete to steel
0.7λ
Not
applicable 0.20λf'cAcr≤ 800λAcr
2.3.1.3. ACI 318 Code. The design provisions for shear friction presented in the ACI
318 code (2011) are based on the coefficient of friction μ and do not include the effective
coefficient of friction μe. The current ACI 318 code (2011) shear friction design provisions are
presented in Equations 2.12 and 2.13. Equation 2.12 presents the basic provision for
reinforcement normal to the crack interface and is applicable for all four interface conditions
defined in Table 1.1. In Equation 2.12, the nominal shear strength is expressed as a function of
the reinforcement crossing the shear plane Avf, the yield stress of the shear reinforcement fy
(where fy≤60ksi), and the coefficient friction μ. Equation 2.12 is similar to Equation 2.9 in
Section 2.3.1.2 from the PCI Design Handbook 7th
Edition (2011), where Vu=Vn. In addition to
the basic provision of Equation 2.12, the ACI 318 code also presents Equation 2.13 for elements
10
in which the shear reinforcement is oriented at an angle α to the interface. This parameter was
not investigated in this study, but the equation is presented here for completeness.
n vf yV A f (2.12)
( sin cos )n vf yV A f (2.13)
For normalweight concrete that is either placed monolithically or against hardened concrete that
has been roughened to an amplitude of 0.25 in., the maximum value of Vn in Equation 2.12 and
Equation 2.13 is the smallest of 0.2f'cAc, (480 + 0.08f'c)Ac, and 1600Ac. For all other cases, the
maximum value of Vn in Equation 2.12 and Equation 2.13 is the smallest of 0.2f'cAc and 800Ac.
2.4. PREVIOUS STUDIES
This section describes previous studies on shear transfer, and in particular shear friction, that
have led to shear friction design provisions and requirements for reinforced concrete structures.
These studies also served as the basis for designing the experiments discussed in Section 3.
2.4.1. Hanson, 1960. The study performed by Hanson in 1960 included the investigation
of precast bridge elements with respect to composite action between precast girders and cast-in-
place deck slabs. A total of 62 pushoff specimens and 10 precast T-shaped girders were tested to
investigate the horizontal shear mechanism. Test variables off this study included the effects of
adhesive bond, roughness, keys, and stirrups. The pushoff specimens in this study had variable
shear areas ranging from 48 in2 to 192 in
2. Concrete compressive strengths ranged from
approximately 3000 psi to 6000 psi. Reinforcing steel used was Grade 50. Key findings of this
investigation included:
1. Concrete strength was found to influence the initial peak values for all specimens
tested. However, concrete strength was not isolated systematically in this study.
2. The depth of the roughness at the interface was found to not affect the shear-
carrying capacity of the section.
3. Pushoff tests were shown to be valuable in determining the strength of horizontal
shear connection for composite action.
4. Further investigation was recommended to address the effects of concrete
strength, stirrup size, stirrup percentage, and repeated loading.
2.4.2. Birkeland and Birkeland, 1966. Birkeland and Birkeland’s 1966 paper discussed
the application of shear friction to precast concrete construction. The authors noted that for
elements such as corbels, bearing shoes, and ledger beams, there are situations where
conventional shear-flexure and principal tension analyses are not applicable. Therefore, the shear
friction model was developed as a simple physical model to explain the transfer of forces and
predict the lower-bound strength of the connection. Application of the shear friction design tool
to heavily loaded sections was discussed. In the Birkeland and Birkeland report, the role of
interface preparation was explained due to the nature of the shear friction hypothesis. Also, this
11
paper discussed the normal clamping force that is required in order to engage the friction aspect
of this model as shown in Figure 2.1.
The definition of shear friction developed in this reference is the basis for the current design
provisions in Section 2.3 of this report. Analysis of studies performed by Anderson (1960) and
Hanson (1960) resulted in the recommendation for limitations due to the bounds of the research
performed to date. These recommendations included a maximum reinforcing bar size of No. 6,
yield stress of interface reinforcement less than or equal to 60 ksi, a maximum reinforcement
ratio of 1.5%, a minimum concrete compressive strength of 4000 psi, and a limiting shear stress
of 800 psi. Additionally, the interface reinforcement should be fully anchored. Finally, for
elements cast non-monolithically, the authors indicated the interface should be cleaned of
laitance and any external loads accounted for.
2.4.3. Mast, 1968. The report presented by Mast in 1968 focused on the auxiliary
reinforcement in precast concrete connections. Elements of consideration were bearing shoes,
anchoring bars, and confining hoops. Mast discussed the inability to verify the presence, or
absence, of fabrication defects in precast connections. As a result, designers typically assume a
cracked condition for design of these elements. Where cracks in connections are present, the
shear friction hypothesis can be applied. As discussed in prior research, the rough surface
provided at the interface causes the elements to separate, or “dialate,” as shown in Figure 2.3,
and engage the auxiliary reinforcement. Mast also explained that the shear friction hypothesis
must account for any tension normal to the shear plane as it will have a significant influence on
the resulting frictional force and, in turn, the ultimate shear transfer capacity.
Figure 2.3. Separation due to shear along a crack (Mast 1968)
2.4.4. Hofbeck, Ibrahim, and Mattock, 1969. Hofbeck, Ibrahim, and Mattock’s study
(1969) tested the effects of a pre-existing crack, reinforcement variations, influence of concrete
strength, and dowel action present along the shear plane of precast concrete elements. A total of
38 shear push-off specimens were tested in the study. The average concrete compressive strength
was 4,500 psi, and reinforcement was provided normal to a 50 in2 shear plane. The concrete was
cast monolithically, and the maximum aggregate size used was 7/8 in. The external clamping
force was varied from 0 psi to 1,500 psi, and the yield stress of reinforcement ranged from 50 ksi
to 66 ksi. Two shear plane conditions were compared, initially cracked and initially uncracked.
In addition to shear plane condition, a series of the initially uncracked specimens had rubber
sleeves provided around the shear reinforcement in order to investigate the contribution of dowel
action to the shear friction model.
12
The testing procedure used was similar to that in other studies (Hoff 1993, Mattock 2001, Kahn
and Mitchell 2002). Pre-cracking was performed on some of the specimens to quantify the
strength of the connection in locations where cracks developed due to aspects such as shrinkage
or service level loads. Pre-cracking was completed by applying a line load to the shear interface
until a crack formed.
A concentric loading was provided with roller release to allow lateral translation. Measurements
including applied load and relative slip of elements were reported. A key conclusion of this study
was that dowel action of reinforcing bars crossing the shear plane provides minimal contribution
to ultimate shear in initially uncracked sections but is substantial for specimens with pre-existing
cracks. Another important conclusion was that with the presence of the pre-existing crack, a
reduction in ultimate shear transfer strength and increase in slip at all levels of load was
experienced.
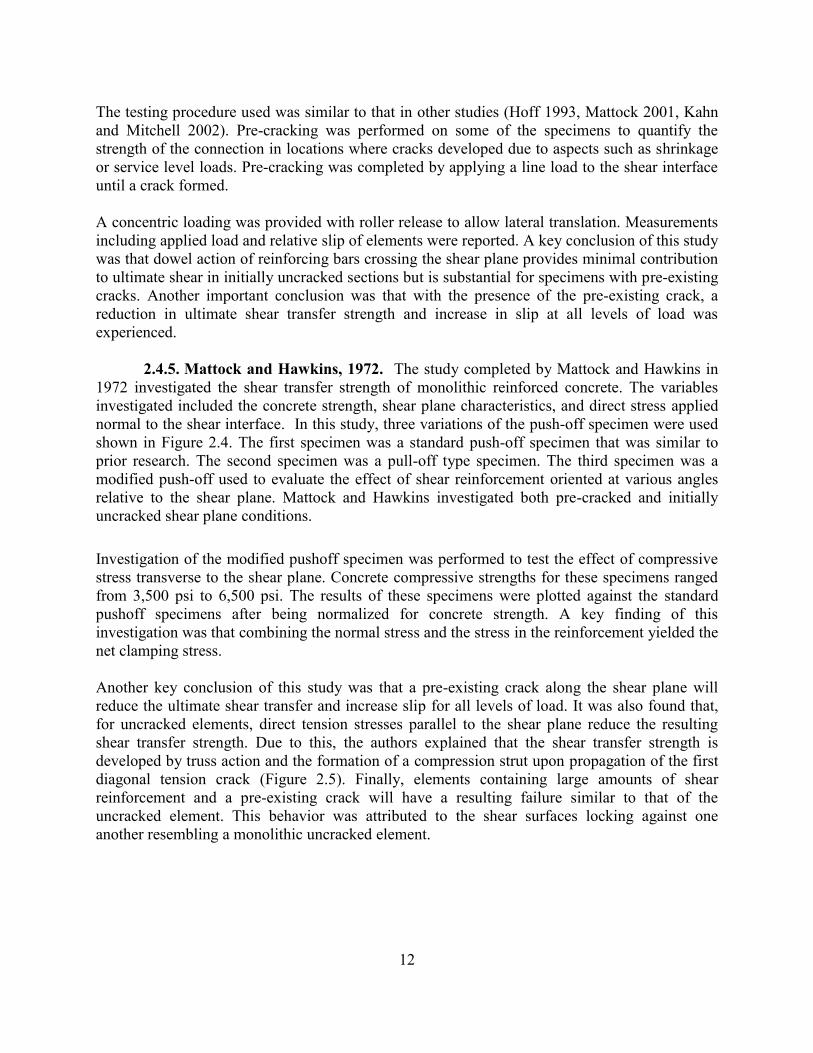
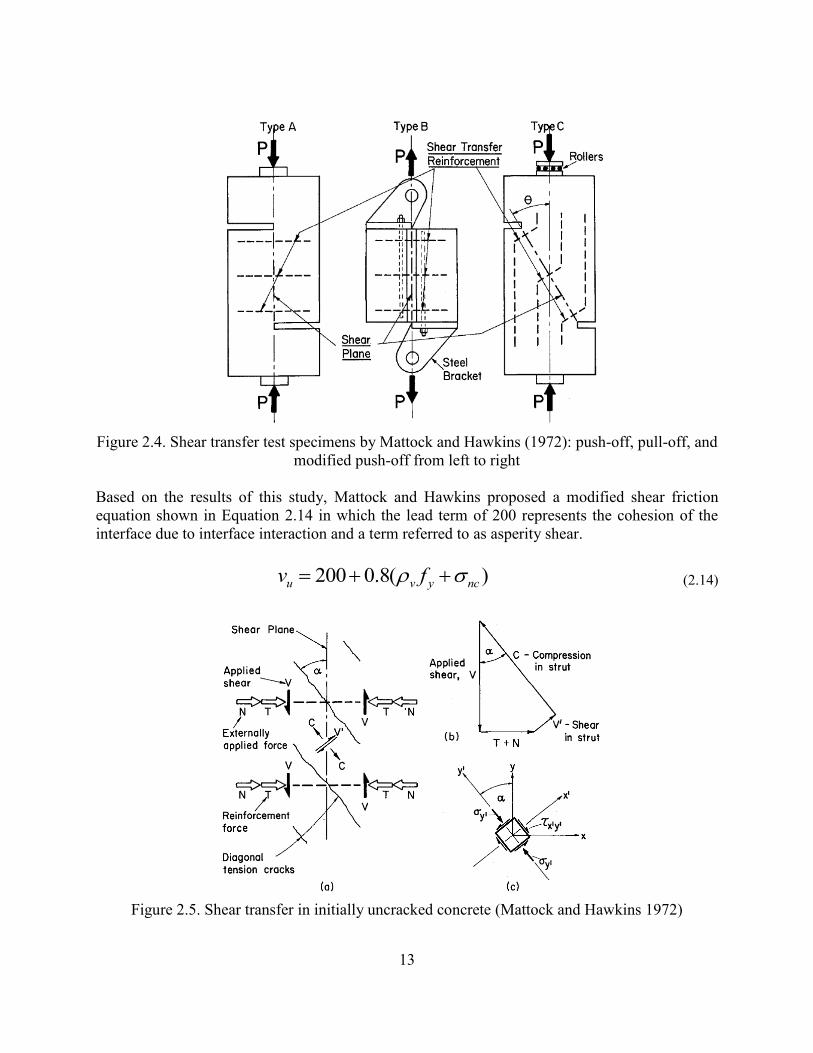
2.4.5. Mattock and Hawkins, 1972. The study completed by Mattock and Hawkins in
1972 investigated the shear transfer strength of monolithic reinforced concrete. The variables
investigated included the concrete strength, shear plane characteristics, and direct stress applied
normal to the shear interface. In this study, three variations of the push-off specimen were used
shown in Figure 2.4. The first specimen was a standard push-off specimen that was similar to
prior research. The second specimen was a pull-off type specimen. The third specimen was a
modified push-off used to evaluate the effect of shear reinforcement oriented at various angles
relative to the shear plane. Mattock and Hawkins investigated both pre-cracked and initially
uncracked shear plane conditions.
Investigation of the modified pushoff specimen was performed to test the effect of compressive
stress transverse to the shear plane. Concrete compressive strengths for these specimens ranged
from 3,500 psi to 6,500 psi. The results of these specimens were plotted against the standard
pushoff specimens after being normalized for concrete strength. A key finding of this
investigation was that combining the normal stress and the stress in the reinforcement yielded the
net clamping stress.
Another key conclusion of this study was that a pre-existing crack along the shear plane will
reduce the ultimate shear transfer and increase slip for all levels of load. It was also found that,
for uncracked elements, direct tension stresses parallel to the shear plane reduce the resulting
shear transfer strength. Due to this, the authors explained that the shear transfer strength is
developed by truss action and the formation of a compression strut upon propagation of the first
diagonal tension crack (Figure 2.5). Finally, elements containing large amounts of shear
reinforcement and a pre-existing crack will have a resulting failure similar to that of the
uncracked element. This behavior was attributed to the shear surfaces locking against one
another resembling a monolithic uncracked element.
13
Figure 2.4. Shear transfer test specimens by Mattock and Hawkins (1972): push-off, pull-off, and
modified push-off from left to right
Based on the results of this study, Mattock and Hawkins proposed a modified shear friction
equation shown in Equation 2.14 in which the lead term of 200 represents the cohesion of the
interface due to interface interaction and a term referred to as asperity shear.
200 0.8( )u v y ncv f (2.14)
Figure 2.5. Shear transfer in initially uncracked concrete (Mattock and Hawkins 1972)
14
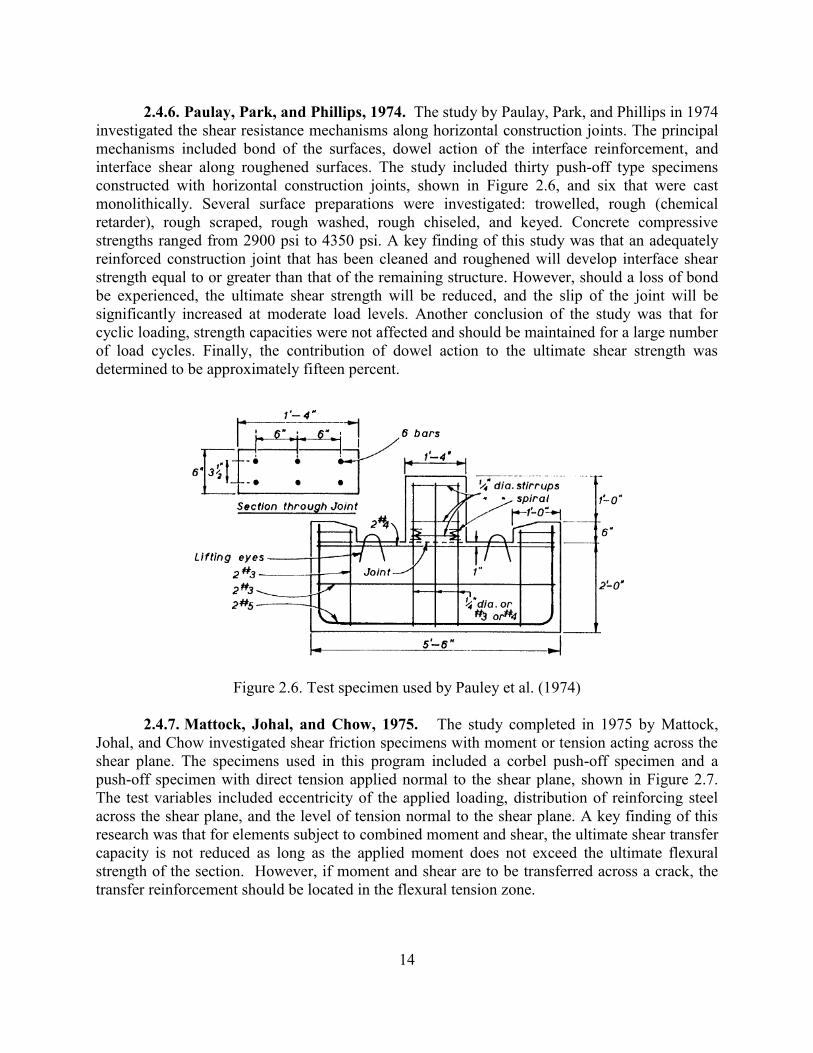
2.4.6. Paulay, Park, and Phillips, 1974. The study by Paulay, Park, and Phillips in 1974
investigated the shear resistance mechanisms along horizontal construction joints. The principal
mechanisms included bond of the surfaces, dowel action of the interface reinforcement, and
interface shear along roughened surfaces. The study included thirty push-off type specimens
constructed with horizontal construction joints, shown in Figure 2.6, and six that were cast
monolithically. Several surface preparations were investigated: trowelled, rough (chemical
retarder), rough scraped, rough washed, rough chiseled, and keyed. Concrete compressive
strengths ranged from 2900 psi to 4350 psi. A key finding of this study was that an adequately
reinforced construction joint that has been cleaned and roughened will develop interface shear
strength equal to or greater than that of the remaining structure. However, should a loss of bond
be experienced, the ultimate shear strength will be reduced, and the slip of the joint will be
significantly increased at moderate load levels. Another conclusion of the study was that for
cyclic loading, strength capacities were not affected and should be maintained for a large number
of load cycles. Finally, the contribution of dowel action to the ultimate shear strength was
determined to be approximately fifteen percent.
Figure 2.6. Test specimen used by Pauley et al. (1974)
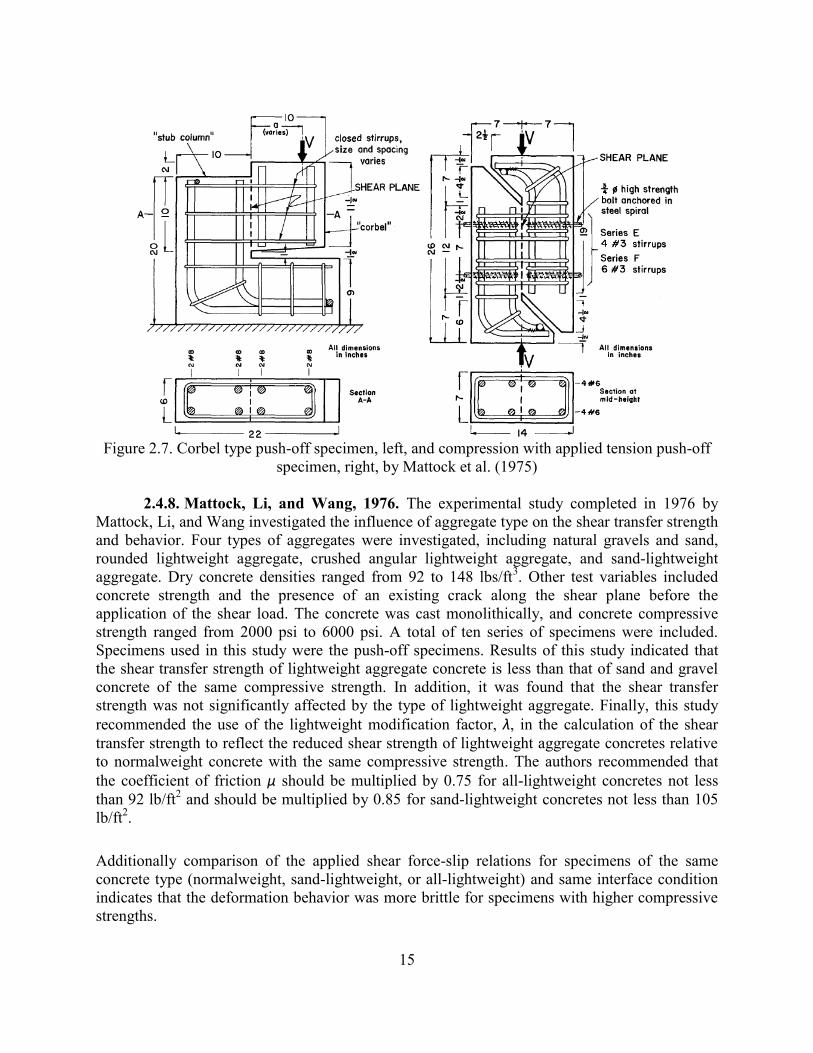
2.4.7. Mattock, Johal, and Chow, 1975. The study completed in 1975 by Mattock,
Johal, and Chow investigated shear friction specimens with moment or tension acting across the
shear plane. The specimens used in this program included a corbel push-off specimen and a
push-off specimen with direct tension applied normal to the shear plane, shown in Figure 2.7.
The test variables included eccentricity of the applied loading, distribution of reinforcing steel
across the shear plane, and the level of tension normal to the shear plane. A key finding of this
research was that for elements subject to combined moment and shear, the ultimate shear transfer
capacity is not reduced as long as the applied moment does not exceed the ultimate flexural
strength of the section. However, if moment and shear are to be transferred across a crack, the
transfer reinforcement should be located in the flexural tension zone.
15
Figure 2.7. Corbel type push-off specimen, left, and compression with applied tension push-off
specimen, right, by Mattock et al. (1975)
2.4.8. Mattock, Li, and Wang, 1976. The experimental study completed in 1976 by
Mattock, Li, and Wang investigated the influence of aggregate type on the shear transfer strength
and behavior. Four types of aggregates were investigated, including natural gravels and sand,
rounded lightweight aggregate, crushed angular lightweight aggregate, and sand-lightweight
aggregate. Dry concrete densities ranged from 92 to 148 lbs/ft3. Other test variables included
concrete strength and the presence of an existing crack along the shear plane before the
application of the shear load. The concrete was cast monolithically, and concrete compressive
strength ranged from 2000 psi to 6000 psi. A total of ten series of specimens were included.
Specimens used in this study were the push-off specimens. Results of this study indicated that
the shear transfer strength of lightweight aggregate concrete is less than that of sand and gravel
concrete of the same compressive strength. In addition, it was found that the shear transfer
strength was not significantly affected by the type of lightweight aggregate. Finally, this study
recommended the use of the lightweight modification factor, λ, in the calculation of the shear
transfer strength to reflect the reduced shear strength of lightweight aggregate concretes relative
to normalweight concrete with the same compressive strength. The authors recommended that
the coefficient of friction μ should be multiplied by 0.75 for all-lightweight concretes not less
than 92 lb/ft2 and should be multiplied by 0.85 for sand-lightweight concretes not less than 105
lb/ft2.
Additionally comparison of the applied shear force-slip relations for specimens of the same
concrete type (normalweight, sand-lightweight, or all-lightweight) and same interface condition
indicates that the deformation behavior was more brittle for specimens with higher compressive
strengths.
16
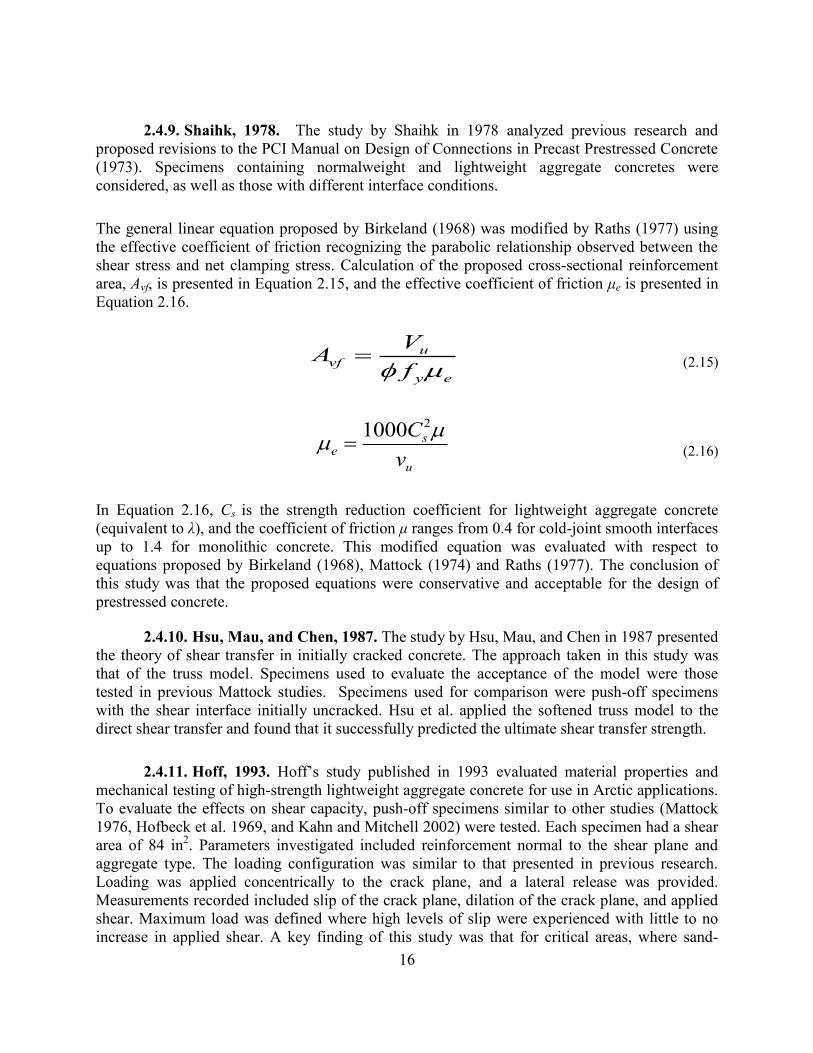
2.4.9. Shaihk, 1978. The study by Shaihk in 1978 analyzed previous research and
proposed revisions to the PCI Manual on Design of Connections in Precast Prestressed Concrete
(1973). Specimens containing normalweight and lightweight aggregate concretes were
considered, as well as those with different interface conditions.
The general linear equation proposed by Birkeland (1968) was modified by Raths (1977) using
the effective coefficient of friction recognizing the parabolic relationship observed between the
shear stress and net clamping stress. Calculation of the proposed cross-sectional reinforcement
area, Avf, is presented in Equation 2.15, and the effective coefficient of friction μe is presented in
Equation 2.16.
u
vf
y e
VA
f (2.15)
21000 se
u
C
v
(2.16)
In Equation 2.16, Cs is the strength reduction coefficient for lightweight aggregate concrete
(equivalent to λ), and the coefficient of friction μ ranges from 0.4 for cold-joint smooth interfaces
up to 1.4 for monolithic concrete. This modified equation was evaluated with respect to
equations proposed by Birkeland (1968), Mattock (1974) and Raths (1977). The conclusion of
this study was that the proposed equations were conservative and acceptable for the design of
prestressed concrete.
2.4.10. Hsu, Mau, and Chen, 1987. The study by Hsu, Mau, and Chen in 1987 presented
the theory of shear transfer in initially cracked concrete. The approach taken in this study was
that of the truss model. Specimens used to evaluate the acceptance of the model were those
tested in previous Mattock studies. Specimens used for comparison were push-off specimens
with the shear interface initially uncracked. Hsu et al. applied the softened truss model to the
direct shear transfer and found that it successfully predicted the ultimate shear transfer strength.
2.4.11. Hoff, 1993. Hoff’s study published in 1993 evaluated material properties and
mechanical testing of high-strength lightweight aggregate concrete for use in Arctic applications.
To evaluate the effects on shear capacity, push-off specimens similar to other studies (Mattock
1976, Hofbeck et al. 1969, and Kahn and Mitchell 2002) were tested. Each specimen had a shear
area of 84 in2. Parameters investigated included reinforcement normal to the shear plane and
aggregate type. The loading configuration was similar to that presented in previous research.
Loading was applied concentrically to the crack plane, and a lateral release was provided.
Measurements recorded included slip of the crack plane, dilation of the crack plane, and applied
shear. Maximum load was defined where high levels of slip were experienced with little to no
increase in applied shear. A key finding of this study was that for critical areas, where sand-
17
lightweight concretes are used, it may be prudent to use a reduced reduction factor to estimate
the shear transfer strength. However, with the introduction of high-strength mixtures, existing
code provisions were determined to be adequate. In addition, the aggregate type (crushed vs.
pelletized) was found to play a significant role in the post-cracking behavior.
2.4.12. Mattock, 2001. The study completed in 2001 by Mattock examined the
provisions in the ACI 318 code (1999) used to design the shear reinforcement required to cross
an existing or potential crack in a given connection. Specific consideration was made for high-
strength concrete and the limitations set forth by the code on the shear strength Vn. An important
distinction was made regarding the interface condition and the presence of a crack at the location
of applied load prior to the application of the shear force. This investigation included specimens
with initially cracked non-monolithic interfaces that were either roughened or smooth. The pre-
cracked interface was intended to represent the lower bound shear transfer condition, which
would result in a conservative estimation for the code changes proposed.
2.4.13. Kahn and Mitchell, 2002. The study by Kahn and Mitchell (2002) focused on
expanding the applicability of shear friction model presented in the ACI 318 code (1999) to
high-strength concrete. A total of 50 shear friction push-off specimens with a shear plane of 60
in2, shown in Figure 2.8, were tested. Parameters varied were the reinforcement provided normal
to the shear plane, concrete compressive strength, and shear interface condition. The
reinforcement ratio varied from 0.37 to 1.47%, and the target concrete compressive strength
varied from 4000 psi to 14,000 psi. Three shear interface conditions were tested including cold-
joint, initially uncracked, and pre-cracked conditions with two replicates of each. The load was
applied concentric to the shear plane. The load was increased monotonically until failure, and
testing ceased at a slip of 0.25 in. Data reported included slip of the shear plane and applied load
until failure. Results were reported in terms of the ultimate shear stress, residual shear stress, and
clamping force provided by reinforcement normal to the shear plane. The initial cracks along the
shear plane were observed to occur at 50 to 75% of the ultimate capacity. Ultimate capacity was
defined as the load corresponding to a slip of 0.2 in. A key conclusion of Kahn and Mitchell’s
study was that for concrete strengths from 6800 psi to 17,900 psi, the current ACI 318 code
(1999) shear friction design provisions provided conservative estimates for the interface shear
strength of high-strength concretes. The authors also recommended that the upper limit on the
shear stress of 800 psi be removed. With the inclusion of high-strength concrete data, the upper
limit was proposed to be 20% of the 28-day compressive strength. Finally the observed behavior
of the cold joint and initially uncracked specimens was reported to be nearly the same.
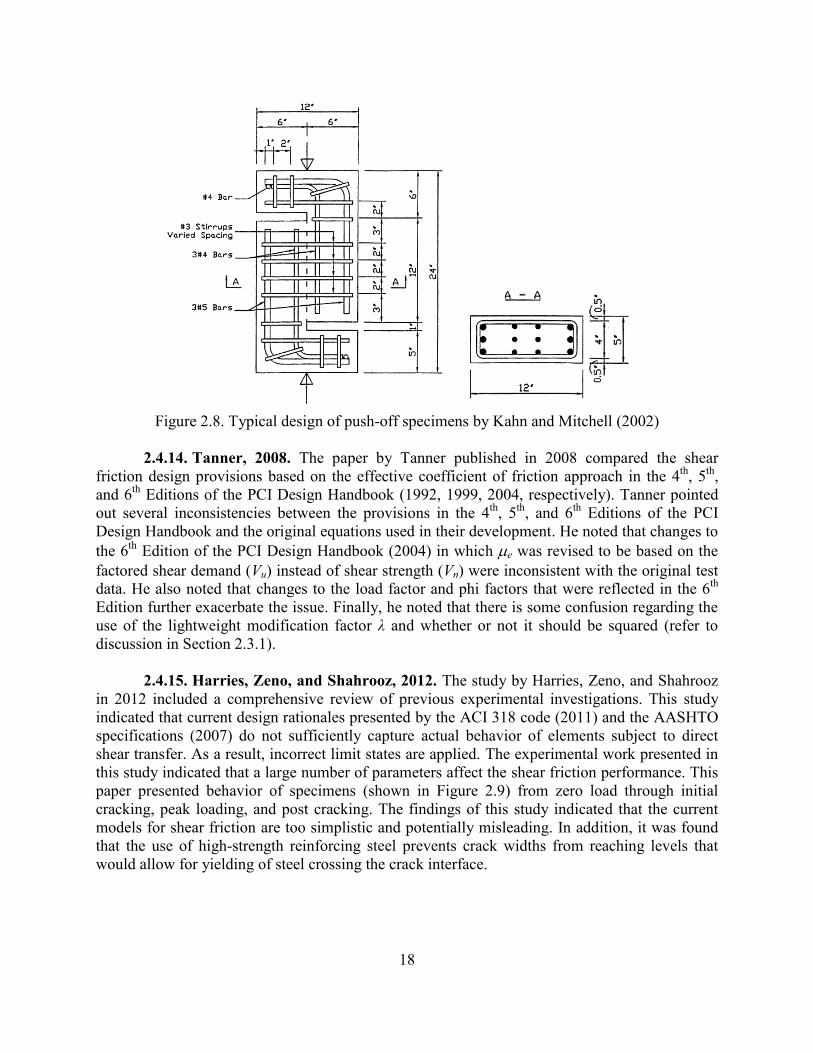
18
Figure 2.8. Typical design of push-off specimens by Kahn and Mitchell (2002)
2.4.14. Tanner, 2008. The paper by Tanner published in 2008 compared the shear
friction design provisions based on the effective coefficient of friction approach in the 4th
, 5th
,
and 6th
Editions of the PCI Design Handbook (1992, 1999, 2004, respectively). Tanner pointed
out several inconsistencies between the provisions in the 4th
, 5th
, and 6th
Editions of the PCI
Design Handbook and the original equations used in their development. He noted that changes to
the 6th
Edition of the PCI Design Handbook (2004) in which e was revised to be based on the
factored shear demand (Vu instead of shear strength (Vn) were inconsistent with the original test
data. He also noted that changes to the load factor and phi factors that were reflected in the 6th
Edition further exacerbate the issue. Finally, he noted that there is some confusion regarding the
use of the lightweight modification factor λ and whether or not it should be squared (refer to
discussion in Section 2.3.1).
2.4.15. Harries, Zeno, and Shahrooz, 2012. The study by Harries, Zeno, and Shahrooz
in 2012 included a comprehensive review of previous experimental investigations. This study
indicated that current design rationales presented by the ACI 318 code (2011) and the AASHTO
specifications (2007) do not sufficiently capture actual behavior of elements subject to direct
shear transfer. As a result, incorrect limit states are applied. The experimental work presented in
this study indicated that a large number of parameters affect the shear friction performance. This
paper presented behavior of specimens (shown in Figure 2.9) from zero load through initial
cracking, peak loading, and post cracking. The findings of this study indicated that the current
models for shear friction are too simplistic and potentially misleading. In addition, it was found
that the use of high-strength reinforcing steel prevents crack widths from reaching levels that
would allow for yielding of steel crossing the crack interface.
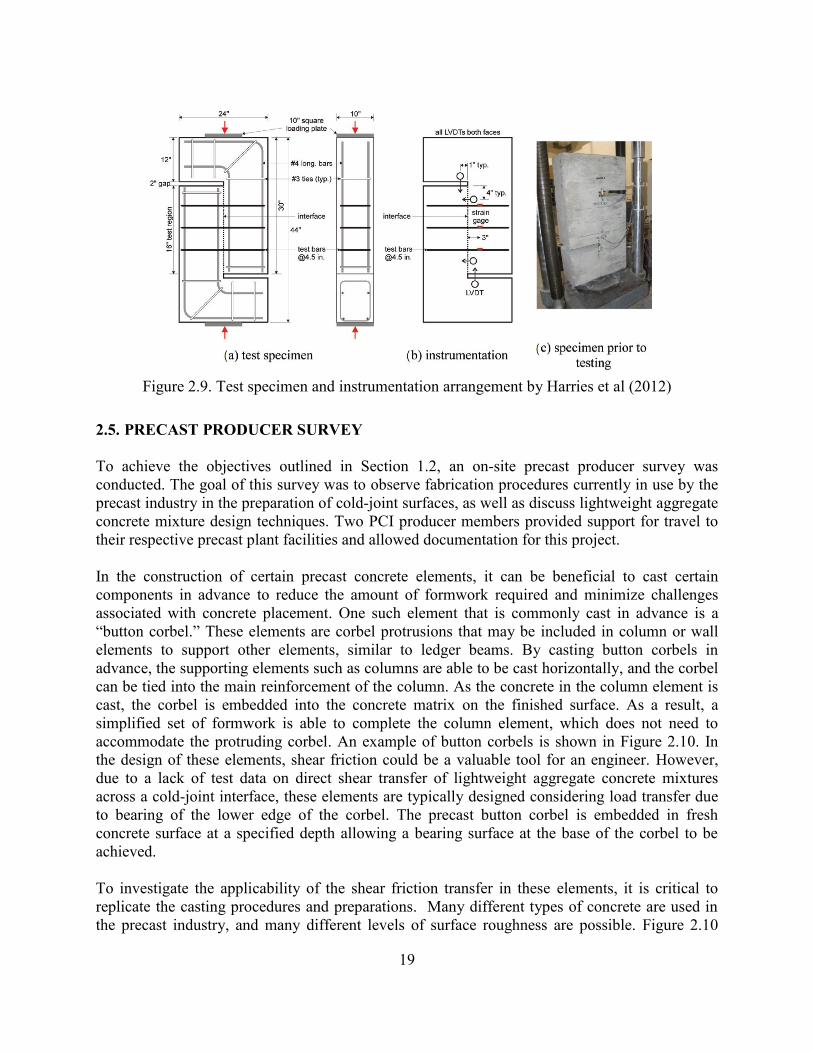
19
Figure 2.9. Test specimen and instrumentation arrangement by Harries et al (2012)
2.5. PRECAST PRODUCER SURVEY
To achieve the objectives outlined in Section 1.2, an on-site precast producer survey was
conducted. The goal of this survey was to observe fabrication procedures currently in use by the
precast industry in the preparation of cold-joint surfaces, as well as discuss lightweight aggregate
concrete mixture design techniques. Two PCI producer members provided support for travel to
their respective precast plant facilities and allowed documentation for this project.
In the construction of certain precast concrete elements, it can be beneficial to cast certain
components in advance to reduce the amount of formwork required and minimize challenges
associated with concrete placement. One such element that is commonly cast in advance is a
“button corbel.” These elements are corbel protrusions that may be included in column or wall
elements to support other elements, similar to ledger beams. By casting button corbels in
advance, the supporting elements such as columns are able to be cast horizontally, and the corbel
can be tied into the main reinforcement of the column. As the concrete in the column element is
cast, the corbel is embedded into the concrete matrix on the finished surface. As a result, a
simplified set of formwork is able to complete the column element, which does not need to
accommodate the protruding corbel. An example of button corbels is shown in Figure 2.10. In
the design of these elements, shear friction could be a valuable tool for an engineer. However,
due to a lack of test data on direct shear transfer of lightweight aggregate concrete mixtures
across a cold-joint interface, these elements are typically designed considering load transfer due
to bearing of the lower edge of the corbel. The precast button corbel is embedded in fresh
concrete surface at a specified depth allowing a bearing surface at the base of the corbel to be
achieved.
To investigate the applicability of the shear friction transfer in these elements, it is critical to
replicate the casting procedures and preparations. Many different types of concrete are used in
the precast industry, and many different levels of surface roughness are possible. Figure 2.10
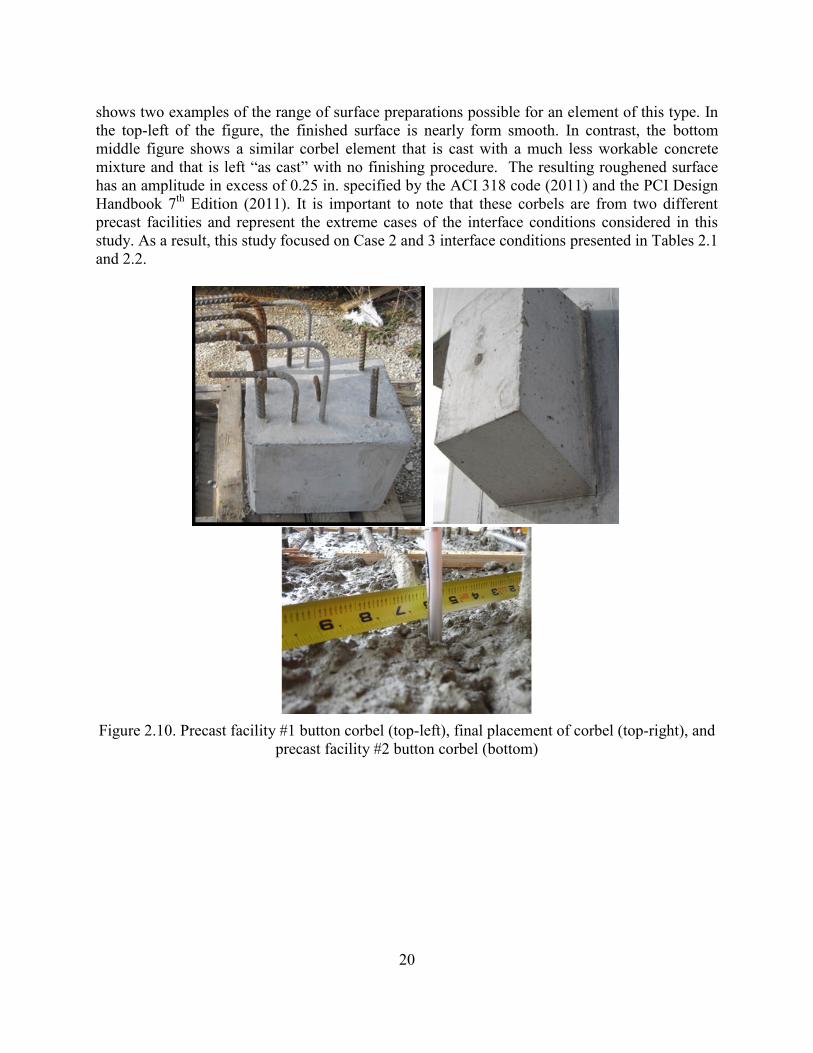
20
shows two examples of the range of surface preparations possible for an element of this type. In
the top-left of the figure, the finished surface is nearly form smooth. In contrast, the bottom
middle figure shows a similar corbel element that is cast with a much less workable concrete
mixture and that is left “as cast” with no finishing procedure. The resulting roughened surface
has an amplitude in excess of 0.25 in. specified by the ACI 318 code (2011) and the PCI Design
Handbook 7th
Edition (2011). It is important to note that these corbels are from two different
precast facilities and represent the extreme cases of the interface conditions considered in this
study. As a result, this study focused on Case 2 and 3 interface conditions presented in Tables 2.1
and 2.2.
Figure 2.10. Precast facility #1 button corbel (top-left), final placement of corbel (top-right), and
precast facility #2 button corbel (bottom)
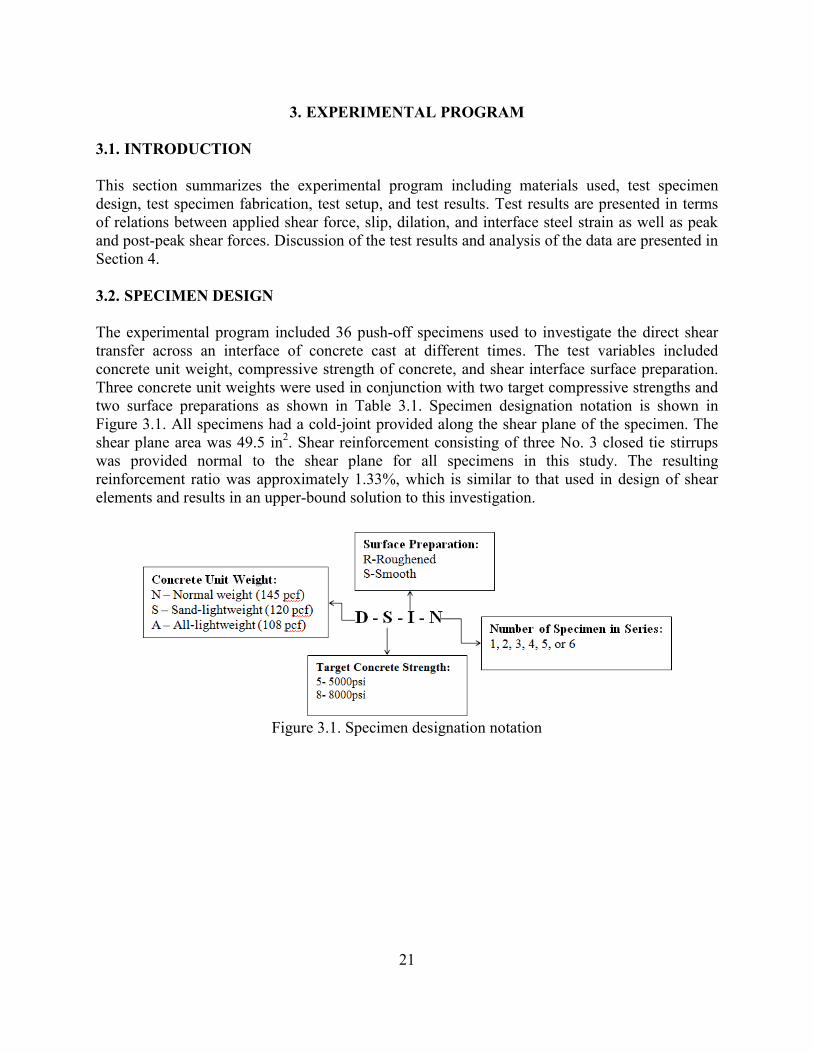
21
3. EXPERIMENTAL PROGRAM
3.1. INTRODUCTION
This section summarizes the experimental program including materials used, test specimen
design, test specimen fabrication, test setup, and test results. Test results are presented in terms
of relations between applied shear force, slip, dilation, and interface steel strain as well as peak
and post-peak shear forces. Discussion of the test results and analysis of the data are presented in
Section 4.
3.2. SPECIMEN DESIGN
The experimental program included 36 push-off specimens used to investigate the direct shear
transfer across an interface of concrete cast at different times. The test variables included
concrete unit weight, compressive strength of concrete, and shear interface surface preparation.
Three concrete unit weights were used in conjunction with two target compressive strengths and
two surface preparations as shown in Table 3.1. Specimen designation notation is shown in
Figure 3.1. All specimens had a cold-joint provided along the shear plane of the specimen. The
shear plane area was 49.5 in2. Shear reinforcement consisting of three No. 3 closed tie stirrups
was provided normal to the shear plane for all specimens in this study. The resulting
reinforcement ratio was approximately 1.33%, which is similar to that used in design of shear
elements and results in an upper-bound solution to this investigation.
Figure 3.1. Specimen designation notation
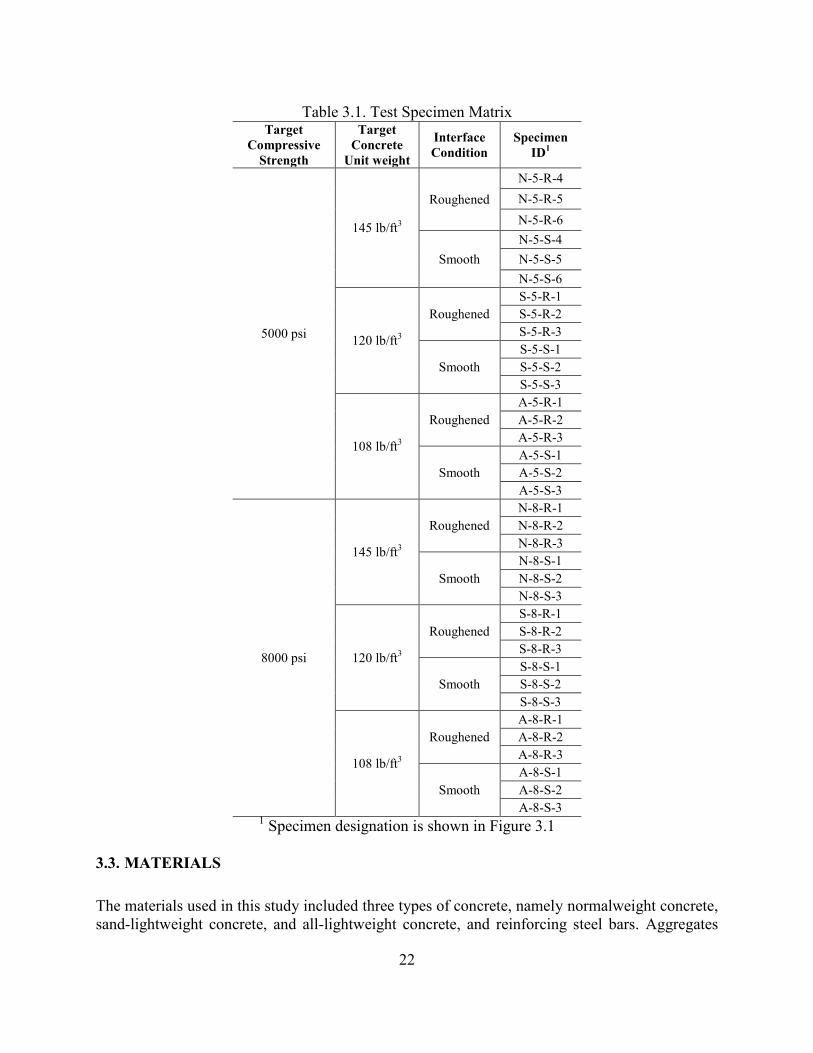
22
Table 3.1. Test Specimen Matrix Target
Compressive
Strength
Target
Concrete
Unit weight
Interface
Condition
Specimen
ID1
5000 psi
145 lb/ft3
Roughened
N-5-R-4
N-5-R-5
N-5-R-6
Smooth
N-5-S-4
N-5-S-5
N-5-S-6
120 lb/ft3
Roughened
S-5-R-1
S-5-R-2
S-5-R-3
Smooth
S-5-S-1
S-5-S-2
S-5-S-3
108 lb/ft3
Roughened
A-5-R-1
A-5-R-2
A-5-R-3
Smooth
A-5-S-1
A-5-S-2
A-5-S-3
8000 psi
145 lb/ft3
Roughened
N-8-R-1
N-8-R-2
N-8-R-3
Smooth
N-8-S-1
N-8-S-2
N-8-S-3
120 lb/ft3
Roughened
S-8-R-1
S-8-R-2
S-8-R-3
Smooth
S-8-S-1
S-8-S-2
S-8-S-3
108 lb/ft3
Roughened
A-8-R-1
A-8-R-2
A-8-R-3
Smooth
A-8-S-1
A-8-S-2
A-8-S-3 1 Specimen designation is shown in Figure 3.1
3.3. MATERIALS
The materials used in this study included three types of concrete, namely normalweight concrete,
sand-lightweight concrete, and all-lightweight concrete, and reinforcing steel bars. Aggregates
23
used in the production of the concrete mixtures are summarized in Section 3.3.1, the resulting
concrete mixtures are summarized in Section 3.3.2, and reinforcing steel bars are summarized in
Section 3.3.3.
3.3.1. Aggregates. This section describes the aggregates used in this program including
normalweight and lightweight aggregates.
3.3.1.1. Normalweight aggregates. The normalweight aggregates used in this study
included coarse and fine aggregates. The coarse aggregates used were crushed dolomite from the
Jefferson City formation, and fine aggregates were natural river sand. Aggregates met standards
set by ASTM C33. The coarse aggregate gradation used was selected to consist of 100% passing
the 1/2 in. sieve and less than 5% passing the #8 sieve. This gradation is referred to as a 1/2 in.
clean washed material. The ASTM C33 designation is a sieve #8.
3.3.1.2. Lightweight aggregates. Lightweight expanded aggregates were used in the
production of the sand-lightweight and all-lightweight concrete mixtures discussed in the
subsequent sections. The lightweight aggregate used in both the sand-lightweight and all
lightweight mixtures was supplied by Buildex Inc. and was an expanded shale product. Specific
information regarding the preparation and material properties of the structural lightweight
aggregates is presented in the following sections.
3.3.1.2.1. Lightweight aggregate saturation. Lightweight aggregates are inherently
susceptible to high absorption values (relative to normalweight aggregates). This is a result of the
production procedure used and the resulting high capillary void structure of the aggregates
themselves. As a result, it is imperative that lightweight aggregates are saturated to saturated
surface dry (SSD) condition prior to batching concrete. While achieving the SSD condition on a
small scale is easily done, replicating this procedure for large-scale concrete production can be
cumbersome. To achieve total saturation of the aggregates used in this program, a saturation tank
was created using a large liquid storage tank pictured in Figure 3.2. The tank was initially filled
with the required volume of lightweight aggregate, then water was added to completely cover the
material. The tank was allowed to sit undisturbed for a period of 48 hours. After the minimum 48
hour period the tank was then drained using the built in valve assembly. The outflow of the tank
was passed over a #200 sieve to ensure any materials inadvertently discharged were filtered from
the outflow and returned to the saturation tank.
It is important to note that depending on the gradation of aggregates used, the absorption values
can range from slightly less than 10% to over 30%. Also, depending on the type of base material
used (shale, slate, or clay) these absorption values can vary as well. This study examines only
shale-based materials with two specific ASTM structural gradations discussed in Section
3.3.1.2.2.
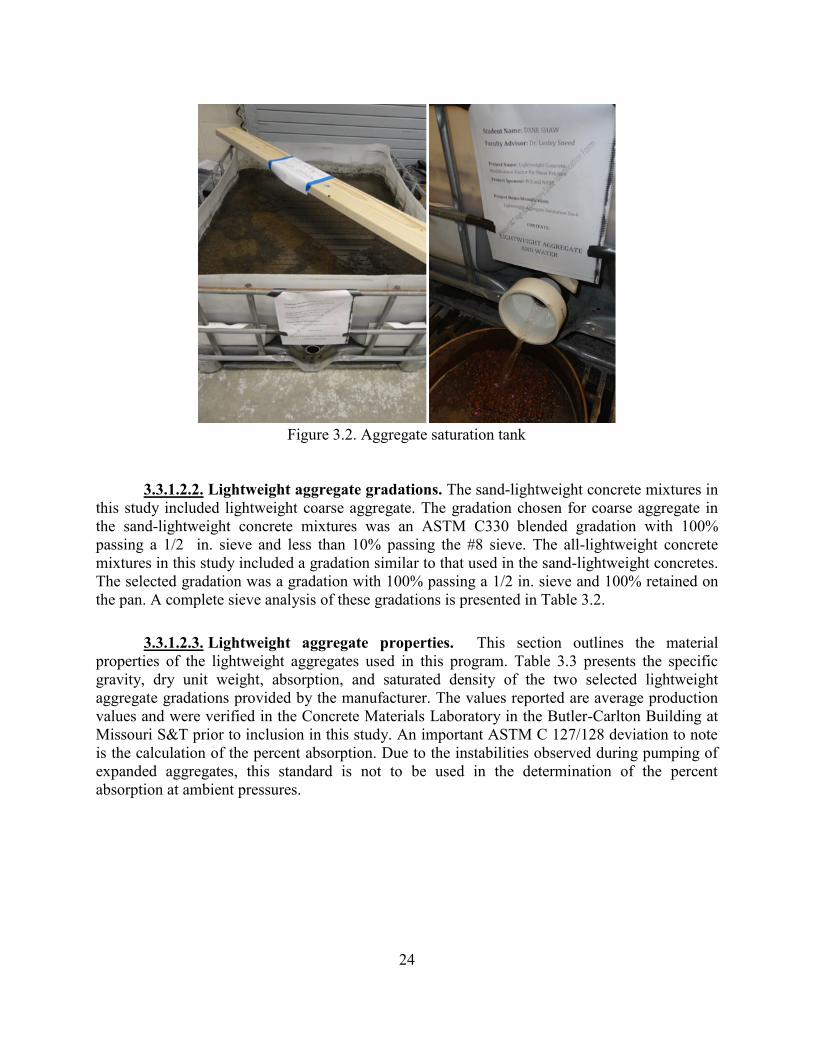
24
3.3.1.2.2. Lightweight aggregate gradations. The sand-lightweight concrete mixtures in
this study included lightweight coarse aggregate. The gradation chosen for coarse aggregate in
the sand-lightweight concrete mixtures was an ASTM C330 blended gradation with 100%
passing a 1/2 in. sieve and less than 10% passing the #8 sieve. The all-lightweight concrete
mixtures in this study included a gradation similar to that used in the sand-lightweight concretes.
The selected gradation was a gradation with 100% passing a 1/2 in. sieve and 100% retained on
the pan. A complete sieve analysis of these gradations is presented in Table 3.2.
3.3.1.2.3. Lightweight aggregate properties. This section outlines the material
properties of the lightweight aggregates used in this program. Table 3.3 presents the specific
gravity, dry unit weight, absorption, and saturated density of the two selected lightweight
aggregate gradations provided by the manufacturer. The values reported are average production
values and were verified in the Concrete Materials Laboratory in the Butler-Carlton Building at
Missouri S&T prior to inclusion in this study. An important ASTM C 127/128 deviation to note
is the calculation of the percent absorption. Due to the instabilities observed during pumping of
expanded aggregates, this standard is not to be used in the determination of the percent
absorption at ambient pressures.
Figure 3.2. Aggregate saturation tank
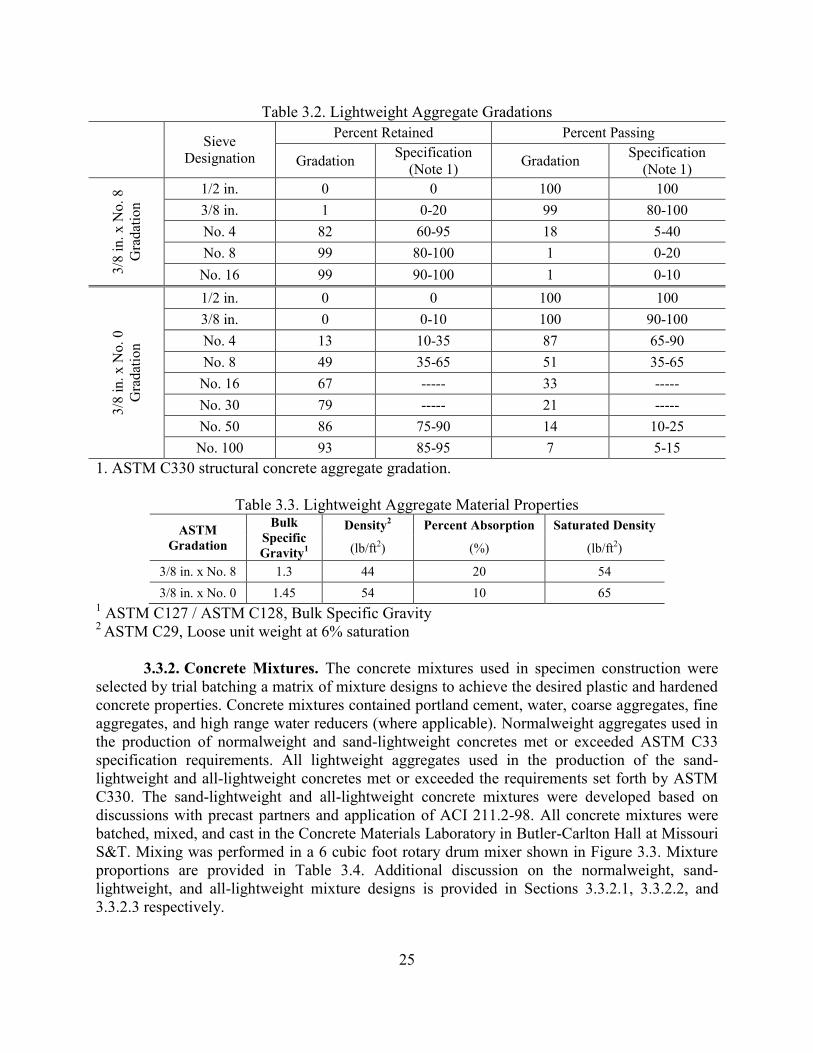
25
Table 3.2. Lightweight Aggregate Gradations
Sieve
Designation
Percent Retained Percent Passing
Gradation Specification
(Note 1) Gradation
Specification
(Note 1)
3/8
in
. x
No
. 8
Gra
dat
ion
1/2 in. 0 0 100 100
3/8 in. 1 0-20 99 80-100
No. 4 82 60-95 18 5-40
No. 8 99 80-100 1 0-20
No. 16 99 90-100 1 0-10
3/8
in.
x N
o.
0
Gra
dat
ion
1/2 in. 0 0 100 100
3/8 in. 0 0-10 100 90-100
No. 4 13 10-35 87 65-90
No. 8 49 35-65 51 35-65
No. 16 67 ----- 33 -----
No. 30 79 ----- 21 -----
No. 50 86 75-90 14 10-25
No. 100 93 85-95 7 5-15
1. ASTM C330 structural concrete aggregate gradation.
Table 3.3. Lightweight Aggregate Material Properties
ASTM
Gradation
Bulk
Specific
Gravity1
Density2
Percent Absorption Saturated Density
(lb/ft2) (%) (lb/ft
2)
3/8 in. x No. 8 1.3 44 20 54
3/8 in. x No. 0 1.45 54 10 65 1 ASTM C127 / ASTM C128, Bulk Specific Gravity
2 ASTM C29, Loose unit weight at 6% saturation
3.3.2. Concrete Mixtures. The concrete mixtures used in specimen construction were
selected by trial batching a matrix of mixture designs to achieve the desired plastic and hardened
concrete properties. Concrete mixtures contained portland cement, water, coarse aggregates, fine
aggregates, and high range water reducers (where applicable). Normalweight aggregates used in
the production of normalweight and sand-lightweight concretes met or exceeded ASTM C33
specification requirements. All lightweight aggregates used in the production of the sand-
lightweight and all-lightweight concretes met or exceeded the requirements set forth by ASTM
C330. The sand-lightweight and all-lightweight concrete mixtures were developed based on
discussions with precast partners and application of ACI 211.2-98. All concrete mixtures were
batched, mixed, and cast in the Concrete Materials Laboratory in Butler-Carlton Hall at Missouri
S&T. Mixing was performed in a 6 cubic foot rotary drum mixer shown in Figure 3.3. Mixture
proportions are provided in Table 3.4. Additional discussion on the normalweight, sand-
lightweight, and all-lightweight mixture designs is provided in Sections 3.3.2.1, 3.3.2.2, and
3.3.2.3 respectively.
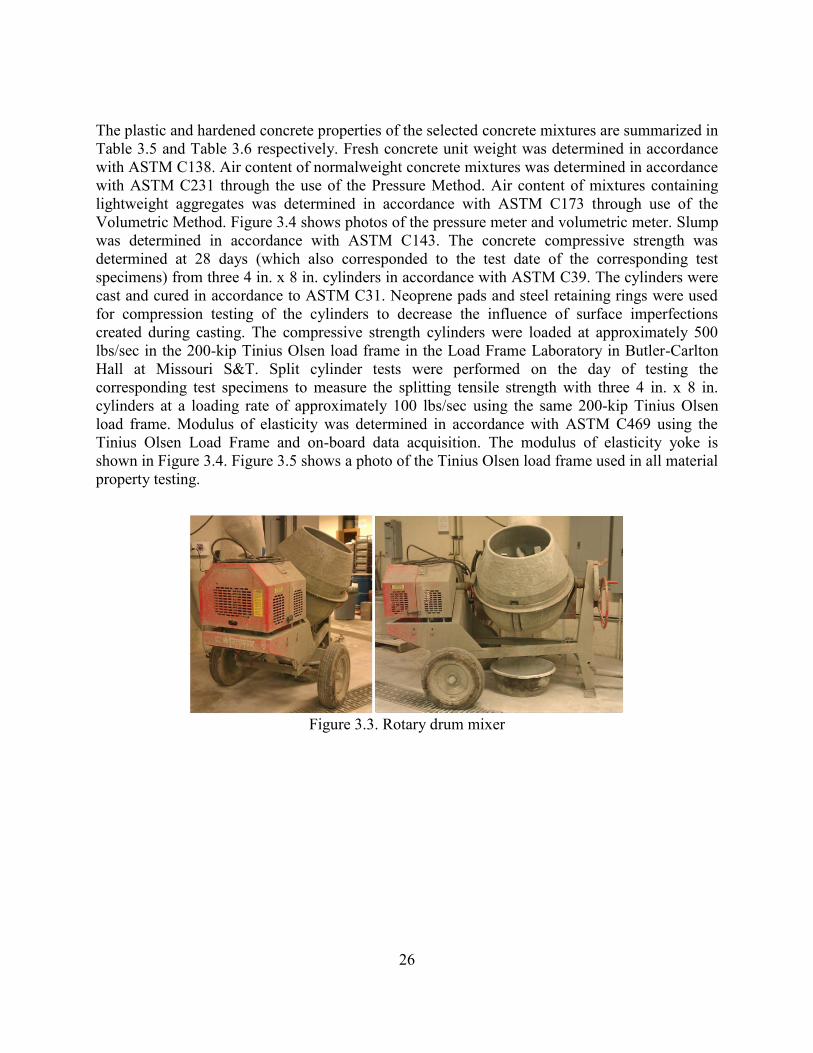
26
The plastic and hardened concrete properties of the selected concrete mixtures are summarized in
Table 3.5 and Table 3.6 respectively. Fresh concrete unit weight was determined in accordance
with ASTM C138. Air content of normalweight concrete mixtures was determined in accordance
with ASTM C231 through the use of the Pressure Method. Air content of mixtures containing
lightweight aggregates was determined in accordance with ASTM C173 through use of the
Volumetric Method. Figure 3.4 shows photos of the pressure meter and volumetric meter. Slump
was determined in accordance with ASTM C143. The concrete compressive strength was
determined at 28 days (which also corresponded to the test date of the corresponding test
specimens) from three 4 in. x 8 in. cylinders in accordance with ASTM C39. The cylinders were
cast and cured in accordance to ASTM C31. Neoprene pads and steel retaining rings were used
for compression testing of the cylinders to decrease the influence of surface imperfections
created during casting. The compressive strength cylinders were loaded at approximately 500
lbs/sec in the 200-kip Tinius Olsen load frame in the Load Frame Laboratory in Butler-Carlton
Hall at Missouri S&T. Split cylinder tests were performed on the day of testing the
corresponding test specimens to measure the splitting tensile strength with three 4 in. x 8 in.
cylinders at a loading rate of approximately 100 lbs/sec using the same 200-kip Tinius Olsen
load frame. Modulus of elasticity was determined in accordance with ASTM C469 using the
Tinius Olsen Load Frame and on-board data acquisition. The modulus of elasticity yoke is
shown in Figure 3.4. Figure 3.5 shows a photo of the Tinius Olsen load frame used in all material
property testing.
Figure 3.3. Rotary drum mixer
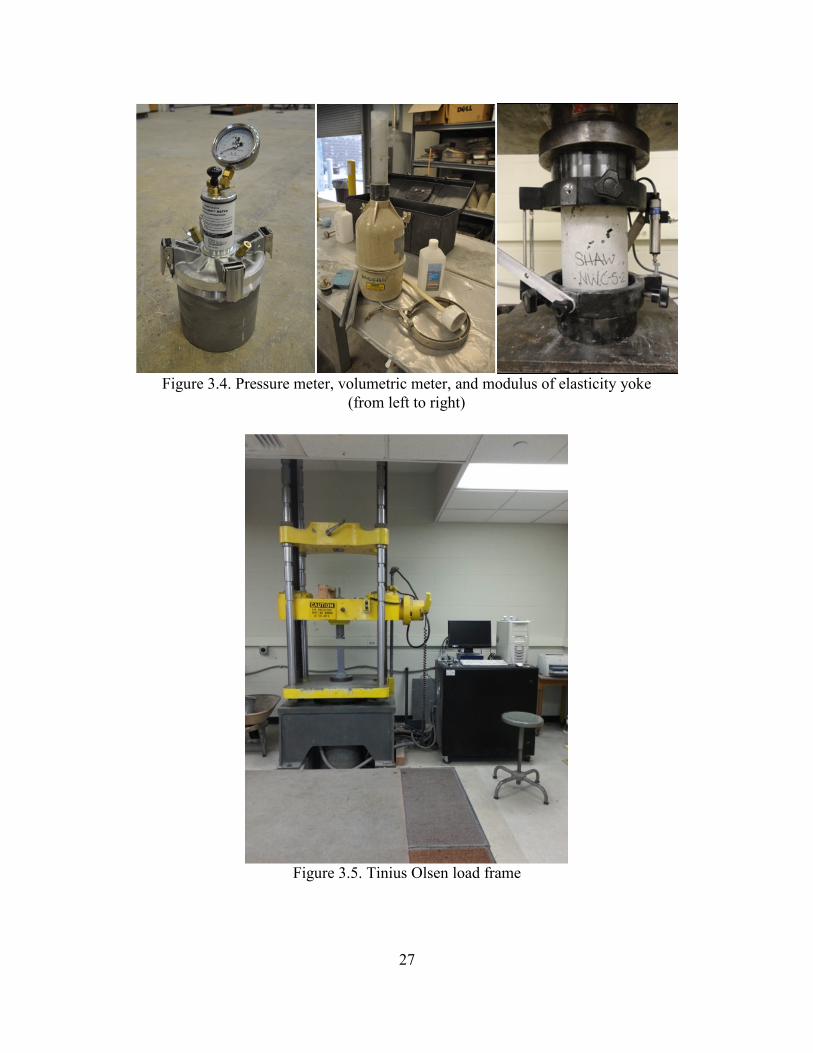
27
Figure 3.5. Tinius Olsen load frame
Figure 3.4. Pressure meter, volumetric meter, and modulus of elasticity yoke
(from left to right)
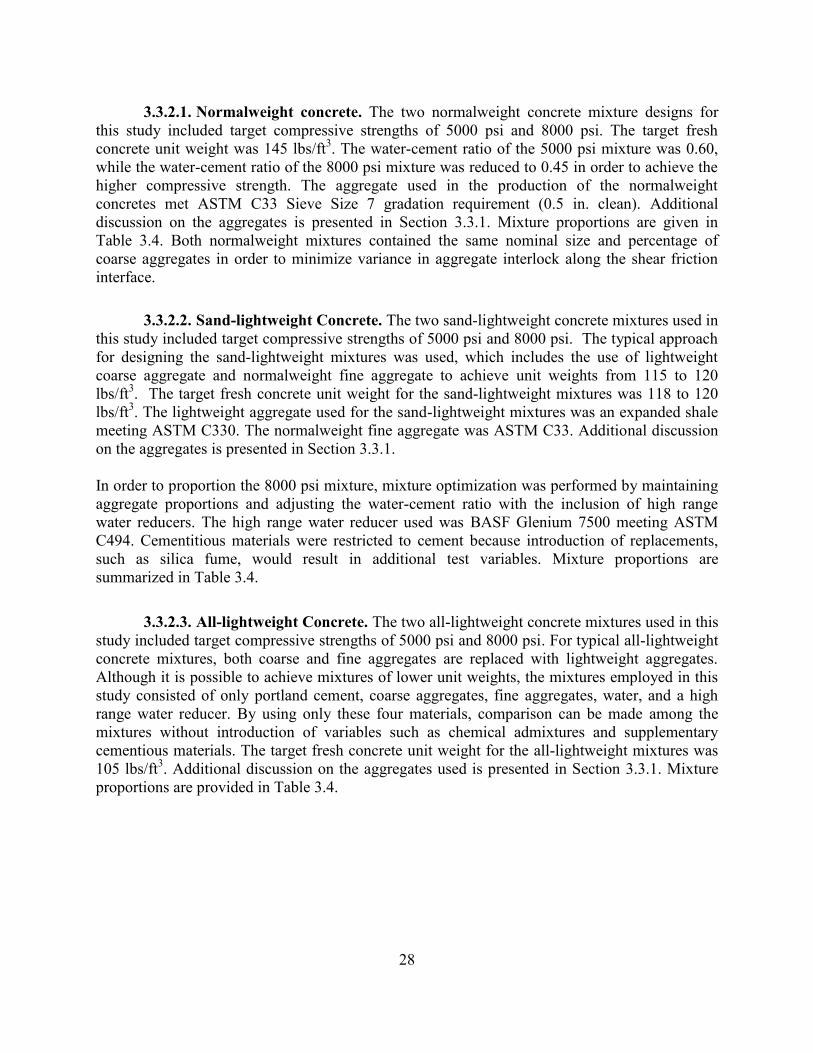
28
3.3.2.1. Normalweight concrete. The two normalweight concrete mixture designs for
this study included target compressive strengths of 5000 psi and 8000 psi. The target fresh
concrete unit weight was 145 lbs/ft3. The water-cement ratio of the 5000 psi mixture was 0.60,
while the water-cement ratio of the 8000 psi mixture was reduced to 0.45 in order to achieve the
higher compressive strength. The aggregate used in the production of the normalweight
concretes met ASTM C33 Sieve Size 7 gradation requirement (0.5 in. clean). Additional
discussion on the aggregates is presented in Section 3.3.1. Mixture proportions are given in
Table 3.4. Both normalweight mixtures contained the same nominal size and percentage of
coarse aggregates in order to minimize variance in aggregate interlock along the shear friction
interface.
3.3.2.2. Sand-lightweight Concrete. The two sand-lightweight concrete mixtures used in
this study included target compressive strengths of 5000 psi and 8000 psi. The typical approach
for designing the sand-lightweight mixtures was used, which includes the use of lightweight
coarse aggregate and normalweight fine aggregate to achieve unit weights from 115 to 120
lbs/ft3. The target fresh concrete unit weight for the sand-lightweight mixtures was 118 to 120
lbs/ft3. The lightweight aggregate used for the sand-lightweight mixtures was an expanded shale
meeting ASTM C330. The normalweight fine aggregate was ASTM C33. Additional discussion
on the aggregates is presented in Section 3.3.1.
In order to proportion the 8000 psi mixture, mixture optimization was performed by maintaining
aggregate proportions and adjusting the water-cement ratio with the inclusion of high range
water reducers. The high range water reducer used was BASF Glenium 7500 meeting ASTM
C494. Cementitious materials were restricted to cement because introduction of replacements,
such as silica fume, would result in additional test variables. Mixture proportions are
summarized in Table 3.4.
3.3.2.3. All-lightweight Concrete. The two all-lightweight concrete mixtures used in this
study included target compressive strengths of 5000 psi and 8000 psi. For typical all-lightweight
concrete mixtures, both coarse and fine aggregates are replaced with lightweight aggregates.
Although it is possible to achieve mixtures of lower unit weights, the mixtures employed in this
study consisted of only portland cement, coarse aggregates, fine aggregates, water, and a high
range water reducer. By using only these four materials, comparison can be made among the
mixtures without introduction of variables such as chemical admixtures and supplementary
cementious materials. The target fresh concrete unit weight for the all-lightweight mixtures was
105 lbs/ft3. Additional discussion on the aggregates used is presented in Section 3.3.1. Mixture
proportions are provided in Table 3.4.
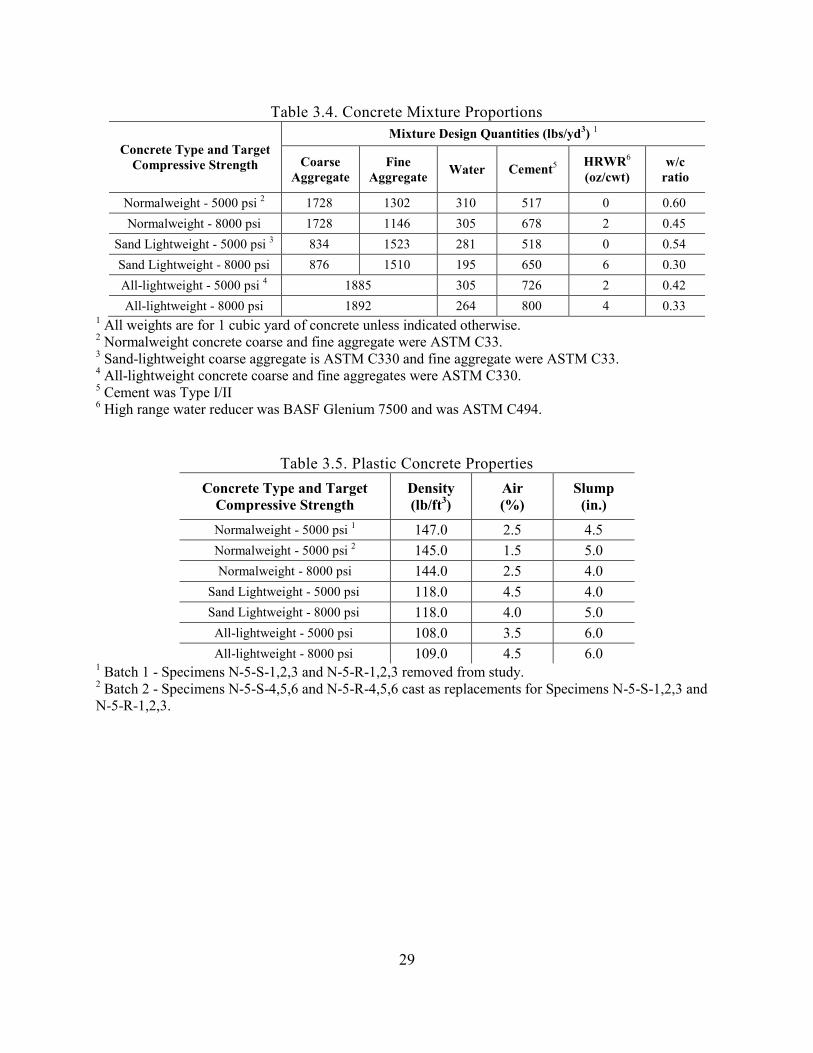
29
Table 3.4. Concrete Mixture Proportions
Concrete Type and Target
Compressive Strength
Mixture Design Quantities (lbs/yd3)
1
Coarse
Aggregate
Fine
Aggregate Water Cement
5 HRWR6
(oz/cwt)
w/c
ratio
Normalweight - 5000 psi 2
1728 1302 310 517 0 0.60
Normalweight - 8000 psi
1728 1146 305 678 2 0.45
Sand Lightweight - 5000 psi 3
834 1523 281 518 0 0.54
Sand Lightweight - 8000 psi
876 1510 195 650 6 0.30
All-lightweight - 5000 psi 4
1885 305 726 2 0.42
All-lightweight - 8000 psi 1892 264 800 4 0.33 1 All weights are for 1 cubic yard of concrete unless indicated otherwise.
2 Normalweight concrete coarse and fine aggregate were ASTM C33.
3 Sand-lightweight coarse aggregate is ASTM C330 and fine aggregate were ASTM C33.
4 All-lightweight concrete coarse and fine aggregates were ASTM C330.
5 Cement was Type I/II
6 High range water reducer was BASF Glenium 7500 and was ASTM C494.
Table 3.5. Plastic Concrete Properties
Concrete Type and Target
Compressive Strength
Density
(lb/ft3)
Air
(%)
Slump
(in.)
Normalweight - 5000 psi 1 147.0 2.5 4.5
Normalweight - 5000 psi 2 145.0 1.5 5.0
Normalweight - 8000 psi 144.0 2.5 4.0
Sand Lightweight - 5000 psi
118.0 4.5 4.0
Sand Lightweight - 8000 psi
118.0 4.0 5.0
All-lightweight - 5000 psi 108.0 3.5 6.0
All-lightweight - 8000 psi 109.0 4.5 6.0 1 Batch 1 - Specimens N-5-S-1,2,3 and N-5-R-1,2,3 removed from study.
2 Batch 2 - Specimens N-5-S-4,5,6 and N-5-R-4,5,6 cast as replacements for Specimens N-5-S-1,2,3 and
N-5-R-1,2,3.
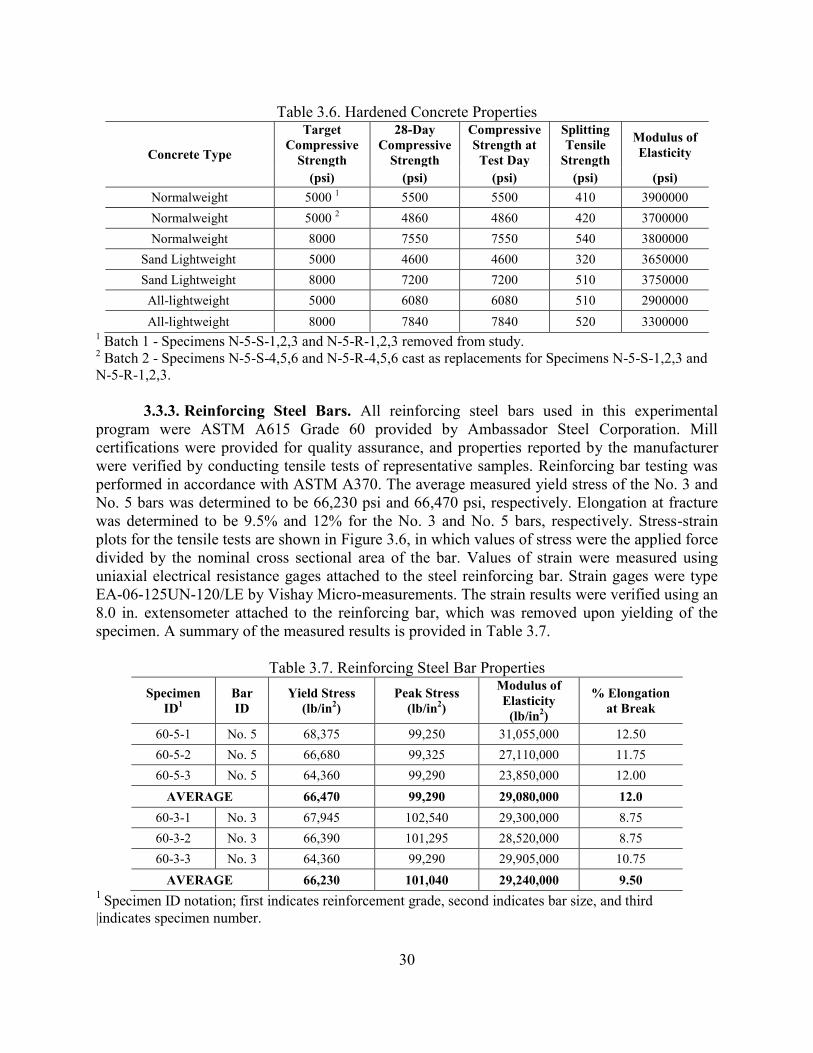
30
Table 3.6. Hardened Concrete Properties
Concrete Type
Target
Compressive
Strength
28-Day
Compressive
Strength
Compressive
Strength at
Test Day
Splitting
Tensile
Strength
Modulus of
Elasticity
(psi) (psi) (psi) (psi) (psi)
Normalweight 5000 1 5500 5500 410 3900000
Normalweight
5000 2 4860 4860 420 3700000
Normalweight 8000 7550 7550 540 3800000
Sand Lightweight
5000 4600 4600 320 3650000
Sand Lightweight
8000 7200 7200 510 3750000
All-lightweight
5000 6080 6080 510 2900000
All-lightweight 8000 7840 7840 520 3300000 1 Batch 1 - Specimens N-5-S-1,2,3 and N-5-R-1,2,3 removed from study.
2 Batch 2 - Specimens N-5-S-4,5,6 and N-5-R-4,5,6 cast as replacements for Specimens N-5-S-1,2,3 and
N-5-R-1,2,3.
3.3.3. Reinforcing Steel Bars. All reinforcing steel bars used in this experimental
program were ASTM A615 Grade 60 provided by Ambassador Steel Corporation. Mill
certifications were provided for quality assurance, and properties reported by the manufacturer
were verified by conducting tensile tests of representative samples. Reinforcing bar testing was
performed in accordance with ASTM A370. The average measured yield stress of the No. 3 and
No. 5 bars was determined to be 66,230 psi and 66,470 psi, respectively. Elongation at fracture
was determined to be 9.5% and 12% for the No. 3 and No. 5 bars, respectively. Stress-strain
plots for the tensile tests are shown in Figure 3.6, in which values of stress were the applied force
divided by the nominal cross sectional area of the bar. Values of strain were measured using
uniaxial electrical resistance gages attached to the steel reinforcing bar. Strain gages were type
EA-06-125UN-120/LE by Vishay Micro-measurements. The strain results were verified using an
8.0 in. extensometer attached to the reinforcing bar, which was removed upon yielding of the
specimen. A summary of the measured results is provided in Table 3.7.
Table 3.7. Reinforcing Steel Bar Properties
Specimen
ID1
Bar
ID
Yield Stress
(lb/in2)
Peak Stress
(lb/in2)
Modulus of
Elasticity
(lb/in2)
% Elongation
at Break
60-5-1 No. 5 68,375 99,250 31,055,000 12.50
60-5-2 No. 5 66,680 99,325 27,110,000 11.75
60-5-3 No. 5 64,360 99,290 23,850,000 12.00
AVERAGE 66,470 99,290 29,080,000 12.0
60-3-1 No. 3 67,945 102,540 29,300,000 8.75
60-3-2 No. 3 66,390 101,295 28,520,000 8.75
60-3-3 No. 3 64,360 99,290 29,905,000 10.75
AVERAGE 66,230 101,040 29,240,000 9.50 1
Specimen ID notation; first indicates reinforcement grade, second indicates bar size, and third
|indicates specimen number.
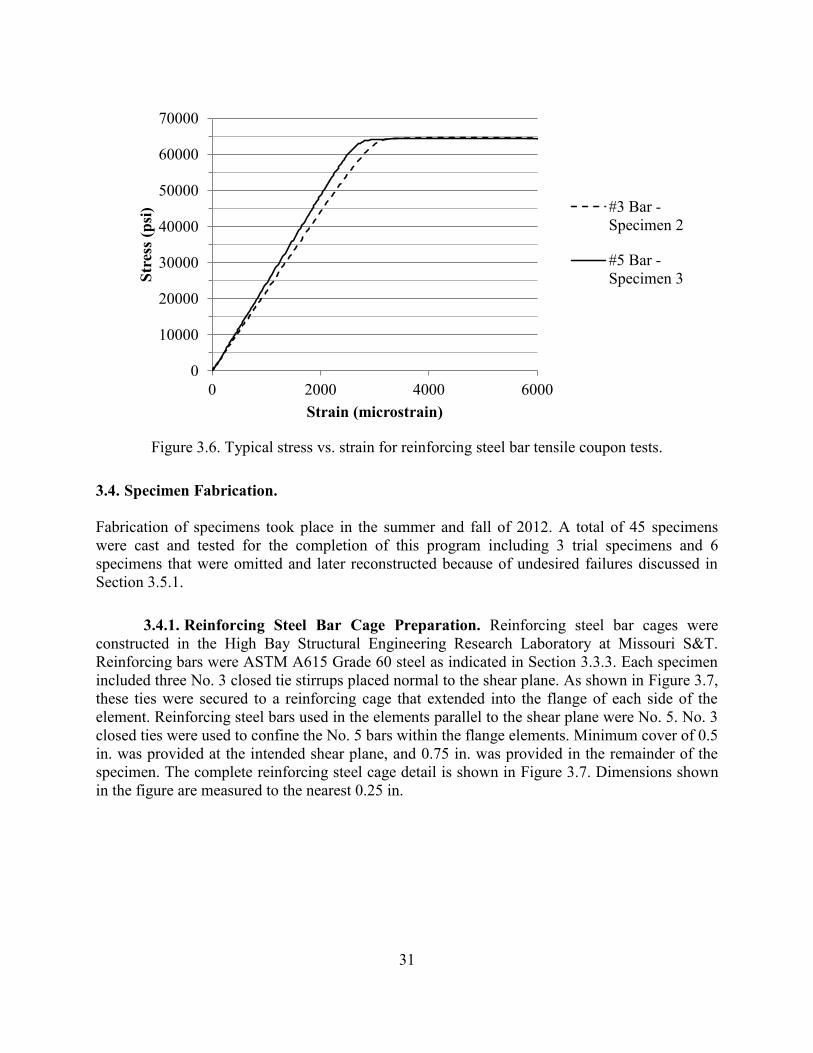
31
Figure 3.6. Typical stress vs. strain for reinforcing steel bar tensile coupon tests.
3.4. Specimen Fabrication.
Fabrication of specimens took place in the summer and fall of 2012. A total of 45 specimens
were cast and tested for the completion of this program including 3 trial specimens and 6
specimens that were omitted and later reconstructed because of undesired failures discussed in
Section 3.5.1.
3.4.1. Reinforcing Steel Bar Cage Preparation. Reinforcing steel bar cages were
constructed in the High Bay Structural Engineering Research Laboratory at Missouri S&T.
Reinforcing bars were ASTM A615 Grade 60 steel as indicated in Section 3.3.3. Each specimen
included three No. 3 closed tie stirrups placed normal to the shear plane. As shown in Figure 3.7,
these ties were secured to a reinforcing cage that extended into the flange of each side of the
element. Reinforcing steel bars used in the elements parallel to the shear plane were No. 5. No. 3
closed ties were used to confine the No. 5 bars within the flange elements. Minimum cover of 0.5
in. was provided at the intended shear plane, and 0.75 in. was provided in the remainder of the
specimen. The complete reinforcing steel cage detail is shown in Figure 3.7. Dimensions shown
in the figure are measured to the nearest 0.25 in.
0
10000
20000
30000
40000
50000
60000
70000
0 2000 4000 6000
Str
ess
(psi
)
Strain (microstrain)
#3 Bar -
Specimen 2
#5 Bar -
Specimen 3
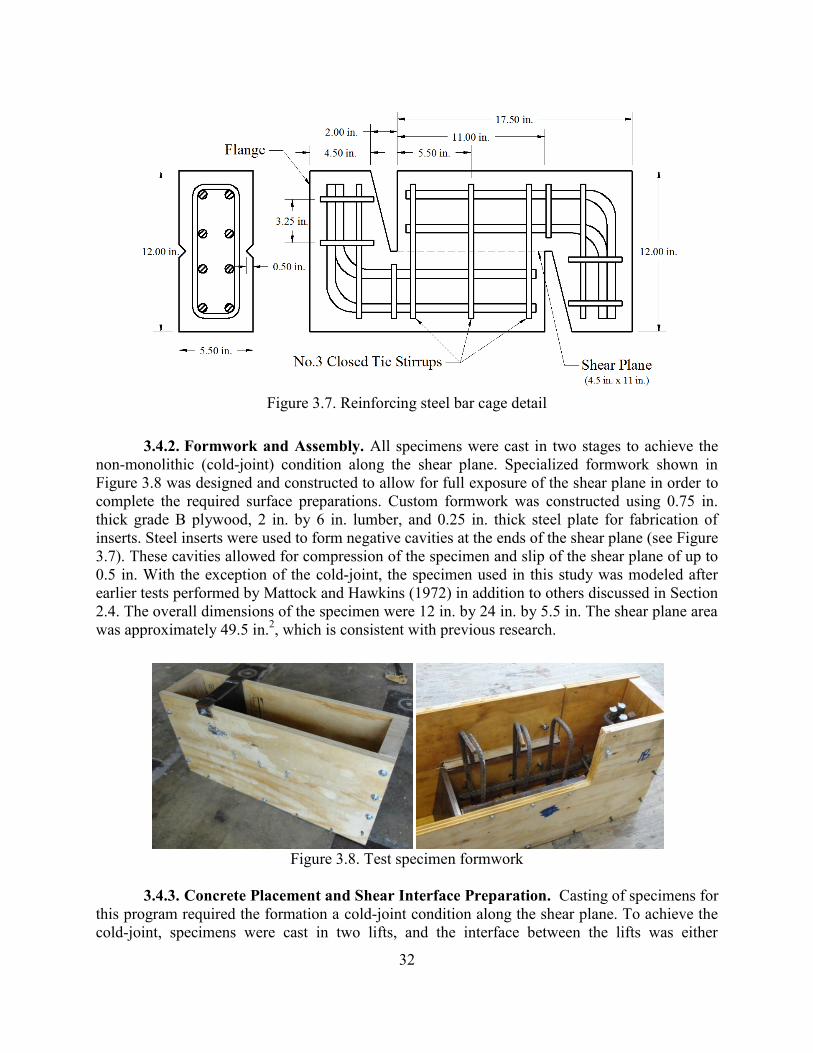
32
Figure 3.7. Reinforcing steel bar cage detail
3.4.2. Formwork and Assembly. All specimens were cast in two stages to achieve the
non-monolithic (cold-joint) condition along the shear plane. Specialized formwork shown in
Figure 3.8 was designed and constructed to allow for full exposure of the shear plane in order to
complete the required surface preparations. Custom formwork was constructed using 0.75 in.
thick grade B plywood, 2 in. by 6 in. lumber, and 0.25 in. thick steel plate for fabrication of
inserts. Steel inserts were used to form negative cavities at the ends of the shear plane (see Figure
3.7). These cavities allowed for compression of the specimen and slip of the shear plane of up to
0.5 in. With the exception of the cold-joint, the specimen used in this study was modeled after
earlier tests performed by Mattock and Hawkins (1972) in addition to others discussed in Section
2.4. The overall dimensions of the specimen were 12 in. by 24 in. by 5.5 in. The shear plane area
was approximately 49.5 in.2, which is consistent with previous research.
Figure 3.8. Test specimen formwork
3.4.3. Concrete Placement and Shear Interface Preparation. Casting of specimens for
this program required the formation a cold-joint condition along the shear plane. To achieve the
cold-joint, specimens were cast in two lifts, and the interface between the lifts was either
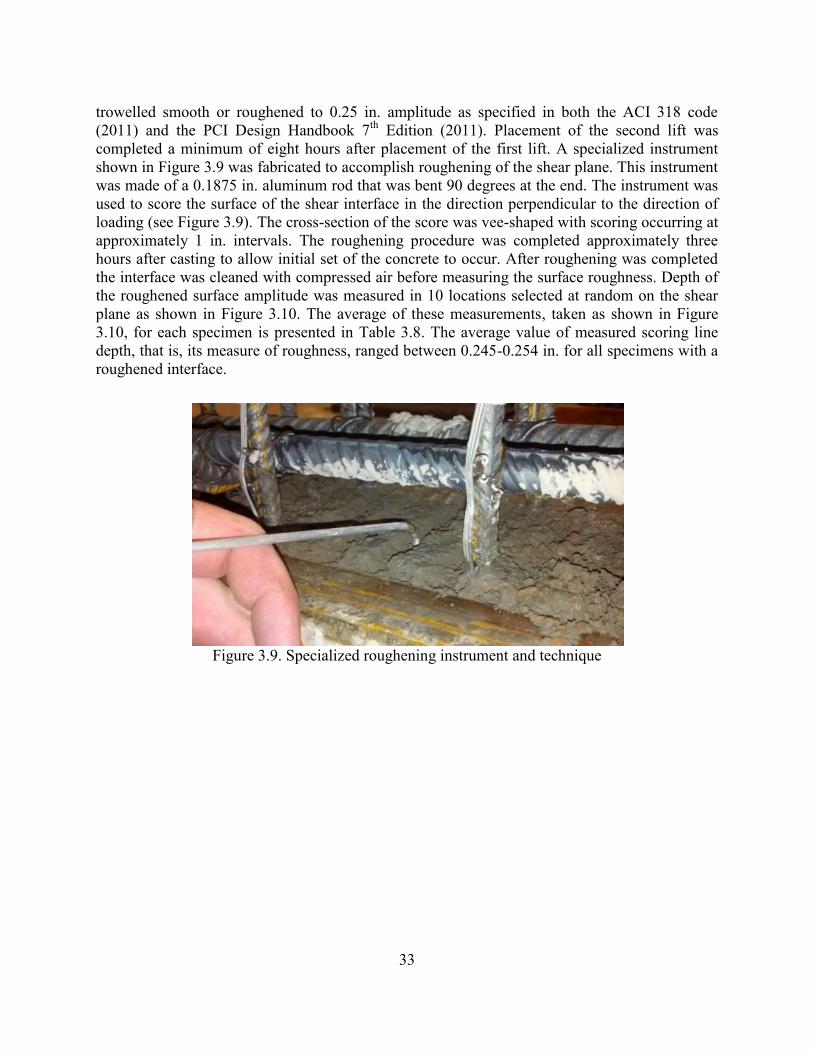
33
trowelled smooth or roughened to 0.25 in. amplitude as specified in both the ACI 318 code
(2011) and the PCI Design Handbook 7th
Edition (2011). Placement of the second lift was
completed a minimum of eight hours after placement of the first lift. A specialized instrument
shown in Figure 3.9 was fabricated to accomplish roughening of the shear plane. This instrument
was made of a 0.1875 in. aluminum rod that was bent 90 degrees at the end. The instrument was
used to score the surface of the shear interface in the direction perpendicular to the direction of
loading (see Figure 3.9). The cross-section of the score was vee-shaped with scoring occurring at
approximately 1 in. intervals. The roughening procedure was completed approximately three
hours after casting to allow initial set of the concrete to occur. After roughening was completed
the interface was cleaned with compressed air before measuring the surface roughness. Depth of
the roughened surface amplitude was measured in 10 locations selected at random on the shear
plane as shown in Figure 3.10. The average of these measurements, taken as shown in Figure
3.10, for each specimen is presented in Table 3.8. The average value of measured scoring line
depth, that is, its measure of roughness, ranged between 0.245-0.254 in. for all specimens with a
roughened interface.
Figure 3.9. Specialized roughening instrument and technique
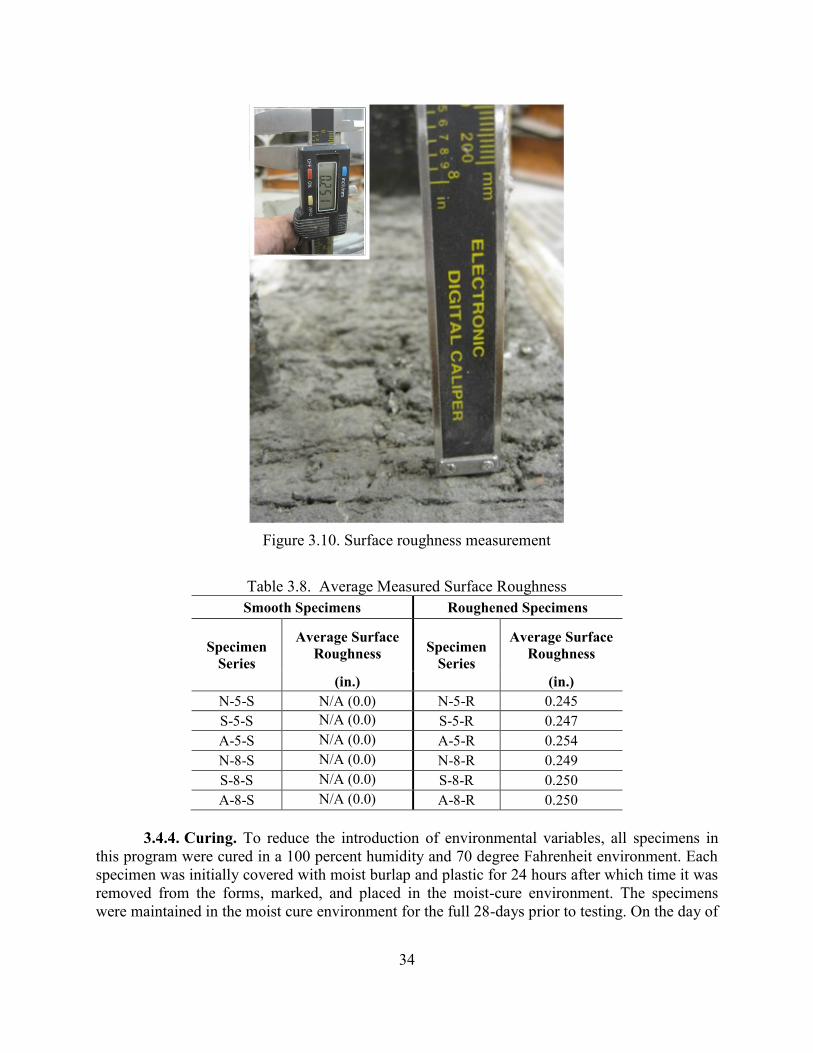
34
Table 3.8. Average Measured Surface Roughness
Smooth Specimens Roughened Specimens
Specimen
Series
Average Surface
Roughness Specimen
Series
Average Surface
Roughness
(in.) (in.)
N-5-S N/A (0.0) N-5-R 0.245
S-5-S N/A (0.0) S-5-R 0.247
A-5-S N/A (0.0) A-5-R 0.254
N-8-S N/A (0.0) N-8-R 0.249
S-8-S N/A (0.0) S-8-R 0.250
A-8-S N/A (0.0) A-8-R 0.250
3.4.4. Curing. To reduce the introduction of environmental variables, all specimens in
this program were cured in a 100 percent humidity and 70 degree Fahrenheit environment. Each
specimen was initially covered with moist burlap and plastic for 24 hours after which time it was
removed from the forms, marked, and placed in the moist-cure environment. The specimens
were maintained in the moist cure environment for the full 28-days prior to testing. On the day of
Figure 3.10. Surface roughness measurement
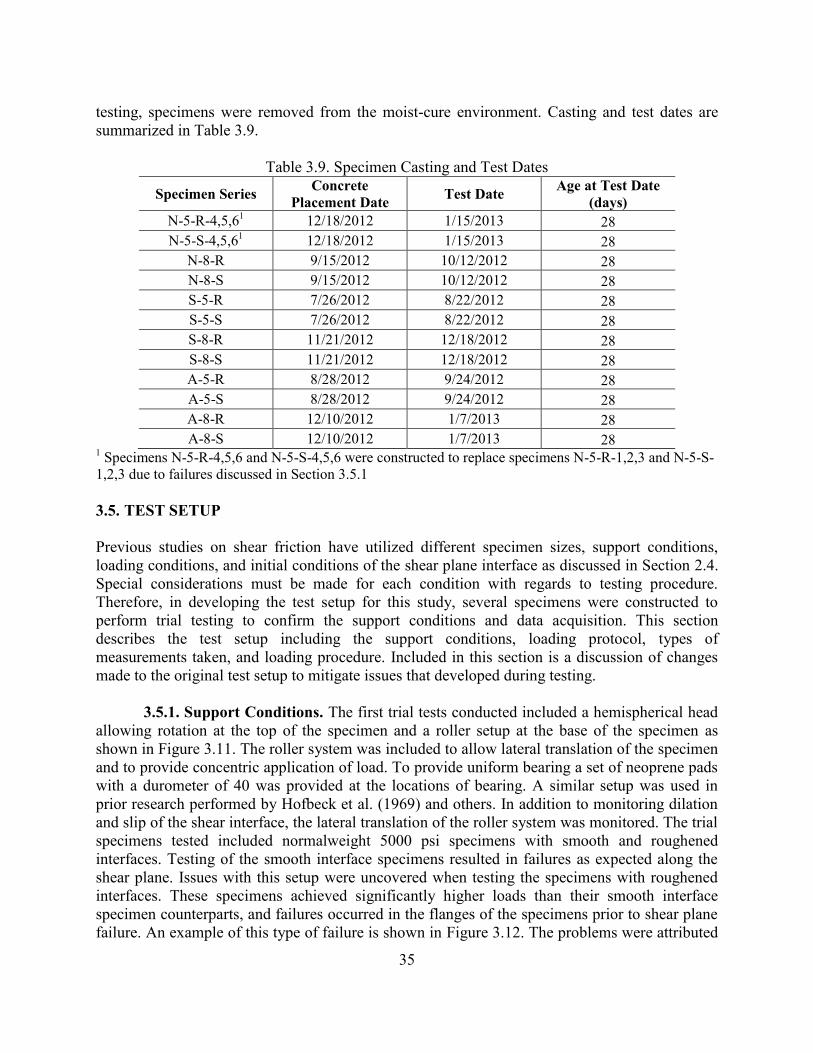
35
testing, specimens were removed from the moist-cure environment. Casting and test dates are
summarized in Table 3.9.
Table 3.9. Specimen Casting and Test Dates
Specimen Series Concrete
Placement Date Test Date
Age at Test Date
(days)
N-5-R-4,5,61 12/18/2012 1/15/2013 28
N-5-S-4,5,61 12/18/2012 1/15/2013 28
N-8-R 9/15/2012 10/12/2012 28
N-8-S 9/15/2012 10/12/2012 28
S-5-R 7/26/2012 8/22/2012 28
S-5-S 7/26/2012 8/22/2012 28
S-8-R 11/21/2012 12/18/2012 28
S-8-S 11/21/2012 12/18/2012 28
A-5-R 8/28/2012 9/24/2012 28
A-5-S 8/28/2012 9/24/2012 28
A-8-R 12/10/2012 1/7/2013 28
A-8-S 12/10/2012 1/7/2013 28 1 Specimens N-5-R-4,5,6 and N-5-S-4,5,6 were constructed to replace specimens N-5-R-1,2,3 and N-5-S-
1,2,3 due to failures discussed in Section 3.5.1
3.5. TEST SETUP
Previous studies on shear friction have utilized different specimen sizes, support conditions,
loading conditions, and initial conditions of the shear plane interface as discussed in Section 2.4.
Special considerations must be made for each condition with regards to testing procedure.
Therefore, in developing the test setup for this study, several specimens were constructed to
perform trial testing to confirm the support conditions and data acquisition. This section
describes the test setup including the support conditions, loading protocol, types of
measurements taken, and loading procedure. Included in this section is a discussion of changes
made to the original test setup to mitigate issues that developed during testing.
3.5.1. Support Conditions. The first trial tests conducted included a hemispherical head
allowing rotation at the top of the specimen and a roller setup at the base of the specimen as
shown in Figure 3.11. The roller system was included to allow lateral translation of the specimen
and to provide concentric application of load. To provide uniform bearing a set of neoprene pads
with a durometer of 40 was provided at the locations of bearing. A similar setup was used in
prior research performed by Hofbeck et al. (1969) and others. In addition to monitoring dilation
and slip of the shear interface, the lateral translation of the roller system was monitored. The trial
specimens tested included normalweight 5000 psi specimens with smooth and roughened
interfaces. Testing of the smooth interface specimens resulted in failures as expected along the
shear plane. Issues with this setup were uncovered when testing the specimens with roughened
interfaces. These specimens achieved significantly higher loads than their smooth interface
specimen counterparts, and failures occurred in the flanges of the specimens prior to shear plane
failure. An example of this type of failure is shown in Figure 3.12. The problems were attributed
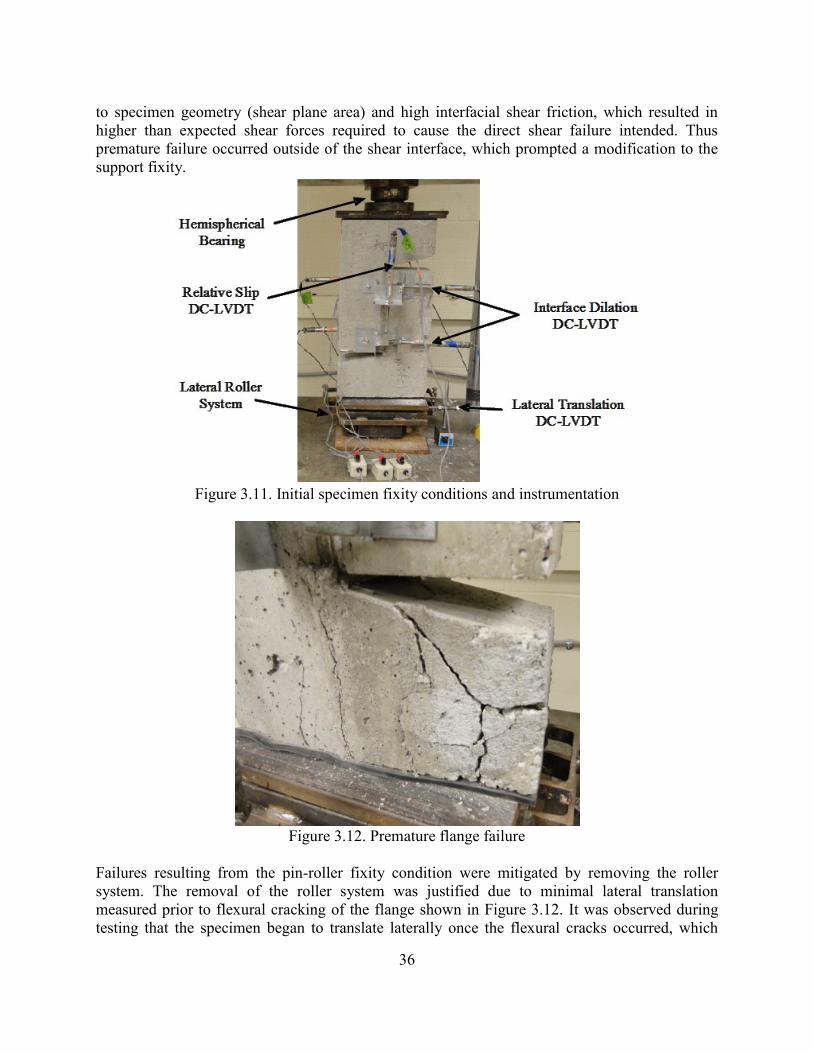
36
to specimen geometry (shear plane area) and high interfacial shear friction, which resulted in
higher than expected shear forces required to cause the direct shear failure intended. Thus
premature failure occurred outside of the shear interface, which prompted a modification to the
support fixity.
Figure 3.11. Initial specimen fixity conditions and instrumentation
Figure 3.12. Premature flange failure
Failures resulting from the pin-roller fixity condition were mitigated by removing the roller
system. The removal of the roller system was justified due to minimal lateral translation
measured prior to flexural cracking of the flange shown in Figure 3.12. It was observed during
testing that the specimen began to translate laterally once the flexural cracks occurred, which
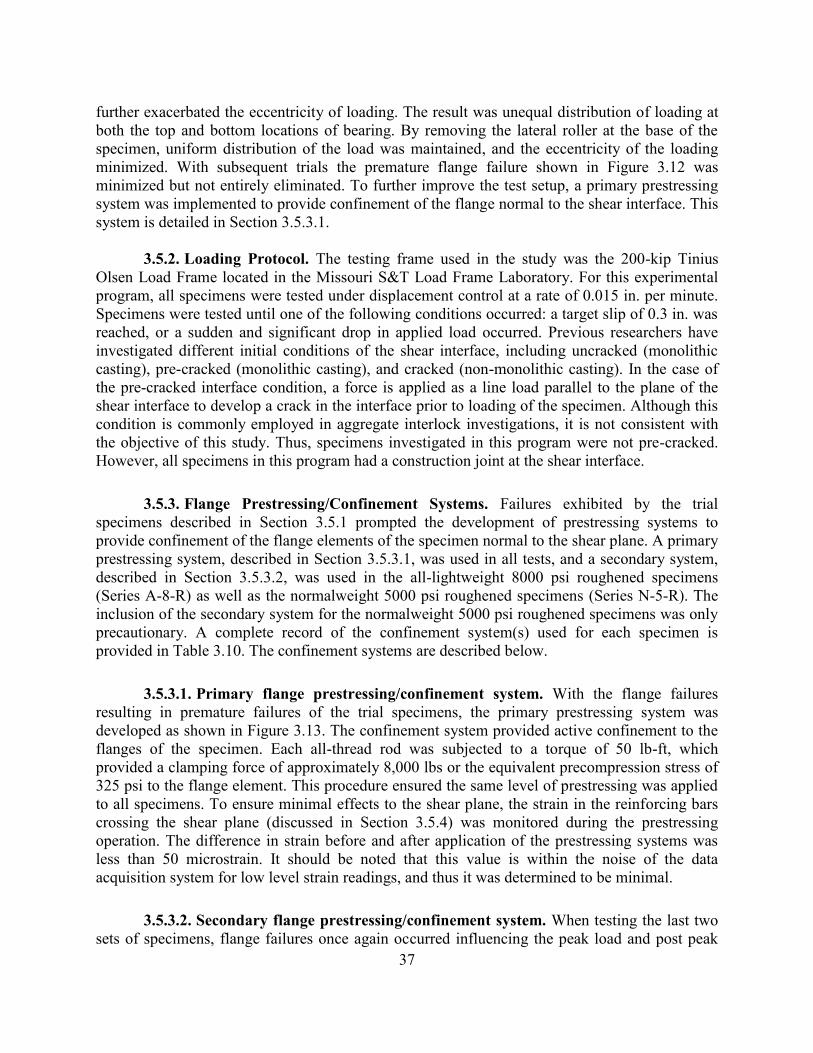
37
further exacerbated the eccentricity of loading. The result was unequal distribution of loading at
both the top and bottom locations of bearing. By removing the lateral roller at the base of the
specimen, uniform distribution of the load was maintained, and the eccentricity of the loading
minimized. With subsequent trials the premature flange failure shown in Figure 3.12 was
minimized but not entirely eliminated. To further improve the test setup, a primary prestressing
system was implemented to provide confinement of the flange normal to the shear interface. This
system is detailed in Section 3.5.3.1.
3.5.2. Loading Protocol. The testing frame used in the study was the 200-kip Tinius
Olsen Load Frame located in the Missouri S&T Load Frame Laboratory. For this experimental
program, all specimens were tested under displacement control at a rate of 0.015 in. per minute.
Specimens were tested until one of the following conditions occurred: a target slip of 0.3 in. was
reached, or a sudden and significant drop in applied load occurred. Previous researchers have
investigated different initial conditions of the shear interface, including uncracked (monolithic
casting), pre-cracked (monolithic casting), and cracked (non-monolithic casting). In the case of
the pre-cracked interface condition, a force is applied as a line load parallel to the plane of the
shear interface to develop a crack in the interface prior to loading of the specimen. Although this
condition is commonly employed in aggregate interlock investigations, it is not consistent with
the objective of this study. Thus, specimens investigated in this program were not pre-cracked.
However, all specimens in this program had a construction joint at the shear interface.
3.5.3. Flange Prestressing/Confinement Systems. Failures exhibited by the trial
specimens described in Section 3.5.1 prompted the development of prestressing systems to
provide confinement of the flange elements of the specimen normal to the shear plane. A primary
prestressing system, described in Section 3.5.3.1, was used in all tests, and a secondary system,
described in Section 3.5.3.2, was used in the all-lightweight 8000 psi roughened specimens
(Series A-8-R) as well as the normalweight 5000 psi roughened specimens (Series N-5-R). The
inclusion of the secondary system for the normalweight 5000 psi roughened specimens was only
precautionary. A complete record of the confinement system(s) used for each specimen is
provided in Table 3.10. The confinement systems are described below.
3.5.3.1. Primary flange prestressing/confinement system. With the flange failures
resulting in premature failures of the trial specimens, the primary prestressing system was
developed as shown in Figure 3.13. The confinement system provided active confinement to the
flanges of the specimen. Each all-thread rod was subjected to a torque of 50 lb-ft, which
provided a clamping force of approximately 8,000 lbs or the equivalent precompression stress of
325 psi to the flange element. This procedure ensured the same level of prestressing was applied
to all specimens. To ensure minimal effects to the shear plane, the strain in the reinforcing bars
crossing the shear plane (discussed in Section 3.5.4) was monitored during the prestressing
operation. The difference in strain before and after application of the prestressing systems was
less than 50 microstrain. It should be noted that this value is within the noise of the data
acquisition system for low level strain readings, and thus it was determined to be minimal.
3.5.3.2. Secondary flange prestressing/confinement system. When testing the last two
sets of specimens, flange failures once again occurred influencing the peak load and post peak
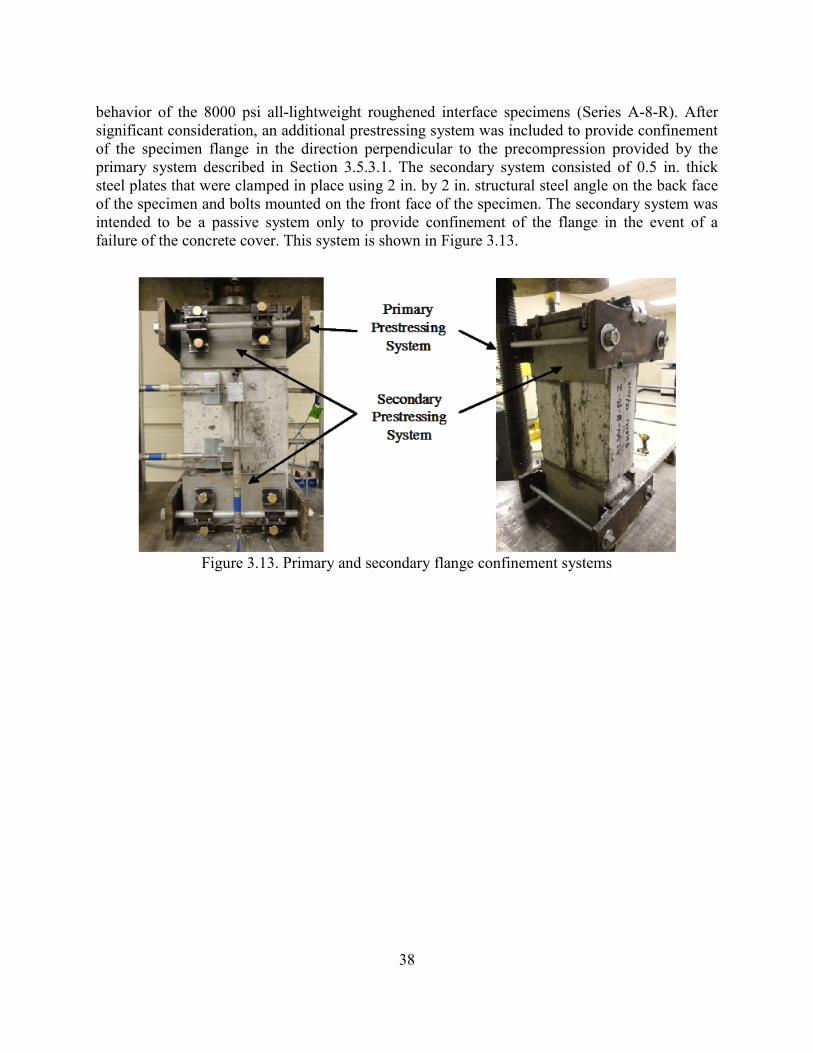
38
behavior of the 8000 psi all-lightweight roughened interface specimens (Series A-8-R). After
significant consideration, an additional prestressing system was included to provide confinement
of the specimen flange in the direction perpendicular to the precompression provided by the
primary system described in Section 3.5.3.1. The secondary system consisted of 0.5 in. thick
steel plates that were clamped in place using 2 in. by 2 in. structural steel angle on the back face
of the specimen and bolts mounted on the front face of the specimen. The secondary system was
intended to be a passive system only to provide confinement of the flange in the event of a
failure of the concrete cover. This system is shown in Figure 3.13.
Figure 3.13. Primary and secondary flange confinement systems
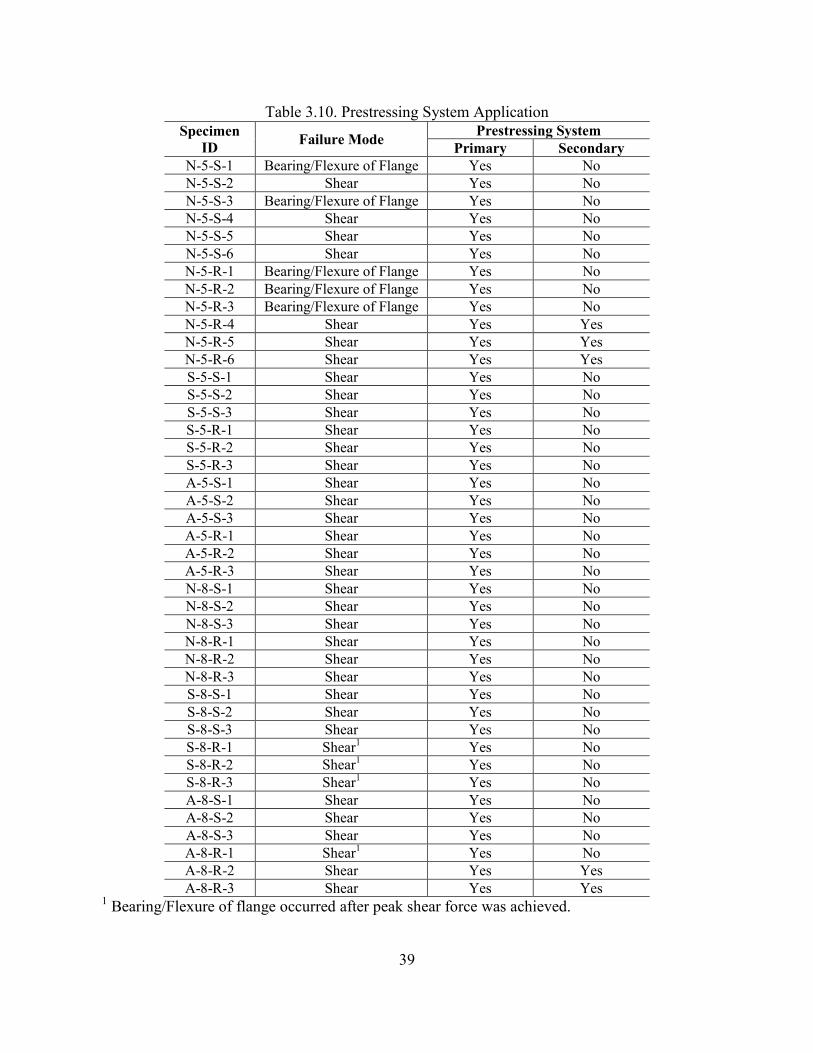
39
Table 3.10. Prestressing System Application
Specimen
ID Failure Mode
Prestressing System
Primary Secondary
N-5-S-1 Bearing/Flexure of Flange Yes No
N-5-S-2 Shear Yes No
N-5-S-3 Bearing/Flexure of Flange Yes No
N-5-S-4 Shear Yes No
N-5-S-5 Shear Yes No
N-5-S-6 Shear Yes No
N-5-R-1 Bearing/Flexure of Flange Yes No
N-5-R-2 Bearing/Flexure of Flange Yes No
N-5-R-3 Bearing/Flexure of Flange Yes No
N-5-R-4 Shear Yes Yes
N-5-R-5 Shear Yes Yes
N-5-R-6 Shear Yes Yes
S-5-S-1 Shear Yes No
S-5-S-2 Shear Yes No
S-5-S-3 Shear Yes No
S-5-R-1 Shear Yes No
S-5-R-2 Shear Yes No
S-5-R-3 Shear Yes No
A-5-S-1 Shear Yes No
A-5-S-2 Shear Yes No
A-5-S-3 Shear Yes No
A-5-R-1 Shear Yes No
A-5-R-2 Shear Yes No
A-5-R-3 Shear Yes No
N-8-S-1 Shear Yes No
N-8-S-2 Shear Yes No
N-8-S-3 Shear Yes No
N-8-R-1 Shear Yes No
N-8-R-2 Shear Yes No
N-8-R-3 Shear Yes No
S-8-S-1 Shear Yes No
S-8-S-2 Shear Yes No
S-8-S-3 Shear Yes No
S-8-R-1 Shear1 Yes No
S-8-R-2 Shear1 Yes No
S-8-R-3 Shear1 Yes No
A-8-S-1 Shear Yes No
A-8-S-2 Shear Yes No
A-8-S-3 Shear Yes No
A-8-R-1 Shear1 Yes No
A-8-R-2 Shear Yes Yes
A-8-R-3 Shear Yes Yes 1 Bearing/Flexure of flange occurred after peak shear force was achieved.
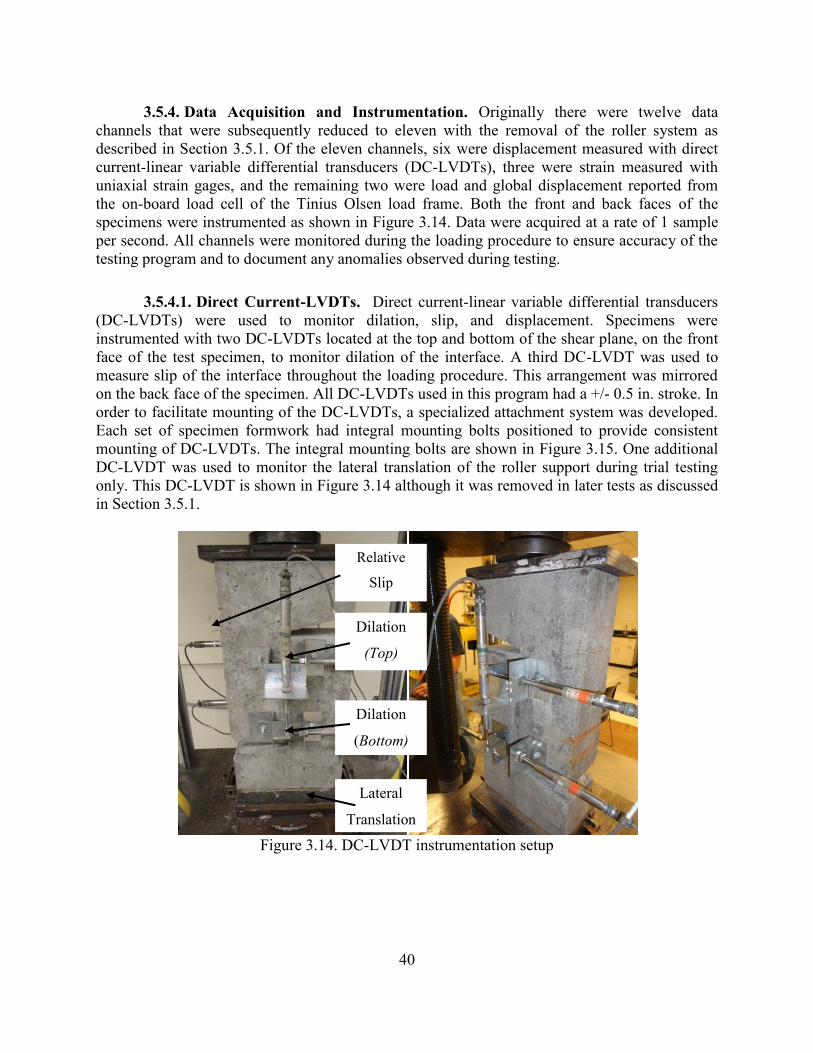
40
3.5.4. Data Acquisition and Instrumentation. Originally there were twelve data
channels that were subsequently reduced to eleven with the removal of the roller system as
described in Section 3.5.1. Of the eleven channels, six were displacement measured with direct
current-linear variable differential transducers (DC-LVDTs), three were strain measured with
uniaxial strain gages, and the remaining two were load and global displacement reported from
the on-board load cell of the Tinius Olsen load frame. Both the front and back faces of the
specimens were instrumented as shown in Figure 3.14. Data were acquired at a rate of 1 sample
per second. All channels were monitored during the loading procedure to ensure accuracy of the
testing program and to document any anomalies observed during testing.
3.5.4.1. Direct Current-LVDTs. Direct current-linear variable differential transducers
(DC-LVDTs) were used to monitor dilation, slip, and displacement. Specimens were
instrumented with two DC-LVDTs located at the top and bottom of the shear plane, on the front
face of the test specimen, to monitor dilation of the interface. A third DC-LVDT was used to
measure slip of the interface throughout the loading procedure. This arrangement was mirrored
on the back face of the specimen. All DC-LVDTs used in this program had a +/- 0.5 in. stroke. In
order to facilitate mounting of the DC-LVDTs, a specialized attachment system was developed.
Each set of specimen formwork had integral mounting bolts positioned to provide consistent
mounting of DC-LVDTs. The integral mounting bolts are shown in Figure 3.15. One additional
DC-LVDT was used to monitor the lateral translation of the roller support during trial testing
only. This DC-LVDT is shown in Figure 3.14 although it was removed in later tests as discussed
in Section 3.5.1.
Figure 3.14. DC-LVDT instrumentation setup
Relative
Slip
Dilation
(Top)
Lateral
Translation
Dilation
(Bottom)
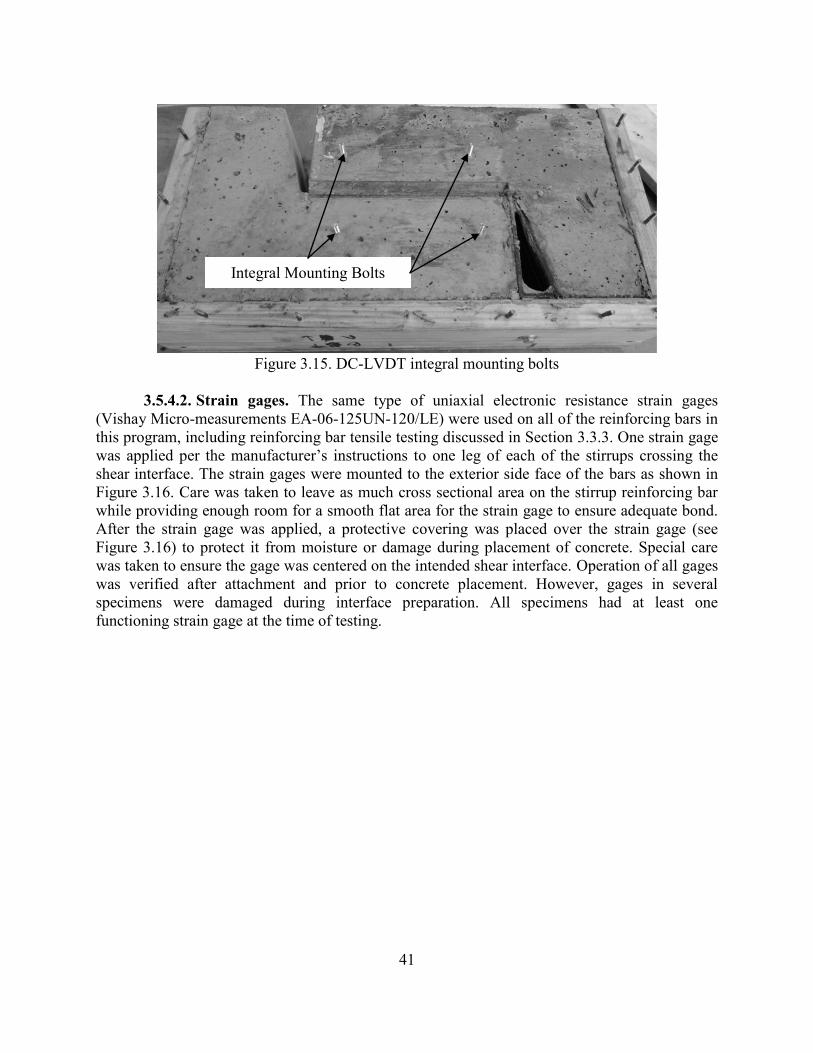
41
Figure 3.15. DC-LVDT integral mounting bolts
3.5.4.2. Strain gages. The same type of uniaxial electronic resistance strain gages
(Vishay Micro-measurements EA-06-125UN-120/LE) were used on all of the reinforcing bars in
this program, including reinforcing bar tensile testing discussed in Section 3.3.3. One strain gage
was applied per the manufacturer’s instructions to one leg of each of the stirrups crossing the
shear interface. The strain gages were mounted to the exterior side face of the bars as shown in
Figure 3.16. Care was taken to leave as much cross sectional area on the stirrup reinforcing bar
while providing enough room for a smooth flat area for the strain gage to ensure adequate bond.
After the strain gage was applied, a protective covering was placed over the strain gage (see
Figure 3.16) to protect it from moisture or damage during placement of concrete. Special care
was taken to ensure the gage was centered on the intended shear interface. Operation of all gages
was verified after attachment and prior to concrete placement. However, gages in several
specimens were damaged during interface preparation. All specimens had at least one
functioning strain gage at the time of testing.
Integral Mounting Bolts
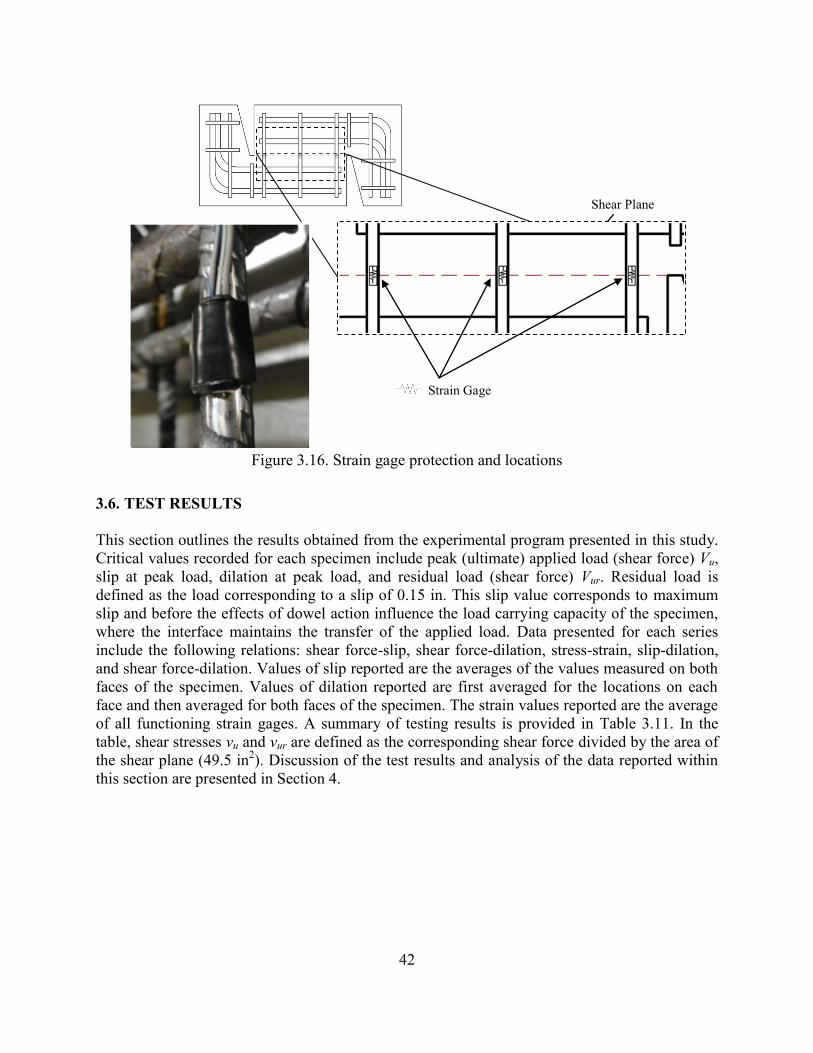
42
Figure 3.16. Strain gage protection and locations
3.6. TEST RESULTS
This section outlines the results obtained from the experimental program presented in this study.
Critical values recorded for each specimen include peak (ultimate) applied load (shear force) Vu,
slip at peak load, dilation at peak load, and residual load (shear force) Vur. Residual load is
defined as the load corresponding to a slip of 0.15 in. This slip value corresponds to maximum
slip and before the effects of dowel action influence the load carrying capacity of the specimen,
where the interface maintains the transfer of the applied load. Data presented for each series
include the following relations: shear force-slip, shear force-dilation, stress-strain, slip-dilation,
and shear force-dilation. Values of slip reported are the averages of the values measured on both
faces of the specimen. Values of dilation reported are first averaged for the locations on each
face and then averaged for both faces of the specimen. The strain values reported are the average
of all functioning strain gages. A summary of testing results is provided in Table 3.11. In the
table, shear stresses vu and vur are defined as the corresponding shear force divided by the area of
the shear plane (49.5 in2). Discussion of the test results and analysis of the data reported within
this section are presented in Section 4.
Strain Gage
Shear Plane
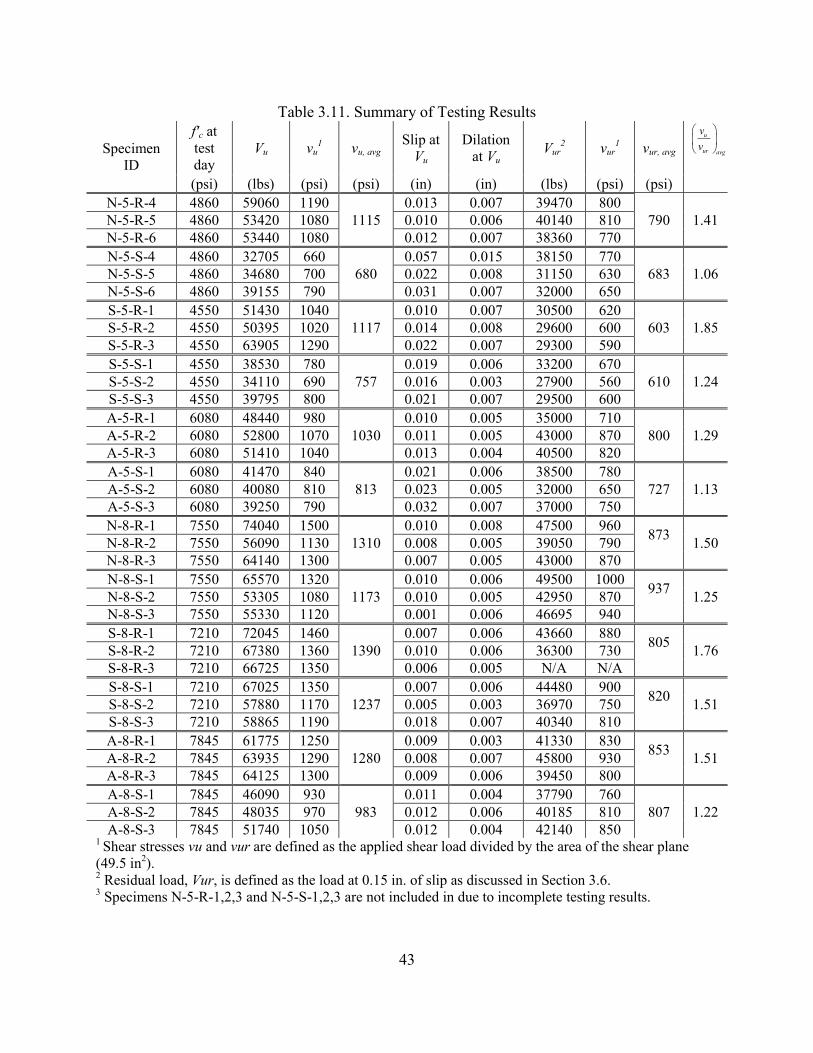
43
Table 3.11. Summary of Testing Results
Specimen
ID
f'c at
test
day
Vu vu1
vu, avg Slip at
Vu
Dilation
at Vu Vur
2 vur
1 vur, avg
u
ur avg
v
v
(psi) (lbs) (psi) (psi) (in) (in) (lbs) (psi) (psi)
N-5-R-4 4860 59060 1190
1115
0.013 0.007 39470 800
790 1.41 N-5-R-5 4860 53420 1080 0.010 0.006 40140 810
N-5-R-6 4860 53440 1080 0.012 0.007 38360 770
N-5-S-4 4860 32705 660
680
0.057 0.015 38150 770
683 1.06 N-5-S-5 4860 34680 700 0.022 0.008 31150 630
N-5-S-6 4860 39155 790 0.031 0.007 32000 650
S-5-R-1 4550 51430 1040
1117
0.010 0.007 30500 620
603 1.85 S-5-R-2 4550 50395 1020 0.014 0.008 29600 600
S-5-R-3 4550 63905 1290 0.022 0.007 29300 590
S-5-S-1 4550 38530 780
757
0.019 0.006 33200 670
610 1.24 S-5-S-2 4550 34110 690 0.016 0.003 27900 560
S-5-S-3 4550 39795 800 0.021 0.007 29500 600
A-5-R-1 6080 48440 980
1030
0.010 0.005 35000 710
800 1.29 A-5-R-2 6080 52800 1070 0.011 0.005 43000 870
A-5-R-3 6080 51410 1040 0.013 0.004 40500 820
A-5-S-1 6080 41470 840
813
0.021 0.006 38500 780
727 1.13 A-5-S-2 6080 40080 810 0.023 0.005 32000 650
A-5-S-3 6080 39250 790 0.032 0.007 37000 750
N-8-R-1 7550 74040 1500
1310
0.010 0.008 47500 960 873
1.50 N-8-R-2 7550 56090 1130 0.008 0.005 39050 790
N-8-R-3 7550 64140 1300 0.007 0.005 43000 870
N-8-S-1 7550 65570 1320
1173
0.010 0.006 49500 1000 937
1.25 N-8-S-2 7550 53305 1080 0.010 0.005 42950 870
N-8-S-3 7550 55330 1120 0.001 0.006 46695 940
S-8-R-1 7210 72045 1460
1390
0.007 0.006 43660 880 805
1.76 S-8-R-2 7210 67380 1360 0.010 0.006 36300 730
S-8-R-3 7210 66725 1350 0.006 0.005 N/A N/A
S-8-S-1 7210 67025 1350
1237
0.007 0.006 44480 900 820
1.51 S-8-S-2 7210 57880 1170 0.005 0.003 36970 750
S-8-S-3 7210 58865 1190 0.018 0.007 40340 810
A-8-R-1 7845 61775 1250
1280
0.009 0.003 41330 830 853
1.51 A-8-R-2 7845 63935 1290 0.008 0.007 45800 930
A-8-R-3 7845 64125 1300 0.009 0.006 39450 800
A-8-S-1 7845 46090 930
983
0.011 0.004 37790 760
807 1.22 A-8-S-2 7845 48035 970 0.012 0.006 40185 810
A-8-S-3 7845 51740 1050 0.012 0.004 42140 850 1 Shear stresses vu and vur are defined as the applied shear load divided by the area of the shear plane
(49.5 in2).
2 Residual load, Vur, is defined as the load at 0.15 in. of slip as discussed in Section 3.6.
3 Specimens N-5-R-1,2,3 and N-5-S-1,2,3 are not included in due to incomplete testing results.
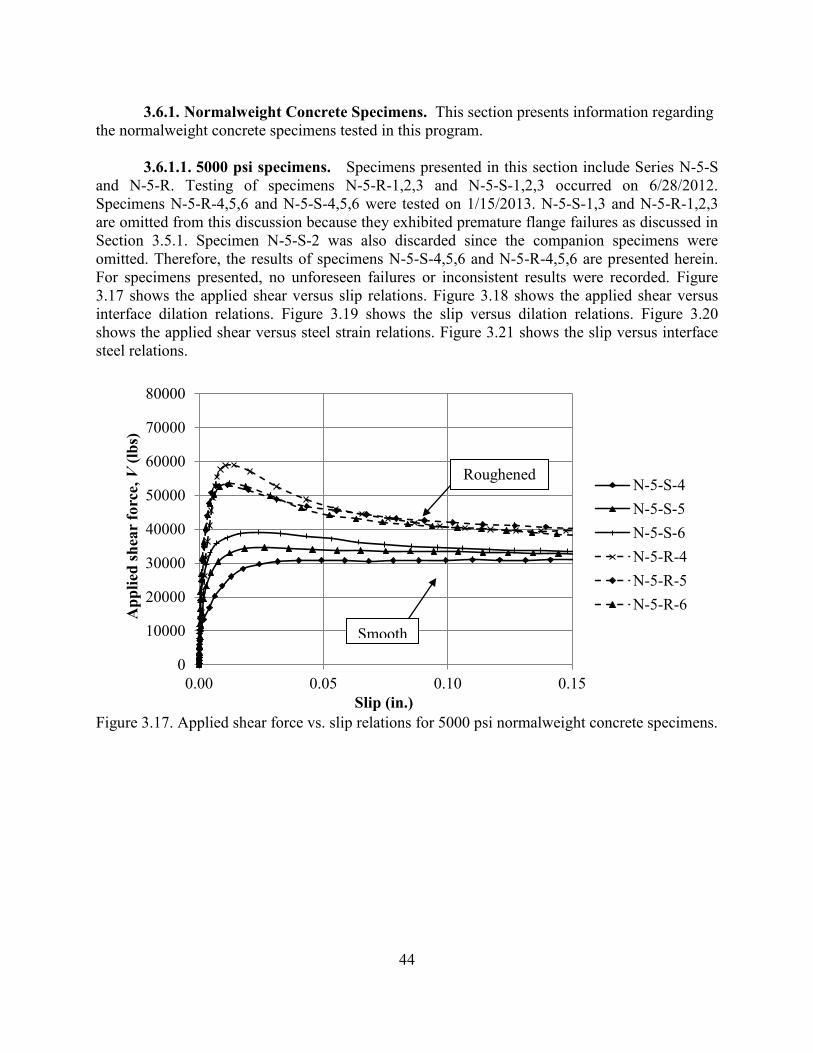
44
3.6.1. Normalweight Concrete Specimens. This section presents information regarding
the normalweight concrete specimens tested in this program.
3.6.1.1. 5000 psi specimens. Specimens presented in this section include Series N-5-S
and N-5-R. Testing of specimens N-5-R-1,2,3 and N-5-S-1,2,3 occurred on 6/28/2012.
Specimens N-5-R-4,5,6 and N-5-S-4,5,6 were tested on 1/15/2013. N-5-S-1,3 and N-5-R-1,2,3
are omitted from this discussion because they exhibited premature flange failures as discussed in
Section 3.5.1. Specimen N-5-S-2 was also discarded since the companion specimens were
omitted. Therefore, the results of specimens N-5-S-4,5,6 and N-5-R-4,5,6 are presented herein.
For specimens presented, no unforeseen failures or inconsistent results were recorded. Figure
3.17 shows the applied shear versus slip relations. Figure 3.18 shows the applied shear versus
interface dilation relations. Figure 3.19 shows the slip versus dilation relations. Figure 3.20
shows the applied shear versus steel strain relations. Figure 3.21 shows the slip versus interface
steel relations.
Figure 3.17. Applied shear force vs. slip relations for 5000 psi normalweight concrete specimens.
0
10000
20000
30000
40000
50000
60000
70000
80000
0.00 0.05 0.10 0.15
Ap
pli
ed s
hea
r fo
rce,
V (
lbs)
Slip (in.)
N-5-S-4
N-5-S-5
N-5-S-6
N-5-R-4
N-5-R-5
N-5-R-6
Roughened
Smooth
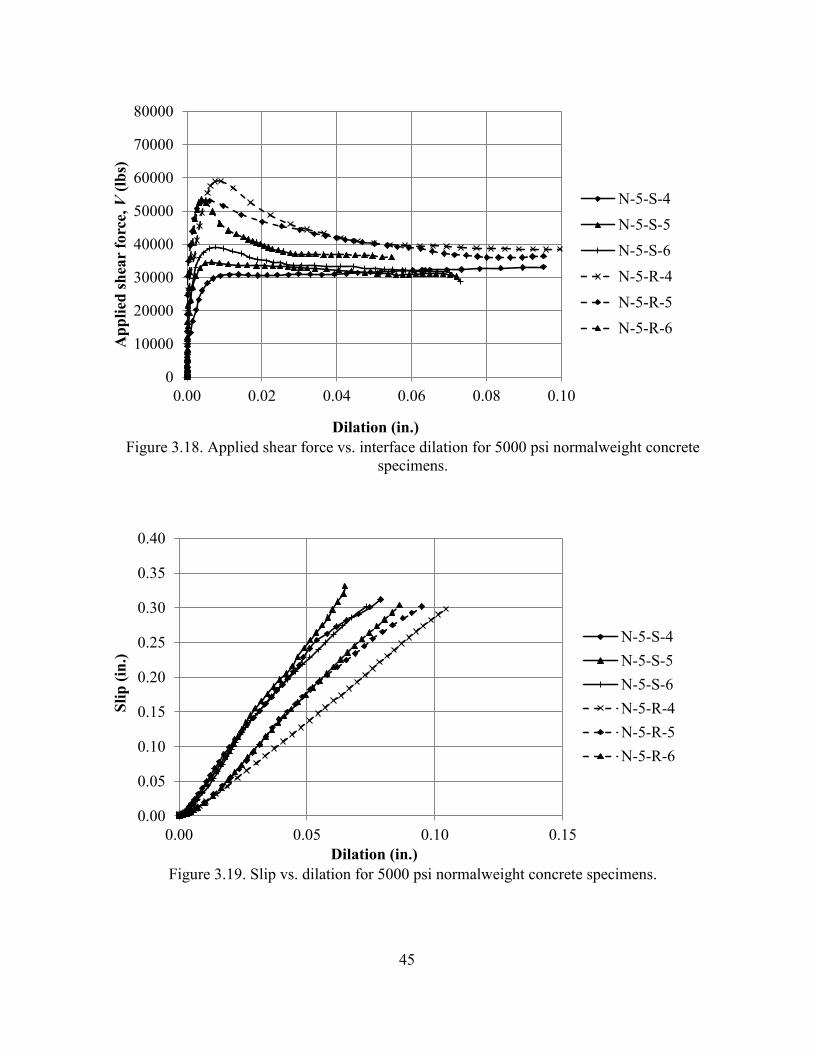
45
Figure 3.18. Applied shear force vs. interface dilation for 5000 psi normalweight concrete
specimens.
Figure 3.19. Slip vs. dilation for 5000 psi normalweight concrete specimens.
0
10000
20000
30000
40000
50000
60000
70000
80000
0.00 0.02 0.04 0.06 0.08 0.10
Ap
pli
ed s
hea
r fo
rce,
V (
lbs)
Dilation (in.)
N-5-S-4
N-5-S-5
N-5-S-6
N-5-R-4
N-5-R-5
N-5-R-6
0.00
0.05
0.10
0.15
0.20
0.25
0.30
0.35
0.40
0.00 0.05 0.10 0.15
Sli
p (
in.)
Dilation (in.)
N-5-S-4
N-5-S-5
N-5-S-6
N-5-R-4
N-5-R-5
N-5-R-6
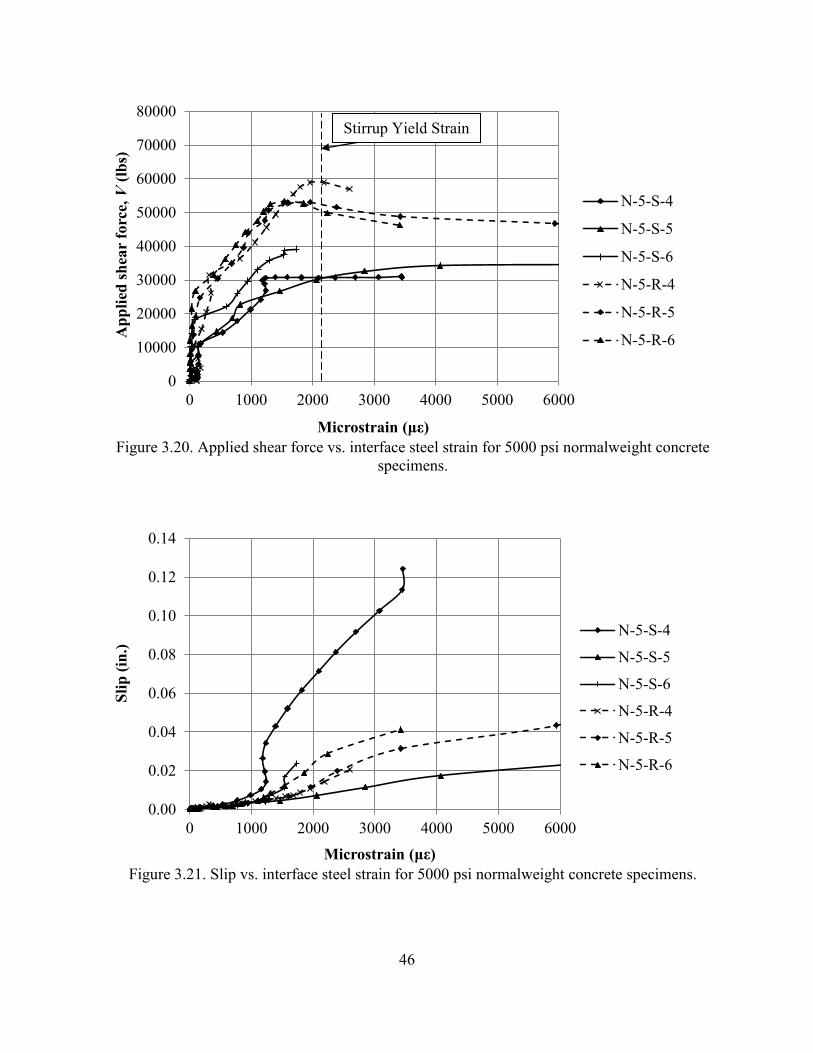
46
Figure 3.20. Applied shear force vs. interface steel strain for 5000 psi normalweight concrete
specimens.
Figure 3.21. Slip vs. interface steel strain for 5000 psi normalweight concrete specimens.
0
10000
20000
30000
40000
50000
60000
70000
80000
0 1000 2000 3000 4000 5000 6000
Ap
pli
ed s
hea
r fo
rce,
V (
lbs)
Microstrain (με)
N-5-S-4
N-5-S-5
N-5-S-6
N-5-R-4
N-5-R-5
N-5-R-6
0.00
0.02
0.04
0.06
0.08
0.10
0.12
0.14
0 1000 2000 3000 4000 5000 6000
Sli
p (
in.)
Microstrain (με)
N-5-S-4
N-5-S-5
N-5-S-6
N-5-R-4
N-5-R-5
N-5-R-6
Stirrup Yield Strain
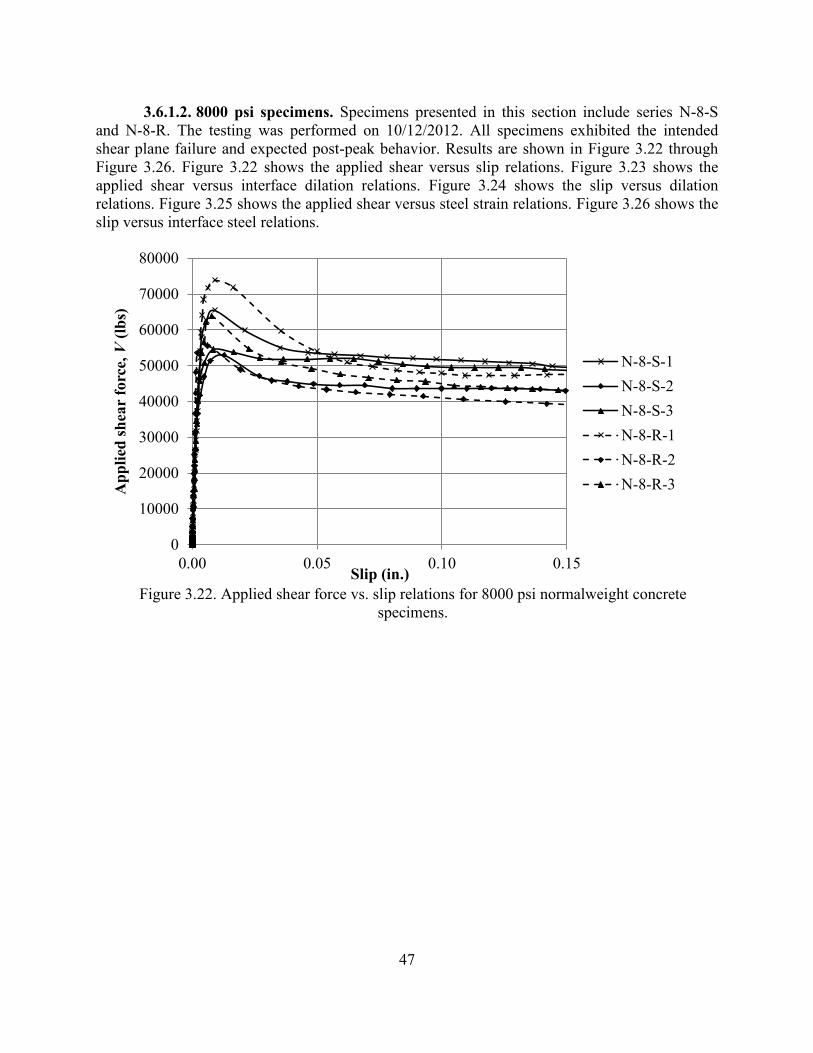
47
3.6.1.2. 8000 psi specimens. Specimens presented in this section include series N-8-S
and N-8-R. The testing was performed on 10/12/2012. All specimens exhibited the intended
shear plane failure and expected post-peak behavior. Results are shown in Figure 3.22 through
Figure 3.26. Figure 3.22 shows the applied shear versus slip relations. Figure 3.23 shows the
applied shear versus interface dilation relations. Figure 3.24 shows the slip versus dilation
relations. Figure 3.25 shows the applied shear versus steel strain relations. Figure 3.26 shows the
slip versus interface steel relations.
Figure 3.22. Applied shear force vs. slip relations for 8000 psi normalweight concrete
specimens.
0
10000
20000
30000
40000
50000
60000
70000
80000
0.00 0.05 0.10 0.15
Ap
pli
ed s
hea
r fo
rce,
V (
lbs)
Slip (in.)
N-8-S-1
N-8-S-2
N-8-S-3
N-8-R-1
N-8-R-2
N-8-R-3
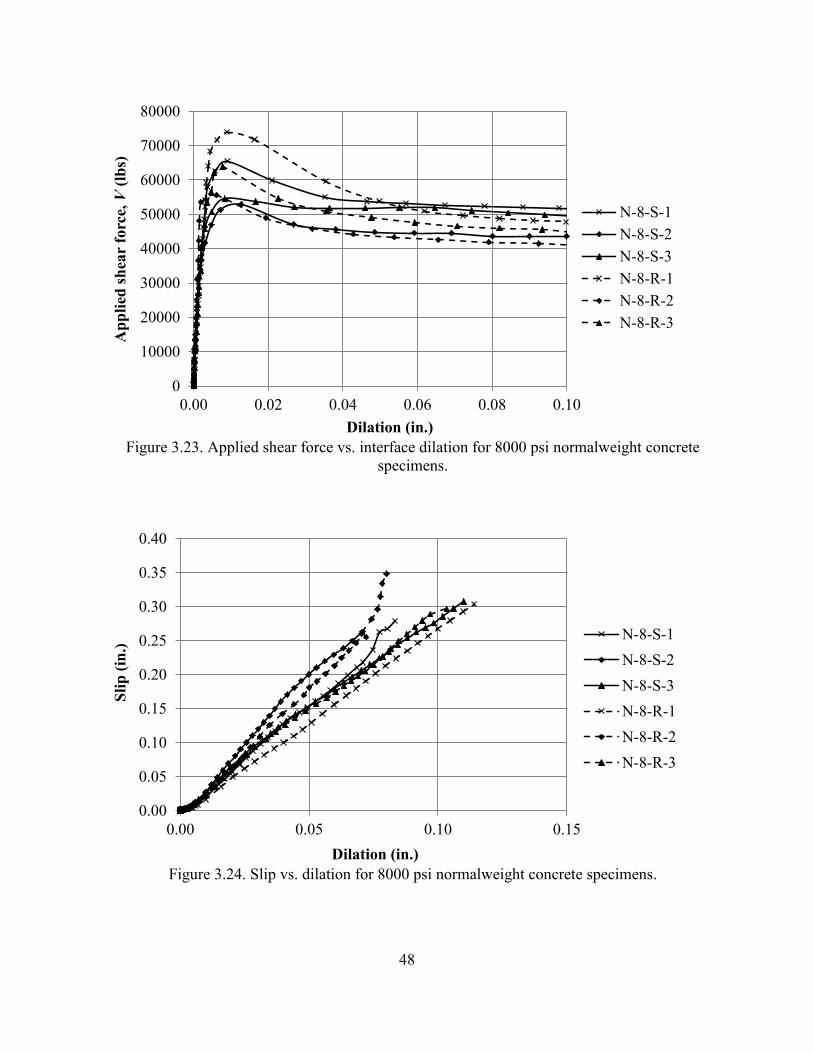
48
Figure 3.23. Applied shear force vs. interface dilation for 8000 psi normalweight concrete
specimens.
Figure 3.24. Slip vs. dilation for 8000 psi normalweight concrete specimens.
0
10000
20000
30000
40000
50000
60000
70000
80000
0.00 0.02 0.04 0.06 0.08 0.10
Ap
pli
ed s
hea
r fo
rce,
V (
lbs)
Dilation (in.)
N-8-S-1
N-8-S-2
N-8-S-3
N-8-R-1
N-8-R-2
N-8-R-3
0.00
0.05
0.10
0.15
0.20
0.25
0.30
0.35
0.40
0.00 0.05 0.10 0.15
Sli
p (
in.)
Dilation (in.)
N-8-S-1
N-8-S-2
N-8-S-3
N-8-R-1
N-8-R-2
N-8-R-3
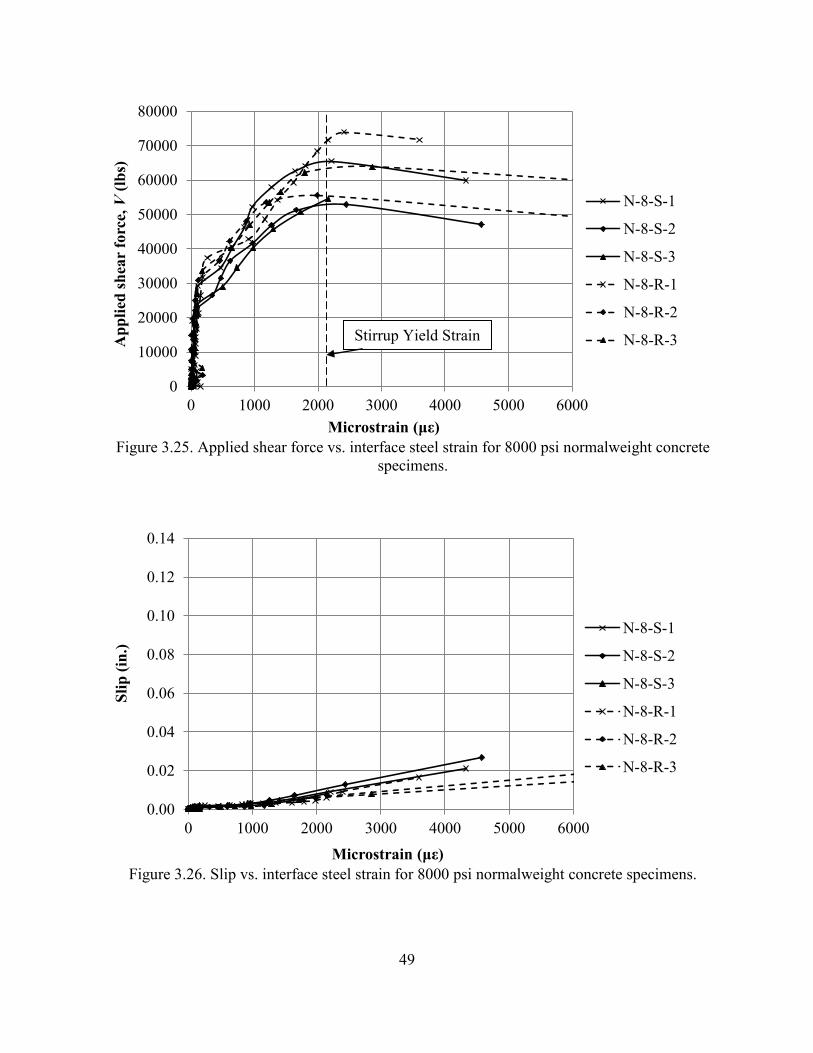
49
Figure 3.25. Applied shear force vs. interface steel strain for 8000 psi normalweight concrete
specimens.
Figure 3.26. Slip vs. interface steel strain for 8000 psi normalweight concrete specimens.
0
10000
20000
30000
40000
50000
60000
70000
80000
0 1000 2000 3000 4000 5000 6000
Ap
pli
ed s
hea
r fo
rce,
V (
lbs)
Microstrain (με)
N-8-S-1
N-8-S-2
N-8-S-3
N-8-R-1
N-8-R-2
N-8-R-3
0.00
0.02
0.04
0.06
0.08
0.10
0.12
0.14
0 1000 2000 3000 4000 5000 6000
Sli
p (
in.)
Microstrain (με)
N-8-S-1
N-8-S-2
N-8-S-3
N-8-R-1
N-8-R-2
N-8-R-3
Stirrup Yield Strain
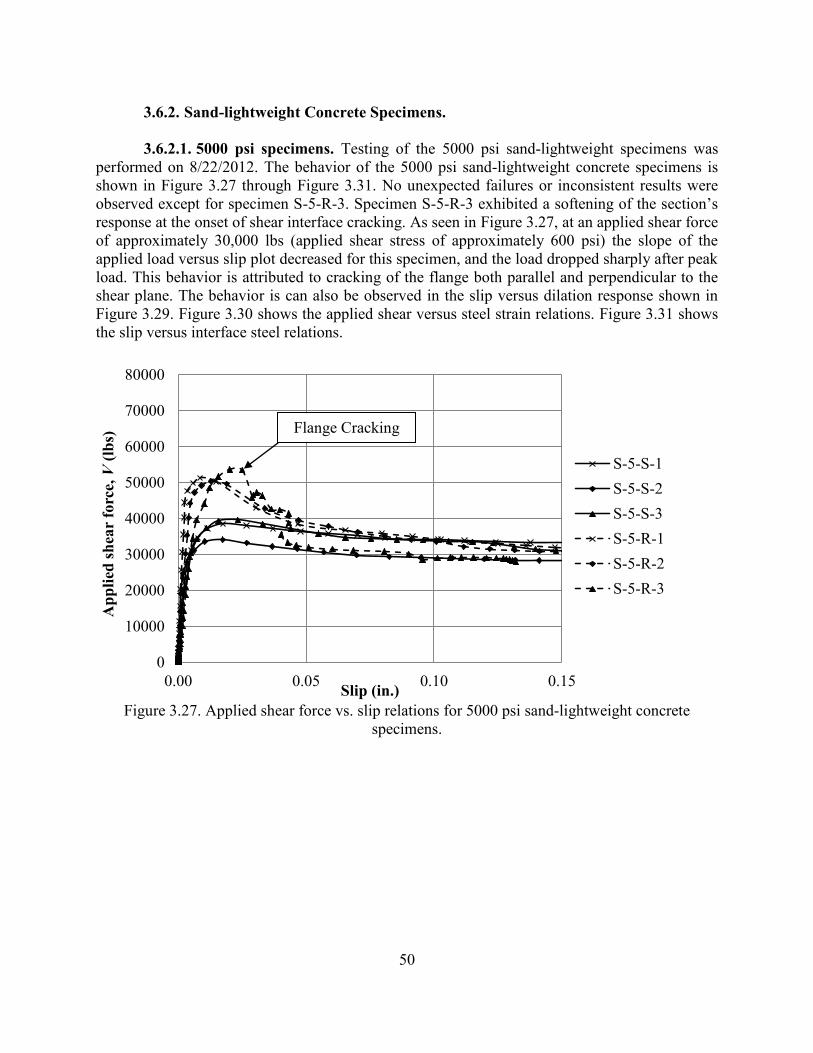
50
3.6.2. Sand-lightweight Concrete Specimens.
3.6.2.1. 5000 psi specimens. Testing of the 5000 psi sand-lightweight specimens was
performed on 8/22/2012. The behavior of the 5000 psi sand-lightweight concrete specimens is
shown in Figure 3.27 through Figure 3.31. No unexpected failures or inconsistent results were
observed except for specimen S-5-R-3. Specimen S-5-R-3 exhibited a softening of the section’s
response at the onset of shear interface cracking. As seen in Figure 3.27, at an applied shear force
of approximately 30,000 lbs (applied shear stress of approximately 600 psi) the slope of the
applied load versus slip plot decreased for this specimen, and the load dropped sharply after peak
load. This behavior is attributed to cracking of the flange both parallel and perpendicular to the
shear plane. The behavior is can also be observed in the slip versus dilation response shown in
Figure 3.29. Figure 3.30 shows the applied shear versus steel strain relations. Figure 3.31 shows
the slip versus interface steel relations.
Figure 3.27. Applied shear force vs. slip relations for 5000 psi sand-lightweight concrete
specimens.
0
10000
20000
30000
40000
50000
60000
70000
80000
0.00 0.05 0.10 0.15
Ap
pli
ed s
hea
r fo
rce,
V (
lbs)
Slip (in.)
S-5-S-1
S-5-S-2
S-5-S-3
S-5-R-1
S-5-R-2
S-5-R-3
Flange Cracking
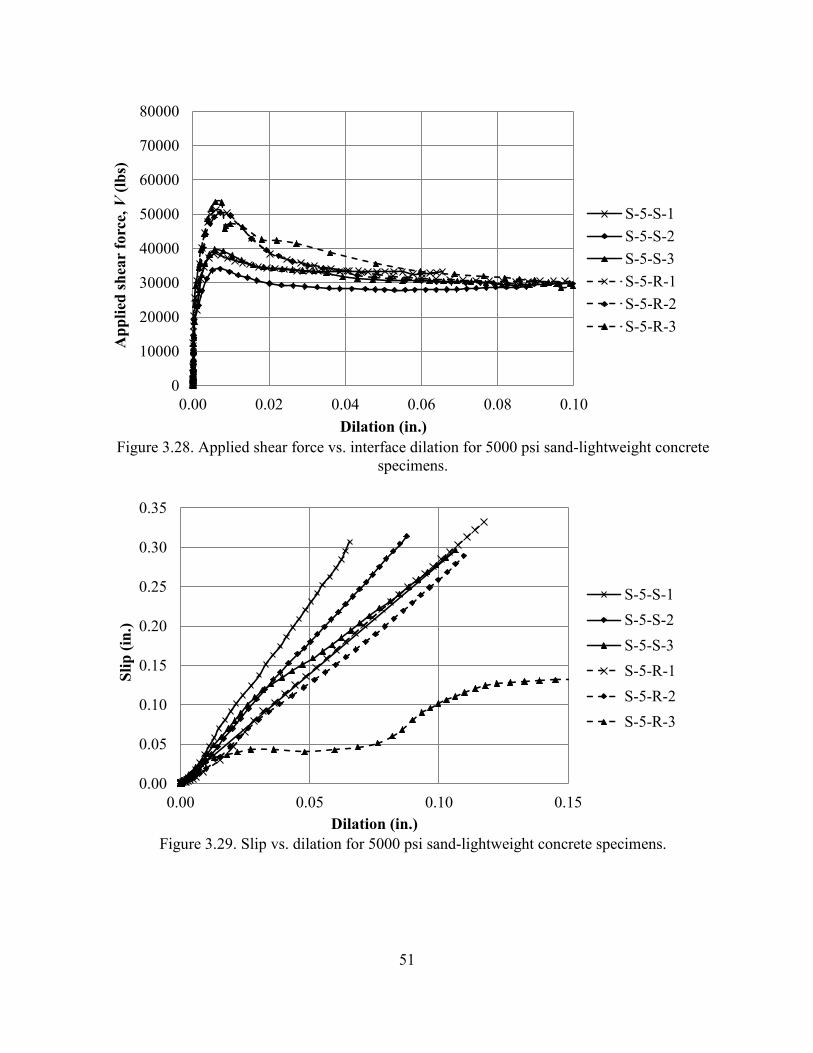
51
Figure 3.28. Applied shear force vs. interface dilation for 5000 psi sand-lightweight concrete
specimens.
Figure 3.29. Slip vs. dilation for 5000 psi sand-lightweight concrete specimens.
0
10000
20000
30000
40000
50000
60000
70000
80000
0.00 0.02 0.04 0.06 0.08 0.10
Ap
pli
ed s
hea
r fo
rce,
V (
lbs)
Dilation (in.)
S-5-S-1
S-5-S-2
S-5-S-3
S-5-R-1
S-5-R-2
S-5-R-3
0.00
0.05
0.10
0.15
0.20
0.25
0.30
0.35
0.00 0.05 0.10 0.15
Sli
p (
in.)
Dilation (in.)
S-5-S-1
S-5-S-2
S-5-S-3
S-5-R-1
S-5-R-2
S-5-R-3
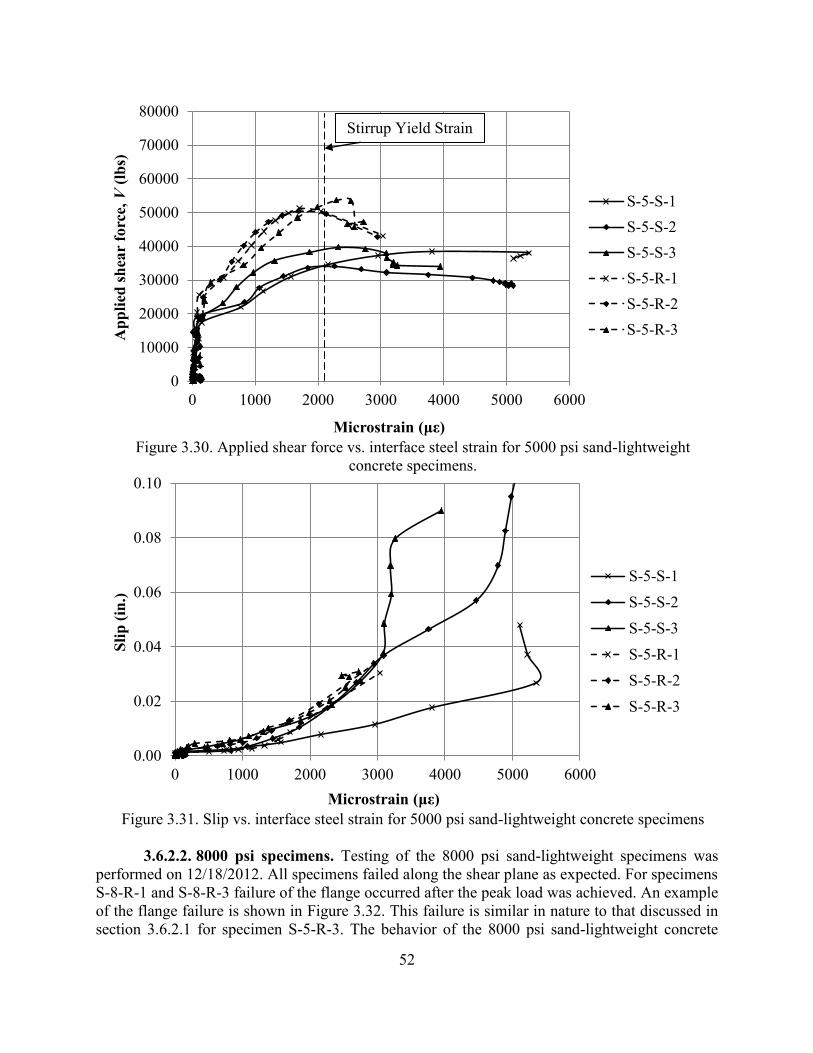
52
Figure 3.30. Applied shear force vs. interface steel strain for 5000 psi sand-lightweight
concrete specimens.
Figure 3.31. Slip vs. interface steel strain for 5000 psi sand-lightweight concrete specimens
3.6.2.2. 8000 psi specimens. Testing of the 8000 psi sand-lightweight specimens was
performed on 12/18/2012. All specimens failed along the shear plane as expected. For specimens
S-8-R-1 and S-8-R-3 failure of the flange occurred after the peak load was achieved. An example
of the flange failure is shown in Figure 3.32. This failure is similar in nature to that discussed in
section 3.6.2.1 for specimen S-5-R-3. The behavior of the 8000 psi sand-lightweight concrete
0
10000
20000
30000
40000
50000
60000
70000
80000
0 1000 2000 3000 4000 5000 6000
Ap
pli
ed s
hea
r fo
rce,
V (
lbs)
Microstrain (με)
S-5-S-1
S-5-S-2
S-5-S-3
S-5-R-1
S-5-R-2
S-5-R-3
0.00
0.02
0.04
0.06
0.08
0.10
0 1000 2000 3000 4000 5000 6000
Sli
p (
in.)
Microstrain (με)
S-5-S-1
S-5-S-2
S-5-S-3
S-5-R-1
S-5-R-2
S-5-R-3
Stirrup Yield Strain
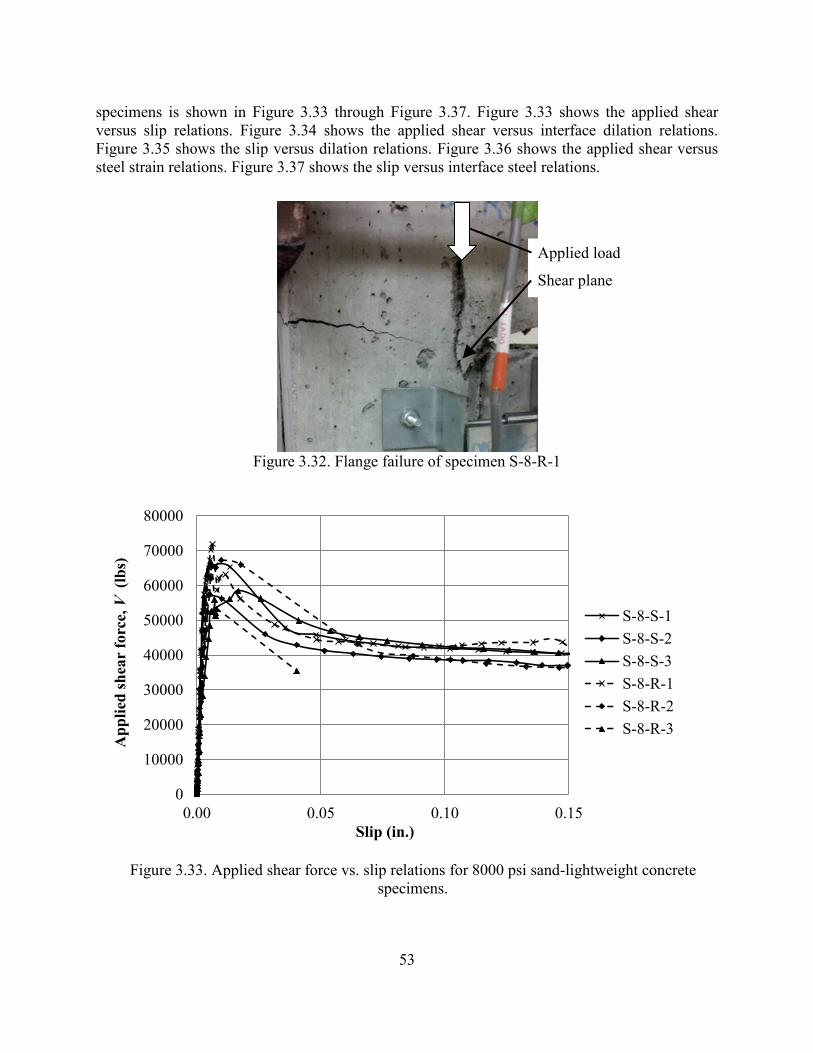
53
specimens is shown in Figure 3.33 through Figure 3.37. Figure 3.33 shows the applied shear
versus slip relations. Figure 3.34 shows the applied shear versus interface dilation relations.
Figure 3.35 shows the slip versus dilation relations. Figure 3.36 shows the applied shear versus
steel strain relations. Figure 3.37 shows the slip versus interface steel relations.
Figure 3.32. Flange failure of specimen S-8-R-1
Figure 3.33. Applied shear force vs. slip relations for 8000 psi sand-lightweight concrete
specimens.
0
10000
20000
30000
40000
50000
60000
70000
80000
0.00 0.05 0.10 0.15
Ap
pli
ed s
hea
r fo
rce,
V
(lb
s)
Slip (in.)
S-8-S-1
S-8-S-2
S-8-S-3
S-8-R-1
S-8-R-2
S-8-R-3
Applied load
Shear plane
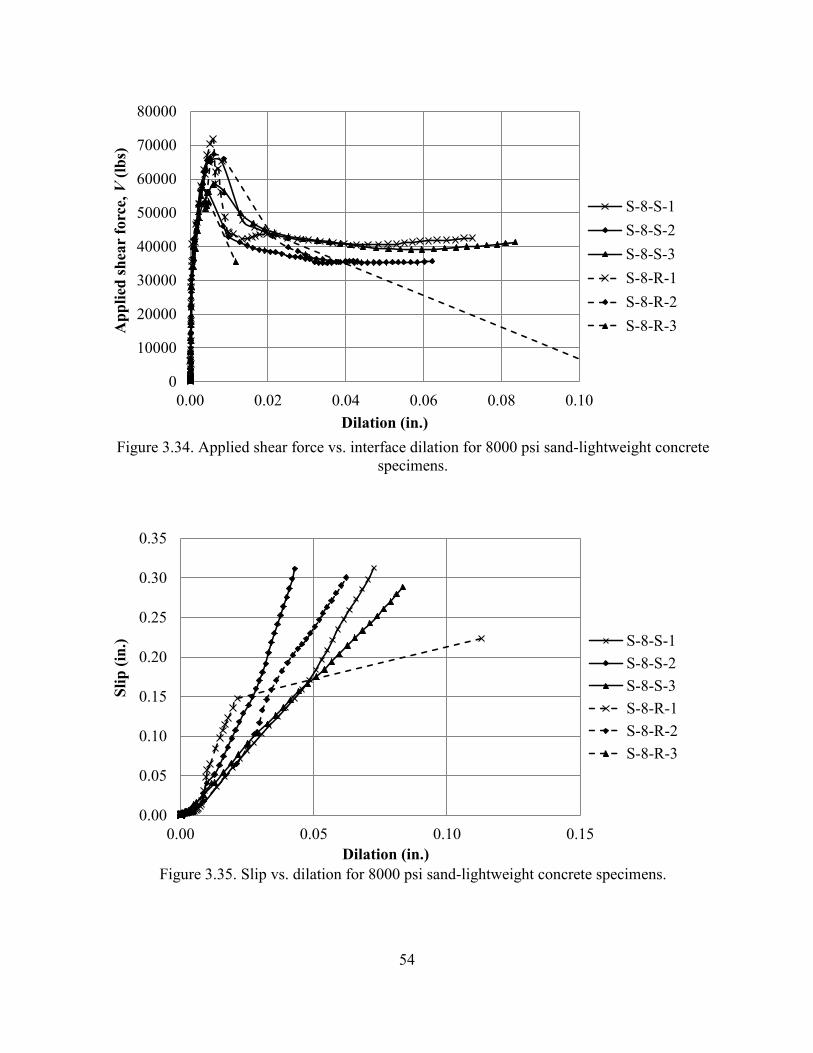
54
Figure 3.34. Applied shear force vs. interface dilation for 8000 psi sand-lightweight concrete
specimens.
Figure 3.35. Slip vs. dilation for 8000 psi sand-lightweight concrete specimens.
0
10000
20000
30000
40000
50000
60000
70000
80000
0.00 0.02 0.04 0.06 0.08 0.10
Ap
pli
ed s
hea
r fo
rce,
V (
lbs)
Dilation (in.)
S-8-S-1
S-8-S-2
S-8-S-3
S-8-R-1
S-8-R-2
S-8-R-3
0.00
0.05
0.10
0.15
0.20
0.25
0.30
0.35
0.00 0.05 0.10 0.15
Sli
p (
in.)
Dilation (in.)
S-8-S-1
S-8-S-2
S-8-S-3
S-8-R-1
S-8-R-2
S-8-R-3
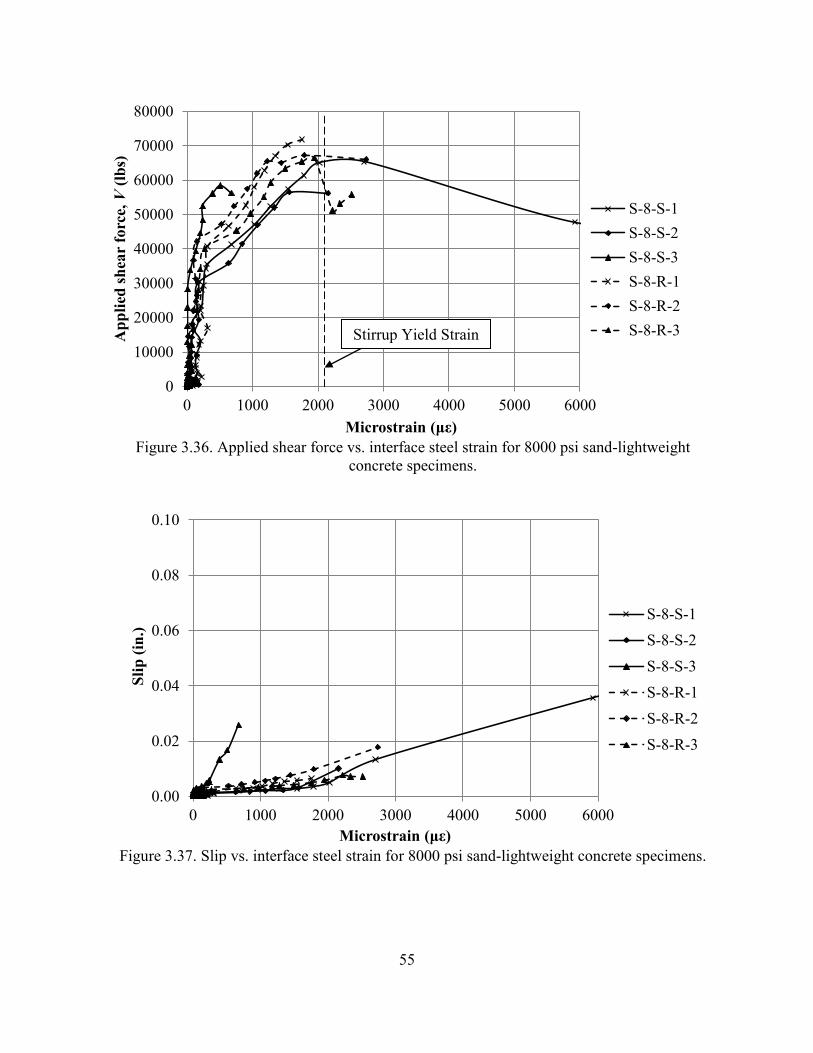
55
Figure 3.36. Applied shear force vs. interface steel strain for 8000 psi sand-lightweight
concrete specimens.
Figure 3.37. Slip vs. interface steel strain for 8000 psi sand-lightweight concrete specimens.
0
10000
20000
30000
40000
50000
60000
70000
80000
0 1000 2000 3000 4000 5000 6000
Ap
pli
ed s
hea
r fo
rce,
V (
lbs)
Microstrain (με)
S-8-S-1
S-8-S-2
S-8-S-3
S-8-R-1
S-8-R-2
S-8-R-3
0.00
0.02
0.04
0.06
0.08
0.10
0 1000 2000 3000 4000 5000 6000
Sli
p (
in.)
Microstrain (με)
S-8-S-1
S-8-S-2
S-8-S-3
S-8-R-1
S-8-R-2
S-8-R-3
Stirrup Yield Strain
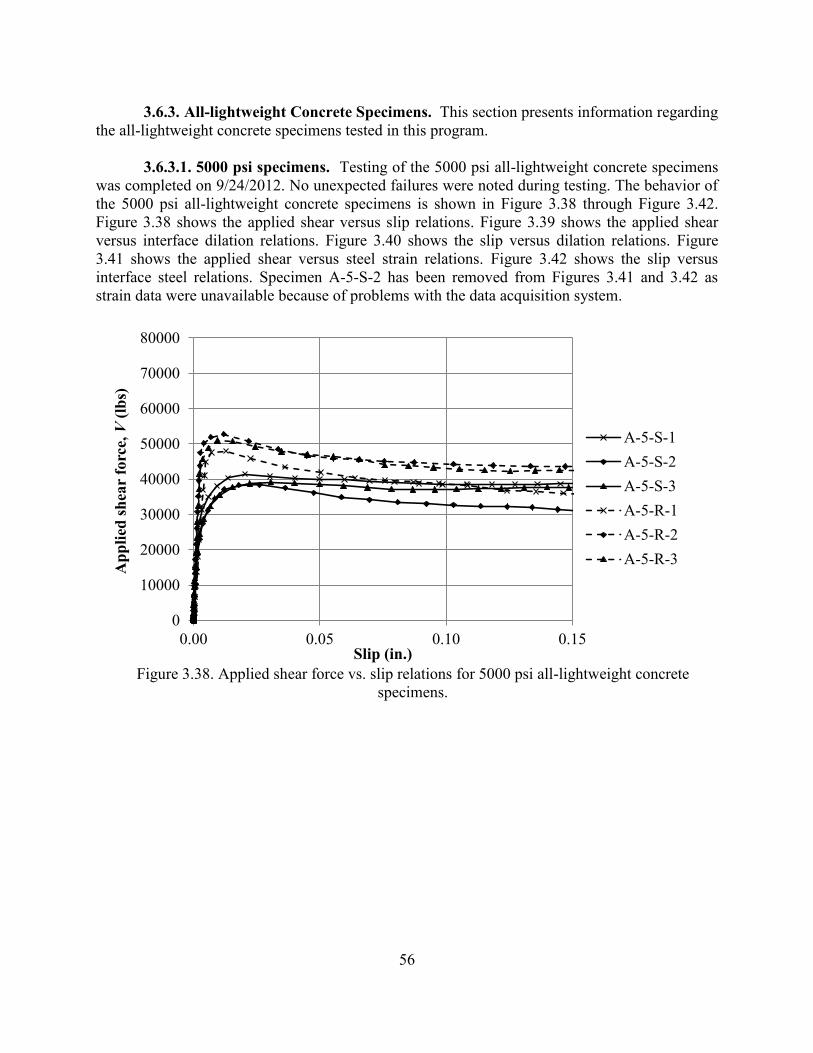
56
3.6.3. All-lightweight Concrete Specimens. This section presents information regarding
the all-lightweight concrete specimens tested in this program.
3.6.3.1. 5000 psi specimens. Testing of the 5000 psi all-lightweight concrete specimens
was completed on 9/24/2012. No unexpected failures were noted during testing. The behavior of
the 5000 psi all-lightweight concrete specimens is shown in Figure 3.38 through Figure 3.42.
Figure 3.38 shows the applied shear versus slip relations. Figure 3.39 shows the applied shear
versus interface dilation relations. Figure 3.40 shows the slip versus dilation relations. Figure
3.41 shows the applied shear versus steel strain relations. Figure 3.42 shows the slip versus
interface steel relations. Specimen A-5-S-2 has been removed from Figures 3.41 and 3.42 as
strain data were unavailable because of problems with the data acquisition system.
Figure 3.38. Applied shear force vs. slip relations for 5000 psi all-lightweight concrete
specimens.
0
10000
20000
30000
40000
50000
60000
70000
80000
0.00 0.05 0.10 0.15
Ap
pli
ed s
hea
r fo
rce,
V (
lbs)
Slip (in.)
A-5-S-1
A-5-S-2
A-5-S-3
A-5-R-1
A-5-R-2
A-5-R-3
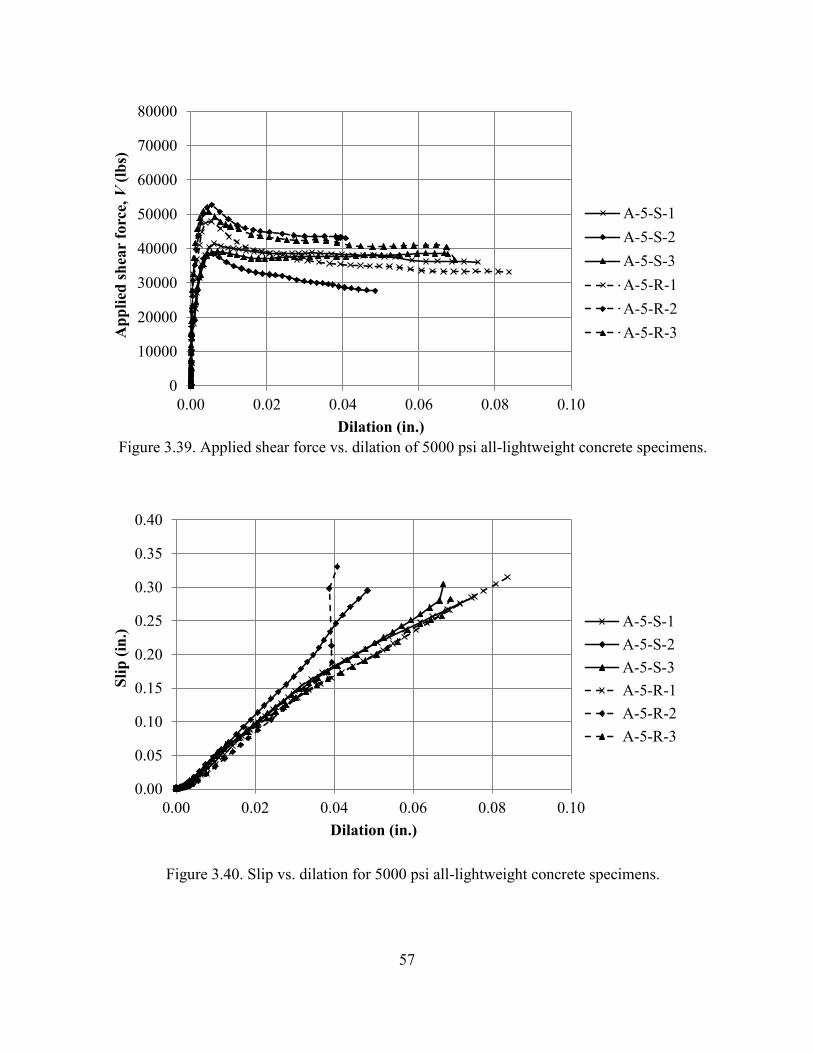
57
Figure 3.39. Applied shear force vs. dilation of 5000 psi all-lightweight concrete specimens.
Figure 3.40. Slip vs. dilation for 5000 psi all-lightweight concrete specimens.
0
10000
20000
30000
40000
50000
60000
70000
80000
0.00 0.02 0.04 0.06 0.08 0.10
Ap
pli
ed s
hea
r fo
rce,
V (
lbs)
Dilation (in.)
A-5-S-1
A-5-S-2
A-5-S-3
A-5-R-1
A-5-R-2
A-5-R-3
0.00
0.05
0.10
0.15
0.20
0.25
0.30
0.35
0.40
0.00 0.02 0.04 0.06 0.08 0.10
Sli
p (
in.)
Dilation (in.)
A-5-S-1
A-5-S-2
A-5-S-3
A-5-R-1
A-5-R-2
A-5-R-3
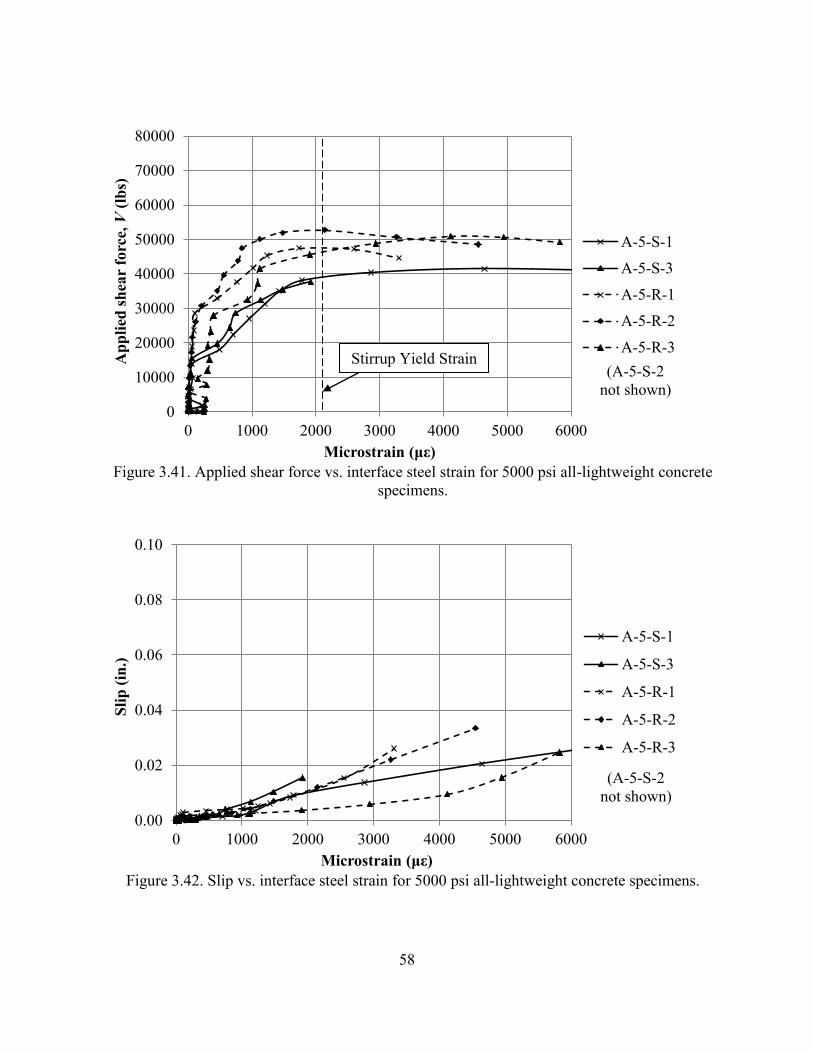
58
Figure 3.41. Applied shear force vs. interface steel strain for 5000 psi all-lightweight concrete
specimens.
Figure 3.42. Slip vs. interface steel strain for 5000 psi all-lightweight concrete specimens.
0
10000
20000
30000
40000
50000
60000
70000
80000
0 1000 2000 3000 4000 5000 6000
Ap
pli
ed s
hea
r fo
rce,
V (
lbs)
Microstrain (με)
A-5-S-1
A-5-S-3
A-5-R-1
A-5-R-2
A-5-R-3
(A-5-S-2
not shown)
0.00
0.02
0.04
0.06
0.08
0.10
0 1000 2000 3000 4000 5000 6000
Sli
p (
in.)
Microstrain (με)
A-5-S-1
A-5-S-3
A-5-R-1
A-5-R-2
A-5-R-3
(A-5-S-2
not shown)
Stirrup Yield Strain
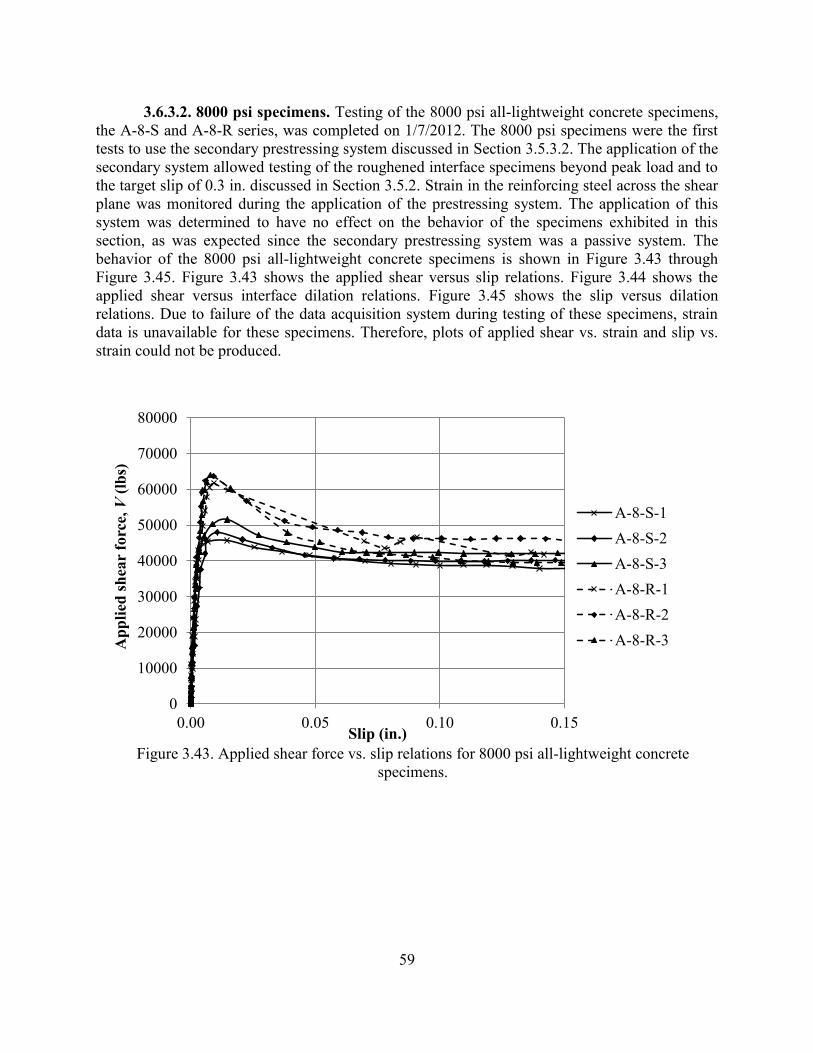
59
3.6.3.2. 8000 psi specimens. Testing of the 8000 psi all-lightweight concrete specimens,
the A-8-S and A-8-R series, was completed on 1/7/2012. The 8000 psi specimens were the first
tests to use the secondary prestressing system discussed in Section 3.5.3.2. The application of the
secondary system allowed testing of the roughened interface specimens beyond peak load and to
the target slip of 0.3 in. discussed in Section 3.5.2. Strain in the reinforcing steel across the shear
plane was monitored during the application of the prestressing system. The application of this
system was determined to have no effect on the behavior of the specimens exhibited in this
section, as was expected since the secondary prestressing system was a passive system. The
behavior of the 8000 psi all-lightweight concrete specimens is shown in Figure 3.43 through
Figure 3.45. Figure 3.43 shows the applied shear versus slip relations. Figure 3.44 shows the
applied shear versus interface dilation relations. Figure 3.45 shows the slip versus dilation
relations. Due to failure of the data acquisition system during testing of these specimens, strain
data is unavailable for these specimens. Therefore, plots of applied shear vs. strain and slip vs.
strain could not be produced.
Figure 3.43. Applied shear force vs. slip relations for 8000 psi all-lightweight concrete
specimens.
0
10000
20000
30000
40000
50000
60000
70000
80000
0.00 0.05 0.10 0.15
Ap
pli
ed s
hea
r fo
rce,
V (
lbs)
Slip (in.)
A-8-S-1
A-8-S-2
A-8-S-3
A-8-R-1
A-8-R-2
A-8-R-3
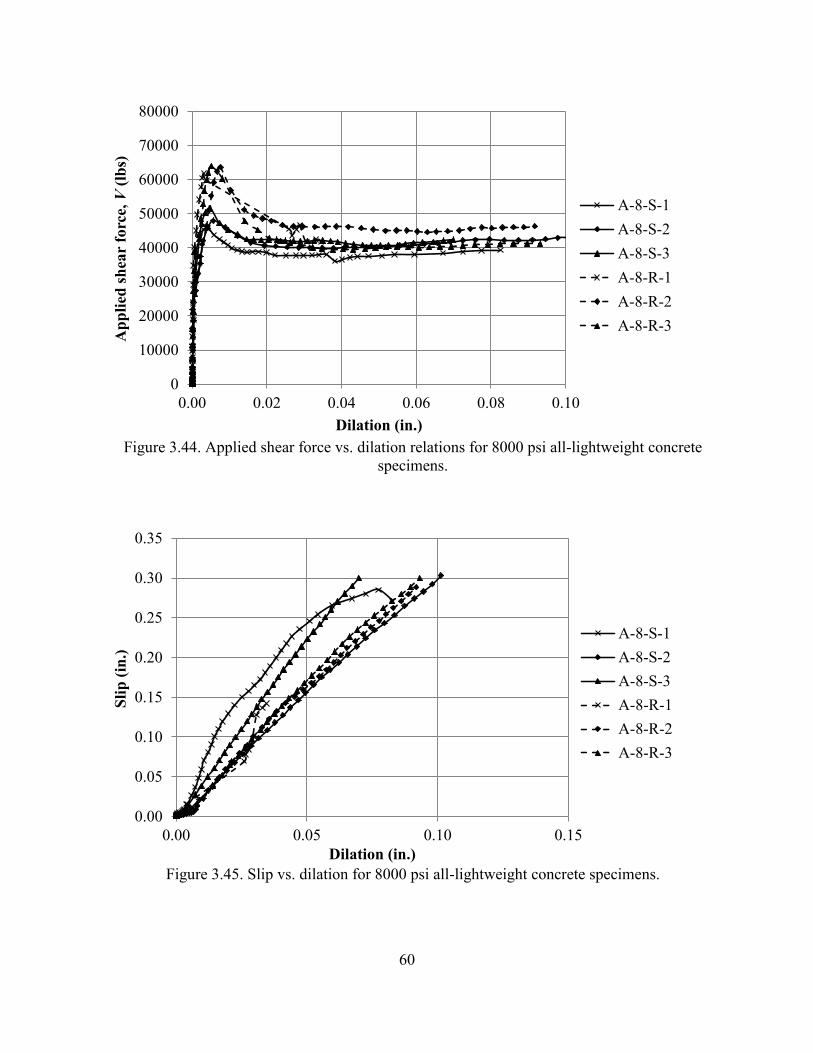
60
Figure 3.44. Applied shear force vs. dilation relations for 8000 psi all-lightweight concrete
specimens.
Figure 3.45. Slip vs. dilation for 8000 psi all-lightweight concrete specimens.
0
10000
20000
30000
40000
50000
60000
70000
80000
0.00 0.02 0.04 0.06 0.08 0.10
Ap
pli
ed s
hea
r fo
rce,
V (
lbs)
Dilation (in.)
A-8-S-1
A-8-S-2
A-8-S-3
A-8-R-1
A-8-R-2
A-8-R-3
0.00
0.05
0.10
0.15
0.20
0.25
0.30
0.35
0.00 0.05 0.10 0.15
Sli
p (
in.)
Dilation (in.)
A-8-S-1
A-8-S-2
A-8-S-3
A-8-R-1
A-8-R-2
A-8-R-3
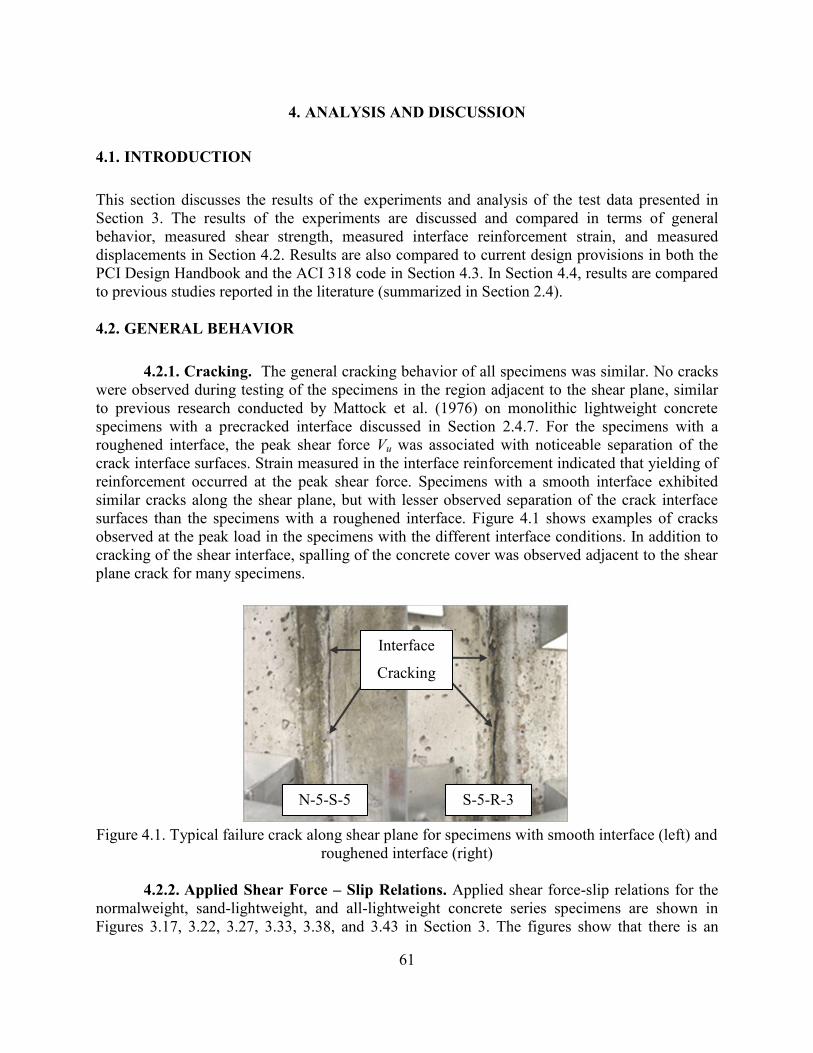
61
4. ANALYSIS AND DISCUSSION
4.1. INTRODUCTION
This section discusses the results of the experiments and analysis of the test data presented in
Section 3. The results of the experiments are discussed and compared in terms of general
behavior, measured shear strength, measured interface reinforcement strain, and measured
displacements in Section 4.2. Results are also compared to current design provisions in both the
PCI Design Handbook and the ACI 318 code in Section 4.3. In Section 4.4, results are compared
to previous studies reported in the literature (summarized in Section 2.4).
4.2. GENERAL BEHAVIOR
4.2.1. Cracking. The general cracking behavior of all specimens was similar. No cracks
were observed during testing of the specimens in the region adjacent to the shear plane, similar
to previous research conducted by Mattock et al. (1976) on monolithic lightweight concrete
specimens with a precracked interface discussed in Section 2.4.7. For the specimens with a
roughened interface, the peak shear force Vu was associated with noticeable separation of the
crack interface surfaces. Strain measured in the interface reinforcement indicated that yielding of
reinforcement occurred at the peak shear force. Specimens with a smooth interface exhibited
similar cracks along the shear plane, but with lesser observed separation of the crack interface
surfaces than the specimens with a roughened interface. Figure 4.1 shows examples of cracks
observed at the peak load in the specimens with the different interface conditions. In addition to
cracking of the shear interface, spalling of the concrete cover was observed adjacent to the shear
plane crack for many specimens.
Figure 4.1. Typical failure crack along shear plane for specimens with smooth interface (left) and
roughened interface (right)
4.2.2. Applied Shear Force – Slip Relations. Applied shear force-slip relations for the
normalweight, sand-lightweight, and all-lightweight concrete series specimens are shown in
Figures 3.17, 3.22, 3.27, 3.33, 3.38, and 3.43 in Section 3. The figures show that there is an
N-5-S-5 S-5-R-3
Interface
Cracking
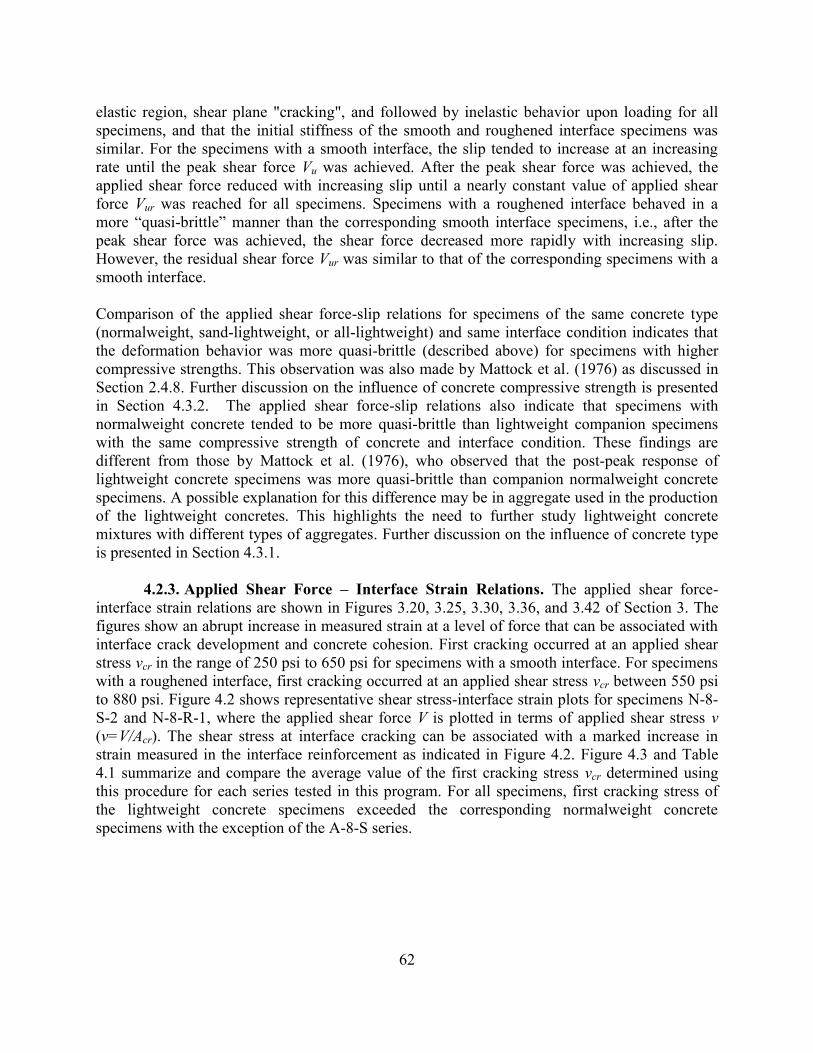
62
elastic region, shear plane "cracking", and followed by inelastic behavior upon loading for all
specimens, and that the initial stiffness of the smooth and roughened interface specimens was
similar. For the specimens with a smooth interface, the slip tended to increase at an increasing
rate until the peak shear force Vu was achieved. After the peak shear force was achieved, the
applied shear force reduced with increasing slip until a nearly constant value of applied shear
force Vur was reached for all specimens. Specimens with a roughened interface behaved in a
more “quasi-brittle” manner than the corresponding smooth interface specimens, i.e., after the
peak shear force was achieved, the shear force decreased more rapidly with increasing slip.
However, the residual shear force Vur was similar to that of the corresponding specimens with a
smooth interface.
Comparison of the applied shear force-slip relations for specimens of the same concrete type
(normalweight, sand-lightweight, or all-lightweight) and same interface condition indicates that
the deformation behavior was more quasi-brittle (described above) for specimens with higher
compressive strengths. This observation was also made by Mattock et al. (1976) as discussed in
Section 2.4.8. Further discussion on the influence of concrete compressive strength is presented
in Section 4.3.2. The applied shear force-slip relations also indicate that specimens with
normalweight concrete tended to be more quasi-brittle than lightweight companion specimens
with the same compressive strength of concrete and interface condition. These findings are
different from those by Mattock et al. (1976), who observed that the post-peak response of
lightweight concrete specimens was more quasi-brittle than companion normalweight concrete
specimens. A possible explanation for this difference may be in aggregate used in the production
of the lightweight concretes. This highlights the need to further study lightweight concrete
mixtures with different types of aggregates. Further discussion on the influence of concrete type
is presented in Section 4.3.1.
4.2.3. Applied Shear Force – Interface Strain Relations. The applied shear force-
interface strain relations are shown in Figures 3.20, 3.25, 3.30, 3.36, and 3.42 of Section 3. The
figures show an abrupt increase in measured strain at a level of force that can be associated with
interface crack development and concrete cohesion. First cracking occurred at an applied shear
stress vcr in the range of 250 psi to 650 psi for specimens with a smooth interface. For specimens
with a roughened interface, first cracking occurred at an applied shear stress vcr between 550 psi
to 880 psi. Figure 4.2 shows representative shear stress-interface strain plots for specimens N-8-
S-2 and N-8-R-1, where the applied shear force V is plotted in terms of applied shear stress v
(v=V/Acr). The shear stress at interface cracking can be associated with a marked increase in
strain measured in the interface reinforcement as indicated in Figure 4.2. Figure 4.3 and Table
4.1 summarize and compare the average value of the first cracking stress vcr determined using
this procedure for each series tested in this program. For all specimens, first cracking stress of
the lightweight concrete specimens exceeded the corresponding normalweight concrete
specimens with the exception of the A-8-S series.
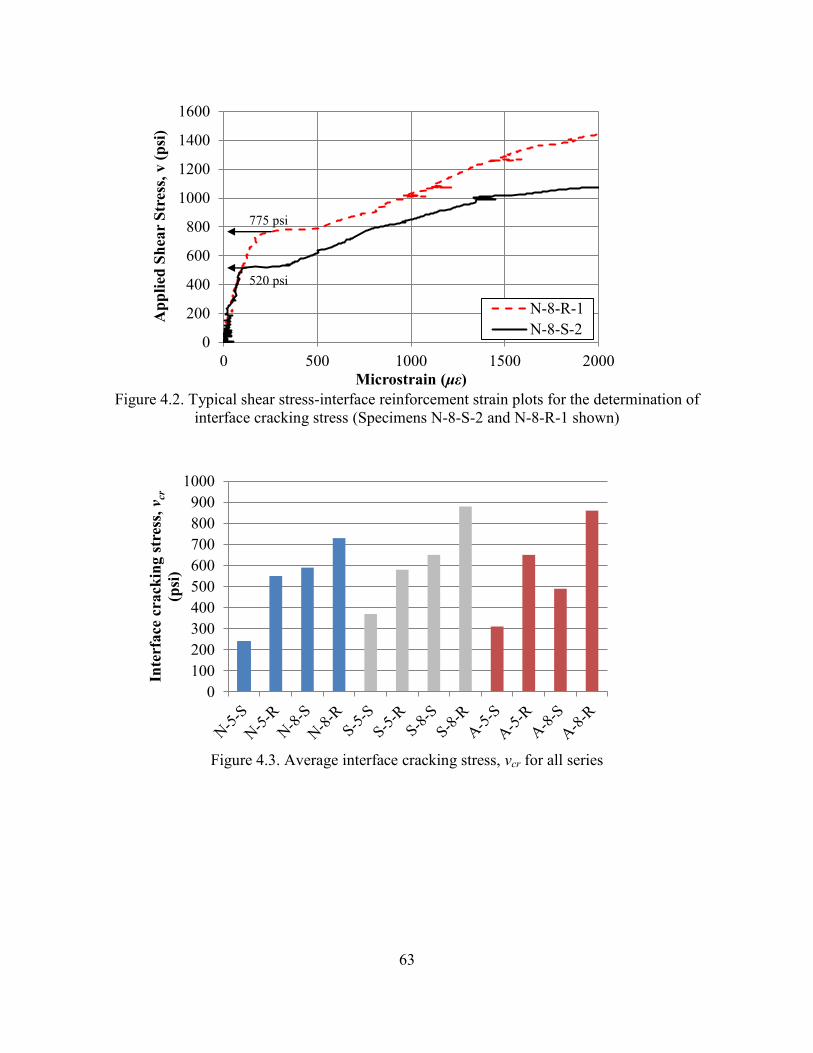
63
Figure 4.2. Typical shear stress-interface reinforcement strain plots for the determination of
interface cracking stress (Specimens N-8-S-2 and N-8-R-1 shown)
Figure 4.3. Average interface cracking stress, vcr for all series
0
200
400
600
800
1000
1200
1400
1600
0 500 1000 1500 2000
Ap
pli
ed S
hea
r S
tres
s, v
(p
si)
Microstrain (με)
N-8-R-1
N-8-S-2
0
100
200
300
400
500
600
700
800
900
1000
Inte
rface
cra
ckin
g s
tres
s, v
cr
(psi
)
775 psi
520 psi
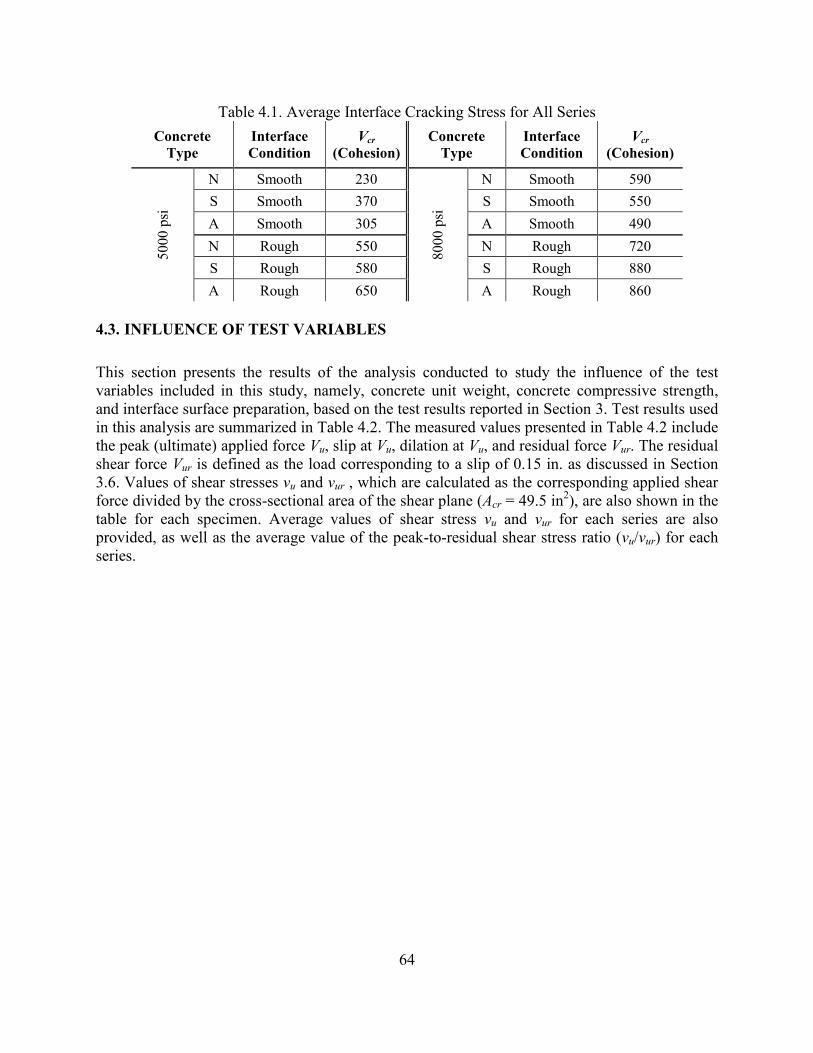
64
Table 4.1. Average Interface Cracking Stress for All Series
Concrete
Type
Interface
Condition
Vcr
(Cohesion)
Concrete
Type
Interface
Condition
Vcr
(Cohesion) 5
00
0 p
si
N Smooth 230
80
00
psi
N Smooth 590
S Smooth 370 S Smooth 550
A Smooth 305 A Smooth 490
N Rough 550 N Rough 720
S Rough 580 S Rough 880
A Rough 650 A Rough 860
4.3. INFLUENCE OF TEST VARIABLES
This section presents the results of the analysis conducted to study the influence of the test
variables included in this study, namely, concrete unit weight, concrete compressive strength,
and interface surface preparation, based on the test results reported in Section 3. Test results used
in this analysis are summarized in Table 4.2. The measured values presented in Table 4.2 include
the peak (ultimate) applied force Vu, slip at Vu, dilation at Vu, and residual force Vur. The residual
shear force Vur is defined as the load corresponding to a slip of 0.15 in. as discussed in Section
3.6. Values of shear stresses vu and vur , which are calculated as the corresponding applied shear
force divided by the cross-sectional area of the shear plane (Acr = 49.5 in2), are also shown in the
table for each specimen. Average values of shear stress vu and vur for each series are also
provided, as well as the average value of the peak-to-residual shear stress ratio (vu/vur) for each
series.
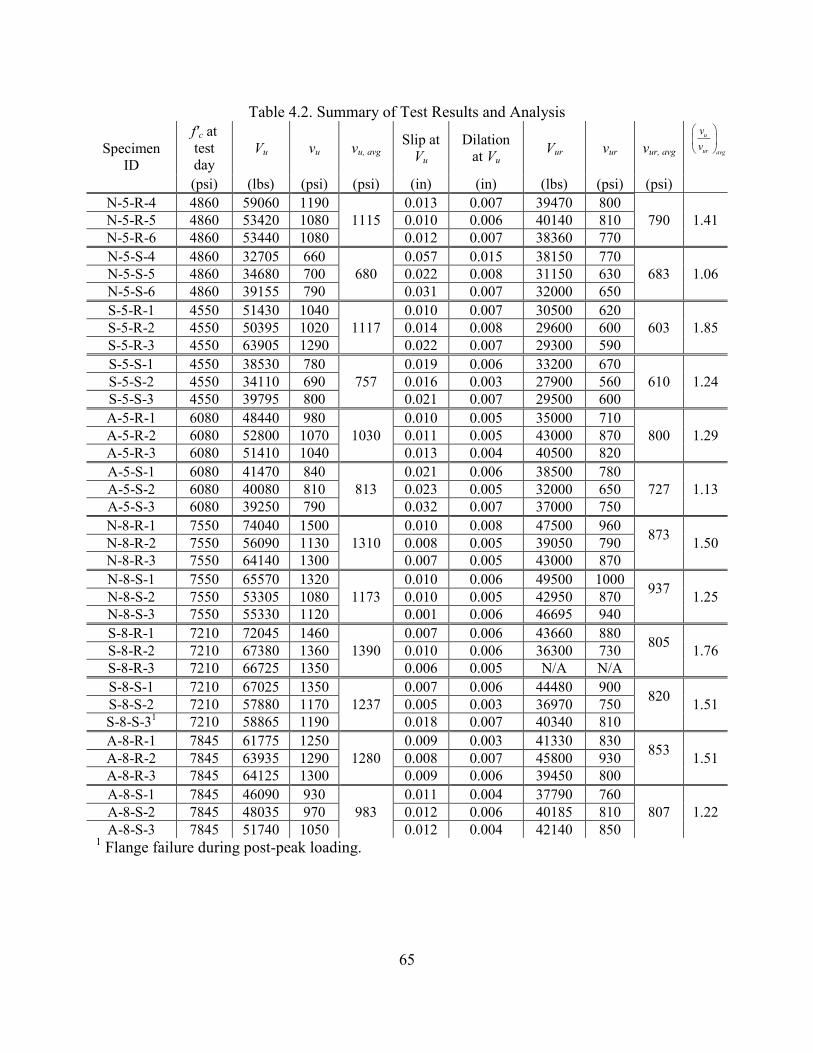
65
Table 4.2. Summary of Test Results and Analysis
Specimen
ID
f'c at
test
day
Vu vu
vu, avg Slip at
Vu
Dilation
at Vu Vur
vur
vur, avg
u
ur avg
v
v
(psi) (lbs) (psi) (psi) (in) (in) (lbs) (psi) (psi)
N-5-R-4 4860 59060 1190
1115
0.013 0.007 39470 800
790 1.41 N-5-R-5 4860 53420 1080 0.010 0.006 40140 810
N-5-R-6 4860 53440 1080 0.012 0.007 38360 770
N-5-S-4 4860 32705 660
680
0.057 0.015 38150 770
683 1.06 N-5-S-5 4860 34680 700 0.022 0.008 31150 630
N-5-S-6 4860 39155 790 0.031 0.007 32000 650
S-5-R-1 4550 51430 1040
1117
0.010 0.007 30500 620
603 1.85 S-5-R-2 4550 50395 1020 0.014 0.008 29600 600
S-5-R-3 4550 63905 1290 0.022 0.007 29300 590
S-5-S-1 4550 38530 780
757
0.019 0.006 33200 670
610 1.24 S-5-S-2 4550 34110 690 0.016 0.003 27900 560
S-5-S-3 4550 39795 800 0.021 0.007 29500 600
A-5-R-1 6080 48440 980
1030
0.010 0.005 35000 710
800 1.29 A-5-R-2 6080 52800 1070 0.011 0.005 43000 870
A-5-R-3 6080 51410 1040 0.013 0.004 40500 820
A-5-S-1 6080 41470 840
813
0.021 0.006 38500 780
727 1.13 A-5-S-2 6080 40080 810 0.023 0.005 32000 650
A-5-S-3 6080 39250 790 0.032 0.007 37000 750
N-8-R-1 7550 74040 1500
1310
0.010 0.008 47500 960 873
1.50 N-8-R-2 7550 56090 1130 0.008 0.005 39050 790
N-8-R-3 7550 64140 1300 0.007 0.005 43000 870
N-8-S-1 7550 65570 1320
1173
0.010 0.006 49500 1000 937
1.25 N-8-S-2 7550 53305 1080 0.010 0.005 42950 870
N-8-S-3 7550 55330 1120 0.001 0.006 46695 940
S-8-R-1 7210 72045 1460
1390
0.007 0.006 43660 880 805
1.76 S-8-R-2 7210 67380 1360 0.010 0.006 36300 730
S-8-R-3 7210 66725 1350 0.006 0.005 N/A N/A
S-8-S-1 7210 67025 1350
1237
0.007 0.006 44480 900 820
1.51 S-8-S-2 7210 57880 1170 0.005 0.003 36970 750
S-8-S-31
7210 58865 1190 0.018 0.007 40340 810
A-8-R-1 7845 61775 1250
1280
0.009 0.003 41330 830 853
1.51 A-8-R-2 7845 63935 1290 0.008 0.007 45800 930
A-8-R-3 7845 64125 1300 0.009 0.006 39450 800
A-8-S-1 7845 46090 930
983
0.011 0.004 37790 760
807 1.22 A-8-S-2 7845 48035 970 0.012 0.006 40185 810
A-8-S-3 7845 51740 1050 0.012 0.004 42140 850 1 Flange failure during post-peak loading.
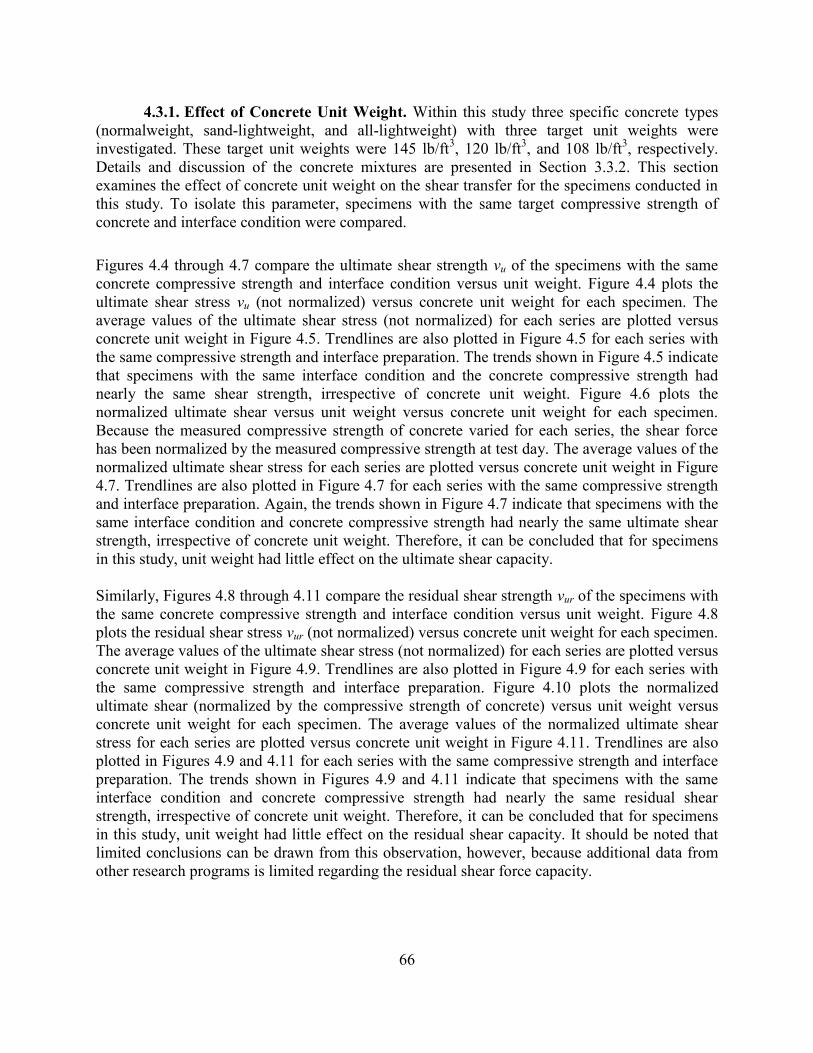
66
4.3.1. Effect of Concrete Unit Weight. Within this study three specific concrete types
(normalweight, sand-lightweight, and all-lightweight) with three target unit weights were
investigated. These target unit weights were 145 lb/ft3, 120 lb/ft
3, and 108 lb/ft
3, respectively.
Details and discussion of the concrete mixtures are presented in Section 3.3.2. This section
examines the effect of concrete unit weight on the shear transfer for the specimens conducted in
this study. To isolate this parameter, specimens with the same target compressive strength of
concrete and interface condition were compared.
Figures 4.4 through 4.7 compare the ultimate shear strength vu of the specimens with the same
concrete compressive strength and interface condition versus unit weight. Figure 4.4 plots the
ultimate shear stress vu (not normalized) versus concrete unit weight for each specimen. The
average values of the ultimate shear stress (not normalized) for each series are plotted versus
concrete unit weight in Figure 4.5. Trendlines are also plotted in Figure 4.5 for each series with
the same compressive strength and interface preparation. The trends shown in Figure 4.5 indicate
that specimens with the same interface condition and the concrete compressive strength had
nearly the same shear strength, irrespective of concrete unit weight. Figure 4.6 plots the
normalized ultimate shear versus unit weight versus concrete unit weight for each specimen.
Because the measured compressive strength of concrete varied for each series, the shear force
has been normalized by the measured compressive strength at test day. The average values of the
normalized ultimate shear stress for each series are plotted versus concrete unit weight in Figure
4.7. Trendlines are also plotted in Figure 4.7 for each series with the same compressive strength
and interface preparation. Again, the trends shown in Figure 4.7 indicate that specimens with the
same interface condition and concrete compressive strength had nearly the same ultimate shear
strength, irrespective of concrete unit weight. Therefore, it can be concluded that for specimens
in this study, unit weight had little effect on the ultimate shear capacity.
Similarly, Figures 4.8 through 4.11 compare the residual shear strength vur of the specimens with
the same concrete compressive strength and interface condition versus unit weight. Figure 4.8
plots the residual shear stress vur (not normalized) versus concrete unit weight for each specimen.
The average values of the ultimate shear stress (not normalized) for each series are plotted versus
concrete unit weight in Figure 4.9. Trendlines are also plotted in Figure 4.9 for each series with
the same compressive strength and interface preparation. Figure 4.10 plots the normalized
ultimate shear (normalized by the compressive strength of concrete) versus unit weight versus
concrete unit weight for each specimen. The average values of the normalized ultimate shear
stress for each series are plotted versus concrete unit weight in Figure 4.11. Trendlines are also
plotted in Figures 4.9 and 4.11 for each series with the same compressive strength and interface
preparation. The trends shown in Figures 4.9 and 4.11 indicate that specimens with the same
interface condition and concrete compressive strength had nearly the same residual shear
strength, irrespective of concrete unit weight. Therefore, it can be concluded that for specimens
in this study, unit weight had little effect on the residual shear capacity. It should be noted that
limited conclusions can be drawn from this observation, however, because additional data from
other research programs is limited regarding the residual shear force capacity.
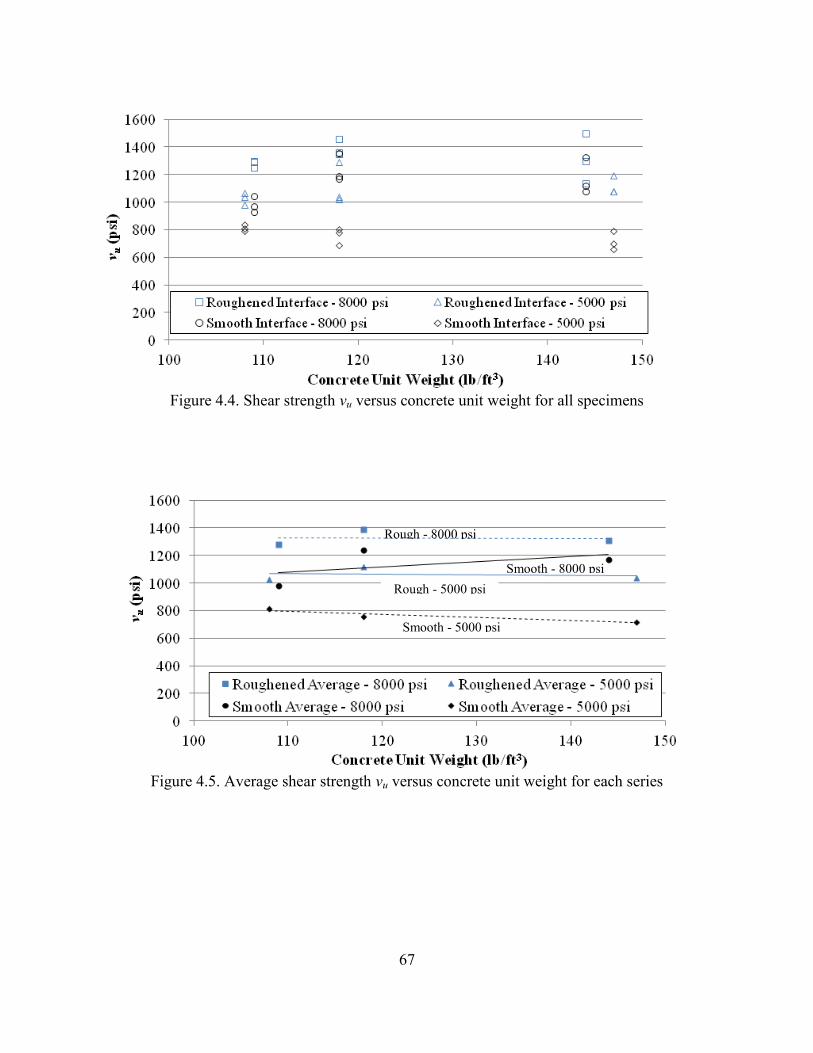
67
Figure 4.4. Shear strength vu versus concrete unit weight for all specimens
Figure 4.5. Average shear strength vu versus concrete unit weight for each series
Rough - 8000 psi
Smooth - 5000 psi
Smooth - 8000 psi
Rough - 5000 psi
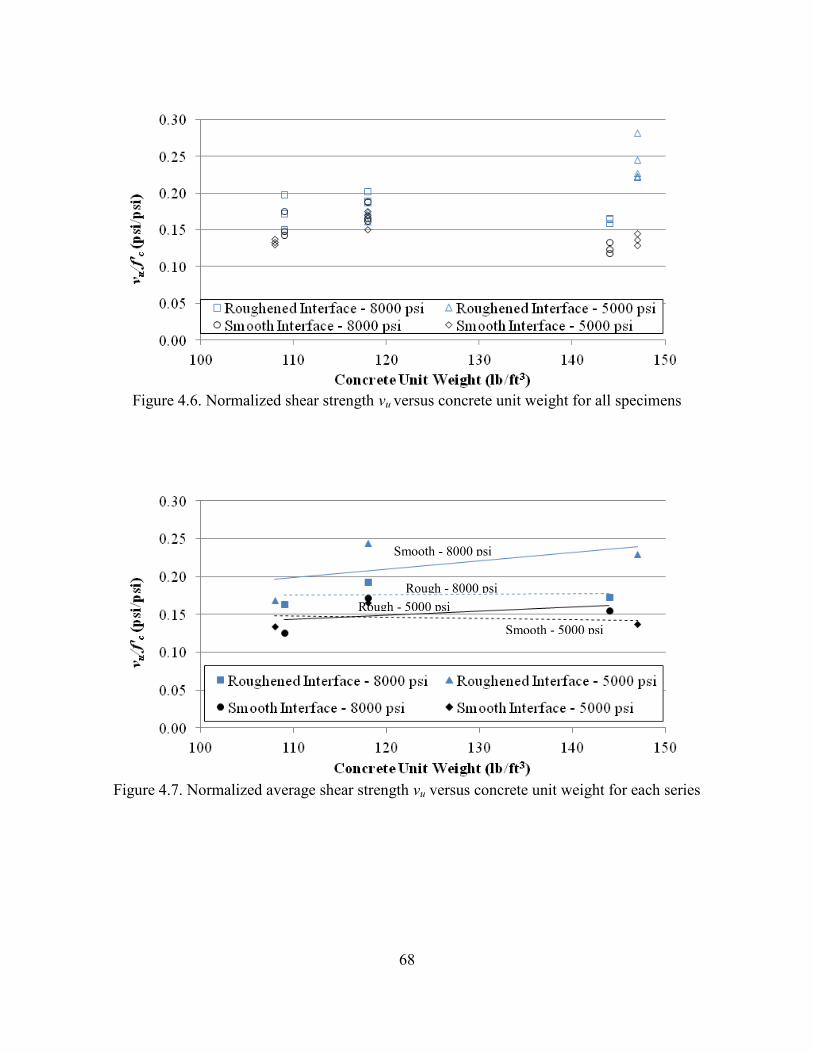
68
Figure 4.6. Normalized shear strength vu versus concrete unit weight for all specimens
Figure 4.7. Normalized average shear strength vu versus concrete unit weight for each series
Rough - 8000 psi
Smooth - 8000 psi
Smooth - 5000 psi
Rough - 5000 psi
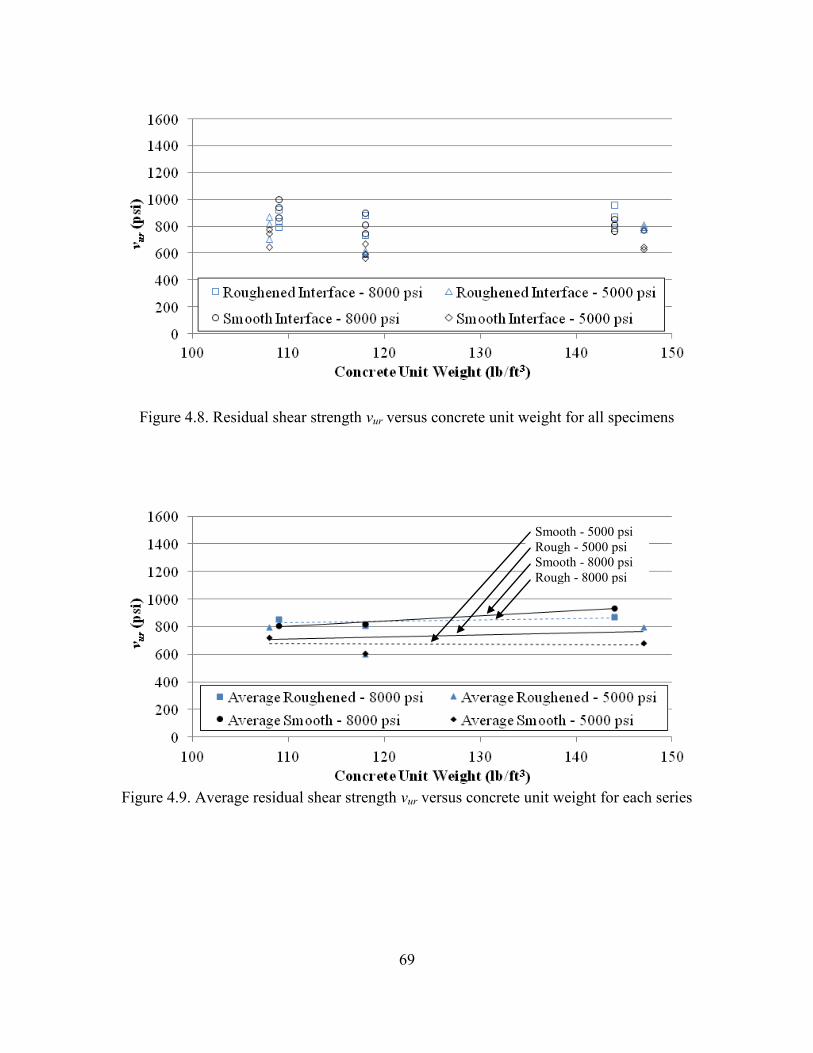
69
Figure 4.8. Residual shear strength vur versus concrete unit weight for all specimens
Figure 4.9. Average residual shear strength vur versus concrete unit weight for each series
Smooth - 5000 psi
Rough - 5000 psi
Smooth - 8000 psi
Rough - 8000 psi
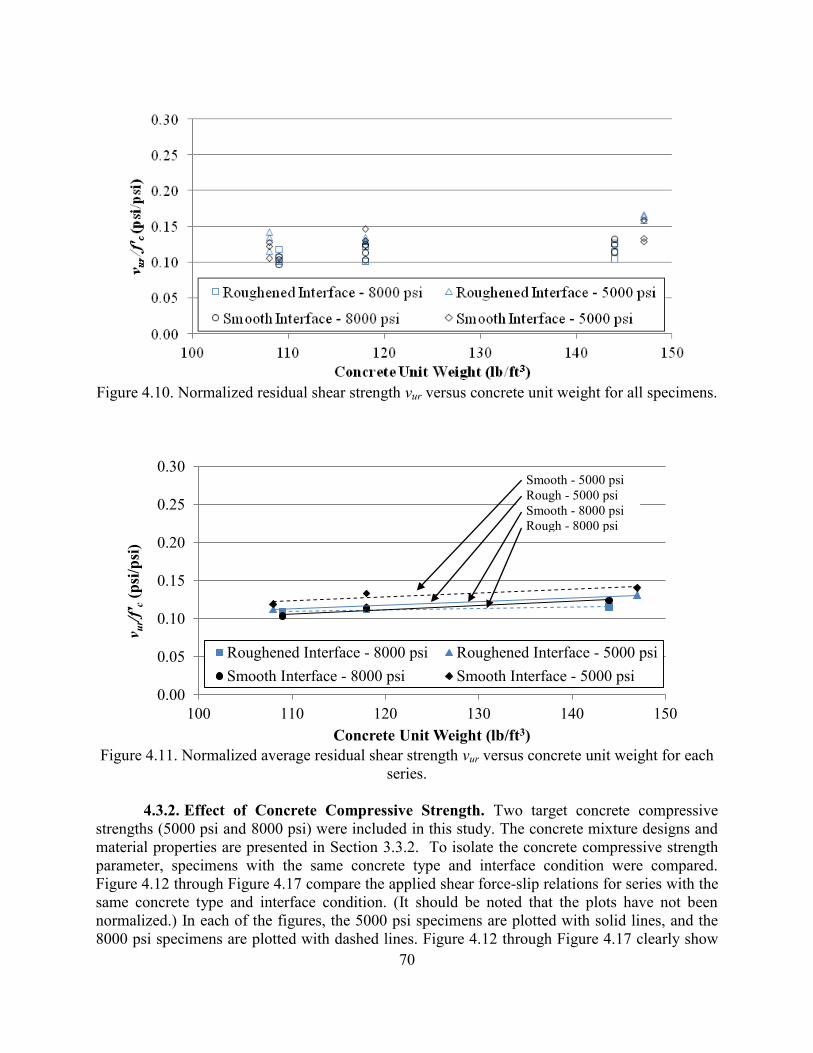
70
Figure 4.10. Normalized residual shear strength vur versus concrete unit weight for all specimens.
Figure 4.11. Normalized average residual shear strength vur versus concrete unit weight for each
series.
4.3.2. Effect of Concrete Compressive Strength. Two target concrete compressive
strengths (5000 psi and 8000 psi) were included in this study. The concrete mixture designs and
material properties are presented in Section 3.3.2. To isolate the concrete compressive strength
parameter, specimens with the same concrete type and interface condition were compared.
Figure 4.12 through Figure 4.17 compare the applied shear force-slip relations for series with the
same concrete type and interface condition. (It should be noted that the plots have not been
normalized.) In each of the figures, the 5000 psi specimens are plotted with solid lines, and the
8000 psi specimens are plotted with dashed lines. Figure 4.12 through Figure 4.17 clearly show
0.00
0.05
0.10
0.15
0.20
0.25
0.30
100 110 120 130 140 150
v ur/
f'c (
psi
/psi
)
Concrete Unit Weight (lb/ft3)
Roughened Interface - 8000 psi Roughened Interface - 5000 psi
Smooth Interface - 8000 psi Smooth Interface - 5000 psi
Smooth - 5000 psi
Rough - 5000 psi
Smooth - 8000 psi
Rough - 8000 psi
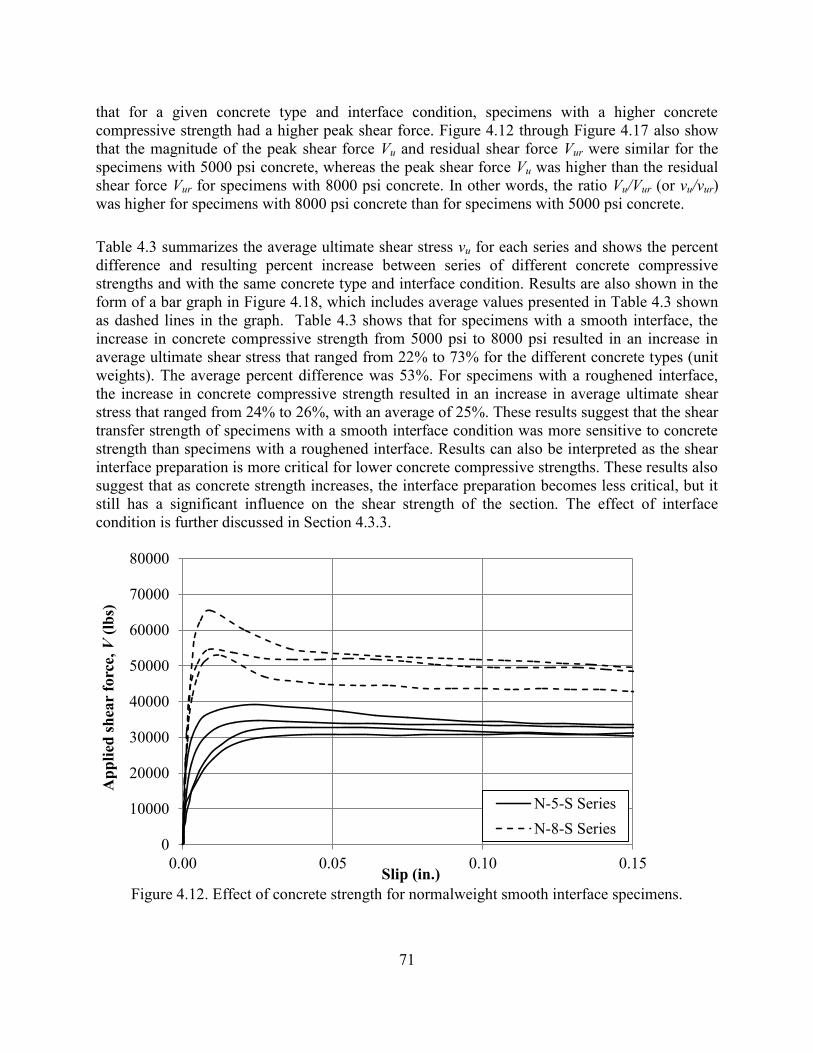
71
that for a given concrete type and interface condition, specimens with a higher concrete
compressive strength had a higher peak shear force. Figure 4.12 through Figure 4.17 also show
that the magnitude of the peak shear force Vu and residual shear force Vur were similar for the
specimens with 5000 psi concrete, whereas the peak shear force Vu was higher than the residual
shear force Vur for specimens with 8000 psi concrete. In other words, the ratio Vu/Vur (or vu/vur)
was higher for specimens with 8000 psi concrete than for specimens with 5000 psi concrete.
Table 4.3 summarizes the average ultimate shear stress vu for each series and shows the percent
difference and resulting percent increase between series of different concrete compressive
strengths and with the same concrete type and interface condition. Results are also shown in the
form of a bar graph in Figure 4.18, which includes average values presented in Table 4.3 shown
as dashed lines in the graph. Table 4.3 shows that for specimens with a smooth interface, the
increase in concrete compressive strength from 5000 psi to 8000 psi resulted in an increase in
average ultimate shear stress that ranged from 22% to 73% for the different concrete types (unit
weights). The average percent difference was 53%. For specimens with a roughened interface,
the increase in concrete compressive strength resulted in an increase in average ultimate shear
stress that ranged from 24% to 26%, with an average of 25%. These results suggest that the shear
transfer strength of specimens with a smooth interface condition was more sensitive to concrete
strength than specimens with a roughened interface. Results can also be interpreted as the shear
interface preparation is more critical for lower concrete compressive strengths. These results also
suggest that as concrete strength increases, the interface preparation becomes less critical, but it
still has a significant influence on the shear strength of the section. The effect of interface
condition is further discussed in Section 4.3.3.
Figure 4.12. Effect of concrete strength for normalweight smooth interface specimens.
0
10000
20000
30000
40000
50000
60000
70000
80000
0.00 0.05 0.10 0.15
Ap
pli
ed s
hea
r fo
rce,
V (
lbs)
Slip (in.)
N-5-S Series
N-8-S Series
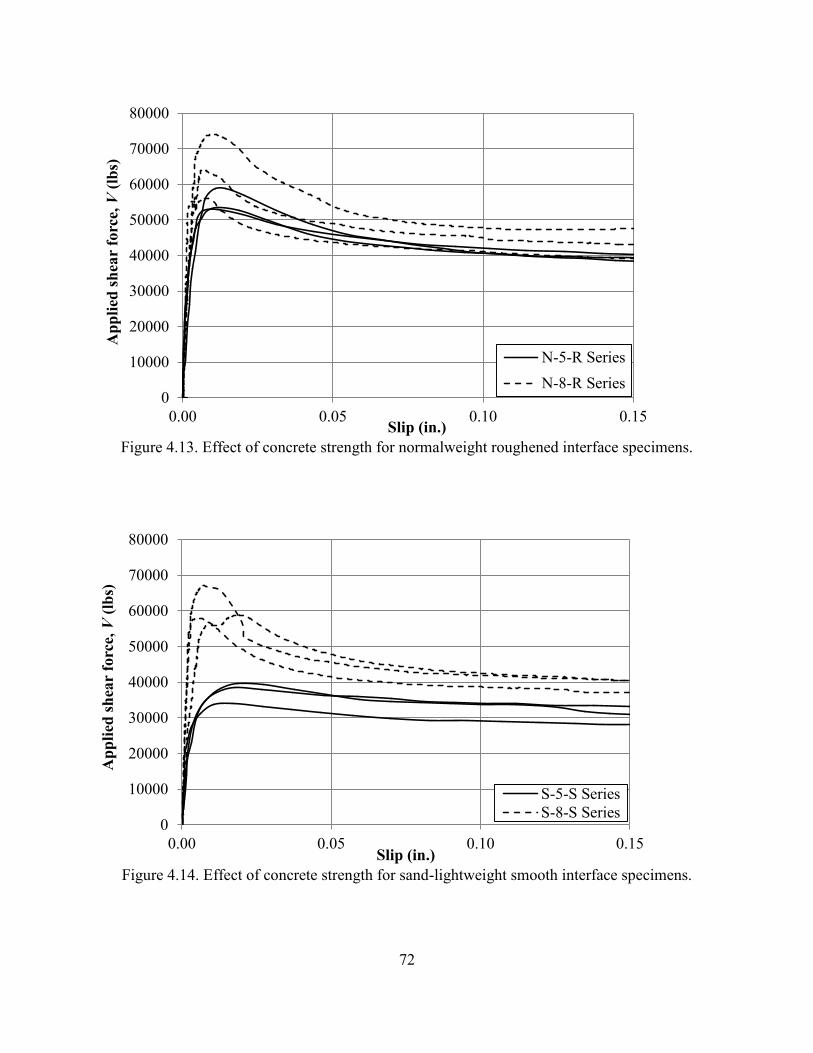
72
Figure 4.13. Effect of concrete strength for normalweight roughened interface specimens.
Figure 4.14. Effect of concrete strength for sand-lightweight smooth interface specimens.
0
10000
20000
30000
40000
50000
60000
70000
80000
0.00 0.05 0.10 0.15
Ap
pli
ed s
hea
r fo
rce,
V (
lbs)
Slip (in.)
N-5-R Series
N-8-R Series
0
10000
20000
30000
40000
50000
60000
70000
80000
0.00 0.05 0.10 0.15
Ap
pli
ed s
hea
r fo
rce,
V (
lbs)
Slip (in.)
S-5-S Series
S-8-S Series
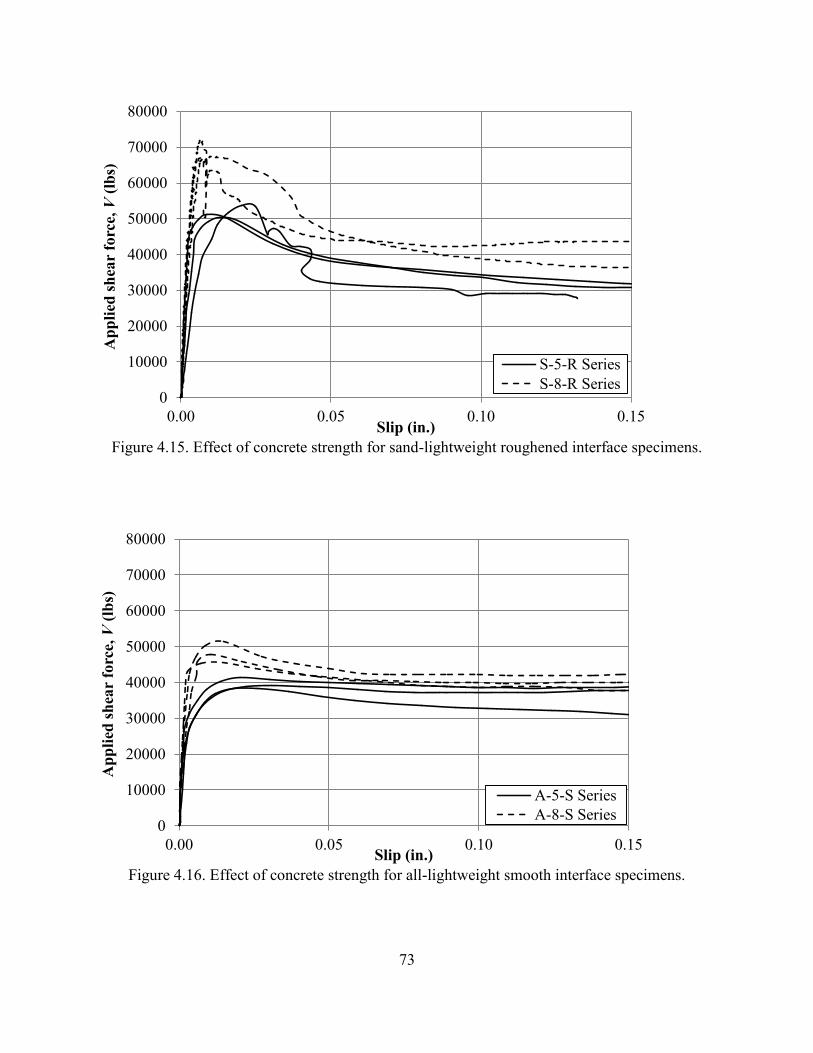
73
Figure 4.15. Effect of concrete strength for sand-lightweight roughened interface specimens.
Figure 4.16. Effect of concrete strength for all-lightweight smooth interface specimens.
0
10000
20000
30000
40000
50000
60000
70000
80000
0.00 0.05 0.10 0.15
Ap
pli
ed s
hea
r fo
rce,
V (
lbs)
Slip (in.)
S-5-R Series
S-8-R Series
0
10000
20000
30000
40000
50000
60000
70000
80000
0.00 0.05 0.10 0.15
Ap
pli
ed s
hea
r fo
rce,
V (
lbs)
Slip (in.)
A-5-S Series
A-8-S Series
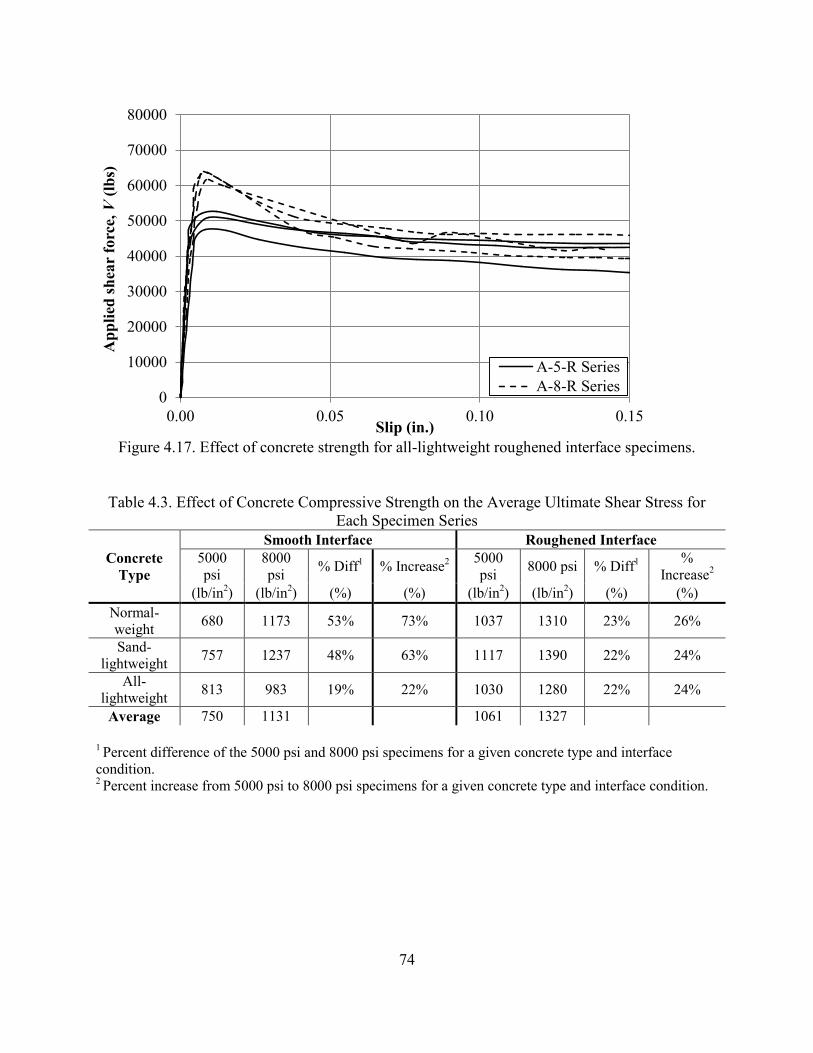
74
Figure 4.17. Effect of concrete strength for all-lightweight roughened interface specimens.
Table 4.3. Effect of Concrete Compressive Strength on the Average Ultimate Shear Stress for
Each Specimen Series
Concrete
Type
Smooth Interface Roughened Interface
5000
psi
8000
psi % Diff
1 % Increase
2
5000
psi 8000 psi
% Diff
1 %
Increase2
(lb/in2) (lb/in
2) (%) (%) (lb/in
2) (lb/in
2) (%) (%)
Normal-
weight 680 1173 53% 73% 1037 1310 23% 26%
Sand-
lightweight 757 1237 48% 63% 1117 1390 22% 24%
All-
lightweight 813 983 19% 22% 1030 1280 22% 24%
Average 750 1131
1061 1327
1 Percent difference of the 5000 psi and 8000 psi specimens for a given concrete type and interface
condition. 2 Percent increase from 5000 psi to 8000 psi specimens for a given concrete type and interface condition.
0
10000
20000
30000
40000
50000
60000
70000
80000
0.00 0.05 0.10 0.15
Ap
pli
ed s
hea
r fo
rce,
V (
lbs)
Slip (in.)
A-5-R Series
A-8-R Series
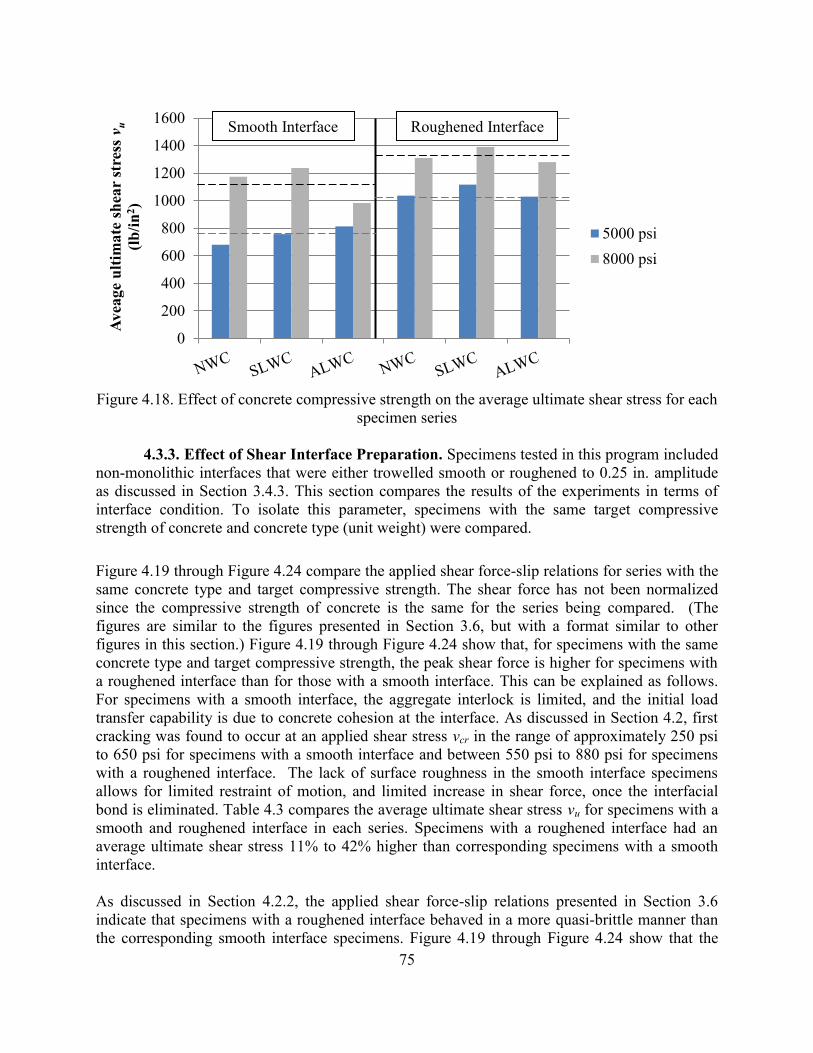
75
Figure 4.18. Effect of concrete compressive strength on the average ultimate shear stress for each
specimen series
4.3.3. Effect of Shear Interface Preparation. Specimens tested in this program included
non-monolithic interfaces that were either trowelled smooth or roughened to 0.25 in. amplitude
as discussed in Section 3.4.3. This section compares the results of the experiments in terms of
interface condition. To isolate this parameter, specimens with the same target compressive
strength of concrete and concrete type (unit weight) were compared.
Figure 4.19 through Figure 4.24 compare the applied shear force-slip relations for series with the
same concrete type and target compressive strength. The shear force has not been normalized
since the compressive strength of concrete is the same for the series being compared. (The
figures are similar to the figures presented in Section 3.6, but with a format similar to other
figures in this section.) Figure 4.19 through Figure 4.24 show that, for specimens with the same
concrete type and target compressive strength, the peak shear force is higher for specimens with
a roughened interface than for those with a smooth interface. This can be explained as follows.
For specimens with a smooth interface, the aggregate interlock is limited, and the initial load
transfer capability is due to concrete cohesion at the interface. As discussed in Section 4.2, first
cracking was found to occur at an applied shear stress vcr in the range of approximately 250 psi
to 650 psi for specimens with a smooth interface and between 550 psi to 880 psi for specimens
with a roughened interface. The lack of surface roughness in the smooth interface specimens
allows for limited restraint of motion, and limited increase in shear force, once the interfacial
bond is eliminated. Table 4.3 compares the average ultimate shear stress vu for specimens with a
smooth and roughened interface in each series. Specimens with a roughened interface had an
average ultimate shear stress 11% to 42% higher than corresponding specimens with a smooth
interface.
As discussed in Section 4.2.2, the applied shear force-slip relations presented in Section 3.6
indicate that specimens with a roughened interface behaved in a more quasi-brittle manner than
the corresponding smooth interface specimens. Figure 4.19 through Figure 4.24 show that the
0
200
400
600
800
1000
1200
1400
1600A
vea
ge
ult
imate
sh
ear
stre
ss v
u
(lb
/in
2)
5000 psi
8000 psi
Smooth Interface Roughened Interface
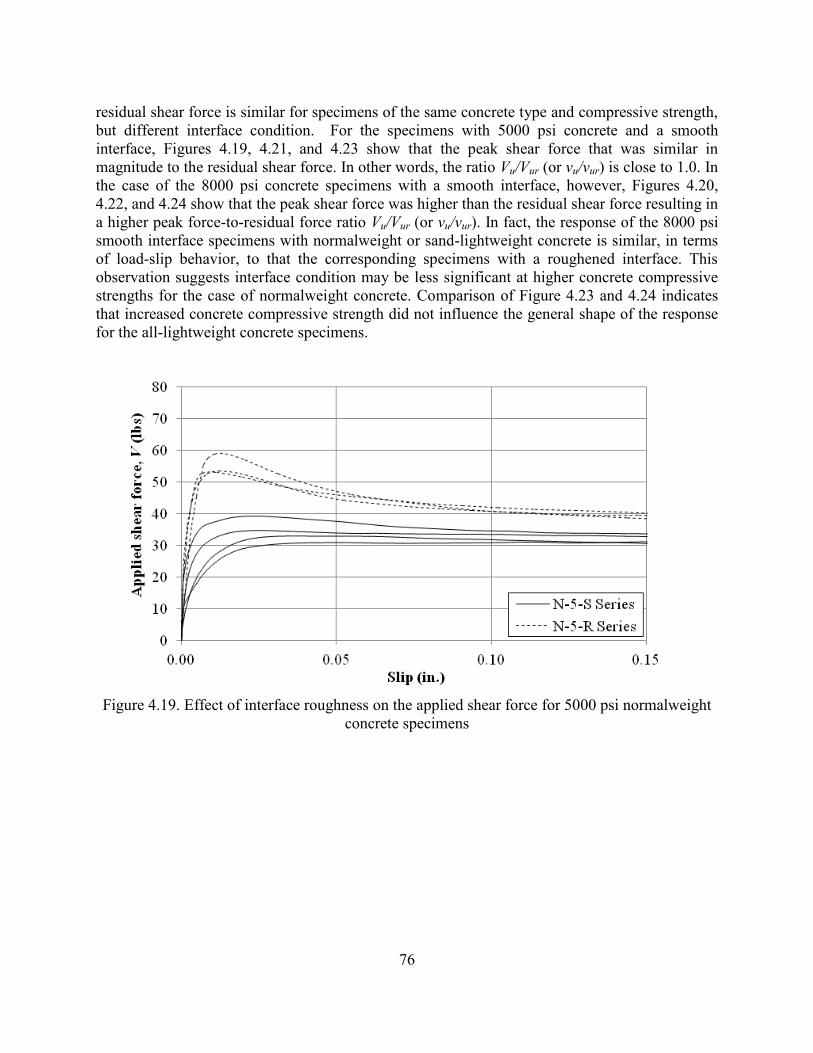
76
residual shear force is similar for specimens of the same concrete type and compressive strength,
but different interface condition. For the specimens with 5000 psi concrete and a smooth
interface, Figures 4.19, 4.21, and 4.23 show that the peak shear force that was similar in
magnitude to the residual shear force. In other words, the ratio Vu/Vur (or vu/vur) is close to 1.0. In
the case of the 8000 psi concrete specimens with a smooth interface, however, Figures 4.20,
4.22, and 4.24 show that the peak shear force was higher than the residual shear force resulting in
a higher peak force-to-residual force ratio Vu/Vur (or vu/vur). In fact, the response of the 8000 psi
smooth interface specimens with normalweight or sand-lightweight concrete is similar, in terms
of load-slip behavior, to that the corresponding specimens with a roughened interface. This
observation suggests interface condition may be less significant at higher concrete compressive
strengths for the case of normalweight concrete. Comparison of Figure 4.23 and 4.24 indicates
that increased concrete compressive strength did not influence the general shape of the response
for the all-lightweight concrete specimens.
Figure 4.19. Effect of interface roughness on the applied shear force for 5000 psi normalweight
concrete specimens
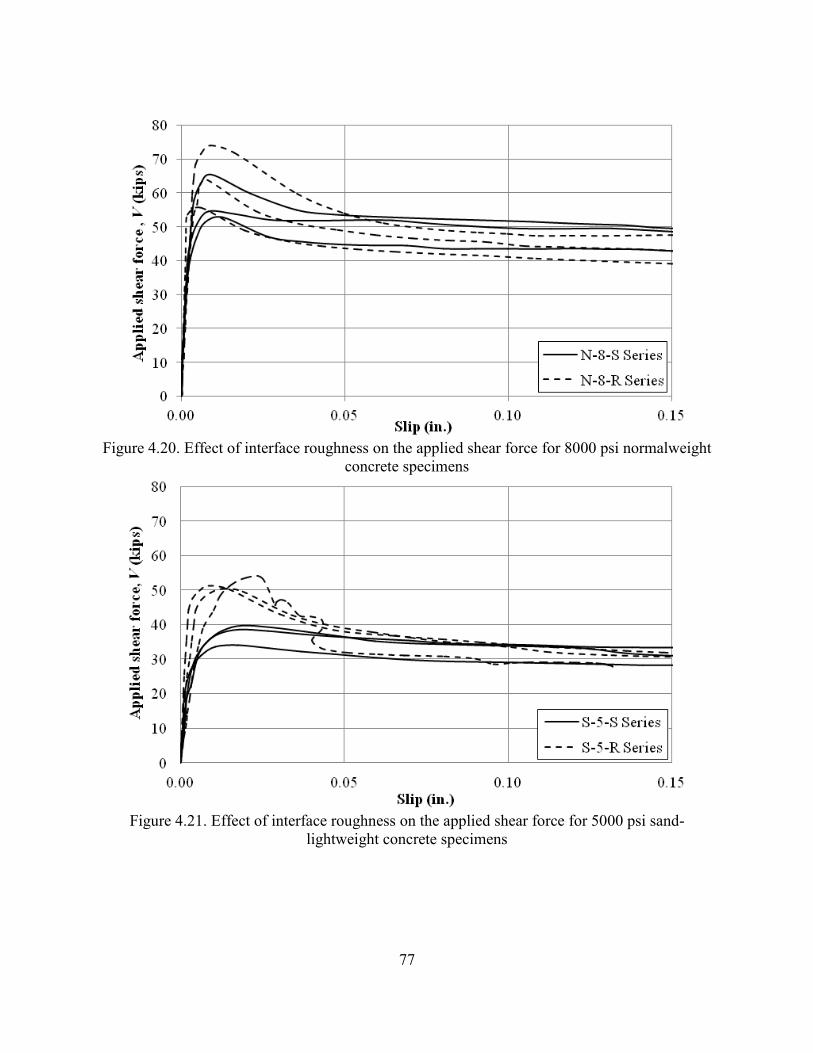
77
Figure 4.20. Effect of interface roughness on the applied shear force for 8000 psi normalweight
concrete specimens
Figure 4.21. Effect of interface roughness on the applied shear force for 5000 psi sand-
lightweight concrete specimens
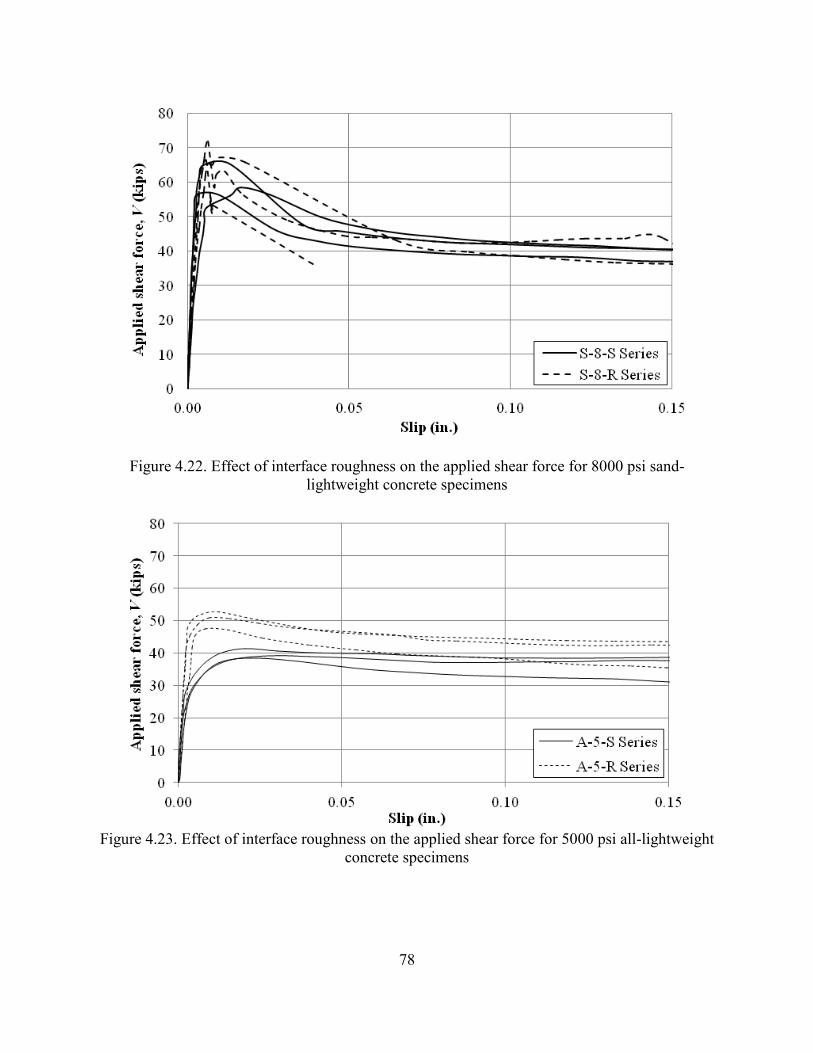
78
Figure 4.22. Effect of interface roughness on the applied shear force for 8000 psi sand-
lightweight concrete specimens
Figure 4.23. Effect of interface roughness on the applied shear force for 5000 psi all-lightweight
concrete specimens
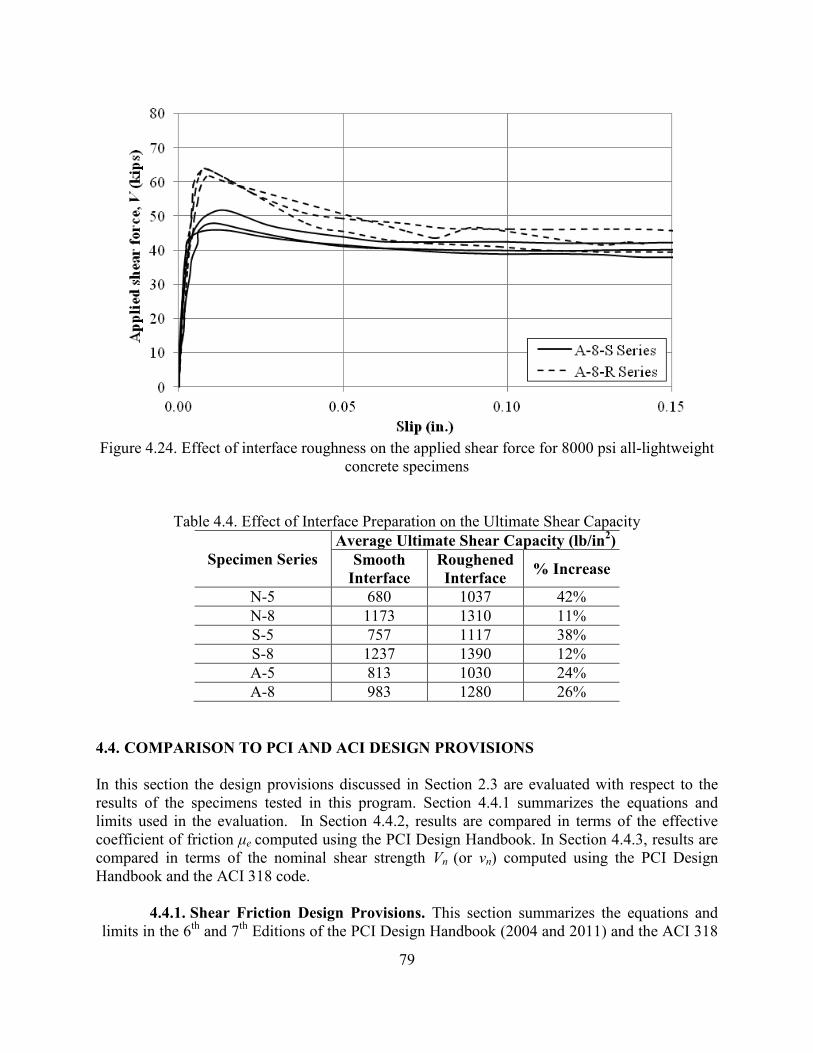
79
Figure 4.24. Effect of interface roughness on the applied shear force for 8000 psi all-lightweight
concrete specimens
Table 4.4. Effect of Interface Preparation on the Ultimate Shear Capacity
Specimen Series
Average Ultimate Shear Capacity (lb/in2)
Smooth
Interface
Roughened
Interface % Increase
N-5 680 1037 42%
N-8 1173 1310 11%
S-5 757 1117 38%
S-8 1237 1390 12%
A-5 813 1030 24%
A-8 983 1280 26%
4.4. COMPARISON TO PCI AND ACI DESIGN PROVISIONS
In this section the design provisions discussed in Section 2.3 are evaluated with respect to the
results of the specimens tested in this program. Section 4.4.1 summarizes the equations and
limits used in the evaluation. In Section 4.4.2, results are compared in terms of the effective
coefficient of friction μe computed using the PCI Design Handbook. In Section 4.4.3, results are
compared in terms of the nominal shear strength Vn (or vn) computed using the PCI Design
Handbook and the ACI 318 code.
4.4.1. Shear Friction Design Provisions. This section summarizes the equations and
limits in the 6th
and 7th
Editions of the PCI Design Handbook (2004 and 2011) and the ACI 318
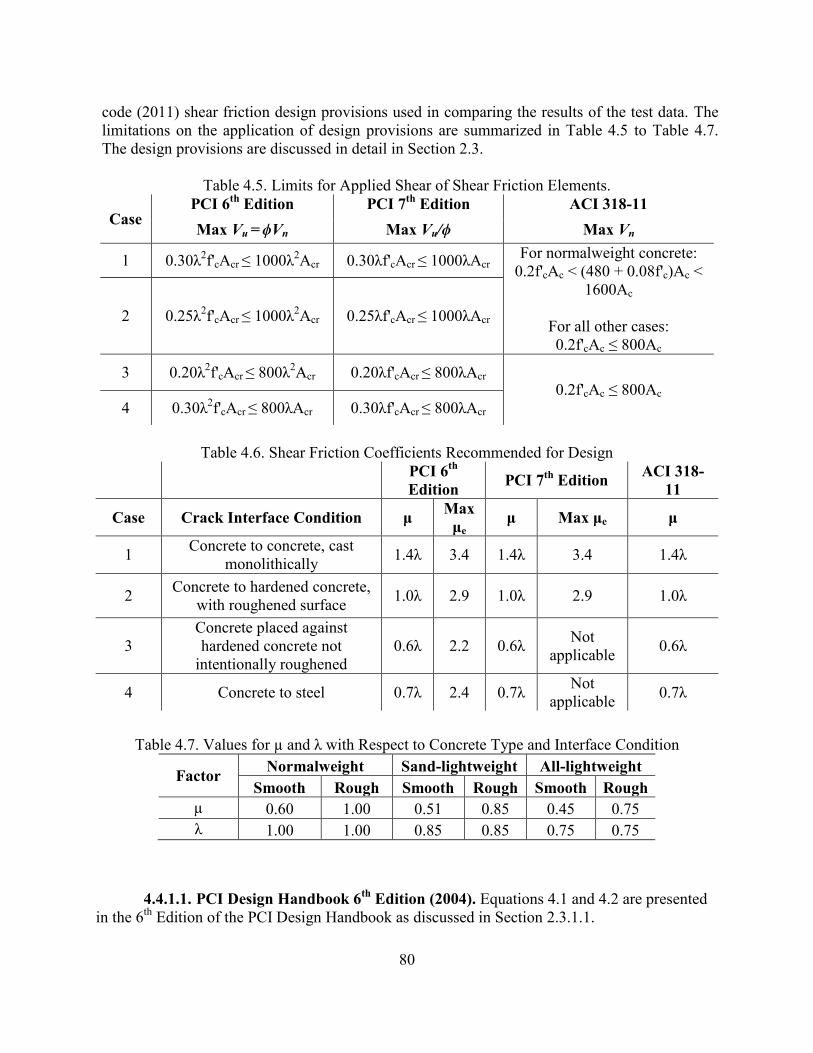
80
code (2011) shear friction design provisions used in comparing the results of the test data. The
limitations on the application of design provisions are summarized in Table 4.5 to Table 4.7.
The design provisions are discussed in detail in Section 2.3.
Table 4.5. Limits for Applied Shear of Shear Friction Elements.
Case PCI 6
th Edition PCI 7
th Edition ACI 318-11
Max Vu = ϕVn Max Vu/ϕ Max Vn
1 0.30λ2f'cAcr ≤ 1000λ
2Acr 0.30λf'cAcr ≤ 1000λAcr
For normalweight concrete:
0.2f'cAc < (480 + 0.08f'c)Ac <
1600Ac
For all other cases:
0.2f'cAc ≤ 800Ac
2 0.25λ2f'cAcr ≤ 1000λ
2Acr 0.25λf'cAcr ≤ 1000λAcr
3 0.20λ2f'cAcr ≤ 800λ
2Acr 0.20λf'cAcr ≤ 800λAcr
0.2f'cAc ≤ 800Ac
4 0.30λ2f'cAcr ≤ 800λAcr 0.30λf'cAcr ≤ 800λAcr
Table 4.6. Shear Friction Coefficients Recommended for Design
PCI 6
th
Edition PCI 7
th Edition
ACI 318-
11
Case Crack Interface Condition μ Max
μe μ Max μe μ
1 Concrete to concrete, cast
monolithically 1.4λ 3.4 1.4λ 3.4 1.4λ
2 Concrete to hardened concrete,
with roughened surface 1.0λ 2.9 1.0λ 2.9 1.0λ
3
Concrete placed against
hardened concrete not
intentionally roughened
0.6λ 2.2 0.6λ Not
applicable 0.6λ
4 Concrete to steel 0.7λ 2.4 0.7λ Not
applicable 0.7λ
Table 4.7. Values for µ and λ with Respect to Concrete Type and Interface Condition
Factor Normalweight Sand-lightweight All-lightweight
Smooth Rough Smooth Rough Smooth Rough
µ 0.60 1.00 0.51 0.85 0.45 0.75
λ 1.00 1.00 0.85 0.85 0.75 0.75
4.4.1.1. PCI Design Handbook 6
th Edition (2004). Equations 4.1 and 4.2 are presented
in the 6th
Edition of the PCI Design Handbook as discussed in Section 2.3.1.1.
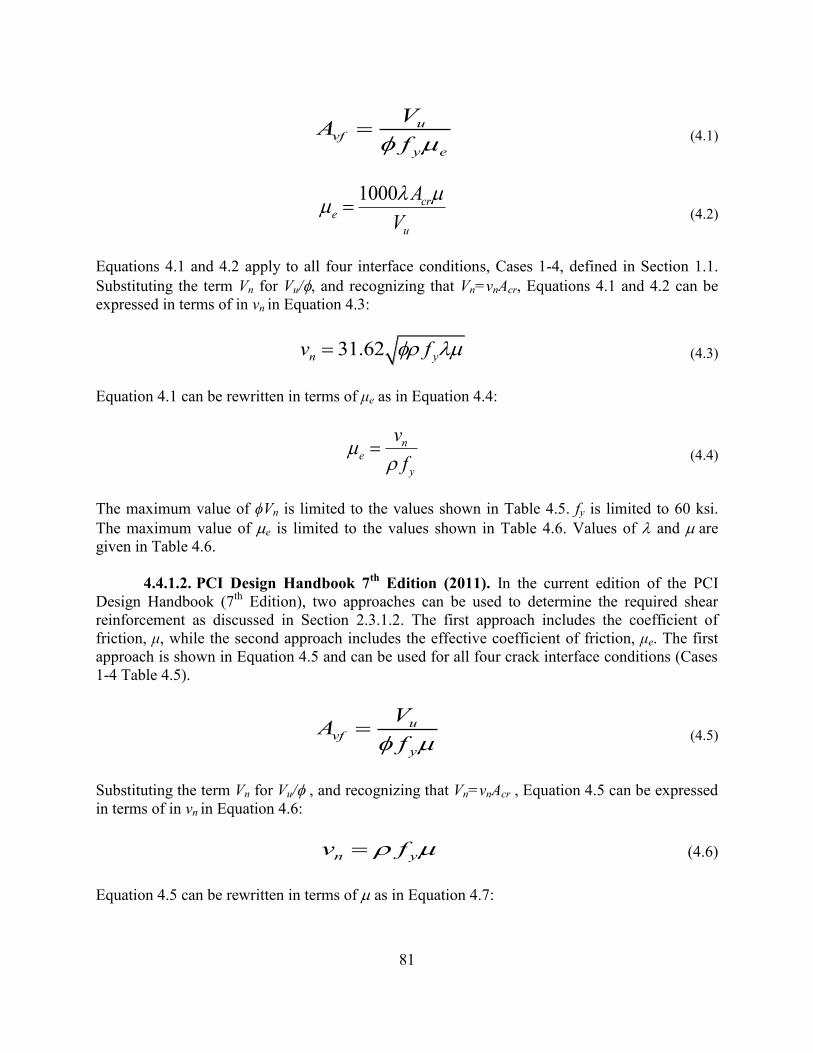
81
u
vf
y e
VA
f (4.1)
1000 cre
u
A
V
(4.2)
Equations 4.1 and 4.2 apply to all four interface conditions, Cases 1-4, defined in Section 1.1.
Substituting the term Vn for Vu/, and recognizing that Vn=vnAcr, Equations 4.1 and 4.2 can be
expressed in terms of in vn in Equation 4.3:
31.62n yv f (4.3)
Equation 4.1 can be rewritten in terms of μe as in Equation 4.4:
n
e
y
v
f
(4.4)
The maximum value of ϕVn is limited to the values shown in Table 4.5. fy is limited to 60 ksi.
The maximum value of e is limited to the values shown in Table 4.6. Values of and are
given in Table 4.6.
4.4.1.2. PCI Design Handbook 7th
Edition (2011). In the current edition of the PCI
Design Handbook (7th
Edition), two approaches can be used to determine the required shear
reinforcement as discussed in Section 2.3.1.2. The first approach includes the coefficient of
friction, μ, while the second approach includes the effective coefficient of friction, μe. The first
approach is shown in Equation 4.5 and can be used for all four crack interface conditions (Cases
1-4 Table 4.5).
u
vf
y
VA
f (4.5)
Substituting the term Vn for Vu/ , and recognizing that Vn=vnAcr , Equation 4.5 can be expressed
in terms of in vn in Equation 4.6:
n yv f (4.6)
Equation 4.5 can be rewritten in terms of as in Equation 4.7:
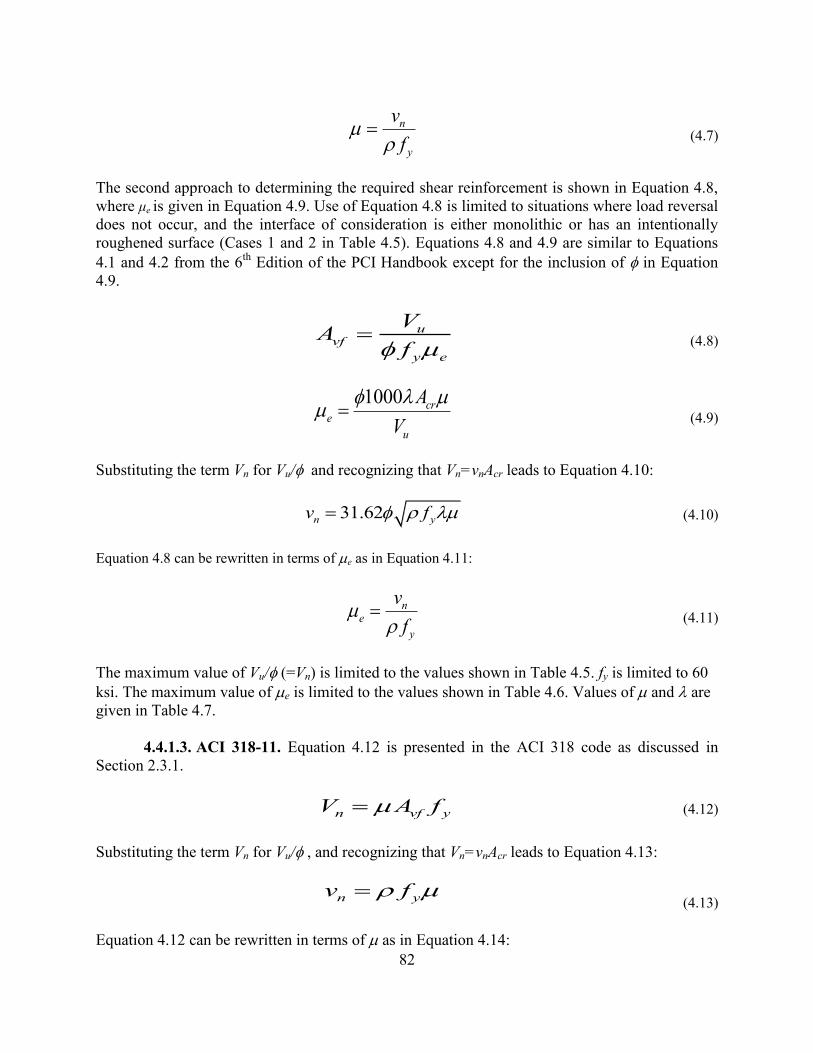
82
n
y
v
f
(4.7)
The second approach to determining the required shear reinforcement is shown in Equation 4.8,
where μe is given in Equation 4.9. Use of Equation 4.8 is limited to situations where load reversal
does not occur, and the interface of consideration is either monolithic or has an intentionally
roughened surface (Cases 1 and 2 in Table 4.5). Equations 4.8 and 4.9 are similar to Equations
4.1 and 4.2 from the 6th
Edition of the PCI Handbook except for the inclusion of in Equation
4.9.
u
vf
y e
VA
f (4.8)
1000 cre
u
A
V
(4.9)
Substituting the term Vn for Vu/ and recognizing that Vn=vnAcr leads to Equation 4.10:
31.62n yv f (4.10)
Equation 4.8 can be rewritten in terms of e as in Equation 4.11:
n
e
y
v
f
(4.11)
The maximum value of Vu/ (=Vn) is limited to the values shown in Table 4.5. fy is limited to 60
ksi. The maximum value of e is limited to the values shown in Table 4.6. Values of and are
given in Table 4.7.
4.4.1.3. ACI 318-11. Equation 4.12 is presented in the ACI 318 code as discussed in
Section 2.3.1.
n vf yV A f (4.12)
Substituting the term Vn for Vu/ , and recognizing that Vn=vnAcr leads to Equation 4.13:
n yv f (4.13)
Equation 4.12 can be rewritten in terms of as in Equation 4.14:

83
n
y
v
f
(4.14)
The maximum value of Vn is limited to the values shown in Table 4.5. fy is limited to 60 ksi.
Values of and are given in Table 4.7.
4.4.2. Shear Strength. In this section, the peak shear stress vu of the specimens tested in
Section 3 is compared with the values predicted using the current (7th
Edition) PCI Design
Handbook (2011) and ACI 318 code (2011) provisions for designing the required shear interface
reinforcement. The predicted value of the shear strength vn is computed using two approaches: 1)
the coefficient of friction μ approach, which is permitted in both the current (7th
Edition) PCI
Design Handbook and the ACI 318 code and is applicable to all interface conditions, and 2) the
effective coefficient of friction μe approach, which is permitted in the current PCI Design
Handbook (7th
Edition) for roughened interface (Case 2) conditions. It should be noted that the
μe approach is applicable to non-monolithic interface conditions with either a roughened or
smooth interface condition (Case 2 and 3 respectively) in the 6th
Edition of the PCI Design
Handbook, but it is not applicable to non-monolithic interface conditions with a smooth interface
condition (Case 3) in the 7th
Edition. However, the predictive equation for μe is examined herein
to determine whether its application is conservative for the specimens in this study. Values of μe
are taken from the 6th
Edition in this comparison.
Using the coefficient of friction μ approach, the predicted value of the shear strength vn is
computed using Equations 4.6 (PCI Design Handbook) and 4.13 (ACI 318 code), which are the
same equation. The value of is a function of the interface condition and concrete type as given
in Table 4.6. Using the effective coefficient of friction μe approach in the PCI Design Handbook,
the predicted value of vn is computed using Equation 4.10. Equations 4.6 (and 4.13) and 4.10 are
plotted in Figure 4.25 to Figure 4.30 for the different concrete types and interface conditions.
The upper limit on the shear strength for each approach is given in Table 4.5. fy is limited to 60
ksi. The data are presented in this way as it results in the least conservative condition. Values of
the peak shear stress vu for the corresponding test specimens are plotted on the graphs for
comparison.
In Figure 4.25 to Figure 4.30, good correlation is observed for specimens with 5000 psi concrete
compressive strength (regardless of interface condition) using the μe approach of Equation 4.10
(dashed line in the figures). As concrete compressive strength increases, the results are
increasingly conservative. In all cases, the μ approach of Equations 4.6 and 4.13 (solid line in the
figures) is conservative.
Figure 4.25, 4.27, and 4.29 pertain to specimens with a smooth interface condition. As
mentioned previously, the μe approach in the current (7th
Edition) PCI Design Handbook is not
applicable for Case 3 interface conditions. However, the results indicate that using this approach,
a similar level of conservatism is achieved as for the specimens with the same concrete type and
a roughened interface condition shown in Figures 4.26, 4.28, and 4.30. These test results support
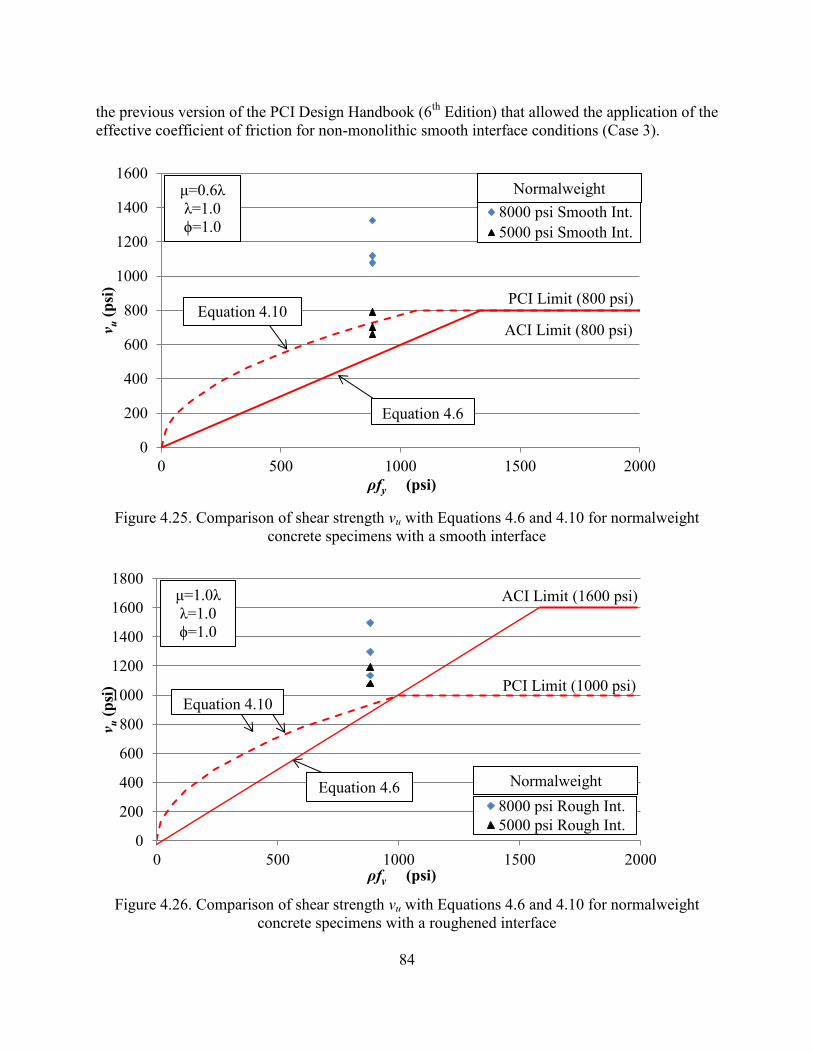
84
the previous version of the PCI Design Handbook (6th
Edition) that allowed the application of the
effective coefficient of friction for non-monolithic smooth interface conditions (Case 3).
Figure 4.25. Comparison of shear strength vu with Equations 4.6 and 4.10 for normalweight
concrete specimens with a smooth interface
Figure 4.26. Comparison of shear strength vu with Equations 4.6 and 4.10 for normalweight
concrete specimens with a roughened interface
0
200
400
600
800
1000
1200
1400
1600
0 500 1000 1500 2000
v u (
psi
)
ρfy (psi)
8000 psi Smooth Int.
5000 psi Smooth Int.
Equation 4.10
Equation 4.6
PCI Limit (800 psi)
ACI Limit (800 psi)
μ=0.6λ
λ=1.0
ϕ=1.0
0
200
400
600
800
1000
1200
1400
1600
1800
0 500 1000 1500 2000
v u (
psi
)
ρfy (psi)
8000 psi Rough Int.
5000 psi Rough Int.
Equation 4.10
Equation 4.6
PCI Limit (1000 psi)
ACI Limit (1600 psi) μ=1.0λ
λ=1.0
ϕ=1.0
Normalweight
Normalweight
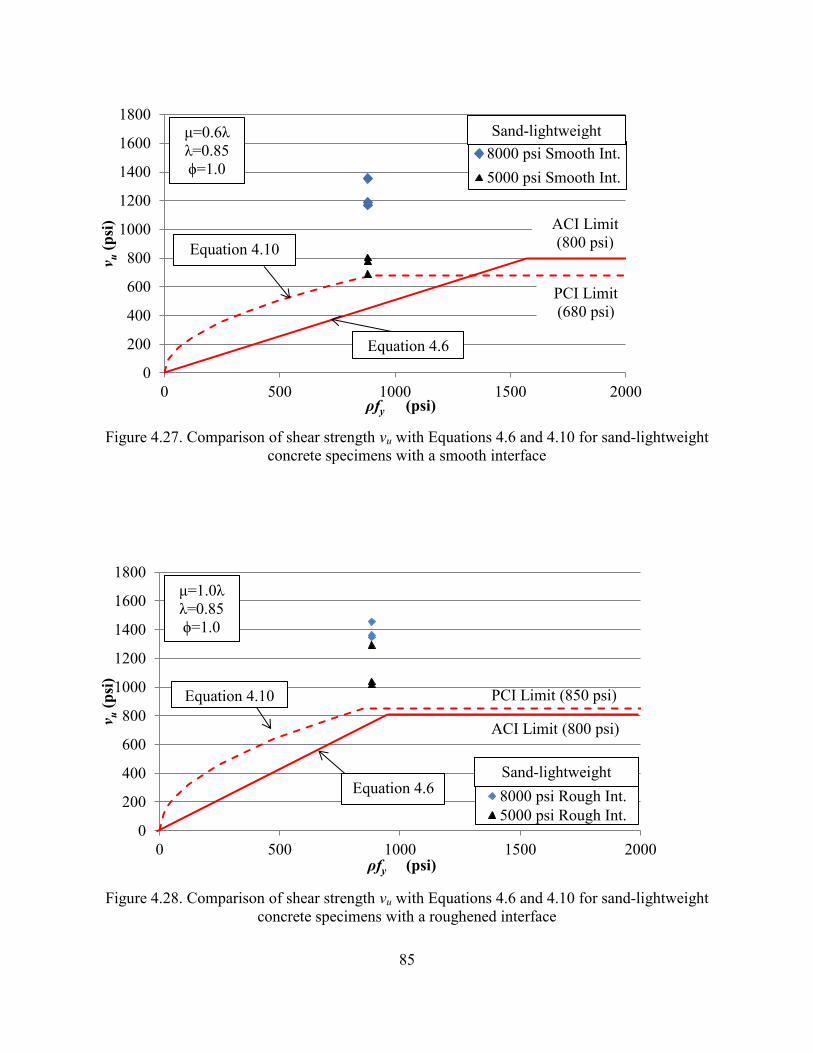
85
Figure 4.27. Comparison of shear strength vu with Equations 4.6 and 4.10 for sand-lightweight
concrete specimens with a smooth interface
Figure 4.28. Comparison of shear strength vu with Equations 4.6 and 4.10 for sand-lightweight
concrete specimens with a roughened interface
0
200
400
600
800
1000
1200
1400
1600
1800
0 500 1000 1500 2000
v u (
psi
)
ρfy (psi)
8000 psi Smooth Int.
5000 psi Smooth Int.
Equation 4.10
PCI Limit
(680 psi)
ACI Limit
(800 psi)
Equation 4.6
μ=0.6λ
λ=0.85
ϕ=1.0
0
200
400
600
800
1000
1200
1400
1600
1800
0 500 1000 1500 2000
v u (
psi
)
ρfy (psi)
8000 psi Rough Int.
5000 psi Rough Int.
Equation 4.10
Equation 4.6
PCI Limit (850 psi)
ACI Limit (800 psi)
μ=1.0λ
λ=0.85
ϕ=1.0
Sand-lightweight
Sand-lightweight
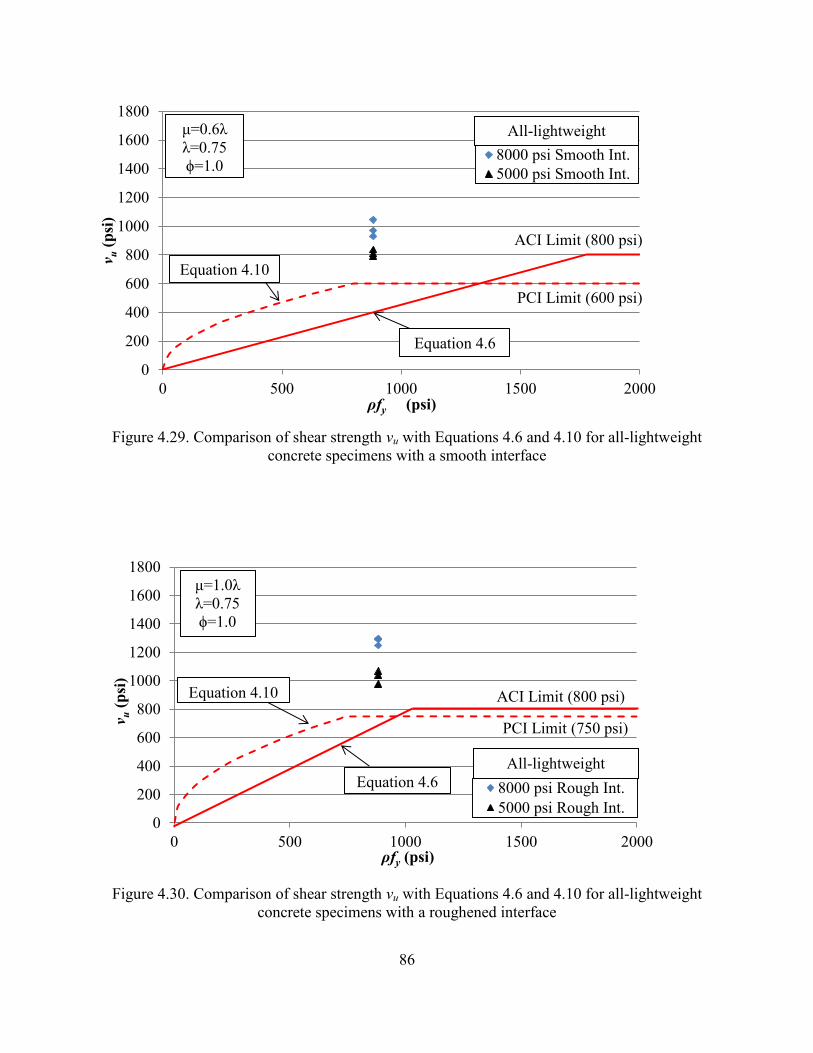
86
Figure 4.29. Comparison of shear strength vu with Equations 4.6 and 4.10 for all-lightweight
concrete specimens with a smooth interface
Figure 4.30. Comparison of shear strength vu with Equations 4.6 and 4.10 for all-lightweight
concrete specimens with a roughened interface
0
200
400
600
800
1000
1200
1400
1600
1800
0 500 1000 1500 2000
v u (
psi
)
ρfy (psi)
8000 psi Smooth Int.
5000 psi Smooth Int.
Equation 4.10
μ=0.6λ
λ=0.75
ϕ=1.0
PCI Limit (600 psi)
ACI Limit (800 psi)
Equation 4.6
0
200
400
600
800
1000
1200
1400
1600
1800
0 500 1000 1500 2000
v u (
psi
)
ρfy (psi)
8000 psi Rough Int.
5000 psi Rough Int.
Equation 4.6
PCI Limit (750 psi)
ACI Limit (800 psi) Equation 4.10
μ=1.0λ
λ=0.75
ϕ=1.0
All-lightweight
All-lightweight
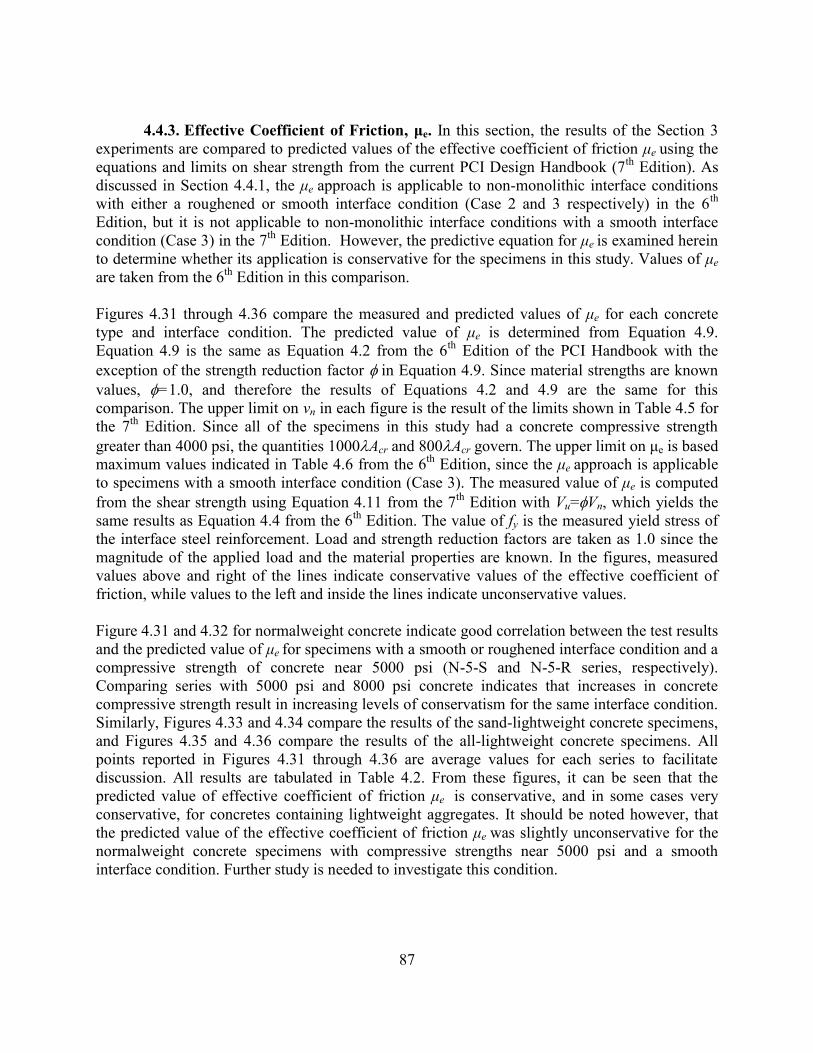
87
4.4.3. Effective Coefficient of Friction, μe. In this section, the results of the Section 3
experiments are compared to predicted values of the effective coefficient of friction μe using the
equations and limits on shear strength from the current PCI Design Handbook (7th
Edition). As
discussed in Section 4.4.1, the μe approach is applicable to non-monolithic interface conditions
with either a roughened or smooth interface condition (Case 2 and 3 respectively) in the 6th
Edition, but it is not applicable to non-monolithic interface conditions with a smooth interface
condition (Case 3) in the 7th
Edition. However, the predictive equation for μe is examined herein
to determine whether its application is conservative for the specimens in this study. Values of μe
are taken from the 6th
Edition in this comparison.
Figures 4.31 through 4.36 compare the measured and predicted values of μe for each concrete
type and interface condition. The predicted value of μe is determined from Equation 4.9.
Equation 4.9 is the same as Equation 4.2 from the 6th
Edition of the PCI Handbook with the
exception of the strength reduction factor in Equation 4.9. Since material strengths are known
values, =1.0, and therefore the results of Equations 4.2 and 4.9 are the same for this
comparison. The upper limit on vn in each figure is the result of the limits shown in Table 4.5 for
the 7th
Edition. Since all of the specimens in this study had a concrete compressive strength
greater than 4000 psi, the quantities 1000Acr and 800Acr govern. The upper limit on μe is based
maximum values indicated in Table 4.6 from the 6th
Edition, since the μe approach is applicable
to specimens with a smooth interface condition (Case 3). The measured value of μe is computed
from the shear strength using Equation 4.11 from the 7th
Edition with Vu=Vn, which yields the
same results as Equation 4.4 from the 6th
Edition. The value of fy is the measured yield stress of
the interface steel reinforcement. Load and strength reduction factors are taken as 1.0 since the
magnitude of the applied load and the material properties are known. In the figures, measured
values above and right of the lines indicate conservative values of the effective coefficient of
friction, while values to the left and inside the lines indicate unconservative values.
Figure 4.31 and 4.32 for normalweight concrete indicate good correlation between the test results
and the predicted value of μe for specimens with a smooth or roughened interface condition and a
compressive strength of concrete near 5000 psi (N-5-S and N-5-R series, respectively).
Comparing series with 5000 psi and 8000 psi concrete indicates that increases in concrete
compressive strength result in increasing levels of conservatism for the same interface condition.
Similarly, Figures 4.33 and 4.34 compare the results of the sand-lightweight concrete specimens,
and Figures 4.35 and 4.36 compare the results of the all-lightweight concrete specimens. All
points reported in Figures 4.31 through 4.36 are average values for each series to facilitate
discussion. All results are tabulated in Table 4.2. From these figures, it can be seen that the
predicted value of effective coefficient of friction μe is conservative, and in some cases very
conservative, for concretes containing lightweight aggregates. It should be noted however, that
the predicted value of the effective coefficient of friction μe was slightly unconservative for the
normalweight concrete specimens with compressive strengths near 5000 psi and a smooth
interface condition. Further study is needed to investigate this condition.
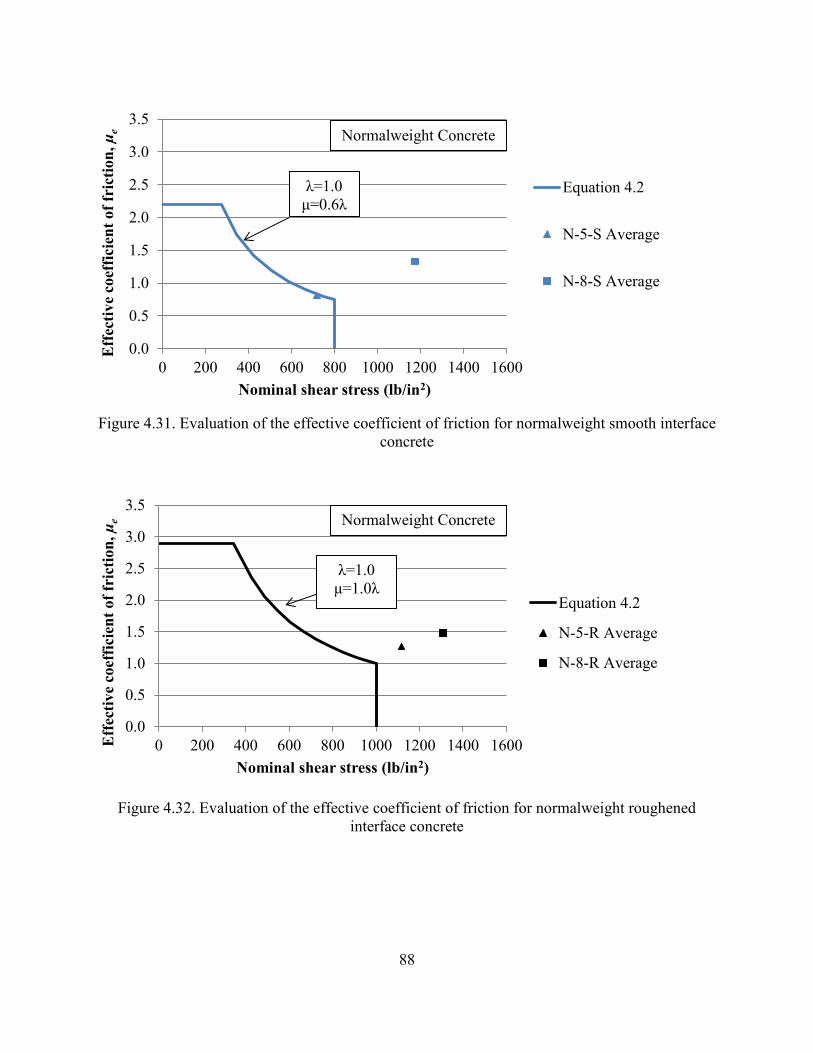
88
Figure 4.31. Evaluation of the effective coefficient of friction for normalweight smooth interface
concrete
Figure 4.32. Evaluation of the effective coefficient of friction for normalweight roughened
interface concrete
0.0
0.5
1.0
1.5
2.0
2.5
3.0
3.5
0 200 400 600 800 1000 1200 1400 1600
Eff
ecti
ve
coef
fici
ent
of
fric
tion
, μ
e
Nominal shear stress (lb/in2)
Equation 4.2
N-5-S Average
N-8-S Average
λ=1.0
μ=0.6λ
0.0
0.5
1.0
1.5
2.0
2.5
3.0
3.5
0 200 400 600 800 1000 1200 1400 1600Eff
ecti
ve
coef
fici
ent
of
fric
tion
, μ
e
Nominal shear stress (lb/in2)
Equation 4.2
N-5-R Average
N-8-R Average
λ=1.0
μ=1.0λ
Normalweight Concrete
Normalweight Concrete
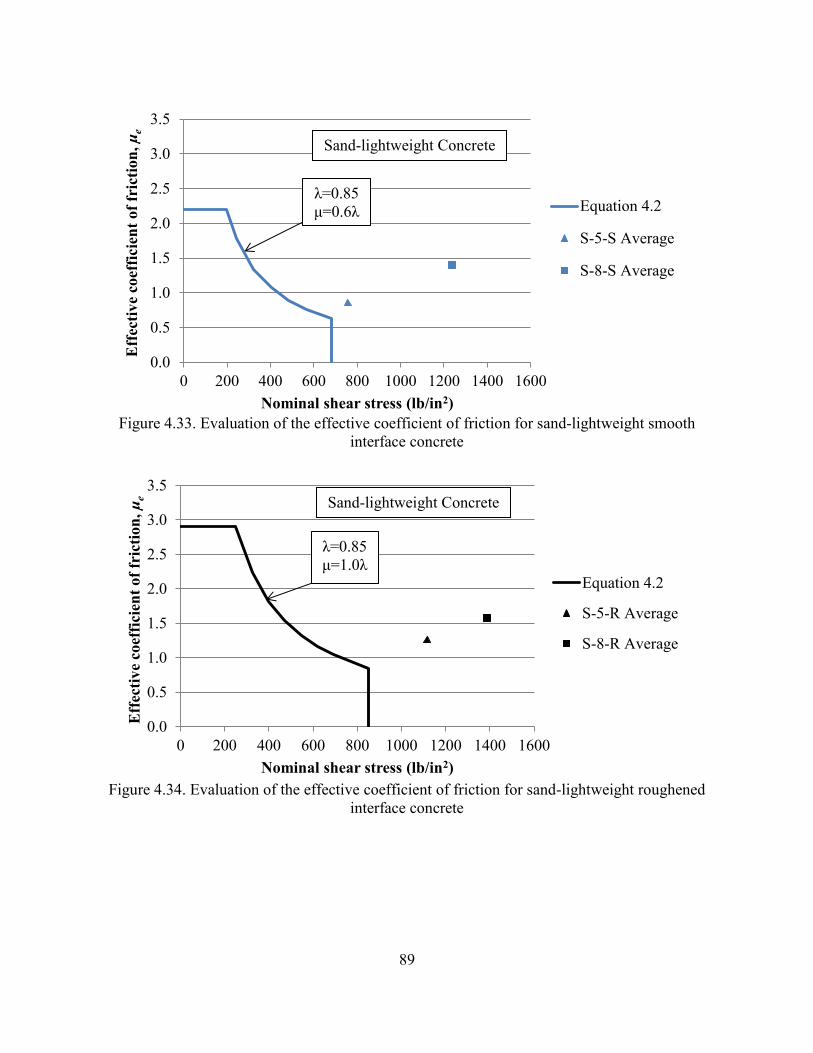
89
Figure 4.33. Evaluation of the effective coefficient of friction for sand-lightweight smooth
interface concrete
Figure 4.34. Evaluation of the effective coefficient of friction for sand-lightweight roughened
interface concrete
0.0
0.5
1.0
1.5
2.0
2.5
3.0
3.5
0 200 400 600 800 1000 1200 1400 1600
Eff
ecti
ve
coef
fici
ent
of
fric
tion
, μ
e
Nominal shear stress (lb/in2)
Equation 4.2
S-5-S Average
S-8-S Average
λ=0.85
μ=0.6λ
0.0
0.5
1.0
1.5
2.0
2.5
3.0
3.5
0 200 400 600 800 1000 1200 1400 1600
Eff
ecti
ve
coef
fici
ent
of
fric
tion
, μ
e
Nominal shear stress (lb/in2)
Equation 4.2
S-5-R Average
S-8-R Average
λ=0.85
μ=1.0λ
Sand-lightweight Concrete
Sand-lightweight Concrete
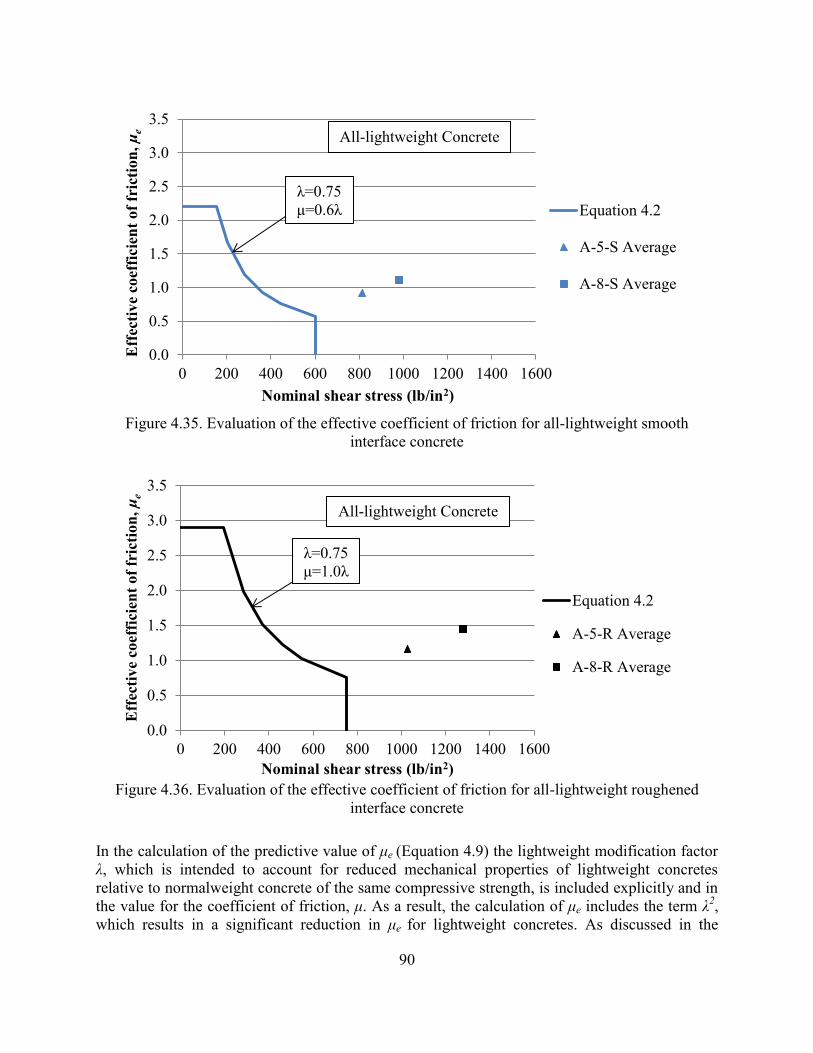
90
Figure 4.35. Evaluation of the effective coefficient of friction for all-lightweight smooth
interface concrete
Figure 4.36. Evaluation of the effective coefficient of friction for all-lightweight roughened
interface concrete
In the calculation of the predictive value of μe (Equation 4.9) the lightweight modification factor
λ, which is intended to account for reduced mechanical properties of lightweight concretes
relative to normalweight concrete of the same compressive strength, is included explicitly and in
the value for the coefficient of friction, μ. As a result, the calculation of μe includes the term λ2,
which results in a significant reduction in μe for lightweight concretes. As discussed in the
0.0
0.5
1.0
1.5
2.0
2.5
3.0
3.5
0 200 400 600 800 1000 1200 1400 1600
Eff
ecti
ve
coef
fici
ent
of
fric
tion
, μ
e
Nominal shear stress (lb/in2)
Equation 4.2
A-5-S Average
A-8-S Average
λ=0.75
μ=0.6λ
0.0
0.5
1.0
1.5
2.0
2.5
3.0
3.5
0 200 400 600 800 1000 1200 1400 1600
Eff
ecti
ve
coef
fici
ent
of
fric
tion
, μ
e
Nominal shear stress (lb/in2)
Equation 4.2
A-5-R Average
A-8-R Average
λ=0.75
μ=1.0λ
All-lightweight Concrete
All-lightweight Concrete
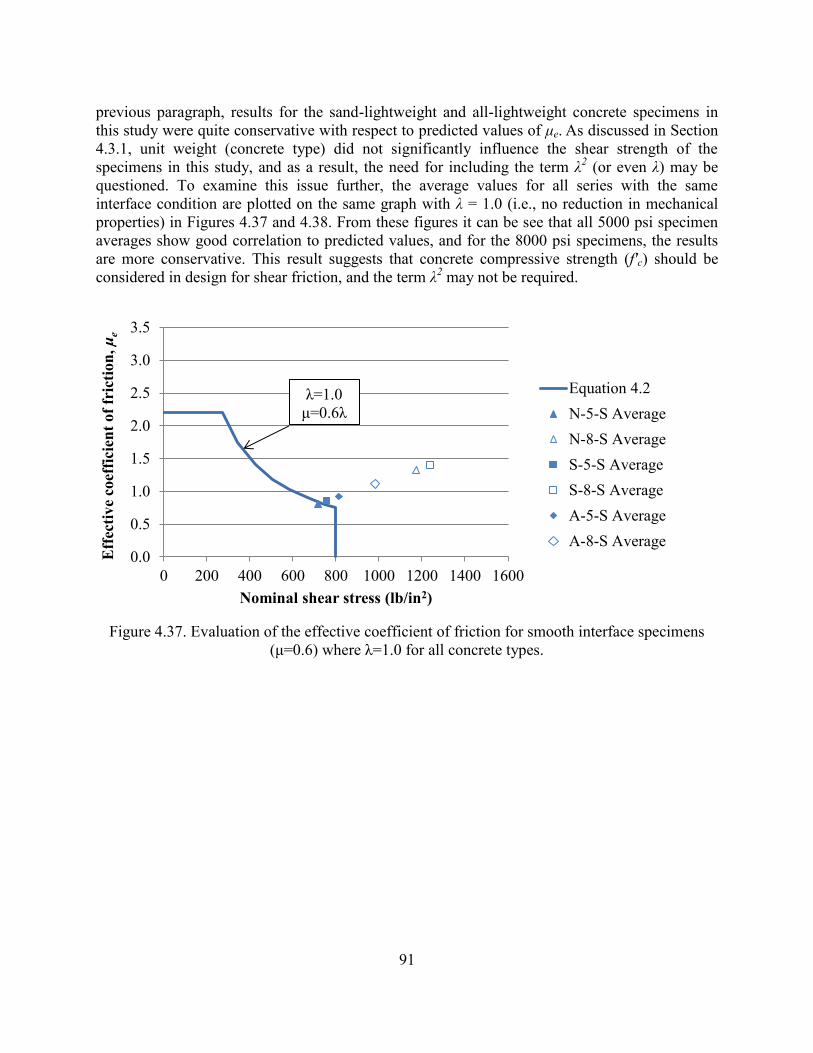
91
previous paragraph, results for the sand-lightweight and all-lightweight concrete specimens in
this study were quite conservative with respect to predicted values of μe. As discussed in Section
4.3.1, unit weight (concrete type) did not significantly influence the shear strength of the
specimens in this study, and as a result, the need for including the term λ2 (or even λ) may be
questioned. To examine this issue further, the average values for all series with the same
interface condition are plotted on the same graph with λ = 1.0 (i.e., no reduction in mechanical
properties) in Figures 4.37 and 4.38. From these figures it can be see that all 5000 psi specimen
averages show good correlation to predicted values, and for the 8000 psi specimens, the results
are more conservative. This result suggests that concrete compressive strength (f'c) should be
considered in design for shear friction, and the term λ2 may not be required.
Figure 4.37. Evaluation of the effective coefficient of friction for smooth interface specimens
(μ=0.6) where λ=1.0 for all concrete types.
0.0
0.5
1.0
1.5
2.0
2.5
3.0
3.5
0 200 400 600 800 1000 1200 1400 1600
Eff
ecti
ve
coef
fici
ent
of
fric
tion
, μ
e
Nominal shear stress (lb/in2)
Equation 4.2
N-5-S Average
N-8-S Average
S-5-S Average
S-8-S Average
A-5-S Average
A-8-S Average
λ=1.0
μ=0.6λ
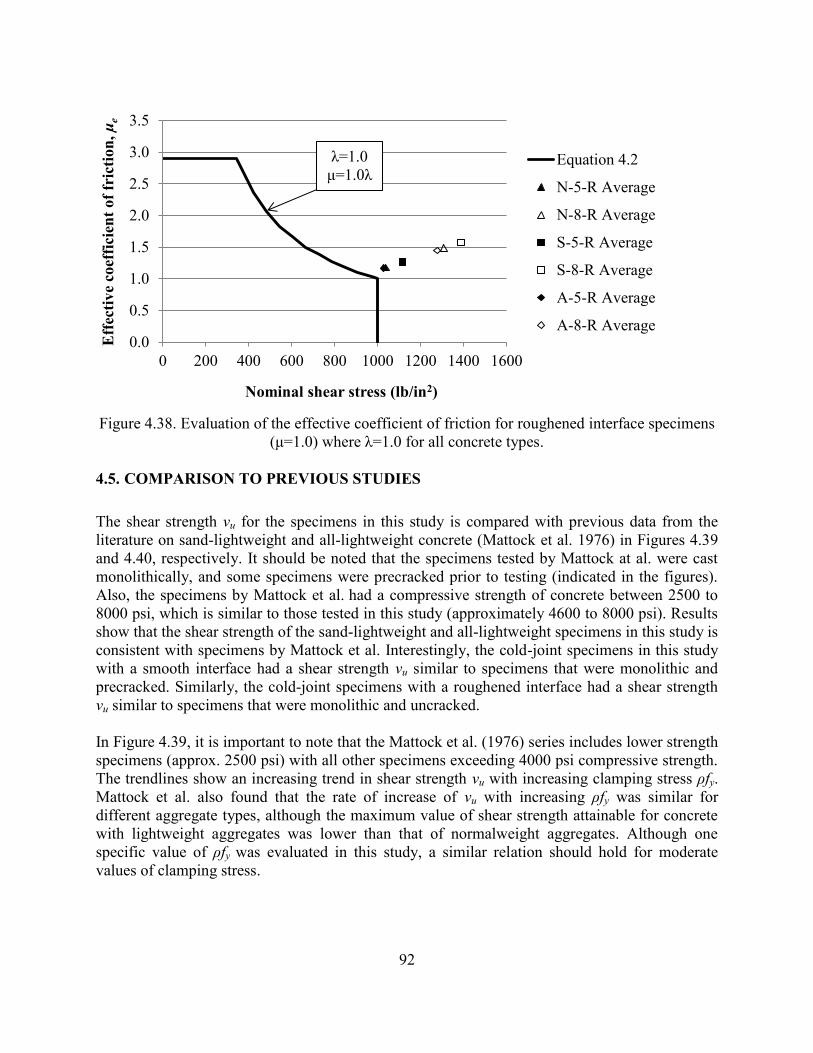
92
Figure 4.38. Evaluation of the effective coefficient of friction for roughened interface specimens
(μ=1.0) where λ=1.0 for all concrete types.
4.5. COMPARISON TO PREVIOUS STUDIES
The shear strength vu for the specimens in this study is compared with previous data from the
literature on sand-lightweight and all-lightweight concrete (Mattock et al. 1976) in Figures 4.39
and 4.40, respectively. It should be noted that the specimens tested by Mattock at al. were cast
monolithically, and some specimens were precracked prior to testing (indicated in the figures).
Also, the specimens by Mattock et al. had a compressive strength of concrete between 2500 to
8000 psi, which is similar to those tested in this study (approximately 4600 to 8000 psi). Results
show that the shear strength of the sand-lightweight and all-lightweight specimens in this study is
consistent with specimens by Mattock et al. Interestingly, the cold-joint specimens in this study
with a smooth interface had a shear strength vu similar to specimens that were monolithic and
precracked. Similarly, the cold-joint specimens with a roughened interface had a shear strength
vu similar to specimens that were monolithic and uncracked.
In Figure 4.39, it is important to note that the Mattock et al. (1976) series includes lower strength
specimens (approx. 2500 psi) with all other specimens exceeding 4000 psi compressive strength.
The trendlines show an increasing trend in shear strength vu with increasing clamping stress ρfy.
Mattock et al. also found that the rate of increase of vu with increasing ρfy was similar for
different aggregate types, although the maximum value of shear strength attainable for concrete
with lightweight aggregates was lower than that of normalweight aggregates. Although one
specific value of ρfy was evaluated in this study, a similar relation should hold for moderate
values of clamping stress.
0.0
0.5
1.0
1.5
2.0
2.5
3.0
3.5
0 200 400 600 800 1000 1200 1400 1600
Eff
ecti
ve
coef
fici
ent
of
fric
tion
, μ
e
Nominal shear stress (lb/in2)
Equation 4.2
N-5-R Average
N-8-R Average
S-5-R Average
S-8-R Average
A-5-R Average
A-8-R Average
λ=1.0
μ=1.0λ
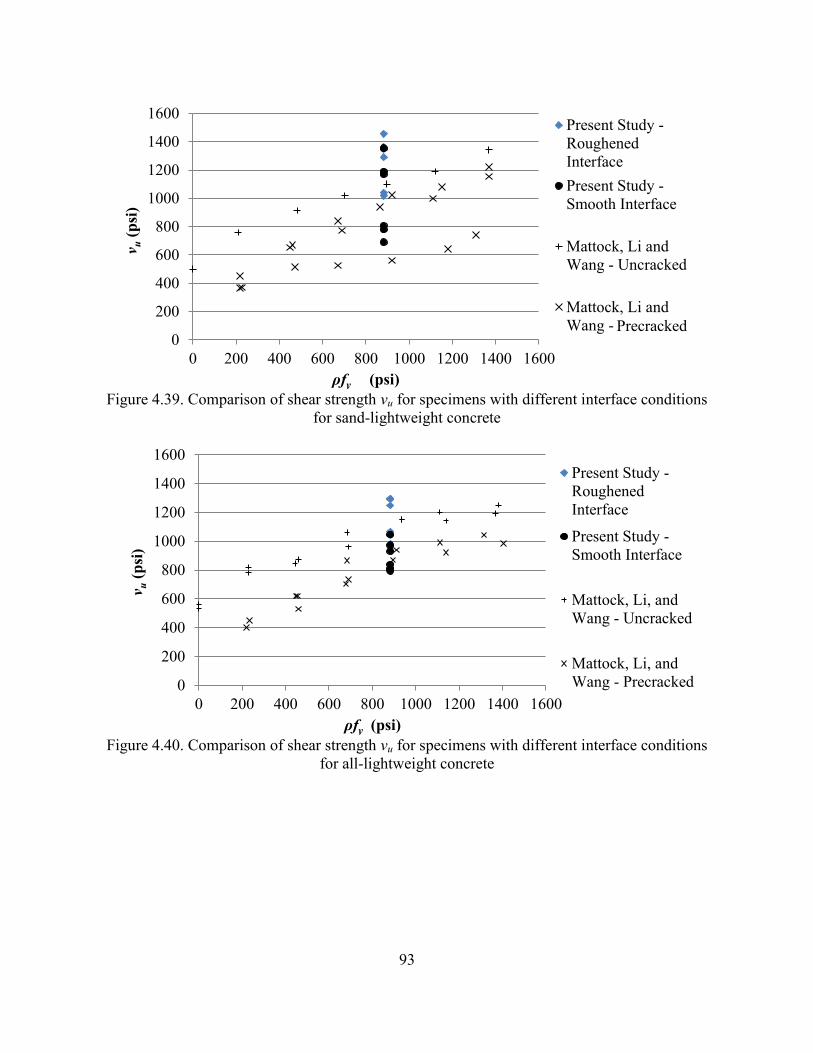
93
Figure 4.39. Comparison of shear strength vu for specimens with different interface conditions
for sand-lightweight concrete
Figure 4.40. Comparison of shear strength vu for specimens with different interface conditions
for all-lightweight concrete
0
200
400
600
800
1000
1200
1400
1600
0 200 400 600 800 1000 1200 1400 1600
v u (
psi
)
ρfy (psi)
Present Study -
Roughened
Interface
Present Study -
Smooth Interface
Mattock, Li and
Wang - Uncracked
Mattock, Li and
Wang - CrackedPrecracked
0
200
400
600
800
1000
1200
1400
1600
0 200 400 600 800 1000 1200 1400 1600
v u (
psi
)
ρfy (psi)
Present Study -
Roughened
Interface
Present Study -
Smooth Interface
Mattock, Li, and
Wang - Uncracked
Mattock, Li, and
Wang - Precracked
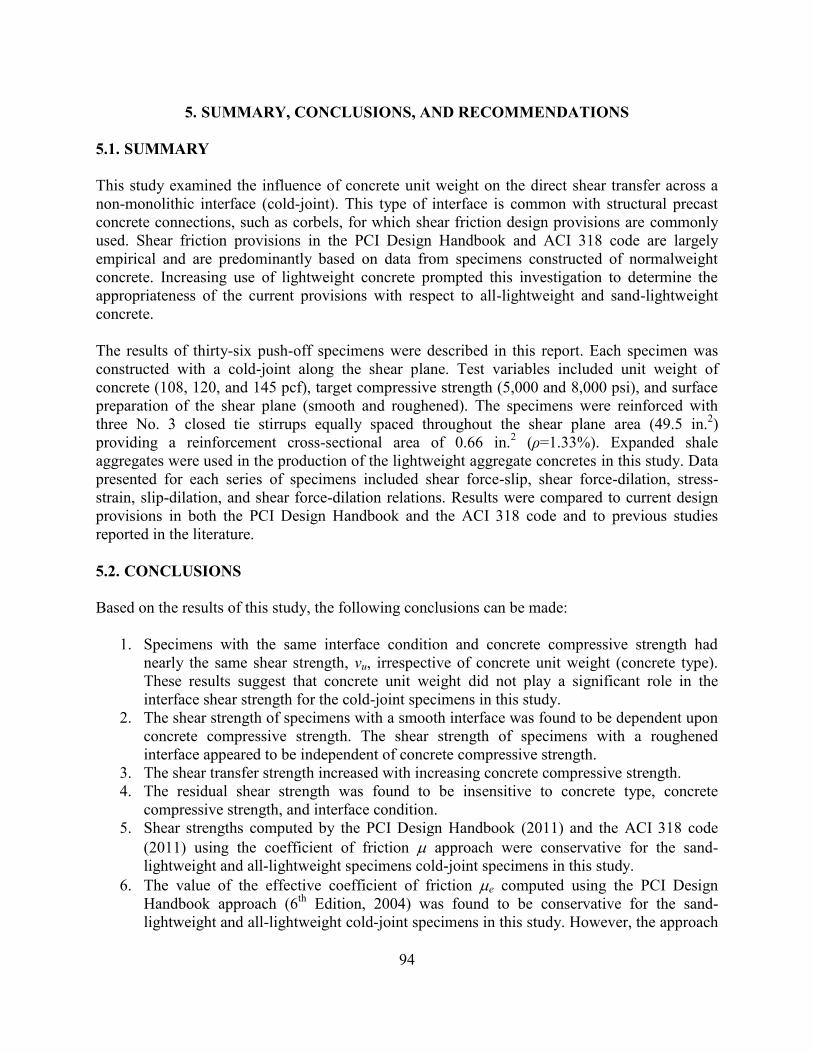
94
5. SUMMARY, CONCLUSIONS, AND RECOMMENDATIONS
5.1. SUMMARY
This study examined the influence of concrete unit weight on the direct shear transfer across a
non-monolithic interface (cold-joint). This type of interface is common with structural precast
concrete connections, such as corbels, for which shear friction design provisions are commonly
used. Shear friction provisions in the PCI Design Handbook and ACI 318 code are largely
empirical and are predominantly based on data from specimens constructed of normalweight
concrete. Increasing use of lightweight concrete prompted this investigation to determine the
appropriateness of the current provisions with respect to all-lightweight and sand-lightweight
concrete.
The results of thirty-six push-off specimens were described in this report. Each specimen was
constructed with a cold-joint along the shear plane. Test variables included unit weight of
concrete (108, 120, and 145 pcf), target compressive strength (5,000 and 8,000 psi), and surface
preparation of the shear plane (smooth and roughened). The specimens were reinforced with
three No. 3 closed tie stirrups equally spaced throughout the shear plane area (49.5 in.2)
providing a reinforcement cross-sectional area of 0.66 in.2 (ρ=1.33%). Expanded shale
aggregates were used in the production of the lightweight aggregate concretes in this study. Data
presented for each series of specimens included shear force-slip, shear force-dilation, stress-
strain, slip-dilation, and shear force-dilation relations. Results were compared to current design
provisions in both the PCI Design Handbook and the ACI 318 code and to previous studies
reported in the literature.
5.2. CONCLUSIONS
Based on the results of this study, the following conclusions can be made:
1. Specimens with the same interface condition and concrete compressive strength had
nearly the same shear strength, vu, irrespective of concrete unit weight (concrete type).
These results suggest that concrete unit weight did not play a significant role in the
interface shear strength for the cold-joint specimens in this study.
2. The shear strength of specimens with a smooth interface was found to be dependent upon
concrete compressive strength. The shear strength of specimens with a roughened
interface appeared to be independent of concrete compressive strength.
3. The shear transfer strength increased with increasing concrete compressive strength.
4. The residual shear strength was found to be insensitive to concrete type, concrete
compressive strength, and interface condition.
5. Shear strengths computed by the PCI Design Handbook (2011) and the ACI 318 code
(2011) using the coefficient of friction approach were conservative for the sand-
lightweight and all-lightweight specimens cold-joint specimens in this study.
6. The value of the effective coefficient of friction e computed using the PCI Design
Handbook approach (6th
Edition, 2004) was found to be conservative for the sand-
lightweight and all-lightweight cold-joint specimens in this study. However, the approach
95
was not conservative for normalweight concrete specimens with a compressive strength
of 5000 psi and a smooth interface condition.
7. The use of the lightweight concrete modification factor in the calculation for the
effective coefficient of friction e was found to be conservative for the lightweight
aggregate concretes investigated in this study.
5.3. RECOMMENDATIONS FOR DESIGN EQUATIONS
As discussed in Section 5.2, the value of the effective coefficient of friction e computed using
the PCI Design Handbook approach was found to be conservative for both roughened and
smooth non-monolithic interfaces for the specimens with lightweight aggregate concretes in this
study. While the e approach is applicable to non-monolithic interface conditions with either a
roughened or smooth interface condition (Case 2 and 3 respectively) in the 6th Edition (2004), it
is not applicable to non-monolithic interface conditions with a smooth interface condition (Case
3) in the 7th Edition of the PCI Design Handbook (2011). Results reported here support the
previous version of the PCI Design Handbook (6th Edition) that allowed the application of the
effective coefficient of friction for non-monolithic smooth interface conditions (Case 3) for
lightweight aggregate concretes. Further study is needed for normalweight concrete.
5.4. RECOMMENDATIONS FOR FUTURE WORK
Many parameters have been shown to influence the shear transfer capacity of concrete sections
designed using the shear friction mechanism. As this research focused on the unit weight of
concrete, concrete compressive strength, and non-monolithic (cold-joint) interface conditions,
many other aspects were isolated and removed from consideration. Following are
recommendations for future work:
1. For the specimens tested in this study, a constant reinforcement ratio was considered.
Further investigation is needed for all-lightweight concrete and sand-lightweight concrete
cold-joint specimens with different reinforcement ratios for the specific type of aggregate
used in this study (expanded shale). 2. Currently, lightweight aggregates used in the production of lightweight aggregate
concretes are produced locally and supplied on a regional basis. As a result, lightweight
aggregates can be produced from many different base materials (i.e. shale, clay, and
slate) which can have different mechanical properties. Furthermore, due to different
manufacturing processes, the void structures and material properties of expanded
lightweight aggregates can vary widely. Therefore, additional study is also recommended
to determine whether the type of lightweight aggregate and the manufacturing process
play a role in the shear transfer strength for different interface conditions.
3. Investigations should be performed to evaluate the cold-joint interface condition. In this
study, the cold-joint condition was formed with an eight hour delay between casting the
two surfaces of the shear interface. While initial set of the first surface of the interface
was achieved, it was not completely hardened when the second surface was cast. The
delay period used in this program helped facilitate construction of the test specimens and
minimize differences in concrete strength gain with time. However, in practice, the first
96
casting may occur many weeks or months before the secondary casting is complete.
Therefore, it would be of interest to investigate whether and how the delay time between
casting the different surfaces of the interface influences the shear transfer strength.
4. Additional investigation is needed to evaluate the effects of variable surface roughness,
increased shear area, and variable concrete strengths with respect to each half of the
pushoff specimen.
97
REFERENCES
AASHTO (2007) “AASHTO LRFD Bridge Design Specifications,” Fourth edition, American
Association of State Highway and Transportation Officials (AASHTO), Washington, DC.
ACI Committee 318 (1999). "Building Code Requirements for Structural Concrete (ACI 318-99)
and Commentary (ACI 318R-99)," Farmington Hills, MI: American Concrete Institute.
ACI Committee 318 (2011). "Building Code Requirements for Structural Concrete (ACI 318-11)
and Commentary (ACI 318R-11)," Farmington Hills, MI: American Concrete Institute.
ACI Committee 211 (1998). "Standard Practice for Selecting Proportions for Structural
Lightweight Concrete. (ACI 211.2-98)" Farmington Hills, MI: American Concrete Institute.
Anderson, A. R. (1960). "Composite Designs in Precast and Cast-in-Place Concrete,"
Progressive Architecture, Vol. 41, No. 9, pp. 172-179.
ASTM A370 (2012a)." Standard Test Methods and Definitions for Mechanical Testing of Steel
Products" Annual book of ASTM standards, ASTM, West Conshohocken, Pennsylvania.
ASTM A615 (2012)." Standard Specification for Deformed and Plain Carbon-Steel Bars for
Concrete Reinforcement" Annual book of ASTM standards, ASTM, West Conshohocken,
Pennsylvania.
ASTM C29 (2009). "Standard Test Method for Bulk Density (Unit Weight) and Voids in
Aggregate" Annual book of ASTM standards, ASTM, West Conshohocken, Pennsylvania.
ASTM C127 (2012). "Standard Test Method for Density, Relative Density (Specific Gravity),
and Absorption of Coarse Aggregate." Annual book of ASTM standards, ASTM, West
Conshohocken, Pennsylvania.
ASTM C128 (2012). "Standard Test Method for Density, Relative Density (Specific Gravity),
and Absorption of Fine Aggregate." Annual book of ASTM standards, ASTM, West
Conshohocken, Pennsylvania.
ASTM C136 (2006). "Standard Test Method for Sieve Analysis of Fine and Coarse
Aggregates."Annual book of ASTM standards, ASTM, West Conshohocken, Pennsylvania.
ASTM C138 (2012). "Standard Test Method for Density (Unit Weight), Yield, and Air Content
(Gravimetric) of Concrete." Annual book of ASTM standards, ASTM, West Conshohocken,
Pennsylvania.
ASTM Cl43 (2012). "Standard Test Method for Slump of Hydraulic-Cement Concrete." Annual
book of ASTM standards, ASTM, West Conshohocken, Pennsylvania.
98
ASTM Cl73 (2012). "Standard Test Method for Air Content of Freshly Mixed Concrete by the
Volumetric Method." Annual book of ASTM standards, ASTM, West Conshohocken,
Pennsylvania.
ASTM C192 (2012). "Standard Practice for Making and Curing Concrete Test Specimens in the
Laboratory." Annual book of ASTM standards, ASTM, West Conshohocken, Pennsylvania.
ASTM C231 (2010). "Standard Test Method for Air Content of Freshly Mixed Concrete by the
Pressure Method." Annual book of ASTM standards, ASTM, West Conshohocken,
Pennsylvania.
ASTM C330 (ASTM C330 (2009). "Standard Specification for Lightweight Aggregates for
Structural Concrete." Annual book of ASTM standards, ASTM, West Conshohocken,
Pennsylvania.
ASTM C469 (2010). "Standard Test Method for Static Modulus of Elasticity and Poisson's
Ratio of Concrete in Compression." Annual book of ASTM standards, ASTM, West
Conshohocken, Pennsylvania.
ASTM C494 (2012). "Standard Specification for Chemical Admixtures for Concrete." Annual
book of ASTM standards, ASTM, West Conshohocken, Pennsylvania.
ASTM C496 (2011). "Standard Test Method for Splitting Tensile Strength of Cylindrical
Concrete Specimens." Annual book of ASTM standards, ASTM, West Conshohocken,
Pennsylvania.
ASTM C1231 (2012). "Standard Practice for Use of Unbonded Caps in Determination of
Compressive Strength of Concrete Cylinders." Annual book of ASTM standards, ASTM, West
Conshohocken, Pennsylvania.
Bass, R.A., Carrasquillo, R.L. , and J.O. Jirsa. (1989). “Shear Transfer Across New and Existing
Concrete Interfaces,” ACI Structural Journal, Vol. 84, No. 4, pp. 383-393.
Birkeland, H. W. (1968) “Class Notes for Course on "Precast and Prestressed Concrete,"
University of British Columbia, Spring 1968.
Birkeland, P.W. and Birkeland, H.W. (1966). “Connections in Precast Concrete Construction,”
ACI Journal, Proceedings, Vol. 63, No. 3, pp. 345-368.
Hanson, N.W. (1960). “Precast-Prestressed Concrete Bridges 2: Horizontal Shear Connections,”
PCA – Journal of the Research and Development Division, Vol. 2, No. 2, pp. 38-58.
Harries, K.A., Zeno, G., and Shahrooz, B. (2012). “Toward an Improved Understanding of
Shear-Friction Behavior,” ACI Structural Journal, Vol. 109, No. 6, pp. 835-844
99
Hofbeck, J. A.; Ibrahim, I. O.; and Mattock, A. H. (1969). "Shear Transfer in Reinforced
Concrete," ACI Journal, Proceedings, V. 66, No. 2, pp. 119-128.
Hoff, G.C. (1992). “High Strength Lightweight Aggregate Concrete for Arctic Applications--Part
3: Structural Parameters”, American Concrete Institute, SP-136, pp. 175-246.
Hsu, Thomas T.C., Mau, S.T., and Chen, B. (1987). “Theory of Shear Transfer Strength of
Reinforced Concrete,” ACI Structural Journal, Vol. 84, No. 2, pp. 149-160.
Ivey and Buth. (1967) "Shear Capacity of Lightweight Concrete Beams." ACI Journal,
Proceedings, Vol. 64, No. 10. pp. 634-43.
Kahn, L.F. and Mitchell, A.D. (2002). “Shear Friction Tests with High-Strength Concrete,” ACI
Structural Journal, Vol. 99, No. 1, pp. 98-103.
Loov, R.E. and Patnaik, A.K. (1994). “Horizontal Shear Strength of Composite Beams with a
Rough Interface,” PCI Journal, Vol. 39, No. 1, pp. 48-58.
Mansur, M.T., Vinayagam, T., and Tan, K-H. (2008). “Shear Transfer Across a Crack in
Reinforced High-Strength Concrete,” ASCE Journal of Materials in
Civil Engineering, Vol. 20, No. 4, pp. 294-302.
Mast, R.F. (1968). “Auxiliary Reinforcement in Concrete Connections”, ASCE Journal of the
Structural Division Proceedings, Vol. 94, No. ST6, pp. 1485-1504
Mattock, A. H., W. K. Li, and T. C. Wang. (1976). "Shear Transfer in Lightweight Reinforced
Concrete." PCI Journal, Vol. 21, No. 1, pp. 20-39.
Mattock, A.H. (1976). “Shear Transfer Under Monotonic Loading Across and Interface Between
Concretes Cast at Different Times”, University of Washington Department of Civil Engineering
Report SM 76-3.
Mattock, A.H. (2001). “Shear Friction and High-Strength Concrete”, ACI Structural Journal,
Vol. 98, No. 1, pp. 50-59.
Mattock, A. H., Johal, L, and Chow, C. H. (1975). “Shear Transfer in Reinforced Concrete with
Moment or Tension Acting Across the Shear Plane.” PCI Journal, Vol. 20,
No. 4, pp. 76-93.
Mattock, A.H. and Hawkins, N.M. (1972). “Shear Transfer in Reinforced Concrete – Recent
Research,” PCI Journal, Vol. 17, No. 2, pp. 55-75.
Nagle, T.J. and Kuchma, D.A. (2007). “Nontraditional Limitations on the Shear Capacity of
Prestressed Concrete Girders” University of Illinois at Urbana-Champaign NSEL Report-003.
100
Paulay, T., Park, R., and Phillips, M.H. (1974). “Horizontal Construction Joints In Cast-In-Place
Reinforced Concrete,” American Concrete Institute, SP-42, pp. 599-616.
Precast/Prestressed Concrete Institute (1992). PCI Design Handbook: Precast and Prestressed
Concrete Institute. 4th ed. Chicago: Precast/Prestressed Concrete Institute.
Precast/Prestressed Concrete Institute (1999). PCI Design Handbook: Precast and Prestressed
Concrete Institute. 5th ed. Chicago: Precast/Prestressed Concrete Institute.
Precast/Prestressed Concrete Institute (2004). PCI Design Handbook: Precast and Prestressed
Concrete Institute. 6th ed. Chicago: Precast/Prestressed Concrete Institute.
Precast/Prestressed Concrete Institute (2010). PCI Design Handbook: Precast and Prestressed
Concrete Institute. 7th ed. Chicago: Precast/Prestressed Concrete Institute.
PCI Committee on Connection Details (1973). PCI Manual on Design of Connections for
Precast Prestressed Concrete, Prestressed Concrete Institute, Chicago, pp. 22.
Rahal, Khaldoun N. (2010). “Shear Transfer Strength of Reinforced Concrete.” ACI Structural
Journal, Vol. 107, No.4, pp. 419-426.
Raths, C. H. (1977). “Reader Comments: Design Proposals for Reinforced Concrete Corbels.”
PCI Journal, Vol. 21, No. 3, pp. 93–98.
Saemann, J. and Washa, G.W. (1964). “Horizontal Shear Connections Between Precast Beams
and Cast-In Place Slabs,” ACI Journal, Proceedings, Vol 61, No. 11, pp. 1383-1408.
Scott, J. (2010) “Interface Shear Strength in Lightweight Concrete Bridge Girders.” MS Thesis.
Virginia Polytechnic Institute.
Shaikh, F.A. (1978). "Proposed Revisions to Shear Friction Provisions." PCI Journal, Vol. 23,
No. 2, pp. 12-21.
Tanner, J.A. (2008). "Calculating Shear Friction Using Effective Coefficient of Friction." PCI
Journal, Vol. 53, No. 3, pp. 114-20.
Walraven, J. C.; Frenay, J.; and Pruijssers, A. (1987). "Influence of Concrete Strength and Load
History on the Shear Friction Capacity of Concrete Members," PCI Journal, Vol. 32, No. 1, pp.
66-84.
Walraven, J. and Stroband, J. (1994). “Shear Friction in High-Strength Concrete”, American
Concrete Institute, SP-42, pp. 311-330.
101
ACKNOWLEDGMENTS
This research was conducted with the sponsorship of the Precast/Prestressed Concrete Institute
(PCI) and the National University Transportation Center (NUTC) at the Missouri University of
Science and Technology. Lightweight aggregates were donated by Buildex, Inc. Longitudinal
reinforcing steel bars used in this work were provided by Ambassador Steel Corporation. The
authors wish to thank Neil Anderson of CRSI, Roger Becker of PCI, Harry Gleich of Metromont
Precast, Dr. Neil Hawkins, Dr. Donald Meinheit of Wiss, Janney, Elstner, and Dr. Larbi Sennour
of Consulting Engineering Group, Inc. who served as advisors to this project; their assistance and
input are greatly appreciated. Additionally, the authors gratefully acknowledge the assistance
provided by Metromont Precast and Coreslab Structures.
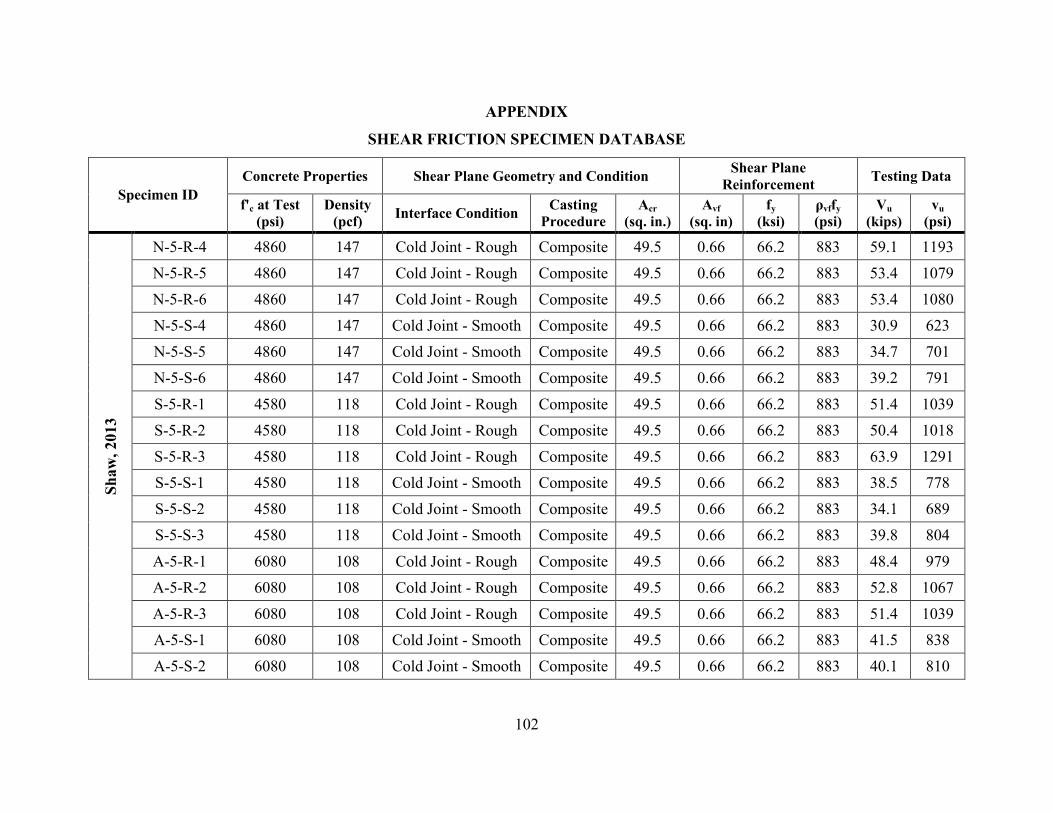
102
APPENDIX
SHEAR FRICTION SPECIMEN DATABASE
Specimen ID
Concrete Properties Shear Plane Geometry and Condition Shear Plane
Reinforcement Testing Data
f'c at Test
(psi)
Density
(pcf) Interface Condition
Casting
Procedure
Acr
(sq. in.)
Avf
(sq. in)
fy
(ksi)
ρvffy
(psi)
Vu
(kips)
vu
(psi)
Sh
aw
, 2013
N-5-R-4 4860 147 Cold Joint - Rough Composite 49.5 0.66 66.2 883 59.1 1193
N-5-R-5 4860 147 Cold Joint - Rough Composite 49.5 0.66 66.2 883 53.4 1079
N-5-R-6 4860 147 Cold Joint - Rough Composite 49.5 0.66 66.2 883 53.4 1080
N-5-S-4 4860 147 Cold Joint - Smooth Composite 49.5 0.66 66.2 883 30.9 623
N-5-S-5 4860 147 Cold Joint - Smooth Composite 49.5 0.66 66.2 883 34.7 701
N-5-S-6 4860 147 Cold Joint - Smooth Composite 49.5 0.66 66.2 883 39.2 791
S-5-R-1 4580 118 Cold Joint - Rough Composite 49.5 0.66 66.2 883 51.4 1039
S-5-R-2 4580 118 Cold Joint - Rough Composite 49.5 0.66 66.2 883 50.4 1018
S-5-R-3 4580 118 Cold Joint - Rough Composite 49.5 0.66 66.2 883 63.9 1291
S-5-S-1 4580 118 Cold Joint - Smooth Composite 49.5 0.66 66.2 883 38.5 778
S-5-S-2 4580 118 Cold Joint - Smooth Composite 49.5 0.66 66.2 883 34.1 689
S-5-S-3 4580 118 Cold Joint - Smooth Composite 49.5 0.66 66.2 883 39.8 804
A-5-R-1 6080 108 Cold Joint - Rough Composite 49.5 0.66 66.2 883 48.4 979
A-5-R-2 6080 108 Cold Joint - Rough Composite 49.5 0.66 66.2 883 52.8 1067
A-5-R-3 6080 108 Cold Joint - Rough Composite 49.5 0.66 66.2 883 51.4 1039
A-5-S-1 6080 108 Cold Joint - Smooth Composite 49.5 0.66 66.2 883 41.5 838
A-5-S-2 6080 108 Cold Joint - Smooth Composite 49.5 0.66 66.2 883 40.1 810
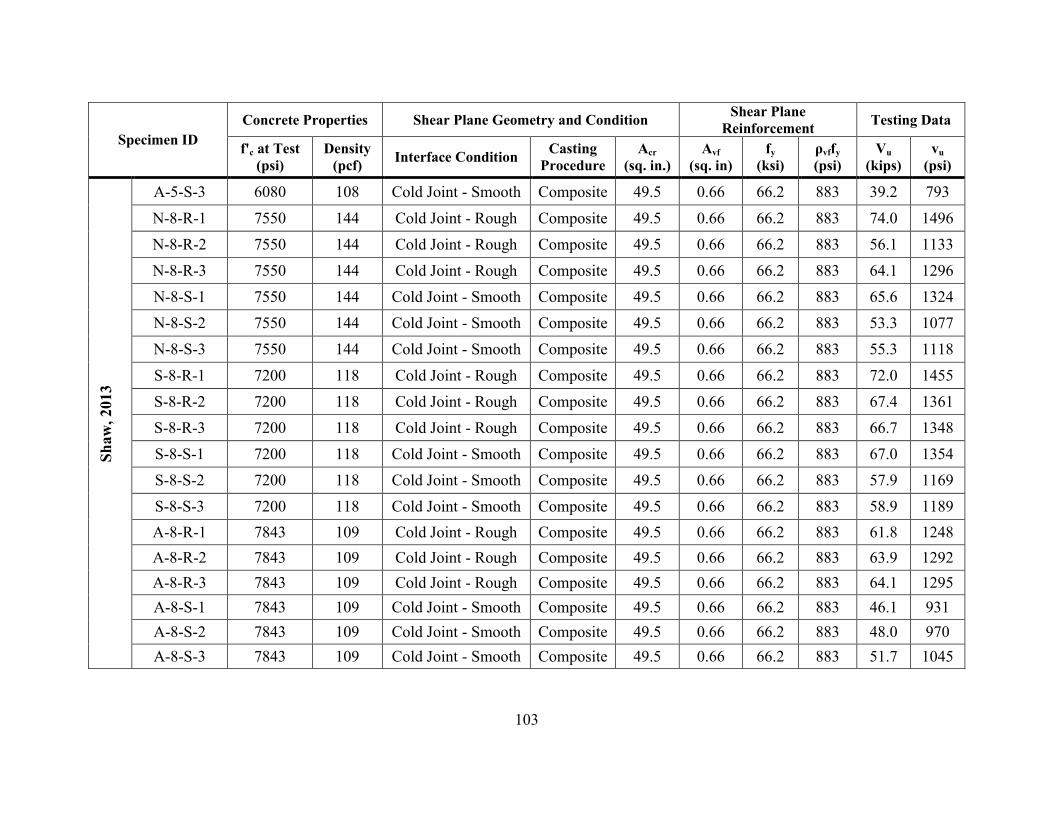
103
Specimen ID
Concrete Properties Shear Plane Geometry and Condition Shear Plane
Reinforcement Testing Data
f'c at Test
(psi)
Density
(pcf) Interface Condition
Casting
Procedure
Acr
(sq. in.)
Avf
(sq. in)
fy
(ksi)
ρvffy
(psi)
Vu
(kips)
vu
(psi)
Sh
aw
, 2013
A-5-S-3 6080 108 Cold Joint - Smooth Composite 49.5 0.66 66.2 883 39.2 793
N-8-R-1 7550 144 Cold Joint - Rough Composite 49.5 0.66 66.2 883 74.0 1496
N-8-R-2 7550 144 Cold Joint - Rough Composite 49.5 0.66 66.2 883 56.1 1133
N-8-R-3 7550 144 Cold Joint - Rough Composite 49.5 0.66 66.2 883 64.1 1296
N-8-S-1 7550 144 Cold Joint - Smooth Composite 49.5 0.66 66.2 883 65.6 1324
N-8-S-2 7550 144 Cold Joint - Smooth Composite 49.5 0.66 66.2 883 53.3 1077
N-8-S-3 7550 144 Cold Joint - Smooth Composite 49.5 0.66 66.2 883 55.3 1118
S-8-R-1 7200 118 Cold Joint - Rough Composite 49.5 0.66 66.2 883 72.0 1455
S-8-R-2 7200 118 Cold Joint - Rough Composite 49.5 0.66 66.2 883 67.4 1361
S-8-R-3 7200 118 Cold Joint - Rough Composite 49.5 0.66 66.2 883 66.7 1348
S-8-S-1 7200 118 Cold Joint - Smooth Composite 49.5 0.66 66.2 883 67.0 1354
S-8-S-2 7200 118 Cold Joint - Smooth Composite 49.5 0.66 66.2 883 57.9 1169
S-8-S-3 7200 118 Cold Joint - Smooth Composite 49.5 0.66 66.2 883 58.9 1189
A-8-R-1 7843 109 Cold Joint - Rough Composite 49.5 0.66 66.2 883 61.8 1248
A-8-R-2 7843 109 Cold Joint - Rough Composite 49.5 0.66 66.2 883 63.9 1292
A-8-R-3 7843 109 Cold Joint - Rough Composite 49.5 0.66 66.2 883 64.1 1295
A-8-S-1 7843 109 Cold Joint - Smooth Composite 49.5 0.66 66.2 883 46.1 931
A-8-S-2 7843 109 Cold Joint - Smooth Composite 49.5 0.66 66.2 883 48.0 970
A-8-S-3 7843 109 Cold Joint - Smooth Composite 49.5 0.66 66.2 883 51.7 1045
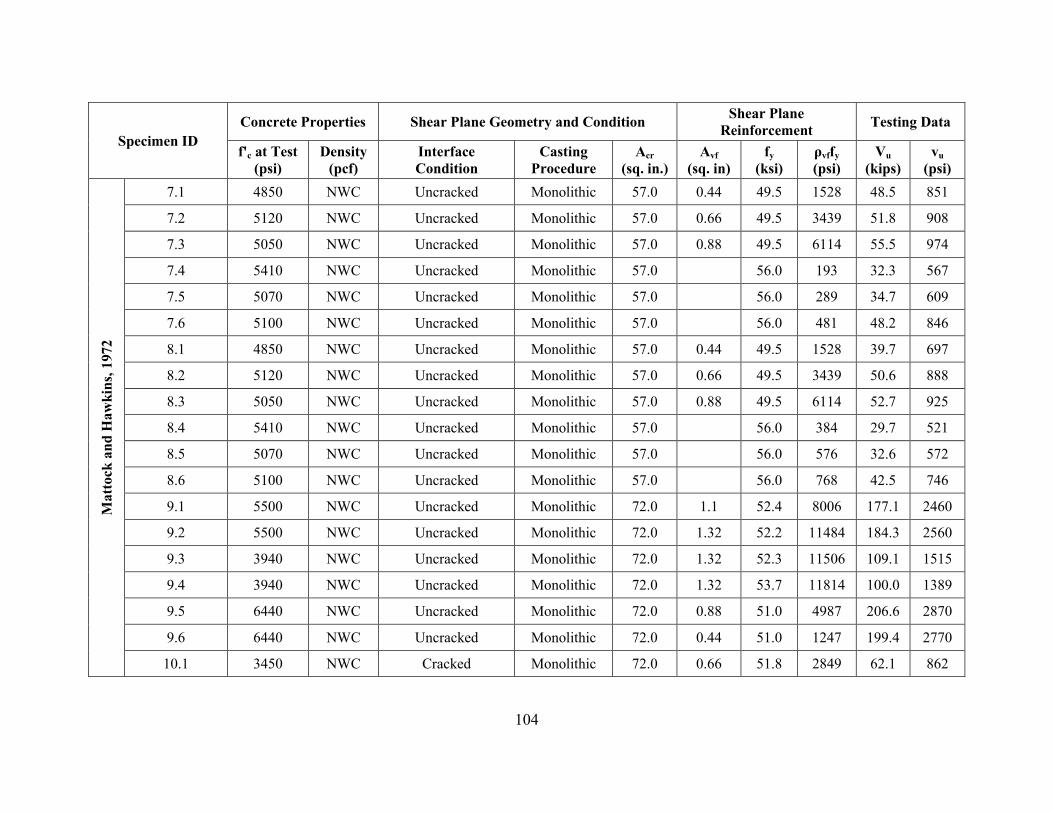
104
Specimen ID
Concrete Properties Shear Plane Geometry and Condition Shear Plane
Reinforcement Testing Data
f'c at Test
(psi)
Density
(pcf)
Interface
Condition
Casting
Procedure
Acr
(sq. in.)
Avf
(sq. in)
fy
(ksi)
ρvffy
(psi)
Vu
(kips)
vu
(psi)
Ma
tto
ck a
nd
Haw
kin
s, 1
972
7.1 4850 NWC Uncracked Monolithic 57.0 0.44 49.5 1528 48.5 851
7.2 5120 NWC Uncracked Monolithic 57.0 0.66 49.5 3439 51.8 908
7.3 5050 NWC Uncracked Monolithic 57.0 0.88 49.5 6114 55.5 974
7.4 5410 NWC Uncracked Monolithic 57.0 56.0 193 32.3 567
7.5 5070 NWC Uncracked Monolithic 57.0 56.0 289 34.7 609
7.6 5100 NWC Uncracked Monolithic 57.0 56.0 481 48.2 846
8.1 4850 NWC Uncracked Monolithic 57.0 0.44 49.5 1528 39.7 697
8.2 5120 NWC Uncracked Monolithic 57.0 0.66 49.5 3439 50.6 888
8.3 5050 NWC Uncracked Monolithic 57.0 0.88 49.5 6114 52.7 925
8.4 5410 NWC Uncracked Monolithic 57.0 56.0 384 29.7 521
8.5 5070 NWC Uncracked Monolithic 57.0 56.0 576 32.6 572
8.6 5100 NWC Uncracked Monolithic 57.0 56.0 768 42.5 746
9.1 5500 NWC Uncracked Monolithic 72.0 1.1 52.4 8006 177.1 2460
9.2 5500 NWC Uncracked Monolithic 72.0 1.32 52.2 11484 184.3 2560
9.3 3940 NWC Uncracked Monolithic 72.0 1.32 52.3 11506 109.1 1515
9.4 3940 NWC Uncracked Monolithic 72.0 1.32 53.7 11814 100.0 1389
9.5 6440 NWC Uncracked Monolithic 72.0 0.88 51.0 4987 206.6 2870
9.6 6440 NWC Uncracked Monolithic 72.0 0.44 51.0 1247 199.4 2770
10.1 3450 NWC Cracked Monolithic 72.0 0.66 51.8 2849 62.1 862
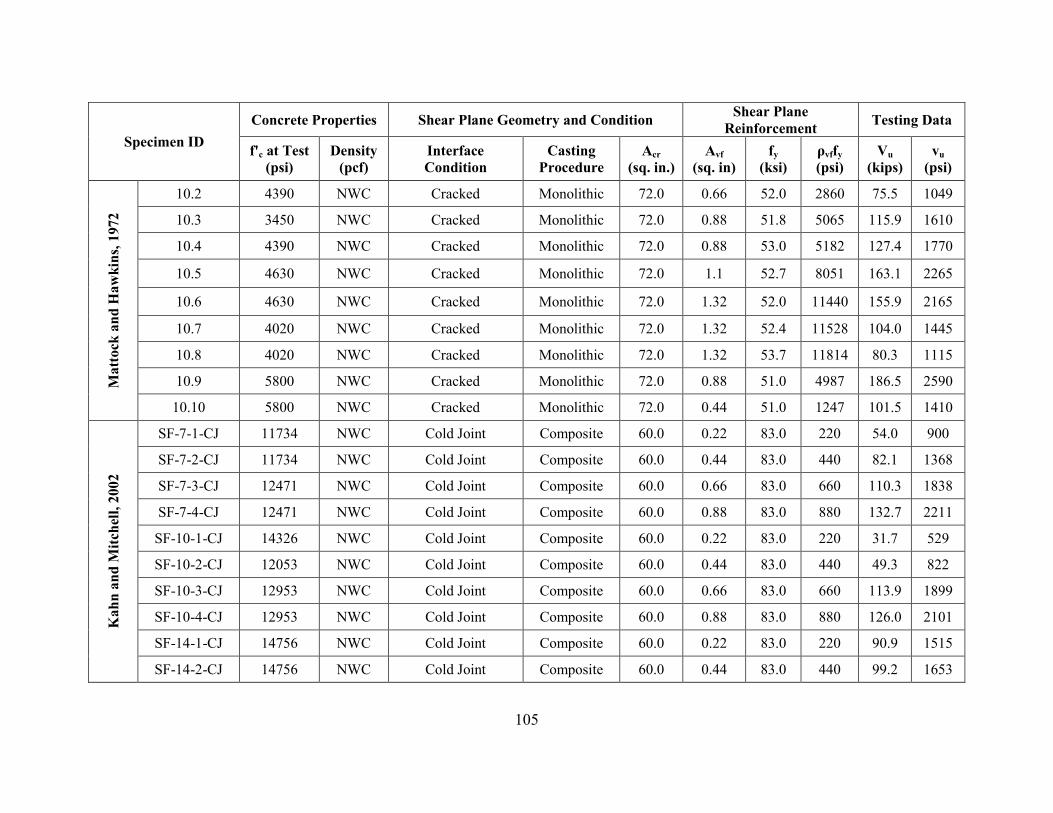
105
Specimen ID
Concrete Properties Shear Plane Geometry and Condition Shear Plane
Reinforcement Testing Data
f'c at Test
(psi)
Density
(pcf)
Interface
Condition
Casting
Procedure
Acr
(sq. in.)
Avf
(sq. in)
fy
(ksi)
ρvffy
(psi)
Vu
(kips)
vu
(psi)
Matt
ock
an
d H
aw
kin
s, 1
972
10.2 4390 NWC Cracked Monolithic 72.0 0.66 52.0 2860 75.5 1049
10.3 3450 NWC Cracked Monolithic 72.0 0.88 51.8 5065 115.9 1610
10.4 4390 NWC Cracked Monolithic 72.0 0.88 53.0 5182 127.4 1770
10.5 4630 NWC Cracked Monolithic 72.0 1.1 52.7 8051 163.1 2265
10.6 4630 NWC Cracked Monolithic 72.0 1.32 52.0 11440 155.9 2165
10.7 4020 NWC Cracked Monolithic 72.0 1.32 52.4 11528 104.0 1445
10.8 4020 NWC Cracked Monolithic 72.0 1.32 53.7 11814 80.3 1115
10.9 5800 NWC Cracked Monolithic 72.0 0.88 51.0 4987 186.5 2590
10.10 5800 NWC Cracked Monolithic 72.0 0.44 51.0 1247 101.5 1410
Ka
hn
an
d M
itch
ell,
20
02
SF-7-1-CJ 11734 NWC Cold Joint Composite 60.0 0.22 83.0 220 54.0 900
SF-7-2-CJ 11734 NWC Cold Joint Composite 60.0 0.44 83.0 440 82.1 1368
SF-7-3-CJ 12471 NWC Cold Joint Composite 60.0 0.66 83.0 660 110.3 1838
SF-7-4-CJ 12471 NWC Cold Joint Composite 60.0 0.88 83.0 880 132.7 2211
SF-10-1-CJ 14326 NWC Cold Joint Composite 60.0 0.22 83.0 220 31.7 529
SF-10-2-CJ 12053 NWC Cold Joint Composite 60.0 0.44 83.0 440 49.3 822
SF-10-3-CJ 12953 NWC Cold Joint Composite 60.0 0.66 83.0 660 113.9 1899
SF-10-4-CJ 12953 NWC Cold Joint Composite 60.0 0.88 83.0 880 126.0 2101
SF-14-1-CJ 14756 NWC Cold Joint Composite 60.0 0.22 83.0 220 90.9 1515
SF-14-2-CJ 14756 NWC Cold Joint Composite 60.0 0.44 83.0 440 99.2 1653
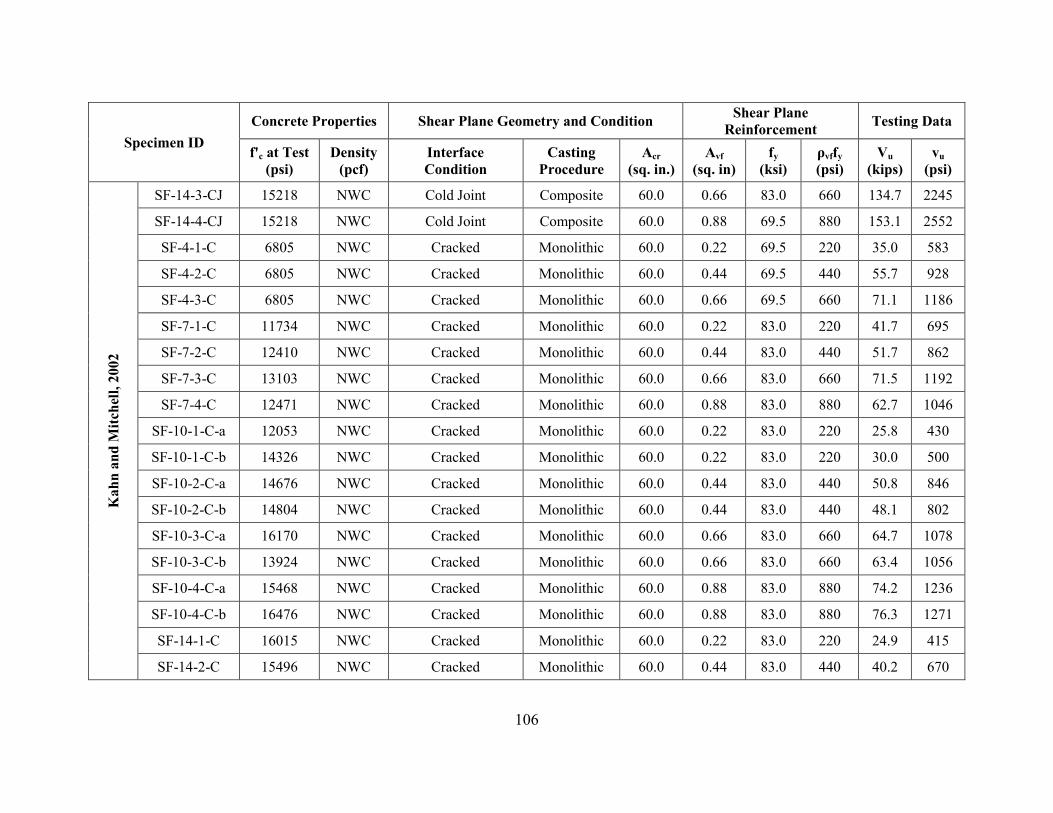
106
Specimen ID
Concrete Properties Shear Plane Geometry and Condition Shear Plane
Reinforcement Testing Data
f'c at Test
(psi)
Density
(pcf)
Interface
Condition
Casting
Procedure
Acr
(sq. in.)
Avf
(sq. in)
fy
(ksi)
ρvffy
(psi)
Vu
(kips)
vu
(psi)
Ka
hn
an
d M
itch
ell,
2002
SF-14-3-CJ 15218 NWC Cold Joint Composite 60.0 0.66 83.0 660 134.7 2245
SF-14-4-CJ 15218 NWC Cold Joint Composite 60.0 0.88 69.5 880 153.1 2552
SF-4-1-C 6805 NWC Cracked Monolithic 60.0 0.22 69.5 220 35.0 583
SF-4-2-C 6805 NWC Cracked Monolithic 60.0 0.44 69.5 440 55.7 928
SF-4-3-C 6805 NWC Cracked Monolithic 60.0 0.66 69.5 660 71.1 1186
SF-7-1-C 11734 NWC Cracked Monolithic 60.0 0.22 83.0 220 41.7 695
SF-7-2-C 12410 NWC Cracked Monolithic 60.0 0.44 83.0 440 51.7 862
SF-7-3-C 13103 NWC Cracked Monolithic 60.0 0.66 83.0 660 71.5 1192
SF-7-4-C 12471 NWC Cracked Monolithic 60.0 0.88 83.0 880 62.7 1046
SF-10-1-C-a 12053 NWC Cracked Monolithic 60.0 0.22 83.0 220 25.8 430
SF-10-1-C-b 14326 NWC Cracked Monolithic 60.0 0.22 83.0 220 30.0 500
SF-10-2-C-a 14676 NWC Cracked Monolithic 60.0 0.44 83.0 440 50.8 846
SF-10-2-C-b 14804 NWC Cracked Monolithic 60.0 0.44 83.0 440 48.1 802
SF-10-3-C-a 16170 NWC Cracked Monolithic 60.0 0.66 83.0 660 64.7 1078
SF-10-3-C-b 13924 NWC Cracked Monolithic 60.0 0.66 83.0 660 63.4 1056
SF-10-4-C-a 15468 NWC Cracked Monolithic 60.0 0.88 83.0 880 74.2 1236
SF-10-4-C-b 16476 NWC Cracked Monolithic 60.0 0.88 83.0 880 76.3 1271
SF-14-1-C 16015 NWC Cracked Monolithic 60.0 0.22 83.0 220 24.9 415
SF-14-2-C 15496 NWC Cracked Monolithic 60.0 0.44 83.0 440 40.2 670
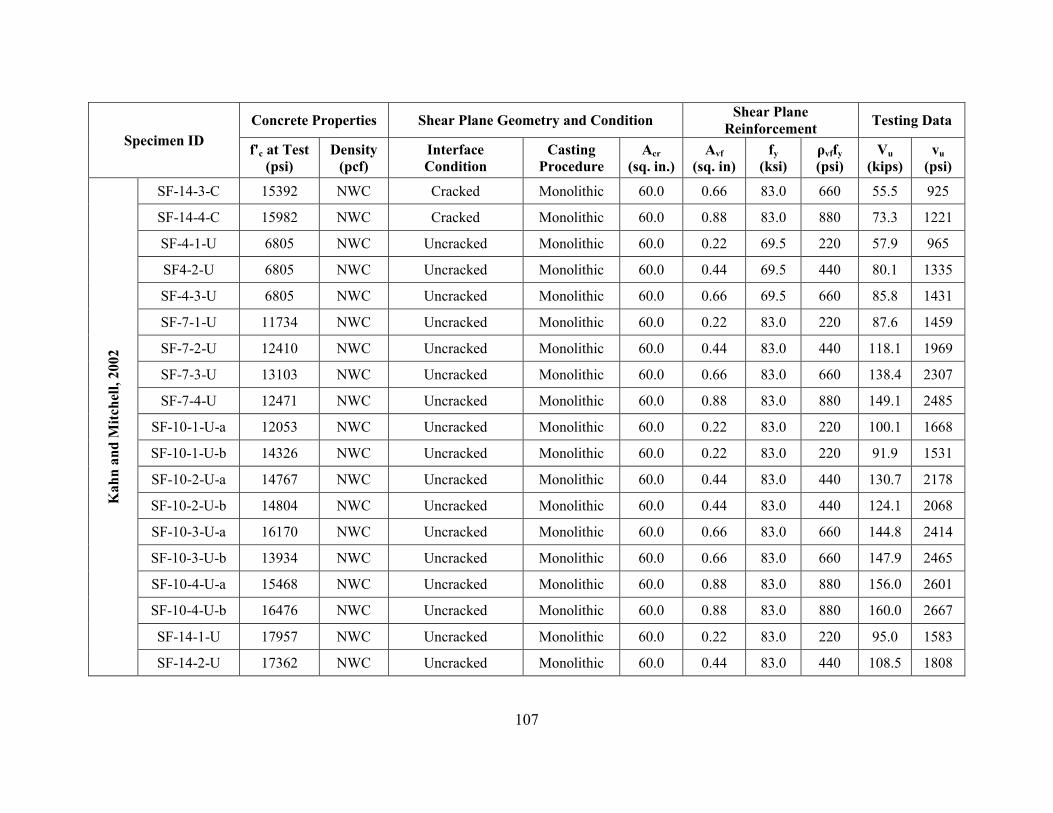
107
Specimen ID
Concrete Properties Shear Plane Geometry and Condition Shear Plane
Reinforcement Testing Data
f'c at Test
(psi)
Density
(pcf)
Interface
Condition
Casting
Procedure
Acr
(sq. in.)
Avf
(sq. in)
fy
(ksi)
ρvffy
(psi)
Vu
(kips)
vu
(psi)
Ka
hn
an
d M
itch
ell,
2002
SF-14-3-C 15392 NWC Cracked Monolithic 60.0 0.66 83.0 660 55.5 925
SF-14-4-C 15982 NWC Cracked Monolithic 60.0 0.88 83.0 880 73.3 1221
SF-4-1-U 6805 NWC Uncracked Monolithic 60.0 0.22 69.5 220 57.9 965
SF4-2-U 6805 NWC Uncracked Monolithic 60.0 0.44 69.5 440 80.1 1335
SF-4-3-U 6805 NWC Uncracked Monolithic 60.0 0.66 69.5 660 85.8 1431
SF-7-1-U 11734 NWC Uncracked Monolithic 60.0 0.22 83.0 220 87.6 1459
SF-7-2-U 12410 NWC Uncracked Monolithic 60.0 0.44 83.0 440 118.1 1969
SF-7-3-U 13103 NWC Uncracked Monolithic 60.0 0.66 83.0 660 138.4 2307
SF-7-4-U 12471 NWC Uncracked Monolithic 60.0 0.88 83.0 880 149.1 2485
SF-10-1-U-a 12053 NWC Uncracked Monolithic 60.0 0.22 83.0 220 100.1 1668
SF-10-1-U-b 14326 NWC Uncracked Monolithic 60.0 0.22 83.0 220 91.9 1531
SF-10-2-U-a 14767 NWC Uncracked Monolithic 60.0 0.44 83.0 440 130.7 2178
SF-10-2-U-b 14804 NWC Uncracked Monolithic 60.0 0.44 83.0 440 124.1 2068
SF-10-3-U-a 16170 NWC Uncracked Monolithic 60.0 0.66 83.0 660 144.8 2414
SF-10-3-U-b 13934 NWC Uncracked Monolithic 60.0 0.66 83.0 660 147.9 2465
SF-10-4-U-a 15468 NWC Uncracked Monolithic 60.0 0.88 83.0 880 156.0 2601
SF-10-4-U-b 16476 NWC Uncracked Monolithic 60.0 0.88 83.0 880 160.0 2667
SF-14-1-U 17957 NWC Uncracked Monolithic 60.0 0.22 83.0 220 95.0 1583
SF-14-2-U 17362 NWC Uncracked Monolithic 60.0 0.44 83.0 440 108.5 1808
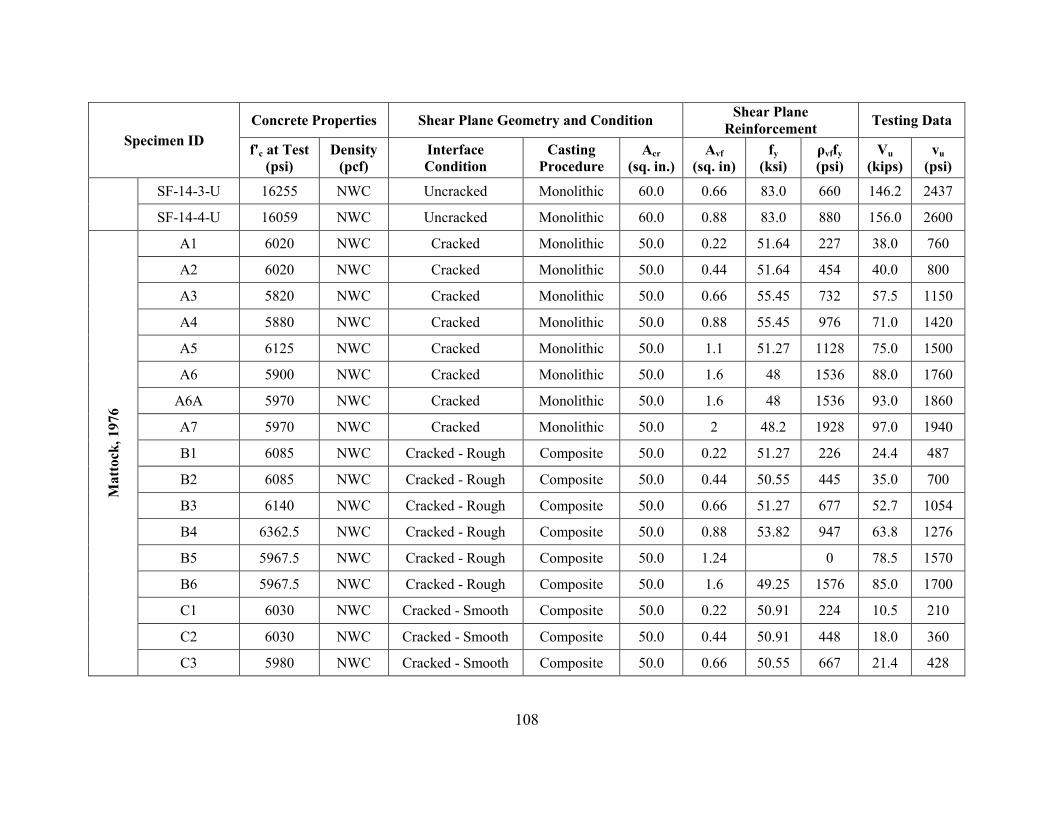
108
Specimen ID
Concrete Properties Shear Plane Geometry and Condition Shear Plane
Reinforcement Testing Data
f'c at Test
(psi)
Density
(pcf)
Interface
Condition
Casting
Procedure
Acr
(sq. in.)
Avf
(sq. in)
fy
(ksi)
ρvffy
(psi)
Vu
(kips)
vu
(psi)
SF-14-3-U 16255 NWC Uncracked Monolithic 60.0 0.66 83.0 660 146.2 2437
SF-14-4-U 16059 NWC Uncracked Monolithic 60.0 0.88 83.0 880 156.0 2600
Ma
ttock
, 1976
A1 6020 NWC Cracked Monolithic 50.0 0.22 51.64 227 38.0 760
A2 6020 NWC Cracked Monolithic 50.0 0.44 51.64 454 40.0 800
A3 5820 NWC Cracked Monolithic 50.0 0.66 55.45 732 57.5 1150
A4 5880 NWC Cracked Monolithic 50.0 0.88 55.45 976 71.0 1420
A5 6125 NWC Cracked Monolithic 50.0 1.1 51.27 1128 75.0 1500
A6 5900 NWC Cracked Monolithic 50.0 1.6 48 1536 88.0 1760
A6A 5970 NWC Cracked Monolithic 50.0 1.6 48 1536 93.0 1860
A7 5970 NWC Cracked Monolithic 50.0 2 48.2 1928 97.0 1940
B1 6085 NWC Cracked - Rough Composite 50.0 0.22 51.27 226 24.4 487
B2 6085 NWC Cracked - Rough Composite 50.0 0.44 50.55 445 35.0 700
B3 6140 NWC Cracked - Rough Composite 50.0 0.66 51.27 677 52.7 1054
B4 6362.5 NWC Cracked - Rough Composite 50.0 0.88 53.82 947 63.8 1276
B5 5967.5 NWC Cracked - Rough Composite 50.0 1.24 0 78.5 1570
B6 5967.5 NWC Cracked - Rough Composite 50.0 1.6 49.25 1576 85.0 1700
C1 6030 NWC Cracked - Smooth Composite 50.0 0.22 50.91 224 10.5 210
C2 6030 NWC Cracked - Smooth Composite 50.0 0.44 50.91 448 18.0 360
C3 5980 NWC Cracked - Smooth Composite 50.0 0.66 50.55 667 21.4 428
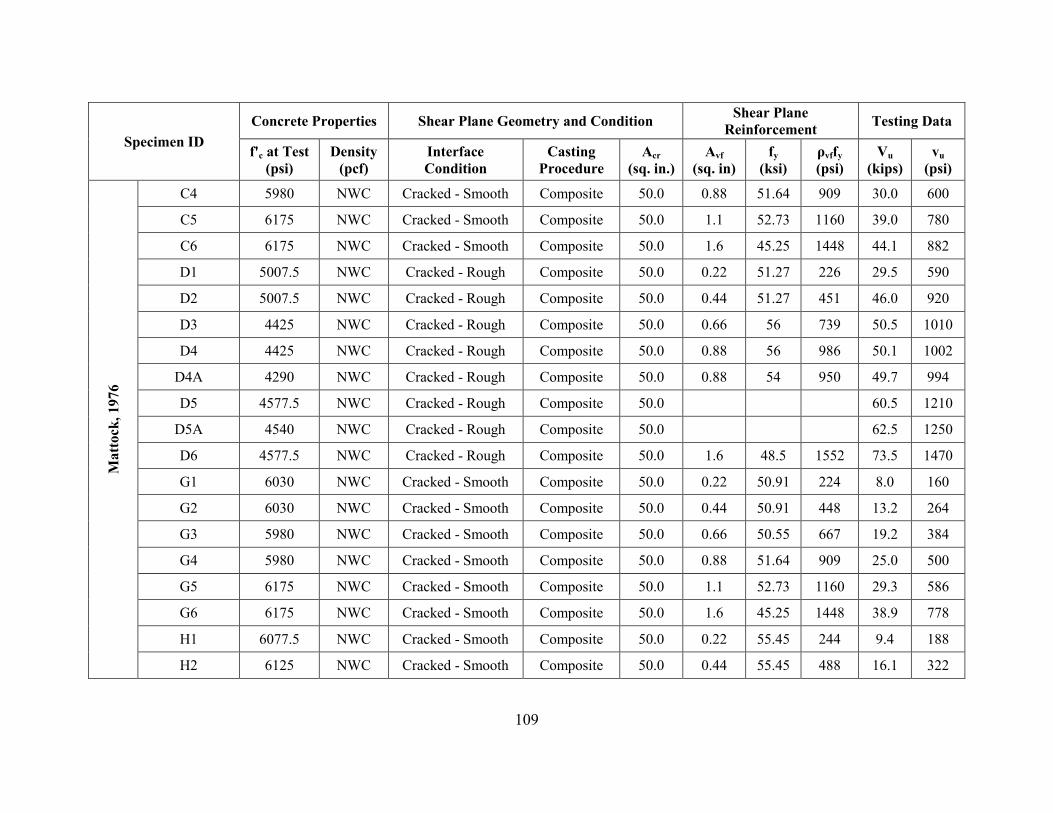
109
Specimen ID
Concrete Properties Shear Plane Geometry and Condition Shear Plane
Reinforcement Testing Data
f'c at Test
(psi)
Density
(pcf)
Interface
Condition
Casting
Procedure
Acr
(sq. in.)
Avf
(sq. in)
fy
(ksi)
ρvffy
(psi)
Vu
(kips)
vu
(psi)
Matt
ock
, 1976
C4 5980 NWC Cracked - Smooth Composite 50.0 0.88 51.64 909 30.0 600
C5 6175 NWC Cracked - Smooth Composite 50.0 1.1 52.73 1160 39.0 780
C6 6175 NWC Cracked - Smooth Composite 50.0 1.6 45.25 1448 44.1 882
D1 5007.5 NWC Cracked - Rough Composite 50.0 0.22 51.27 226 29.5 590
D2 5007.5 NWC Cracked - Rough Composite 50.0 0.44 51.27 451 46.0 920
D3 4425 NWC Cracked - Rough Composite 50.0 0.66 56 739 50.5 1010
D4 4425 NWC Cracked - Rough Composite 50.0 0.88 56 986 50.1 1002
D4A 4290 NWC Cracked - Rough Composite 50.0 0.88 54 950 49.7 994
D5 4577.5 NWC Cracked - Rough Composite 50.0 60.5 1210
D5A 4540 NWC Cracked - Rough Composite 50.0 62.5 1250
D6 4577.5 NWC Cracked - Rough Composite 50.0 1.6 48.5 1552 73.5 1470
G1 6030 NWC Cracked - Smooth Composite 50.0 0.22 50.91 224 8.0 160
G2 6030 NWC Cracked - Smooth Composite 50.0 0.44 50.91 448 13.2 264
G3 5980 NWC Cracked - Smooth Composite 50.0 0.66 50.55 667 19.2 384
G4 5980 NWC Cracked - Smooth Composite 50.0 0.88 51.64 909 25.0 500
G5 6175 NWC Cracked - Smooth Composite 50.0 1.1 52.73 1160 29.3 586
G6 6175 NWC Cracked - Smooth Composite 50.0 1.6 45.25 1448 38.9 778
H1 6077.5 NWC Cracked - Smooth Composite 50.0 0.22 55.45 244 9.4 188
H2 6125 NWC Cracked - Smooth Composite 50.0 0.44 55.45 488 16.1 322
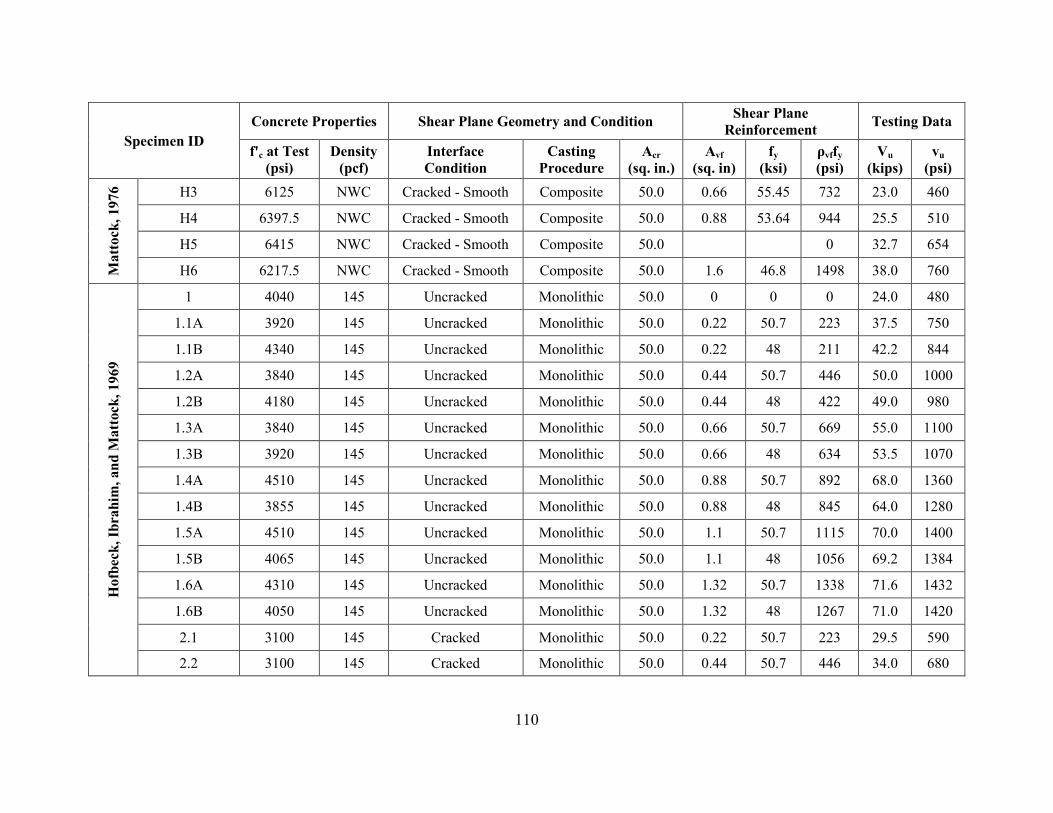
110
Specimen ID
Concrete Properties Shear Plane Geometry and Condition Shear Plane
Reinforcement Testing Data
f'c at Test
(psi)
Density
(pcf)
Interface
Condition
Casting
Procedure
Acr
(sq. in.)
Avf
(sq. in)
fy
(ksi)
ρvffy
(psi)
Vu
(kips)
vu
(psi)
Matt
ock
, 1976
H3 6125 NWC Cracked - Smooth Composite 50.0 0.66 55.45 732 23.0 460
H4 6397.5 NWC Cracked - Smooth Composite 50.0 0.88 53.64 944 25.5 510
H5 6415 NWC Cracked - Smooth Composite 50.0 0 32.7 654
H6 6217.5 NWC Cracked - Smooth Composite 50.0 1.6 46.8 1498 38.0 760
Ho
fbec
k, Ib
rah
im, an
d M
att
ock
, 1969
1 4040 145 Uncracked Monolithic 50.0 0 0 0 24.0 480
1.1A 3920 145 Uncracked Monolithic 50.0 0.22 50.7 223 37.5 750
1.1B 4340 145 Uncracked Monolithic 50.0 0.22 48 211 42.2 844
1.2A 3840 145 Uncracked Monolithic 50.0 0.44 50.7 446 50.0 1000
1.2B 4180 145 Uncracked Monolithic 50.0 0.44 48 422 49.0 980
1.3A 3840 145 Uncracked Monolithic 50.0 0.66 50.7 669 55.0 1100
1.3B 3920 145 Uncracked Monolithic 50.0 0.66 48 634 53.5 1070
1.4A 4510 145 Uncracked Monolithic 50.0 0.88 50.7 892 68.0 1360
1.4B 3855 145 Uncracked Monolithic 50.0 0.88 48 845 64.0 1280
1.5A 4510 145 Uncracked Monolithic 50.0 1.1 50.7 1115 70.0 1400
1.5B 4065 145 Uncracked Monolithic 50.0 1.1 48 1056 69.2 1384
1.6A 4310 145 Uncracked Monolithic 50.0 1.32 50.7 1338 71.6 1432
1.6B 4050 145 Uncracked Monolithic 50.0 1.32 48 1267 71.0 1420
2.1 3100 145 Cracked Monolithic 50.0 0.22 50.7 223 29.5 590
2.2 3100 145 Cracked Monolithic 50.0 0.44 50.7 446 34.0 680
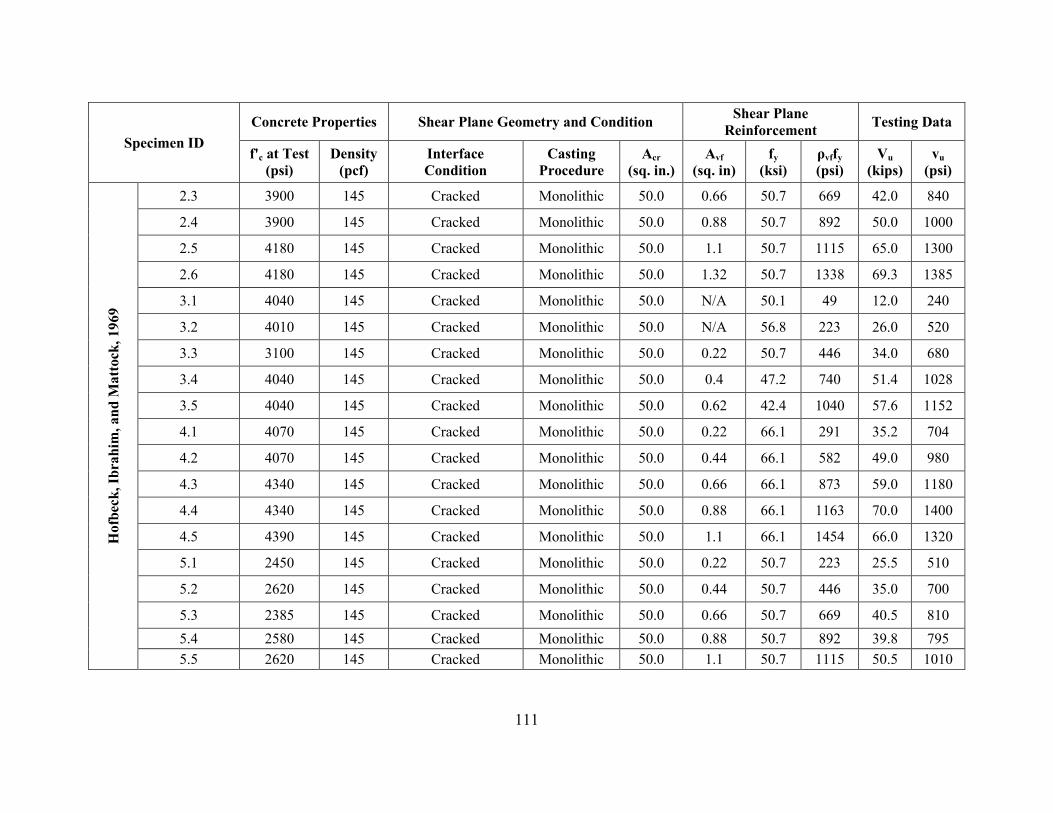
111
Specimen ID
Concrete Properties Shear Plane Geometry and Condition Shear Plane
Reinforcement Testing Data
f'c at Test
(psi)
Density
(pcf)
Interface
Condition
Casting
Procedure
Acr
(sq. in.)
Avf
(sq. in)
fy
(ksi)
ρvffy
(psi)
Vu
(kips)
vu
(psi)
Ho
fbec
k, Ib
rah
im,
an
d M
att
ock
, 1969
2.3 3900 145 Cracked Monolithic 50.0 0.66 50.7 669 42.0 840
2.4 3900 145 Cracked Monolithic 50.0 0.88 50.7 892 50.0 1000
2.5 4180 145 Cracked Monolithic 50.0 1.1 50.7 1115 65.0 1300
2.6 4180 145 Cracked Monolithic 50.0 1.32 50.7 1338 69.3 1385
3.1 4040 145 Cracked Monolithic 50.0 N/A 50.1 49 12.0 240
3.2 4010 145 Cracked Monolithic 50.0 N/A 56.8 223 26.0 520
3.3 3100 145 Cracked Monolithic 50.0 0.22 50.7 446 34.0 680
3.4 4040 145 Cracked Monolithic 50.0 0.4 47.2 740 51.4 1028
3.5 4040 145 Cracked Monolithic 50.0 0.62 42.4 1040 57.6 1152
4.1 4070 145 Cracked Monolithic 50.0 0.22 66.1 291 35.2 704
4.2 4070 145 Cracked Monolithic 50.0 0.44 66.1 582 49.0 980
4.3 4340 145 Cracked Monolithic 50.0 0.66 66.1 873 59.0 1180
4.4 4340 145 Cracked Monolithic 50.0 0.88 66.1 1163 70.0 1400
4.5 4390 145 Cracked Monolithic 50.0 1.1 66.1 1454 66.0 1320
5.1 2450 145 Cracked Monolithic 50.0 0.22 50.7 223 25.5 510
5.2 2620 145 Cracked Monolithic 50.0 0.44 50.7 446 35.0 700
5.3 2385 145 Cracked Monolithic 50.0 0.66 50.7 669 40.5 810
5.4 2580 145 Cracked Monolithic 50.0 0.88 50.7 892 39.8 795
5.5 2620 145 Cracked Monolithic 50.0 1.1 50.7 1115 50.5 1010
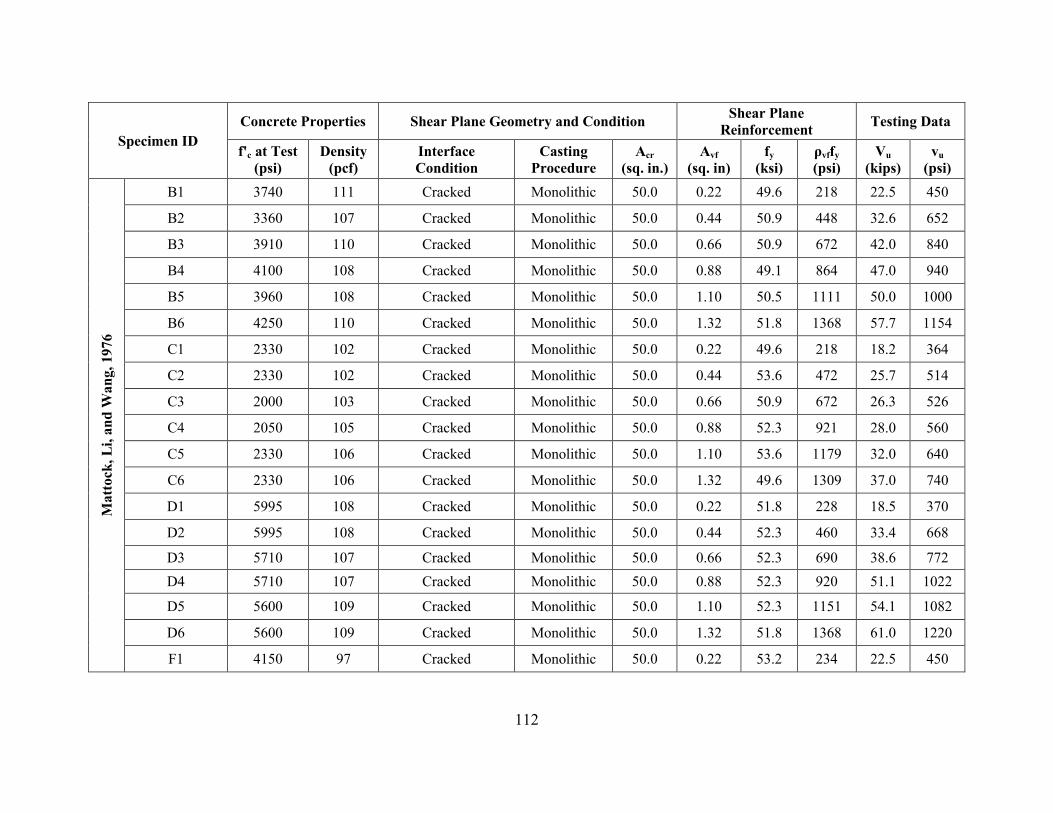
112
Specimen ID
Concrete Properties Shear Plane Geometry and Condition Shear Plane
Reinforcement Testing Data
f'c at Test
(psi)
Density
(pcf)
Interface
Condition
Casting
Procedure
Acr
(sq. in.)
Avf
(sq. in)
fy
(ksi)
ρvffy
(psi)
Vu
(kips)
vu
(psi)
Ma
tto
ck,
Li,
an
d W
an
g,
1976
B1 3740 111 Cracked Monolithic 50.0 0.22 49.6 218 22.5 450
B2 3360 107 Cracked Monolithic 50.0 0.44 50.9 448 32.6 652
B3 3910 110 Cracked Monolithic 50.0 0.66 50.9 672 42.0 840
B4 4100 108 Cracked Monolithic 50.0 0.88 49.1 864 47.0 940
B5 3960 108 Cracked Monolithic 50.0 1.10 50.5 1111 50.0 1000
B6 4250 110 Cracked Monolithic 50.0 1.32 51.8 1368 57.7 1154
C1 2330 102 Cracked Monolithic 50.0 0.22 49.6 218 18.2 364
C2 2330 102 Cracked Monolithic 50.0 0.44 53.6 472 25.7 514
C3 2000 103 Cracked Monolithic 50.0 0.66 50.9 672 26.3 526
C4 2050 105 Cracked Monolithic 50.0 0.88 52.3 921 28.0 560
C5 2330 106 Cracked Monolithic 50.0 1.10 53.6 1179 32.0 640
C6 2330 106 Cracked Monolithic 50.0 1.32 49.6 1309 37.0 740
D1 5995 108 Cracked Monolithic 50.0 0.22 51.8 228 18.5 370
D2 5995 108 Cracked Monolithic 50.0 0.44 52.3 460 33.4 668
D3 5710 107 Cracked Monolithic 50.0 0.66 52.3 690 38.6 772
D4 5710 107 Cracked Monolithic 50.0 0.88 52.3 920 51.1 1022
D5 5600 109 Cracked Monolithic 50.0 1.10 52.3 1151 54.1 1082
D6 5600 109 Cracked Monolithic 50.0 1.32 51.8 1368 61.0 1220
F1 4150 97 Cracked Monolithic 50.0 0.22 53.2 234 22.5 450
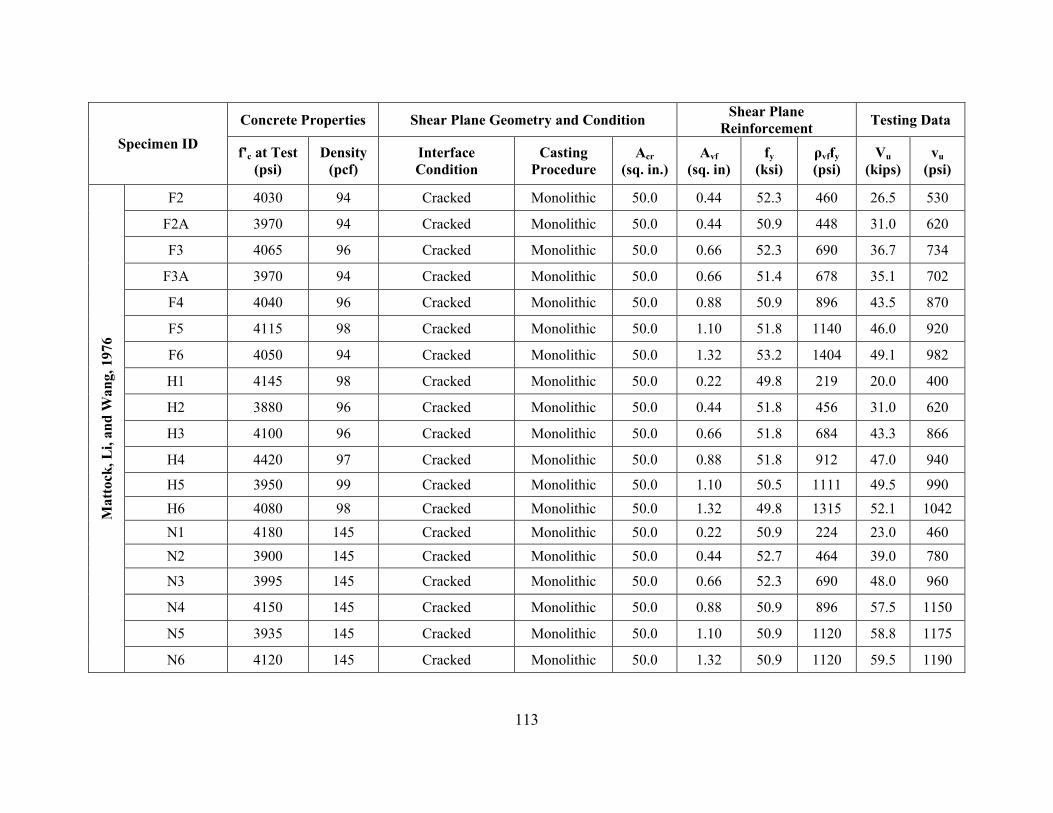
113
Specimen ID
Concrete Properties Shear Plane Geometry and Condition Shear Plane
Reinforcement Testing Data
f'c at Test
(psi)
Density
(pcf)
Interface
Condition
Casting
Procedure
Acr
(sq. in.)
Avf
(sq. in)
fy
(ksi)
ρvffy
(psi)
Vu
(kips)
vu
(psi)
Ma
tto
ck,
Li,
an
d W
an
g,
1976
F2 4030 94 Cracked Monolithic 50.0 0.44 52.3 460 26.5 530
F2A 3970 94 Cracked Monolithic 50.0 0.44 50.9 448 31.0 620
F3 4065 96 Cracked Monolithic 50.0 0.66 52.3 690 36.7 734
F3A 3970 94 Cracked Monolithic 50.0 0.66 51.4 678 35.1 702
F4 4040 96 Cracked Monolithic 50.0 0.88 50.9 896 43.5 870
F5 4115 98 Cracked Monolithic 50.0 1.10 51.8 1140 46.0 920
F6 4050 94 Cracked Monolithic 50.0 1.32 53.2 1404 49.1 982
H1 4145 98 Cracked Monolithic 50.0 0.22 49.8 219 20.0 400
H2 3880 96 Cracked Monolithic 50.0 0.44 51.8 456 31.0 620
H3 4100 96 Cracked Monolithic 50.0 0.66 51.8 684 43.3 866
H4 4420 97 Cracked Monolithic 50.0 0.88 51.8 912 47.0 940
H5 3950 99 Cracked Monolithic 50.0 1.10 50.5 1111 49.5 990
H6 4080 98 Cracked Monolithic 50.0 1.32 49.8 1315 52.1 1042
N1 4180 145 Cracked Monolithic 50.0 0.22 50.9 224 23.0 460
N2 3900 145 Cracked Monolithic 50.0 0.44 52.7 464 39.0 780
N3 3995 145 Cracked Monolithic 50.0 0.66 52.3 690 48.0 960
N4 4150 145 Cracked Monolithic 50.0 0.88 50.9 896 57.5 1150
N5 3935 145 Cracked Monolithic 50.0 1.10 50.9 1120 58.8 1175
N6 4120 145 Cracked Monolithic 50.0 1.32 50.9 1120 59.5 1190
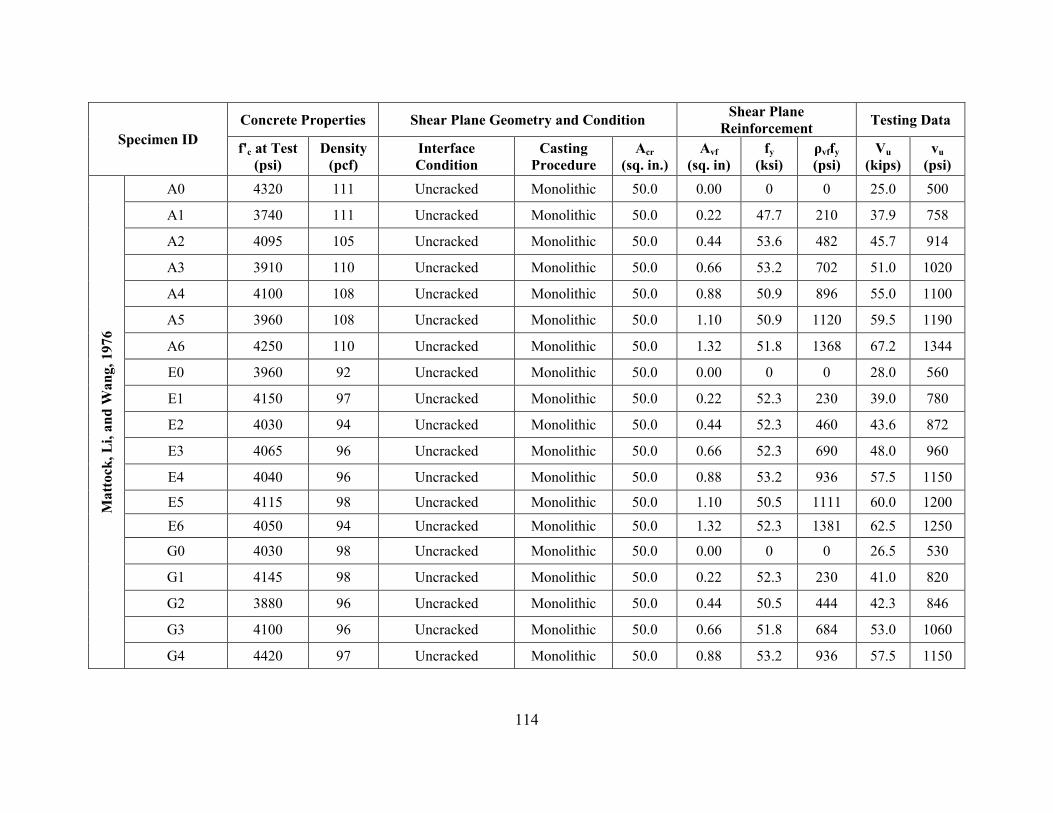
114
Specimen ID
Concrete Properties Shear Plane Geometry and Condition Shear Plane
Reinforcement Testing Data
f'c at Test
(psi)
Density
(pcf)
Interface
Condition
Casting
Procedure
Acr
(sq. in.)
Avf
(sq. in)
fy
(ksi)
ρvffy
(psi)
Vu
(kips)
vu
(psi)
Ma
tto
ck,
Li,
an
d W
an
g,
1976
A0 4320 111 Uncracked Monolithic 50.0 0.00 0 0 25.0 500
A1 3740 111 Uncracked Monolithic 50.0 0.22 47.7 210 37.9 758
A2 4095 105 Uncracked Monolithic 50.0 0.44 53.6 482 45.7 914
A3 3910 110 Uncracked Monolithic 50.0 0.66 53.2 702 51.0 1020
A4 4100 108 Uncracked Monolithic 50.0 0.88 50.9 896 55.0 1100
A5 3960 108 Uncracked Monolithic 50.0 1.10 50.9 1120 59.5 1190
A6 4250 110 Uncracked Monolithic 50.0 1.32 51.8 1368 67.2 1344
E0 3960 92 Uncracked Monolithic 50.0 0.00 0 0 28.0 560
E1 4150 97 Uncracked Monolithic 50.0 0.22 52.3 230 39.0 780
E2 4030 94 Uncracked Monolithic 50.0 0.44 52.3 460 43.6 872
E3 4065 96 Uncracked Monolithic 50.0 0.66 52.3 690 48.0 960
E4 4040 96 Uncracked Monolithic 50.0 0.88 53.2 936 57.5 1150
E5 4115 98 Uncracked Monolithic 50.0 1.10 50.5 1111 60.0 1200
E6 4050 94 Uncracked Monolithic 50.0 1.32 52.3 1381 62.5 1250
G0 4030 98 Uncracked Monolithic 50.0 0.00 0 0 26.5 530
G1 4145 98 Uncracked Monolithic 50.0 0.22 52.3 230 41.0 820
G2 3880 96 Uncracked Monolithic 50.0 0.44 50.5 444 42.3 846
G3 4100 96 Uncracked Monolithic 50.0 0.66 51.8 684 53.0 1060
G4 4420 97 Uncracked Monolithic 50.0 0.88 53.2 936 57.5 1150
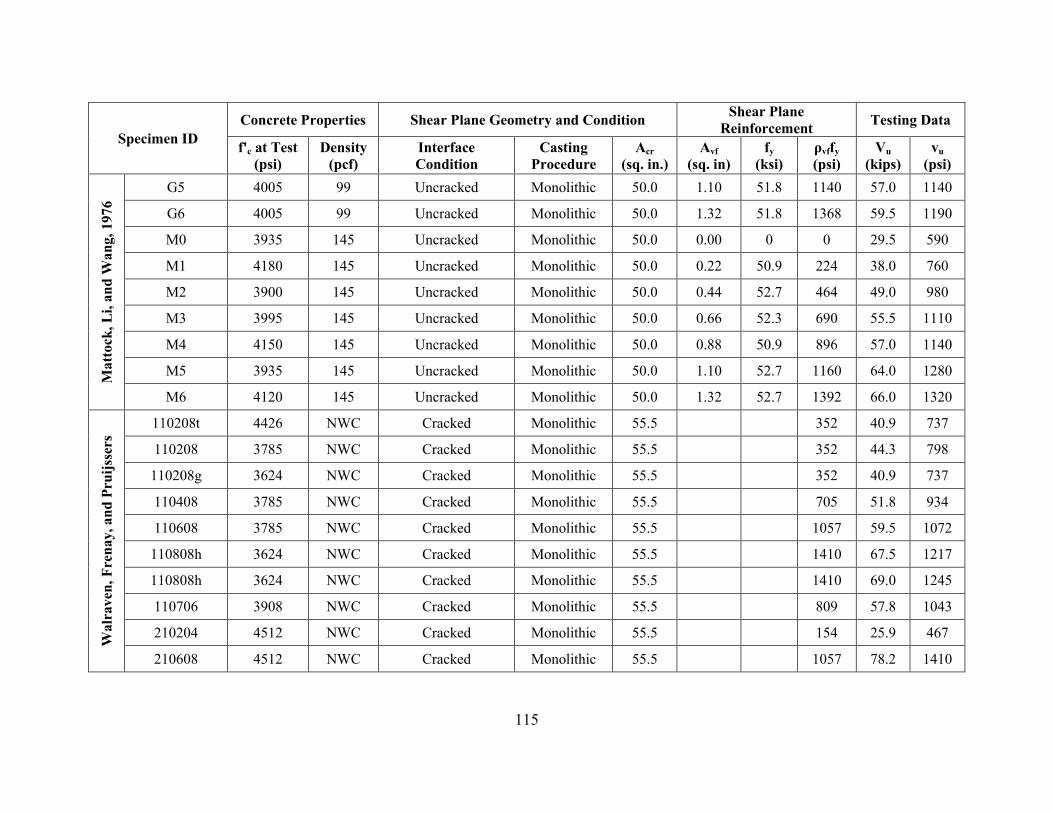
115
Specimen ID
Concrete Properties Shear Plane Geometry and Condition Shear Plane
Reinforcement Testing Data
f'c at Test
(psi)
Density
(pcf)
Interface
Condition
Casting
Procedure
Acr
(sq. in.)
Avf
(sq. in)
fy
(ksi)
ρvffy
(psi)
Vu
(kips)
vu
(psi)
Matt
ock
, L
i, a
nd
Wan
g,
1976
G5 4005 99 Uncracked Monolithic 50.0 1.10 51.8 1140 57.0 1140
G6 4005 99 Uncracked Monolithic 50.0 1.32 51.8 1368 59.5 1190
M0 3935 145 Uncracked Monolithic 50.0 0.00 0 0 29.5 590
M1 4180 145 Uncracked Monolithic 50.0 0.22 50.9 224 38.0 760
M2 3900 145 Uncracked Monolithic 50.0 0.44 52.7 464 49.0 980
M3 3995 145 Uncracked Monolithic 50.0 0.66 52.3 690 55.5 1110
M4 4150 145 Uncracked Monolithic 50.0 0.88 50.9 896 57.0 1140
M5 3935 145 Uncracked Monolithic 50.0 1.10 52.7 1160 64.0 1280
M6 4120 145 Uncracked Monolithic 50.0 1.32 52.7 1392 66.0 1320
Wa
lrav
en, F
ren
ay
, a
nd
Pru
ijss
ers
110208t 4426 NWC Cracked Monolithic 55.5 352 40.9 737
110208 3785 NWC Cracked Monolithic 55.5 352 44.3 798
110208g 3624 NWC Cracked Monolithic 55.5 352 40.9 737
110408 3785 NWC Cracked Monolithic 55.5 705 51.8 934
110608 3785 NWC Cracked Monolithic 55.5 1057 59.5 1072
110808h 3624 NWC Cracked Monolithic 55.5 1410 67.5 1217
110808h 3624 NWC Cracked Monolithic 55.5 1410 69.0 1245
110706 3908 NWC Cracked Monolithic 55.5 809 57.8 1043
210204 4512 NWC Cracked Monolithic 55.5 154 25.9 467
210608 4512 NWC Cracked Monolithic 55.5 1057 78.2 1410
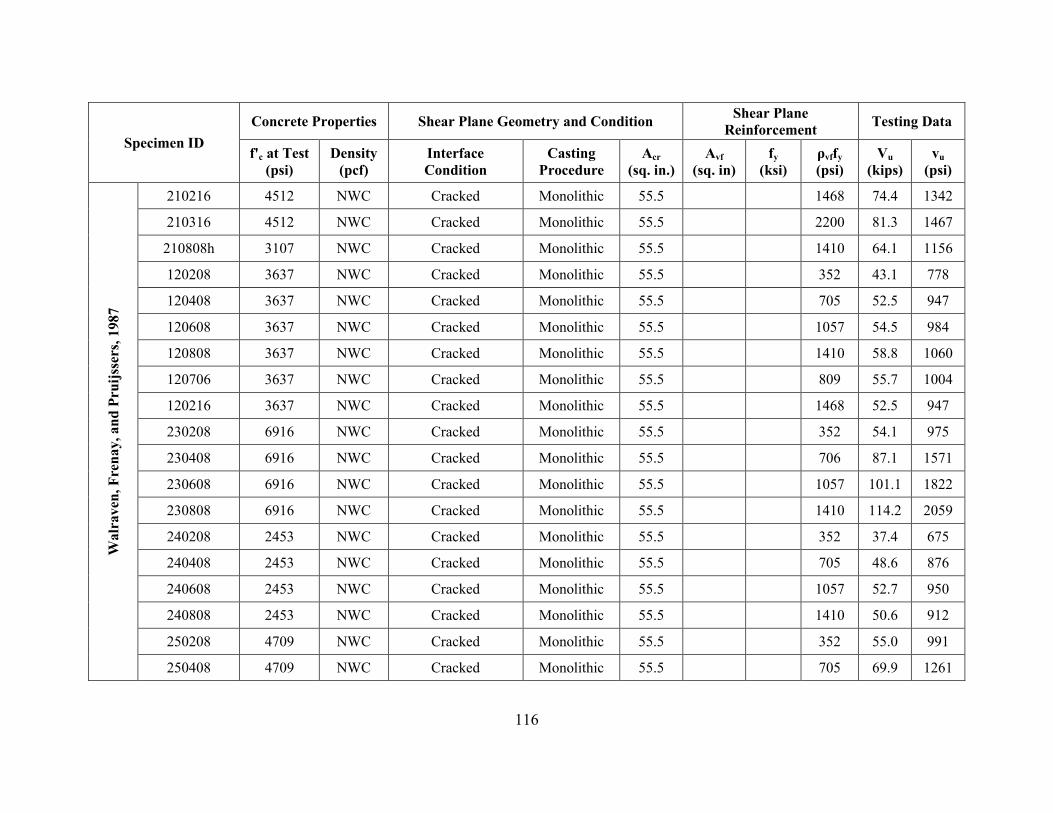
116
Specimen ID
Concrete Properties Shear Plane Geometry and Condition Shear Plane
Reinforcement Testing Data
f'c at Test
(psi)
Density
(pcf)
Interface
Condition
Casting
Procedure
Acr
(sq. in.)
Avf
(sq. in)
fy
(ksi)
ρvffy
(psi)
Vu
(kips)
vu
(psi)
Wa
lrav
en, F
ren
ay,
an
d P
ruij
sser
s, 1
987
210216 4512 NWC Cracked Monolithic 55.5 1468 74.4 1342
210316 4512 NWC Cracked Monolithic 55.5 2200 81.3 1467
210808h 3107 NWC Cracked Monolithic 55.5 1410 64.1 1156
120208 3637 NWC Cracked Monolithic 55.5 352 43.1 778
120408 3637 NWC Cracked Monolithic 55.5 705 52.5 947
120608 3637 NWC Cracked Monolithic 55.5 1057 54.5 984
120808 3637 NWC Cracked Monolithic 55.5 1410 58.8 1060
120706 3637 NWC Cracked Monolithic 55.5 809 55.7 1004
120216 3637 NWC Cracked Monolithic 55.5 1468 52.5 947
230208 6916 NWC Cracked Monolithic 55.5 352 54.1 975
230408 6916 NWC Cracked Monolithic 55.5 706 87.1 1571
230608 6916 NWC Cracked Monolithic 55.5 1057 101.1 1822
230808 6916 NWC Cracked Monolithic 55.5 1410 114.2 2059
240208 2453 NWC Cracked Monolithic 55.5 352 37.4 675
240408 2453 NWC Cracked Monolithic 55.5 705 48.6 876
240608 2453 NWC Cracked Monolithic 55.5 1057 52.7 950
240808 2453 NWC Cracked Monolithic 55.5 1410 50.6 912
250208 4709 NWC Cracked Monolithic 55.5 352 55.0 991
250408 4709 NWC Cracked Monolithic 55.5 705 69.9 1261
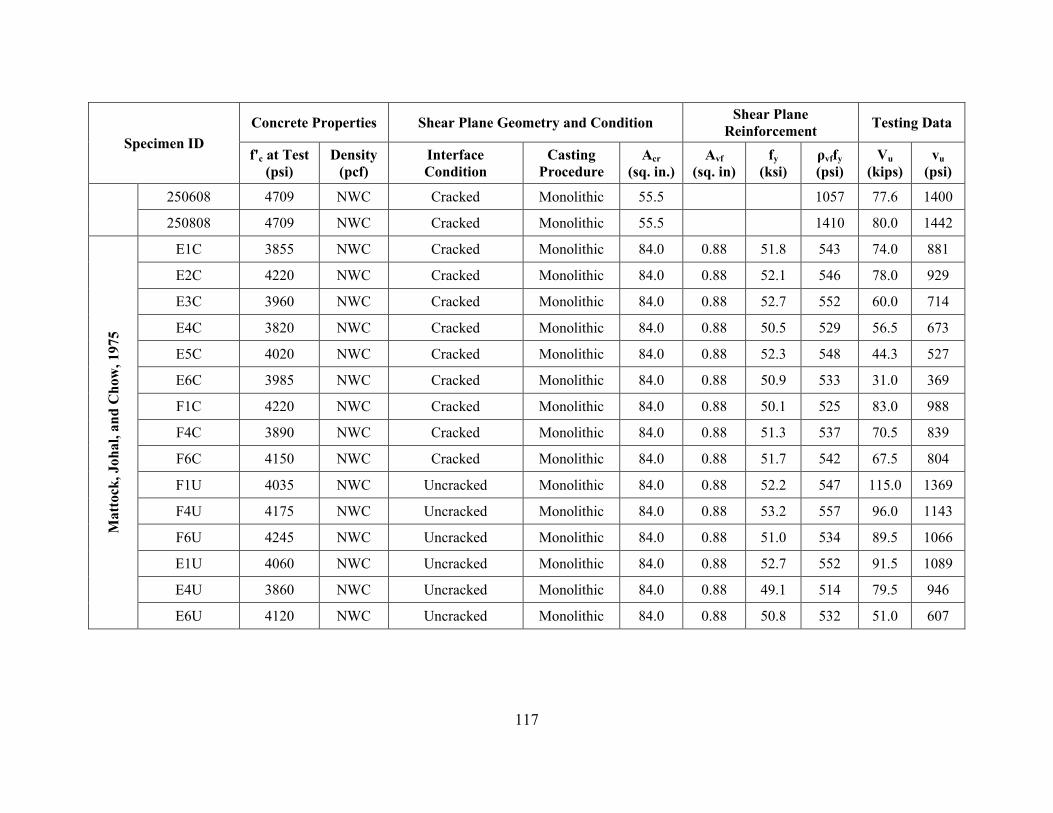
117
Specimen ID
Concrete Properties Shear Plane Geometry and Condition Shear Plane
Reinforcement Testing Data
f'c at Test
(psi)
Density
(pcf)
Interface
Condition
Casting
Procedure
Acr
(sq. in.)
Avf
(sq. in)
fy
(ksi)
ρvffy
(psi)
Vu
(kips)
vu
(psi)
250608 4709 NWC Cracked Monolithic 55.5 1057 77.6 1400
250808 4709 NWC Cracked Monolithic 55.5 1410 80.0 1442
Ma
tto
ck, Joh
al,
an
d C
how
, 1975
E1C 3855 NWC Cracked Monolithic 84.0 0.88 51.8 543 74.0 881
E2C 4220 NWC Cracked Monolithic 84.0 0.88 52.1 546 78.0 929
E3C 3960 NWC Cracked Monolithic 84.0 0.88 52.7 552 60.0 714
E4C 3820 NWC Cracked Monolithic 84.0 0.88 50.5 529 56.5 673
E5C 4020 NWC Cracked Monolithic 84.0 0.88 52.3 548 44.3 527
E6C 3985 NWC Cracked Monolithic 84.0 0.88 50.9 533 31.0 369
F1C 4220 NWC Cracked Monolithic 84.0 0.88 50.1 525 83.0 988
F4C 3890 NWC Cracked Monolithic 84.0 0.88 51.3 537 70.5 839
F6C 4150 NWC Cracked Monolithic 84.0 0.88 51.7 542 67.5 804
F1U 4035 NWC Uncracked Monolithic 84.0 0.88 52.2 547 115.0 1369
F4U 4175 NWC Uncracked Monolithic 84.0 0.88 53.2 557 96.0 1143
F6U 4245 NWC Uncracked Monolithic 84.0 0.88 51.0 534 89.5 1066
E1U 4060 NWC Uncracked Monolithic 84.0 0.88 52.7 552 91.5 1089
E4U 3860 NWC Uncracked Monolithic 84.0 0.88 49.1 514 79.5 946
E6U 4120 NWC Uncracked Monolithic 84.0 0.88 50.8 532 51.0 607