Embed Size (px)
Citation preview

U.P.B. Sci. Bull., Series C, Vol. 79, Iss. 2, 2017 ISSN 2286-3540
LIMITATION OF VOLTAGE FLUCTUATIONS IN
THE CASE OF INDUSTRIAL CUSTOMERS USING
ARC FURNACE
Stefan GHEORGHE1, George-Cristian LAZAROIU2, Gabriel GHEORGHE3,
Oana CEAKI4, Luminita ELEFTERESCU5
This paper deals with the theoretical analysis of the electromagnetic
disturbances generated by industrial customer having arc furnaces, the results of
monitoring of disturbances generated by industrial customer to power system, and
the calculation of the parameters using specialized software (ETAP). The
comparison between these three ways of determination of the level of disturbance is
included in present work. The paper is focused on the voltage fluctuations (flicker
effect) in power network. The influence of the short-circuit power on the
propagation of disturbances in power system represents a challenging issue studied
within the existing context. The revising of the characteristics of STATCOM has
been considered within the paper, avoiding the exceeding of admissible disturbance
levels stipulated by current standards.
Keywords: power quality; monitoring; renewable; voltage fluctuation; arc furnace
1. Introduction
The changes of the structure of electricity generation in Romania, because
of appearance of the energy renewable sources connected to the grid through
convertors and because of conventional power plants being in reserve, determined
a dramatic reduction of the short-circuit power in the buses of power system (Ssct)
[1]. In this context, the ratio between disturbing loads and Ssct in the buses of
power system has increased very much and this leads to redesign of compensation
and limitation systems.
1 Prof., Fac. of Power Engineering, University POLITEHNICA of Bucharest, Romania, e-mail:
[email protected] 2 Assoc. Prof., Fac. of Power Engineering, University POLITEHNICA of Bucharest, Romania,
e-mail: [email protected] 3 PhD eng., Fac. of Electrical Engineering, VALAHIA University of Targoviste, Romania, e-mail:
[email protected] 4 PhD student, Fac. of Power Engineering, University POLITEHNICA of Bucharest, Romania,
e-mail: [email protected] 5 PhD eng., of Bucharest, Romania, e-mail: Institute for Studies and Power Engineering,
Bucharest, Romania, e-mail: [email protected]
230 St. Gheorghe, G.-C. Lazaroiu, G. Gheorghe, Oana Ceaki, Luminita Elefterescu
The reduction of the rigidity of the buses of the power system through
reduction of Ssct has determined the electromagnetic disturbances (harmonics,
voltage fluctuations, voltage sags, voltage unbalance) to be present in power
network. In this way, the end customers connected to the grid near the disturbing
customers are affected by Power Quality (PQ) indices outside the admissible
limits of the standards [2]. As consequence, the end users which did not generate
disturbances outside the standard limits before, have to do now a revision of the
stage and to do the supplementary measures, in the most of cases investment
measures, in order to ensure the PQ indices inside the admissible limits of the
standard.
The analysis from this paper refers to an end user – industrial customer –
which generates voltage fluctuations in its technological process, using arc
furnaces. In actual conditions, the operation of the end user could determine the
overtaking of voltage fluctuations (Flicker effect) on 110 kV busbar and could
propagate the disturbance in the network area around the bus of connection [3, 4].
In order to analyze the technical solutions for limitation of the disturbances
on the busbar of connection of the customer to the grid, some technical and
experimental studies have to be done. The STATCOM system has to be connected
to internal 6kV busbar in order to limit the electromagnetic disturbances.
The paper is focused on the calculation of the disturbance indices using
analytical method, simulation and power system analyze using the specialized
software for a real case of the distribution electricity to industrial customer using
arc furnace. Two cases: without or with STATCOM and two scenarios: Ssct =
2080 MVA and Ssct = 1050 MVA were taken into consideration.
In additional to these two methods, the measurement in the both cases
(without / with STATCOM) was done.
Finally, the original contributions in this paper refers to the analysis of the
results using these three methods allows to draw the conclusions.
2. Theoretical Analysis of Voltage fluctuations of arc furnace
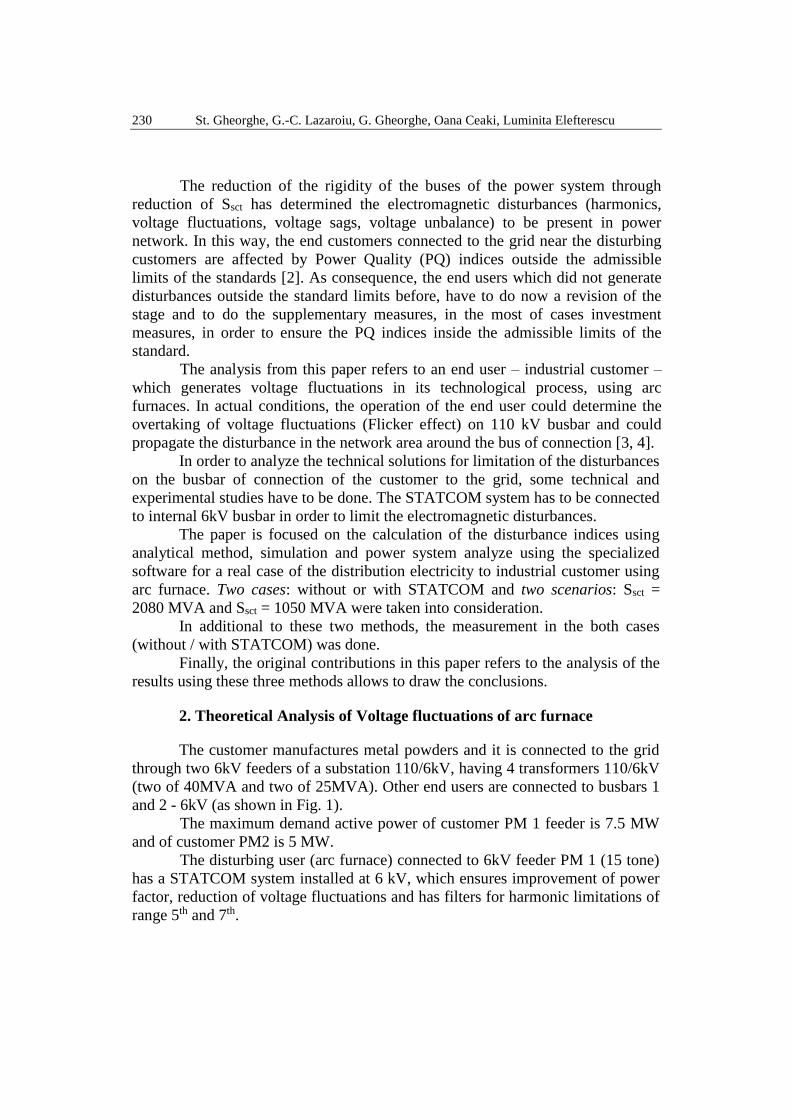
The customer manufactures metal powders and it is connected to the grid
through two 6kV feeders of a substation 110/6kV, having 4 transformers 110/6kV
(two of 40MVA and two of 25MVA). Other end users are connected to busbars 1
and 2 - 6kV (as shown in Fig. 1).
The maximum demand active power of customer PM 1 feeder is 7.5 MW
and of customer PM2 is 5 MW.
The disturbing user (arc furnace) connected to 6kV feeder PM 1 (15 tone)
has a STATCOM system installed at 6 kV, which ensures improvement of power
factor, reduction of voltage fluctuations and has filters for harmonic limitations of
range 5th and 7th.
Limitation of voltage fluctuations in the case of industrial customers using arc furnace 231
The disturbing user (arc furnace) connected to 6kV feeder PM 2 does not
has any compensation system. Evaluation of the Voltage fluctuations (Flicker
effect) generated by PM 1 and PM 2 has been done in 110 kV busbar of substation
A which is Point of Common Coupling (PCC) [5]. The hypotheses used in the
analysis were:
• Arc furnace severity factor kst = 45 for both arc furnaces;
• The maximum short circuit power Ssct = 2080 MVA – First scenario;
• The real short circuit power Ssct = 1050 MVA – Second scenario.
The simplified diagram of the analyzed network is shown in Fig. 1. The
disturbing user has two arc furnaces: PM 1 is an electric arc furnace (EAF) and
PM 2 is a ladle refining furnace (LRF).
The realized measurements have shown that only PM1 generates
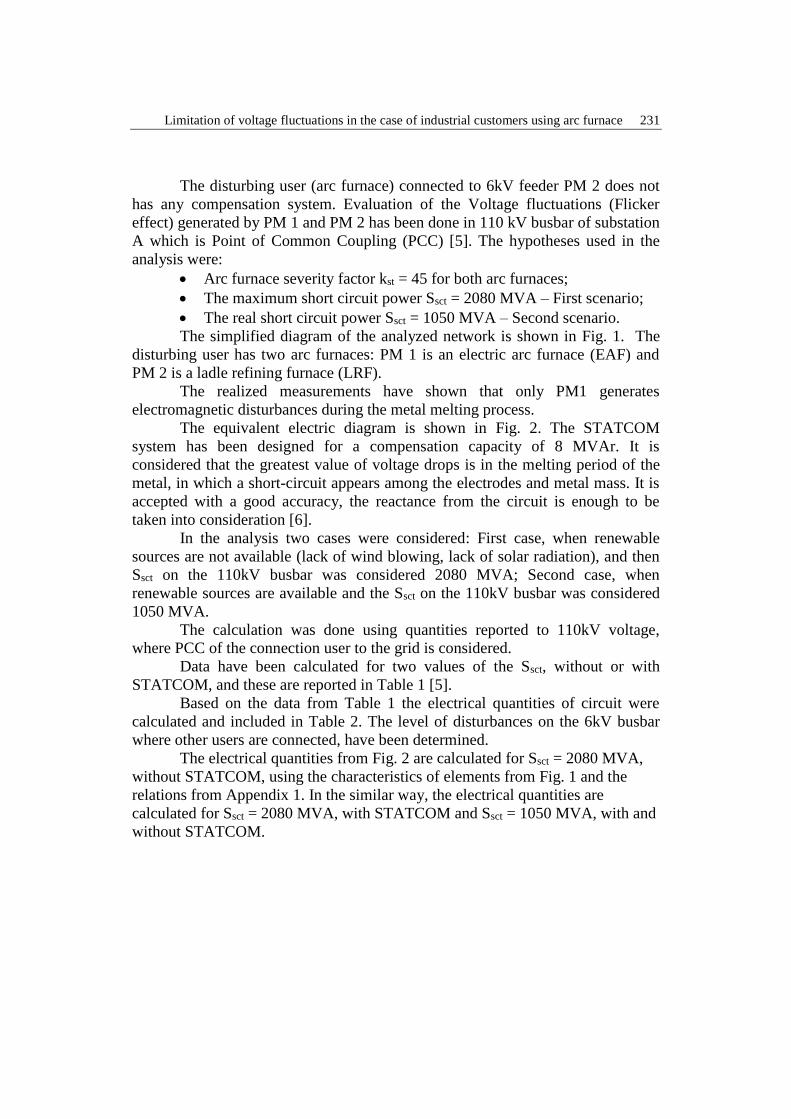
electromagnetic disturbances during the metal melting process. The equivalent electric diagram is shown in Fig. 2. The STATCOM
system has been designed for a compensation capacity of 8 MVAr. It is
considered that the greatest value of voltage drops is in the melting period of the
metal, in which a short-circuit appears among the electrodes and metal mass. It is
accepted with a good accuracy, the reactance from the circuit is enough to be
taken into consideration [6].
In the analysis two cases were considered: First case, when renewable
sources are not available (lack of wind blowing, lack of solar radiation), and then
Ssct on the 110kV busbar was considered 2080 MVA; Second case, when
renewable sources are available and the Ssct on the 110kV busbar was considered
1050 MVA.
The calculation was done using quantities reported to 110kV voltage,
where PCC of the connection user to the grid is considered.
Data have been calculated for two values of the Ssct, without or with
STATCOM, and these are reported in Table 1 [5].
Based on the data from Table 1 the electrical quantities of circuit were
calculated and included in Table 2. The level of disturbances on the 6kV busbar
where other users are connected, have been determined.
The electrical quantities from Fig. 2 are calculated for Ssct = 2080 MVA,
without STATCOM, using the characteristics of elements from Fig. 1 and the
relations from Appendix 1. In the similar way, the electrical quantities are
calculated for Ssct = 2080 MVA, with STATCOM and Ssct = 1050 MVA, with and
without STATCOM.
232 St. Gheorghe, G.-C. Lazaroiu, G. Gheorghe, Oana Ceaki, Luminita Elefterescu
Substation A
STATCOM
T 110/6 kV 25 MVA usc = 18 %
Cable 800 m X0=0.0605/km
6 kV
Reactor Xreactor=0.7
In = 1200 A
T 6/0.4 kV 10 MVA usc = 8.5 %
T 6/0.4 kV; 3.5 MVA usc = 5.4 %
Short network
Xsn= 2.3 m
PM 1 PM 2
Fig. 1. The partial diagram of Substation A for calculation
Cable 800 m X
0=0.0605/km
Short network
Xsn
= 2.3 m
System
Bus 5
6 kV
Bus 6
0.36kV
Bus 7
0.36kV
Bus 3
Bus 4
110 kV Bus
Xshort network
PM 1 PM 2
Fig. 2. The calculation diagram
XTR 6/0.4 kV PM1
XReactor PM1
XCable
XTR 110/6 kV
Xsystem
Xshort network
XTR 6/0.4 kV PM2
XCable
Table 1
Calculation of reactance of system’s components, reported to 110 kV level
Reactance [] Ssct = 2080 [MVA] Ssct = 1050 [MVA]
Xsystem 5.82 11.52
XT110/6 kV 87.12 87.12
X’cable 6 kV 16.27 16.27
X’reactor 235.28 235.28
X’T6/0.36 kV 102.85 102.85
Xshort network 214.74 214.74
Xtotal 662.08 667.78
Xsystem+ XT110/6 kV 92.94 98.64
Limitation of voltage fluctuations in the case of industrial customers using arc furnace 233
Table 2
Results of calculation of quantities from circuit
Voltage
level Quantity
Ssct = 2080 MVA Ssct = 1050 MVA
Without
STATCOM
With
STATCOM
Without
STATCOM
With
STATCOM
(1) (2) (3) (4) (5) (6)
110 kV
I110 kV [A] 105.54 59.35 104.62 58.43
(phase to ground)
614.24 345.47 1,205.20 673.10
(phase to ground) 0,97 0,54 1.90 1.06
Pst99% 0.44 0.25 0.86 0.48
Pst95% 0.37 0.21 0.73 0.41
6 kV
(phase to phase)
926.67 521.13 974.95 544.53
(phase to phase)
15.44 8.68 16.25 9.07
Pst99% 6.95 3.91 7.31 4.36
Pst95% 5.89 3.31 6.20 3.70
3. Results of of monitoring of Voltage fluctuations (Flicker effect)
The monitoring campaign was carried on by the authors in an industrial
facility in Romania, in the real conditions, in the presence of technical staff of
distribution system operator. The monitoring of PQ indices was done according to
the standards and recommended practices in the field [3, 7, 5, 8] for a period of
time of four days Nov 2016. The measurement results are validating the
theoretical analysis and simulation implemented models using professional
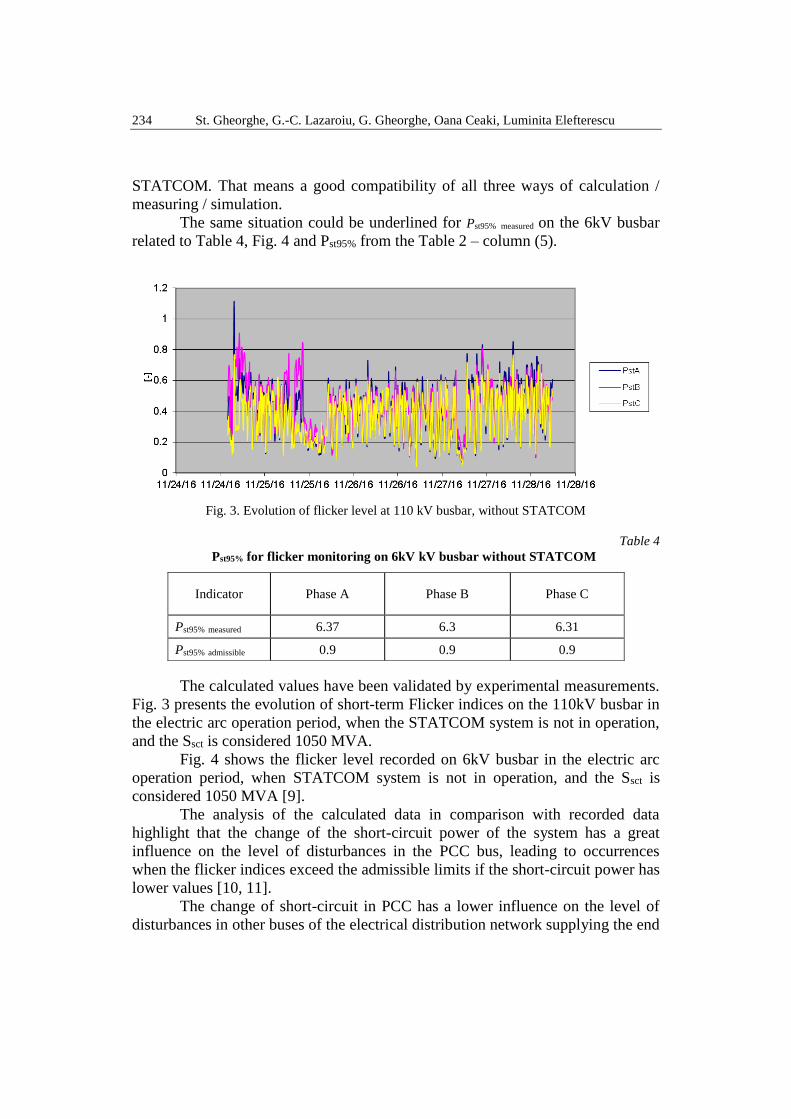
software. The evolution of flicker is illustrated in Fig. 3. Table 3
Pst95% for flicker monitoring on 110kV busbar without STATCOM
The average value of Pst95% measured from the Table 3, measured on 110kV
busbar is in the same range with the variation shown Fig. 3 and Pst95% from the
Table 2 – column (5), in the same conditions: Ssct = 1050 MVA and without
Indicator Phase A Phase B Phase C
Pst95% measured 0.81 0.78 0.72
Pst95% admissible 0.8 0.8 0.8
234 St. Gheorghe, G.-C. Lazaroiu, G. Gheorghe, Oana Ceaki, Luminita Elefterescu
STATCOM. That means a good compatibility of all three ways of calculation /
measuring / simulation.
The same situation could be underlined for Pst95% measured on the 6kV busbar
related to Table 4, Fig. 4 and Pst95% from the Table 2 – column (5).
Fig. 3. Evolution of flicker level at 110 kV busbar, without STATCOM
Table 4
Pst95% for flicker monitoring on 6kV kV busbar without STATCOM
The calculated values have been validated by experimental measurements.
Fig. 3 presents the evolution of short-term Flicker indices on the 110kV busbar in
the electric arc operation period, when the STATCOM system is not in operation,
and the Ssct is considered 1050 MVA.
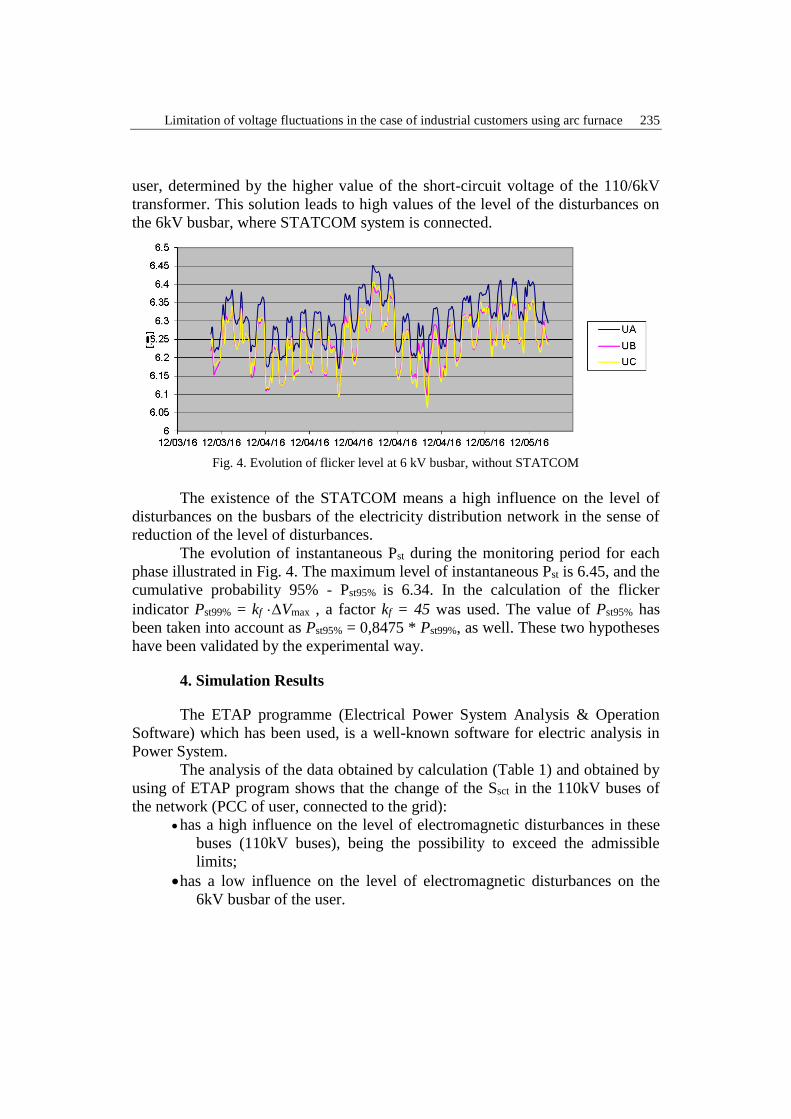
Fig. 4 shows the flicker level recorded on 6kV busbar in the electric arc
operation period, when STATCOM system is not in operation, and the Ssct is
considered 1050 MVA [9].
The analysis of the calculated data in comparison with recorded data
highlight that the change of the short-circuit power of the system has a great
influence on the level of disturbances in the PCC bus, leading to occurrences
when the flicker indices exceed the admissible limits if the short-circuit power has
lower values [10, 11].
The change of short-circuit in PCC has a lower influence on the level of
disturbances in other buses of the electrical distribution network supplying the end
Indicator Phase A Phase B Phase C
Pst95% measured 6.37 6.3 6.31
Pst95% admissible 0.9 0.9 0.9
Limitation of voltage fluctuations in the case of industrial customers using arc furnace 235
user, determined by the higher value of the short-circuit voltage of the 110/6kV
transformer. This solution leads to high values of the level of the disturbances on
the 6kV busbar, where STATCOM system is connected.
Fig. 4. Evolution of flicker level at 6 kV busbar, without STATCOM
The existence of the STATCOM means a high influence on the level of
disturbances on the busbars of the electricity distribution network in the sense of
reduction of the level of disturbances.
The evolution of instantaneous Pst during the monitoring period for each
phase illustrated in Fig. 4. The maximum level of instantaneous Pst is 6.45, and the
cumulative probability 95% - Pst95% is 6.34. In the calculation of the flicker
indicator Pst99% = kf Vmax , a factor kf = 45 was used. The value of Pst95% has
been taken into account as Pst95% = 0,8475 * Pst99%, as well. These two hypotheses
have been validated by the experimental way.
4. Simulation Results
The ETAP programme (Electrical Power System Analysis & Operation
Software) which has been used, is a well-known software for electric analysis in
Power System.
The analysis of the data obtained by calculation (Table 1) and obtained by
using of ETAP program shows that the change of the Ssct in the 110kV buses of
the network (PCC of user, connected to the grid):
• has a high influence on the level of electromagnetic disturbances in these
buses (110kV buses), being the possibility to exceed the admissible
limits;
• has a low influence on the level of electromagnetic disturbances on the
6kV busbar of the user.
236 St. Gheorghe, G.-C. Lazaroiu, G. Gheorghe, Oana Ceaki, Luminita Elefterescu
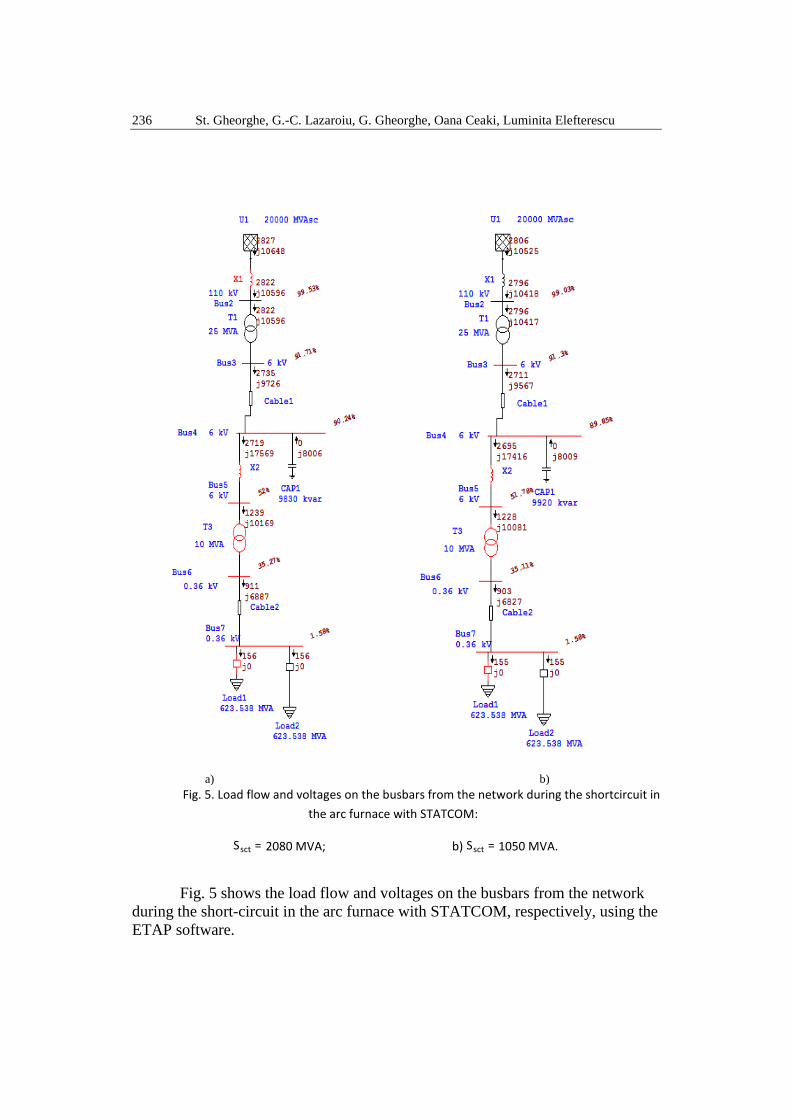
Fig. 5 shows the load flow and voltages on the busbars from the network
during the short-circuit in the arc furnace with STATCOM, respectively, using the
ETAP software.
a) b) Fig. 5. Load flow and voltages on the busbars from the network during the shortcircuit in
t he arc furnace with STATCOM:
S sct = 2080 MVA; b) S sct = 1050 MVA.
Limitation of voltage fluctuations in the case of industrial customers using arc furnace 237
The connection of STATCOM system on the medium voltage busbar of
the user has an important consequence on the level of disturbances in the whole
area around the PCC bus, allowing the possibility to respect the admissible levels
of the standard. Considering the change of value for calculation of Ssct, the user
has to revise and redesign the STATCOM, in order to respect the standard
admissible conditions. When the Ssct is double (2080MVA versus 1050MVA),
Pst95% is decreased 50% about.
Table 5 includes the results of calculation quantities using ETAP software
- the voltage levels on the 110kV and 6kV busbars, and PQ indices for flicker.
The results obtained using the ETAP software confirm the experimental
results from the study. By considering the electric resistances of the circuit
elements, the lower short-circuit currents were obtained and, as a consequence,
lower voltage drops. As in the case of the short circuit power of 2080 MVA and
of the case in which the power circuit has dropped to 1050 MVA, the STATCOM
system ensures the limitation of the level of disturbances at the levels stipulated
by standards. In the specific condition of actual scheme, STATCOM system could
not ensure the admissible PQ levels for the users connected to 6kV busbars.
Table 5
Results of calculation of quantities from circuit – centralization from the use of ETAP
Voltage
level Quantity
Ssct = 2080 MVA Ssct = 1050 MVA
Without
STATCOM
With
STATCOM
Without
STATCOM
With
STATCOM
(1) (2) (3) (4) (5) (6)
110 kV
Isc110 kV [A] 96 58 94 57
(phase to ground)
502 299 1035 616
(phase to ground)
0.79 0.47 1.63 0.97
Pst99% 0.36 0.21 0.73 0.44
Pst95% 0.30 0.18 0.62 0.37
6 kV
(phase to phase) 835 497 879 522
(phase to phase)
13.91 8.29 14.65 8.70
Pst99% 6.26 3.73 6.59 3.92
Pst95% 5.31 3.16 5.59 3.32
238 St. Gheorghe, G.-C. Lazaroiu, G. Gheorghe, Oana Ceaki, Luminita Elefterescu
6. Conclusions
Special attention is required for steel and aluminum processing plants,
disturbances generated by their technological processes being transmitted over
transmission network and affecting the power quality for other customers. The
customer responsible for the disturbances has to install reactive power
compensation systems (SVC or STATCOM) for reducing the effects of flicker.
In the power network, the short-circuit power has a very important
influence on the propagation of the disturbances in the power system. If the short-
circuit power in the system is lower, the influence of the disturbance on the other
customers connected to the grid is higher. This case of decreasing of the short-
circuit power is met in Romanian Power System when many renewable sources
are connected to the grid using static convertors and conventional generation
sources are in reserve [1].
Development of the studies related to the propagation of the disturbances
in the Power System in condition in which the short-circuit power is in the
decreasing trend, as long as the number and capacity of the renewable sources are
increased. The determination of the vulnerability area of Power System buses
represents in this direction an important issue of the work.
The comparison of Pst95% among Calculation / Measurements / Simulation
in PCC, at Ssct = 1050 MVA, shows the values are comparable in both cases:
- First case: without STATCOM (0.73; 0.77; 0.62 respectively) and
- Second case: with STATCOM (0.41; 0.45; 0.37 respectively).
The calculations which were done, have been confirmed by experimental
determinations and offer to the disturbing users the data for finding out the
appropriate solutions, most of them being important investments, in order to
ensure to all users connected to the grid a standard PQ conditions. Of course,
among the solutions taken into account could be:
• the change of rated voltage of the connection arc furnaces to the power
grid to 20kV network or
• separate circuit including transformer 110/6 kV, 6 kV busbars without any
other users connected to these 6kV busbar or
• Redesigning of the STATCOM, available for Ssct minim.
The analysis and methodology applied in this paper for the EAF consumer,
can be extended to other distorting end-users connected to the mains supply, like
welding-based industries, steel industry end-users etc.
The proposed solutions lead not only to improvement of Power Quality but
also to increase energy efficiency of the users, having a suitable voltage level.
Limitation of voltage fluctuations in the case of industrial customers using arc furnace 239
R E F E R E N C E S
[1]. N. Golovanov, H. Albert, S. Gheorghe, N. Mogoreanu and G.C. Lazaroiu, “Surse regenerabile
de energie electrica in Sistemul Electroenergetic” (Renewable sources in Power System.”
book printed by AGIR, Bucharest, 2015.
[2]. S. Gheorghe, N. Golovanov, C. Stanescu, G. Gheorghe, Results of Power Quality Monitoring
in Romanian Transmission and Distribution System Operators”, ICATE 2017, Craiova,
2016.
[3]. IEC 61000-4-14, Electromagnetic compatibility Part 4: Testing and measurement techniques -
Voltage fluctuation immunity test for equipment with input current not exceeding 16 A per
phase, 2009.
[4]. ANRE, “Reglementare tehnica referitoare la limitarea tensiunii, incluzand efectul de flicker in
retelele electrice de transport si distributie a Enel” (Technical regulation regarding
limitation of voltage including the effect of flicker in power transmission and distribution
networks), NTE 012/14/00, Official Gazeta of Romania no. 884/05.12.2014,
http://www.anre.ro.
[5]. H. Albert, S. Gheorghe, N. Golovanov, L. Elefterescu and R. Porumb, “Calitatea Energiei
Electrice. Contributii, rezultate, perspective” (Power Quality. Contributions, Results, and
Perspectives), book AGIR, Bucharest, 2013.
[6]. IEEE 1453-2015, IEEE Recommended Practice for the Analysis of Fluctuating Installations
on Power Systems, Sept. 2015.
[7]. EN 50160, Voltage characteristics of electricity supplied by public distribution systems, 2011.
[8]. IEC 61000-4-30, “Electromagnetic compatibility (EMC) - Part 4-30: Testing and measurement
techniques - Power quality measurement methods”, 2015.
[9]. ANRE, “Standard de performanta in retelele de distributie a en el” (The Power Distribution
Grid – Standard of performance), Order no. 11/2016, Official Gazeta of Romania, no
291/2016, http://www.anre.ro.
[10]. N. Golovanov, G.C. Lazaroiu, M. Roscia, D. Zaninelli, “Power quality impact of high
capacity end-users,” Proc. 13th International Conference on Harmonics and Quality of
Power (ICHQP 2008), 28 September−1 October, Wollongong, Australia, art. no. 4668853,
pp. 645−649, 2008.
[11]. G.C. Lazaroiu, M. Costoiu, C. Carstea, N. Golovanov, O. Udrea, M. Roscia, “Power quality
management in a syderurgic factory,” Proc. of International Conference on Harmonics and
Quality of Power, Article number 6842884, pp. 54-57, 2014
Appendix 1
The components of diagram (Fig. 2) are determined below:
System reactance
82.52080
110 2
kV110
2
system
sc
b
S
UX . (1)
Reactance of 110/6 kV transformer, reported to 110 kV voltage
12.8725
110
100
18110
100
22
T
sc
S
uX T110/6 (2)
240 St. Gheorghe, G.-C. Lazaroiu, G. Gheorghe, Oana Ceaki, Luminita Elefterescu
6 kV cable reactance, reported to 110 kV voltage
27.166
110)0605.08.0()(
2
2
2cablu
2
0'
6kVcabluU
UlXX b . (3)
Reactor reactance, reported to 110 kV voltage
28.2356
1107.0)(
2
2
2
2
'
bobina
bobinabobinaU
UXX b . (4)
Reactance of 6/0.4 kV transformer, reported to 110 kV voltage
85.10210
110
100
5.8110
100
22'T6/0.4kV
T
sc
S
uX . (5)
Short network reactance, reported to 110 kV voltage
74.21436.0
1100023.0)(
2
2
2
rkshortnetwo
2
rkshortnetwo
'
rkshortnetwoU
UXX b . (5)
Total reactance of the circuit, reported to 110 kV voltage
08.66274.21485.10228.23527.1612.8782.5totalX (6)
Reactive Power demanded from power network during burning of arc furnace
MVA28.18total
2
X
UQ b . (7)
Calculation without STATCOM - The current demanded from 110kV network:
A54.1053
1.1kV110
U
QI . (8)
Voltage drop (phase to ground) on 110kV busbar in [V] and [%]
V24.61482.554.105systemkV110 XIU , (9)
%97.01003110000
24.614[%] U , (10)
Flicker level at 110 kV busbar means
.37.044,08475,0
;44.00097.045
95
99
st
stst
P
UkP (11)
Voltage drop (phase to phase) on 6kV busbar resulting
%44.151006000
67.926[%]
;V67.926110
654.105)12.8782.5(33 kV110
'
kV6
U
IXU sc
(12)
Flicker level at 6 kV busbar means
.89.595.68475,0
;95.61544.045
50
99
st
stst
P
UkP (13)