Embed Size (px)
DESCRIPTION
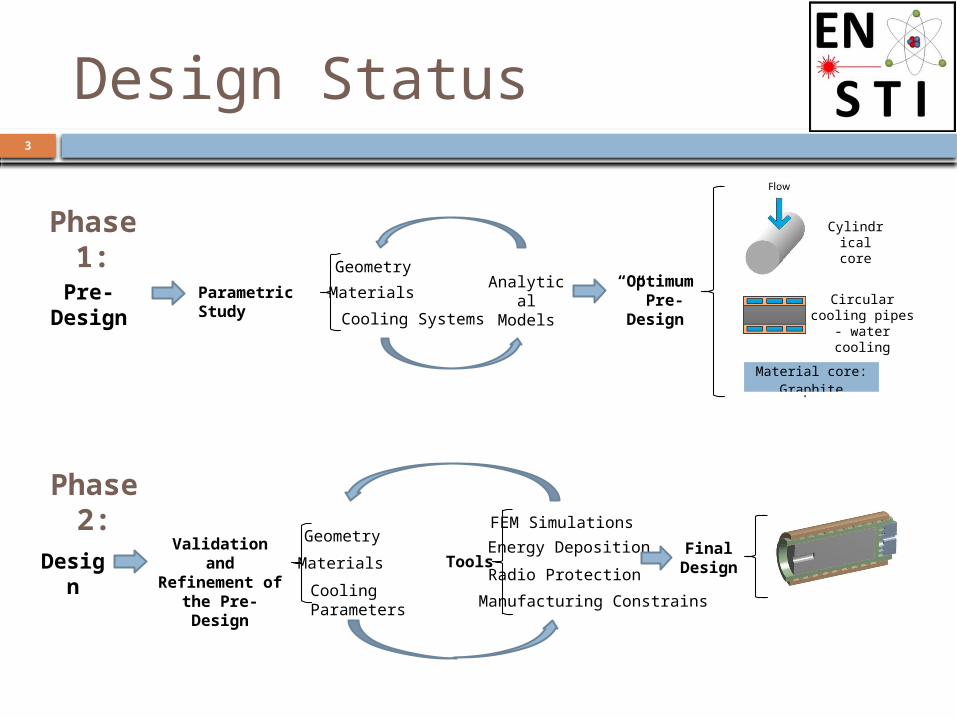
Linac4 LBE/LBS & Main Dump Conceptual Design and open issues. Ivo Leit ã o – Linac4 BCC Meeting – 24/11/2011. Conceptual Design. Design Status. Phase 1:. Cylindrical core. Geometry. “Optimum” Pre-Design. Analytical Models. Pre-Design. Parametric Study. Materials. - PowerPoint PPT Presentation
Citation preview

LINAC4 LBE/LBS & MAIN DUMP
CONCEPTUAL DESIGN AND OPEN ISSUES
Ivo Leitão – Linac4 BCC Meeting – 24/11/2011
CONCEPTUAL DESIGN
3
Design Status
Circular cooling pipes - water
cooling
Analytical ModelsParametric
Study
“Optimum” Pre-Design
Pre-Design
Geometry
Materials
Cooling Systems
Cylindrical core
Design
FEM Simulations
Energy DepositionValidation and Refinement of
the Pre-Design
Radio ProtectionTools
Material core: Graphite
Geometry
Materials
Cooling Parameters
Final Design
Phase 1:
Phase 2:
Manufacturing Constrains
4
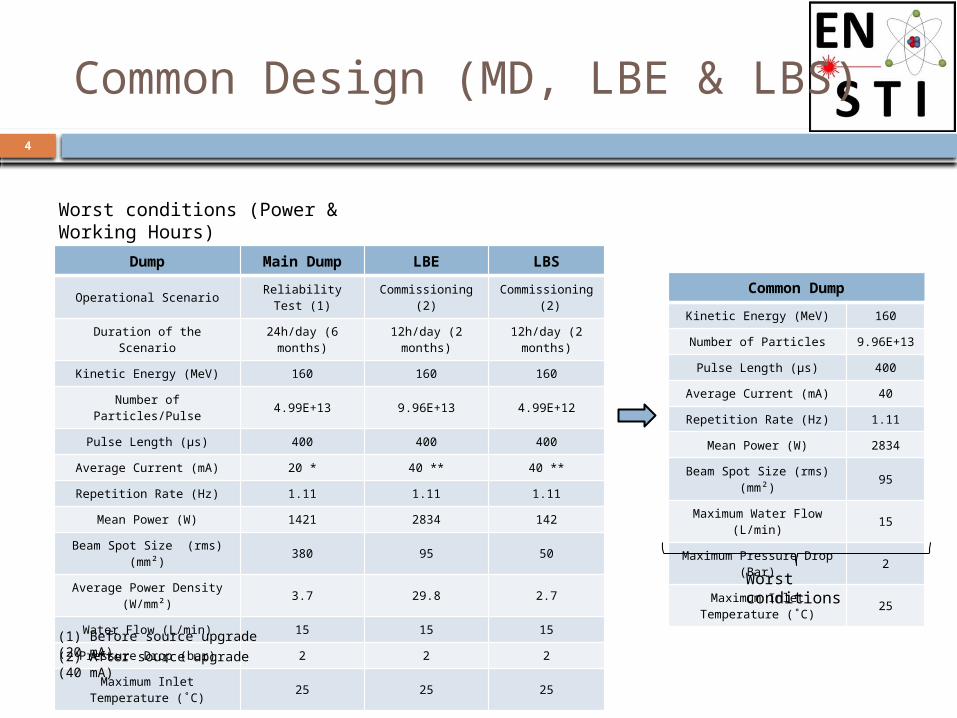
Common Design (MD, LBE & LBS)
Dump Main Dump LBE LBS
Operational ScenarioReliability Test
(1)Commissioning
(2)Commissioning
(2)
Duration of the Scenario24h/day (6
months)12h/day (2
months)12h/day (2
months)
Kinetic Energy (MeV) 160 160 160
Number of Particles/Pulse 4.99E+13 9.96E+13 4.99E+12
Pulse Length (µs) 400 400 400
Average Current (mA) 20 * 40 ** 40 **
Repetition Rate (Hz) 1.11 1.11 1.11
Mean Power (W) 1421 2834 142
Beam Spot Size (rms) (mm²) 380 95 50
Average Power Density (W/mm²) 3.7 29.8 2.7
Water Flow (L/min) 15 15 15
Pressure Drop (bar) 2 2 2
Maximum Inlet Temperature (˚C)
25 25 25
Common Dump
Kinetic Energy (MeV) 160
Number of Particles9.96E+1
3
Pulse Length (µs) 400
Average Current (mA) 40
Repetition Rate (Hz) 1.11
Mean Power (W) 2834
Beam Spot Size (rms) (mm²) 95
Maximum Water Flow (L/min)
15
Maximum Pressure Drop (Bar)
2
Maximum Inlet Temperature (˚C)
25Worst conditions
Worst conditions (Power & Working Hours)
(1) Before source upgrade (20 mA)(2) After source upgrade (40 mA)

5
Current Conceptual Design
Design restrictions:
Cover
UHV flange
Cooling Jacket
Core
Part Material
Cooling System (Cover & Jacket)
Copper (C10100)
CoreGraphite (R4550)
Safety %20Steering %205Radius Core MainDumpyx
2 ofFactor Safety Length StoppingLength Core Graphite
(General Dimensions - mm)
6
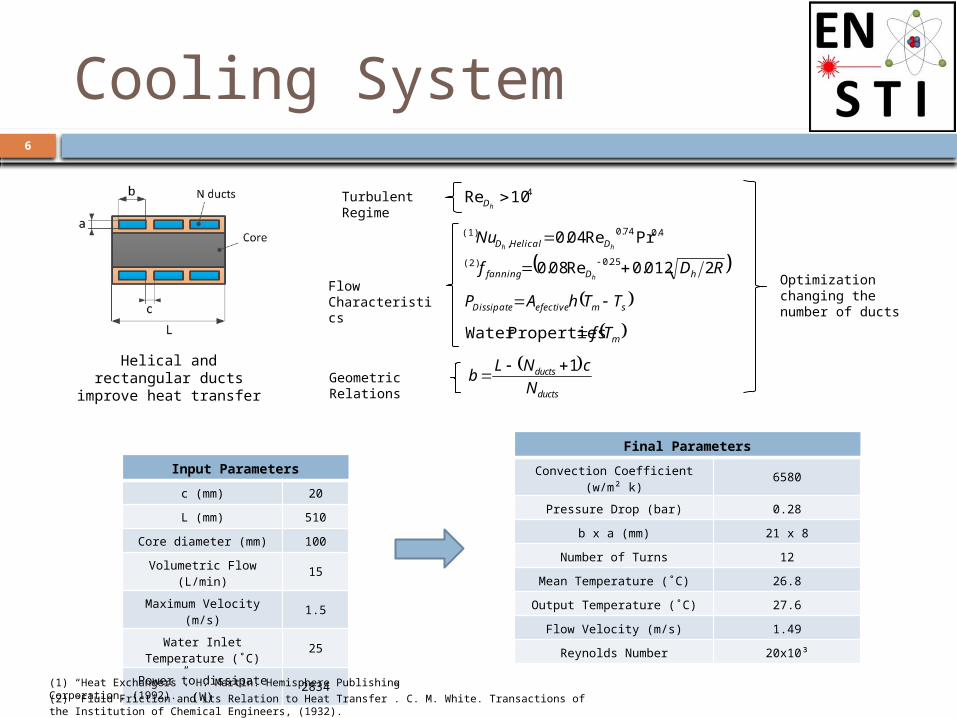
Cooling System
Turbulent Regime
Helical and rectangular ducts improve heat
transferGeometric Relations
Final Parameters
Convection Coefficient (w/m² k)
6580
Pressure Drop (bar) 0.28
b x a (mm) 21 x 8
Number of Turns 12
Mean Temperature (˚C) 26.8
Output Temperature (˚C) 27.6
Flow Velocity (m/s) 1.49
Reynolds Number 20x10³
Input Parameters
c (mm) 20
L (mm) 510
Core diameter (mm) 100
Volumetric Flow (L/min)
15
Maximum Velocity (m/s)
1.5
Water Inlet Temperature (˚C)
25
Power to dissipate (W) 2834
ducts
ducts
N
cNLb
1
PrRe04.0 4.074.0,
(1)
hh DHelicalDNu
smefectiveDissipate TThAP
mTfPropertiesWater
Flow Characteristics
Optimization changing the number of ducts
2012.0Re08.0 25.0(2) RDf hDfanning h
410Re hD
(1) “Heat Exchangers”. H. Martin. Hemisphere Publishing Corporation, (1992).(2) “Fluid Friction and its Relation to Heat Transfer”. C. M. White. Transactions of the Institution of Chemical Engineers, (1932).
7
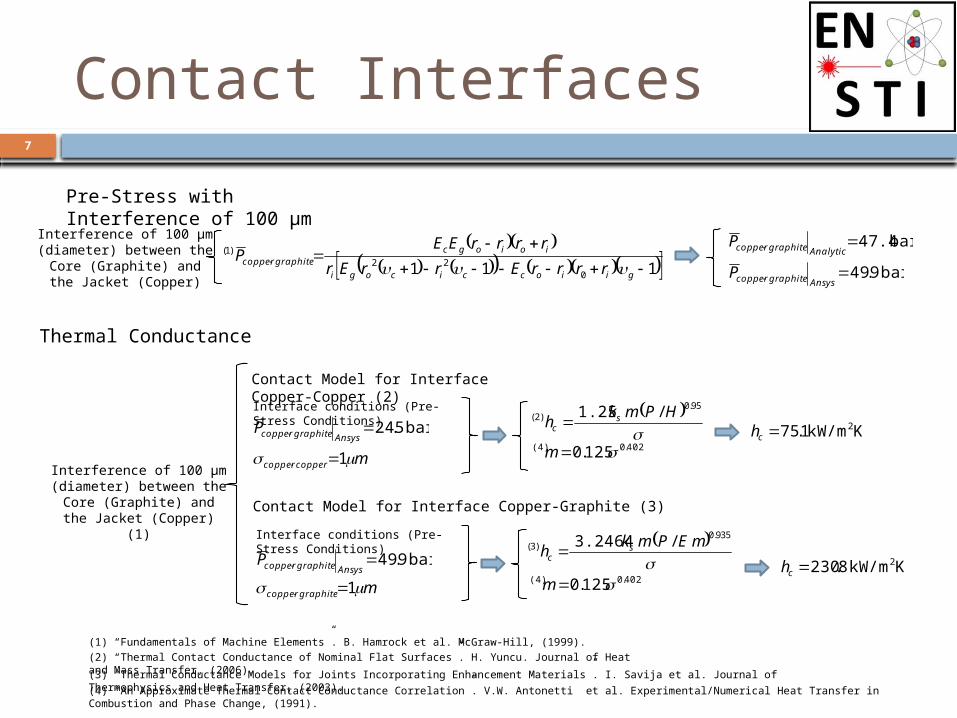
Contact Interfaces
Contact Model for Interface Copper-Copper (2)
Contact Model for Interface Copper-Graphite (3)
935.0)3( / 3.2464 mEPmkh sc
95.0)2( / 1.25 HPmkh sc
mcoppercopper 1
Interference of 100 µm (diameter) between the Core (Graphite) and the
Jacket (Copper)
Pre-Stress with Interference of 100 µm
(2) “Thermal Contact Conductance of Nominal Flat Surfaces”. H. Yuncu. Journal of Heat and Mass Transfer, (2006).
KkW/m1.75 2ch
KkW/m 8.230 2ch
(3) “Thermal Conductance Models for Joints Incorporating Enhancement Materials”. I. Savija et al. Journal of Thermophysics and Heat Transfer, (2003).
Interface conditions (Pre-Stress Conditions)
mgraphitecopper 1
(4) “An Approximate Thermal Contact Conductance Correlation”. V.W. Antonetti et al. Experimental/Numerical Heat Transfer in Combustion and Phase Change, (1991).
(1) “Fundamentals of Machine Elements”. B. Hamrock et al. McGraw-Hill, (1999).
Thermal Conductance
bar 47.4 AnalyticgraphitecopperP
bar 9.49 AnsysgraphitecopperP
Interference of 100 µm (diameter) between the Core (Graphite) and the
Jacket (Copper) (1)
bar 5.24 AnsysgraphitecopperP
bar 9.49 AnsysgraphitecopperP
111 0
22)1(
giioccicogi
ioiogcgraphitecopper
rrrrErrEr
rrrrEEP
402.0(4) 125.0 m
402.0(4) 125.0 m
Interface conditions (Pre-Stress Conditions)
8
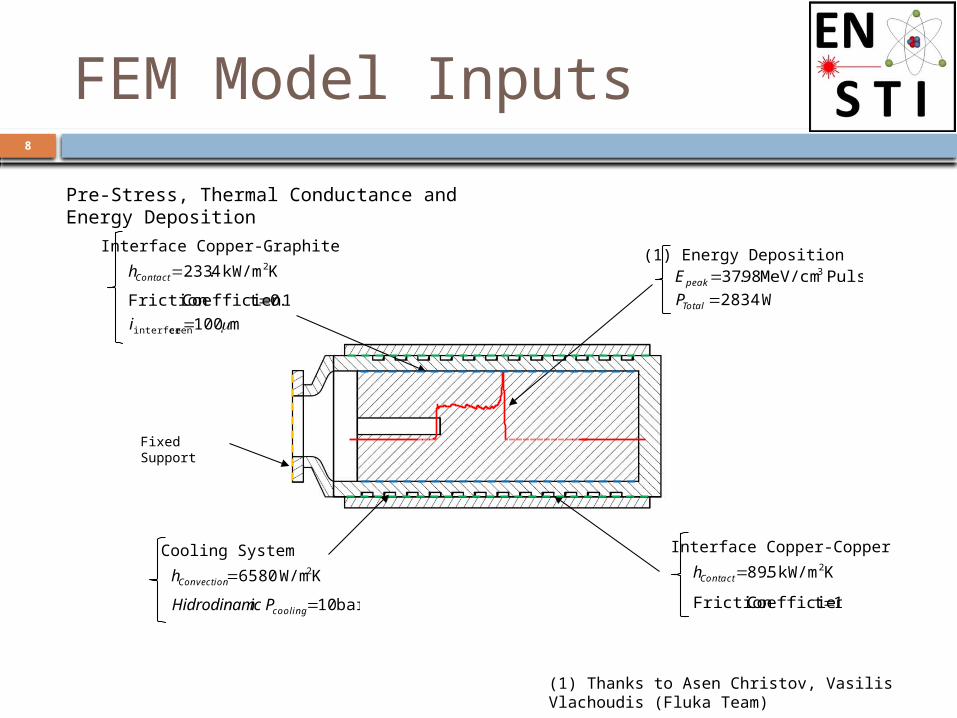
FEM Model Inputs
Pre-Stress, Thermal Conductance and Energy Deposition
Pulse MeV/cm 98.37 3peakE
bar 10 coolingPicHidrodinam
Fixed Support
1tCoefficienFriction
KkW/m 5.89 2ContacthK W/m6580 2Convectionh
(1) Energy Deposition
Interface Copper-CopperCooling System
1.0tCoefficienFriction
KkW/m 4.233 2Contacth
Interface Copper-Graphite
W2834TotalP
m 100ceinterferen i
(1) Thanks to Asen Christov, Vasilis Vlachoudis (Fluka Team)

9
0 50 100 150 200 2500
500
1000
1500
2000
2500
3000
Time (s)
Pow
er
in t
he C
oolin
g
Syste
m (
W)
Thermal Results
0 50 100 150 200 2500
50100150200250300350400450500
Time (s)
Tem
pera
ture
(ºC
)
0 50 100 150 200 25024
24.5
25
25.5
26
26.5
27
Time (s)
Tem
pera
ture
(ºC
)
Temperature at the peak of energy deposition (for 300 shots)
Temperature at the surface of the cooling pipe (for 300 Shots)
Power extracted by the Cooling System (for 300 shots)
For 100 µm of interference
Temperature Field (ºC) (300th shot)
10
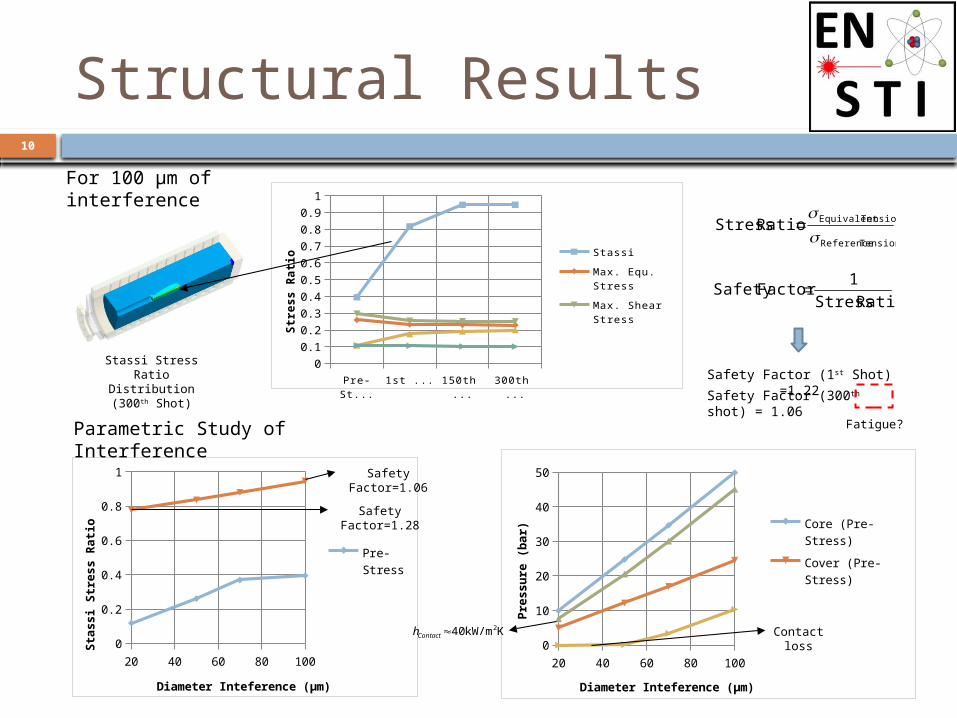
Structural Results
For 100 µm of interference
Stassi Stress Ratio Distribution (300th
Shot)
Tension Reference
Tension EquivalentRatio Stress
Ratio Stress
1FactorSafety
Safety Factor (300th shot) = 1.06
Safety Factor (1st Shot) =1.22Pre-
Stress1st Shot 150th
Shot300th Shot
0
0.1
0.2
0.3
0.4
0.5
0.6
0.7
0.8
0.9
1
Stassi
Max. Equ. Stress
Max. Shear Stress
Moht-Coulomb Stress
Str
ess R
ati
o
20 40 60 80 1000
0.2
0.4
0.6
0.8
1
Pre-Stress300th Shot
Diameter Inteference (µm)
Sta
ssi S
tress R
ati
o
20 40 60 80 1000
10
20
30
40
50
Core (Pre-Stress)
Cover (Pre-Stress)
Diameter Inteference (µm)
Pre
ssu
re (
bar)
Parametric Study of Interference
Contact loss
Safety Factor=1.28
Safety Factor=1.06
KkW/m 40 2Contacth
Fatigue?
11
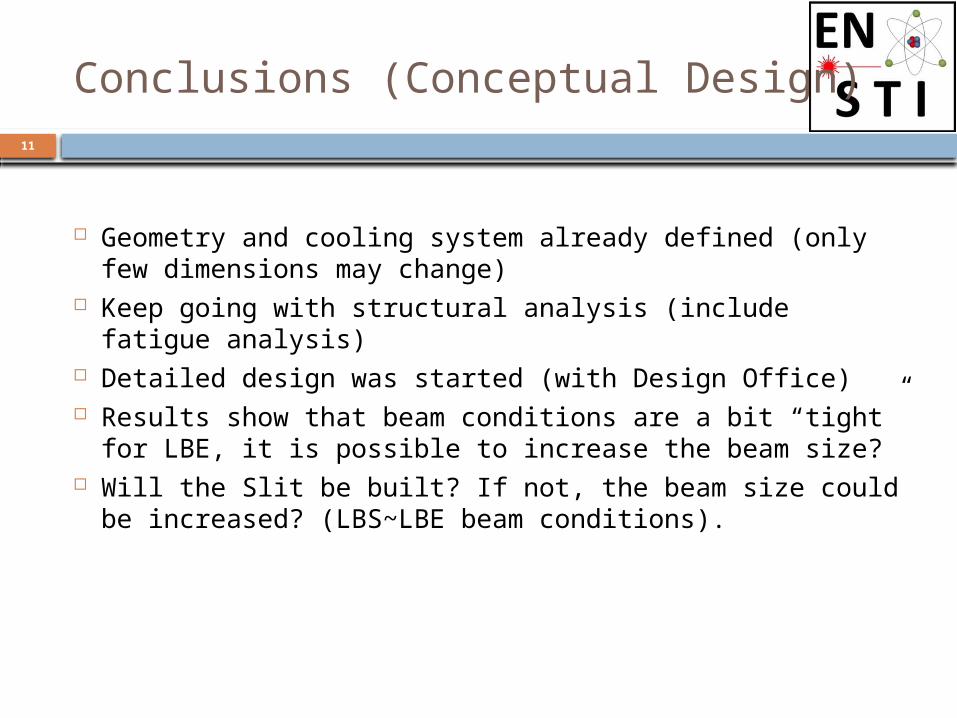
Geometry and cooling system already defined (only few dimensions may change)
Keep going with structural analysis (include fatigue analysis)
Detailed design was started (with Design Office) Results show that beam conditions are a bit “tight” for
LBE, it is possible to increase the beam size? Will the Slit be built? If not, the beam size could be
increased? (LBS~LBE beam conditions).
Conclusions (Conceptual Design)
OPEN ISSUES
13
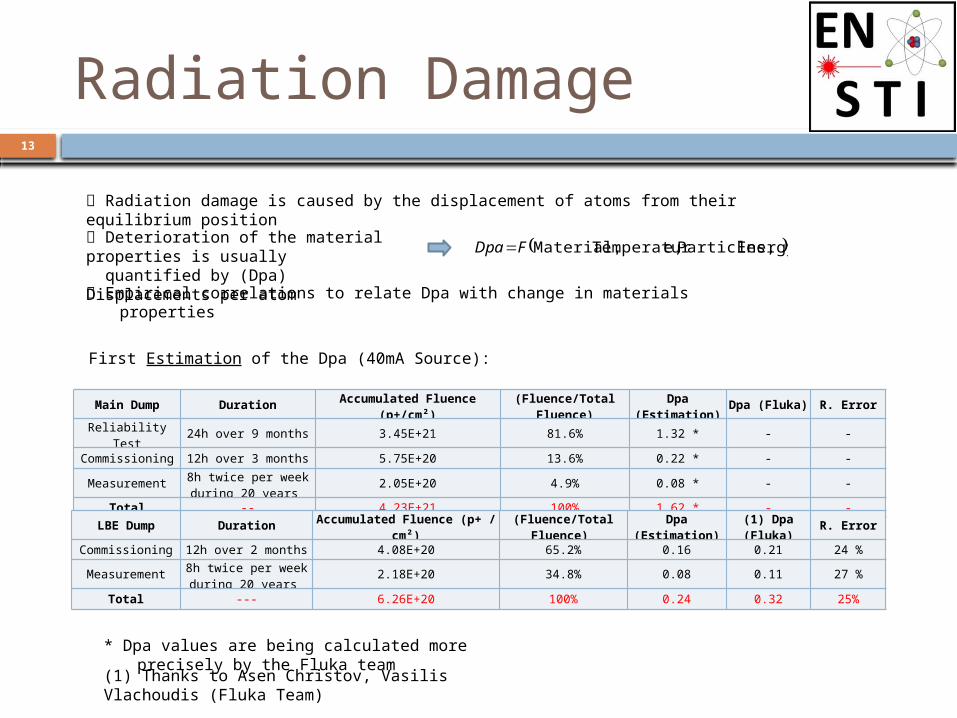
Radiation Damage
Empirical correlations to relate Dpa with change in materials properties
Energy Particles, e,Temperatur Material,FDpa
Radiation damage is caused by the displacement of atoms from their equilibrium position
Main Dump DurationAccumulated Fluence
(p+/cm²)(Fluence/Total
Fluence)Dpa
(Estimation)Dpa (Fluka) R. Error
Reliability Test 24h over 9 months 3.45E+21 81.6% 1.32 * - -
Commissioning 12h over 3 months 5.75E+20 13.6% 0.22 * - -
Measurement8h twice per week during 20 years
2.05E+20 4.9% 0.08 * - -
Total -- 4.23E+21 100% 1.62 * - -
LBE Dump DurationAccumulated Fluence (p+ /
cm²)(Fluence/Total
Fluence) Dpa
(Estimation)(1) Dpa (Fluka)
R. Error
Commissioning 12h over 2 months 4.08E+20 65.2% 0.16 0.21 24 %
Measurement8h twice per week during 20 years
2.18E+20 34.8% 0.08 0.11 27 %
Total --- 6.26E+20 100% 0.24 0.32 25%
Deterioration of the material properties is usually quantified by (Dpa) Displacements per atom
* Dpa values are being calculated more precisely by the Fluka team
First Estimation of the Dpa (40mA Source):
(1) Thanks to Asen Christov, Vasilis Vlachoudis (Fluka Team)
14
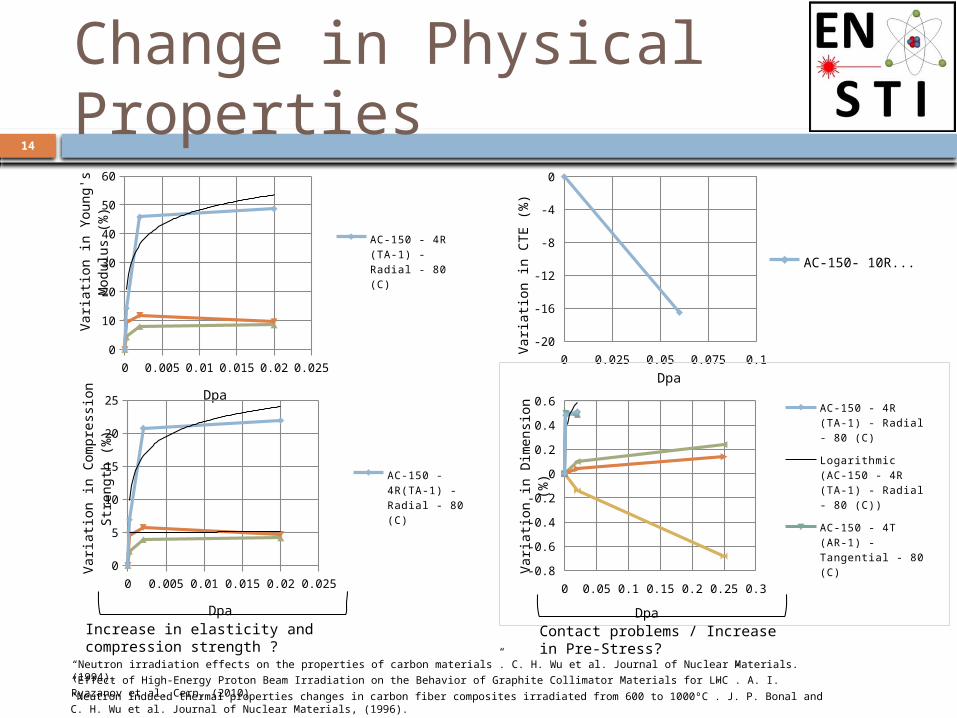
Change in Physical Properties
0 0.005 0.01 0.015 0.02 0.0250
10
20
30
40
50
60
AC-150 - 4R (TA-1) - Radial - 80 (C)
Logarithmic (AC-150 - 4R (TA-1) - Radial - 80 (C))
AC-150 - 4T(AR-1) - Tangential - 80 (C)
Dpa
Vari
ati
on in Y
oung's
Modulu
s (%
)
0 0.025 0.05 0.075 0.1-20
-16
-12
-8
-4
0
AC-150- 10R (TA-1) - Radial - 80 ...
Dpa
Vari
ati
on in C
TE (
%)
0 0.005 0.01 0.015 0.02 0.0250
5
10
15
20
25
AC-150 - 4R(TA-1) - Radial - 80 (C)
Logarithmic (AC-150 - 4R(TA-1) - Radial - 80 (C))
Dpa
Vari
ati
on in C
om
pre
ssio
n
Str
ength
(%
)
0 0.05 0.1 0.15 0.2 0.25 0.3-0.8
-0.6
-0.4
-0.2
0
0.2
0.4
0.6 AC-150 - 4R (TA-1) - Radial - 80 (C)
Logarithmic (AC-150 - 4R (TA-1) - Radial - 80 (C))
AC-150 - 4T (AR-1) - Tangential - 80 (C)
AC-150 - 4A(RT-1) - Axial - 80 (C)
IG-110U - 200 (C)
ETP-10 - 200 (C)
GC-30 - 200 (C)
Dpa
Vari
ati
on in D
imensi
on (
%)
Contact problems / Increase in Pre-Stress?
Increase in elasticity and compression strength ?
“Neutron irradiation effects on the properties of carbon materials”. C. H. Wu et al. Journal of Nuclear Materials. (1994).
“Neutron induced thermal properties changes in carbon fiber composites irradiated from 600 to 1000ºC”. J. P. Bonal and C. H. Wu et al. Journal of Nuclear Materials, (1996).
“Effect of High-Energy Proton Beam Irradiation on the Behavior of Graphite Collimator Materials for LHC”. A. I. Ryazanov et al. Cern, (2010)

15
Change in Physical Properties
0.00001 0.0001 0.001 0.01 0.1 1 100
0.2
0.4
0.6
0.8
1
1.2
AC-150 - 4R(TA-1) - 80 (C)
Logarithmic (AC-150 - 4R(TA-1) - 80 (C))
IG-110U - 200 (C)
ETP-10 - 200 (C)
GC-30 - 200 (C)
FMI 40 - 400 (C)
A05 - Parallel - 400 (C)
5890 Graphite - 400 (C)
A05 - Perpendicular - 400 (C)
DMS 678 - 400 (C)
Polygranular graphite - 500 (C)
Dpa
Therm
al C
onduct
ivit
y Irr
adia
ted / T
herm
al C
onduc-
tivit
y U
n-i
rradia
ted
80-200 C˚
400 C˚
500 C˚
Measurement
Measurement + Commissioning
Measurement + Commissioning + Reliability
Main dump
Measurement
Measurement + Commissioning
LBE dump
If Thermal Conductivity
Temperature
Stresses Creep
Risk of failure
Same references as in the previous slide
16
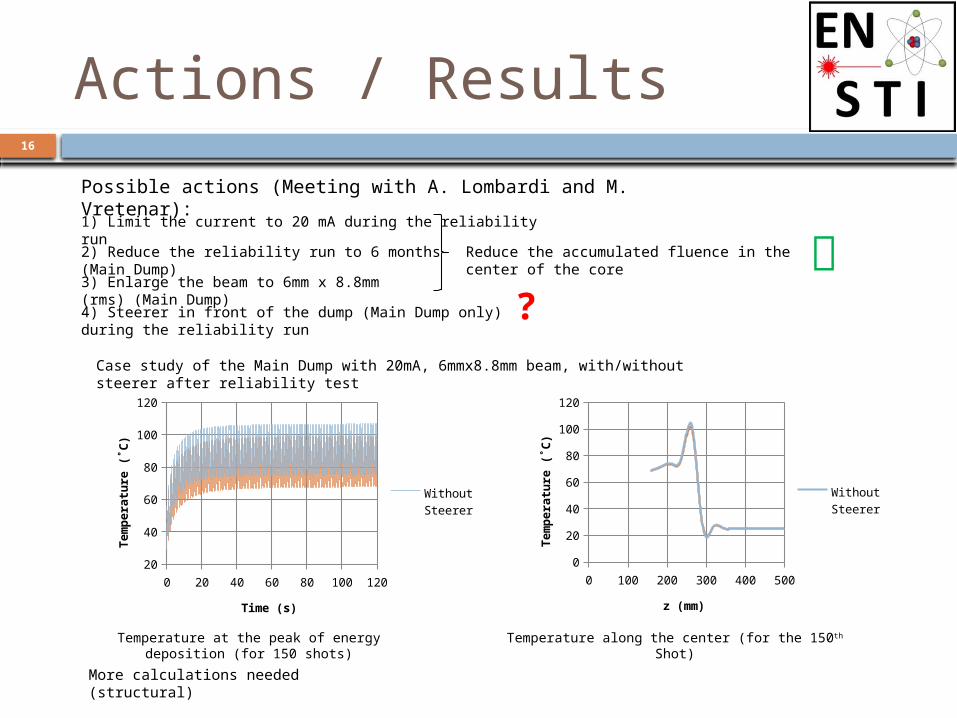
Actions / Results
Possible actions (Meeting with A. Lombardi and M. Vretenar):
3) Enlarge the beam to 6mm x 8.8mm (rms) (Main Dump)
1) Limit the current to 20 mA during the reliability run
2) Reduce the reliability run to 6 months (Main Dump)
Reduce the accumulated fluence in the center of the core
4) Steerer in front of the dump (Main Dump only) during the reliability run
0 20 40 60 80 100 12020
40
60
80
100
120
Without SteererWith Steerer
Time (s)
Tem
pera
ture
(˚C
)
0 100 200 300 400 5000
20
40
60
80
100
120
Without SteererWith Steerer
z (mm)
Tem
pera
ture
(˚C
)
Temperature at the peak of energy deposition (for 150 shots)
Temperature along the center (for the 150th Shot)
Case study of the Main Dump with 20mA, 6mmx8.8mm beam, with/without steerer after reliability test
?
More calculations needed (structural)
17
Conclusions (Open Issues)
Presented radiation damage study is only a estimative, but indicates possible problems in the future.
Proposed actions should be taken, but the question “Steerer or not” still remains open (more detailed study?)
Should the Main Dump be changed after reliability test and commission? Or wait until (if) it breaks?
Should the Main Dump and its spare be placed inside the shielding and a “changing” mechanism foreseen? Instead of expose technicians to high dose rates?
THANK YOU
Ivo Leitão – Linac4 BCC Meeting – 24/11/2011