Embed Size (px)
Citation preview
Lindeman 1942
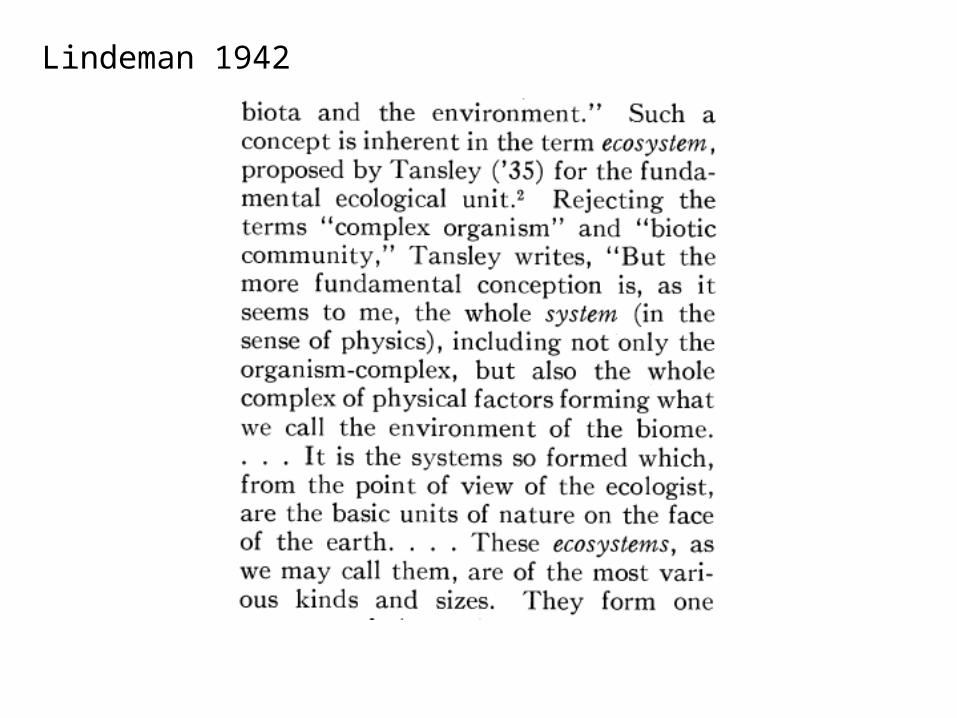
Lindeman 1942
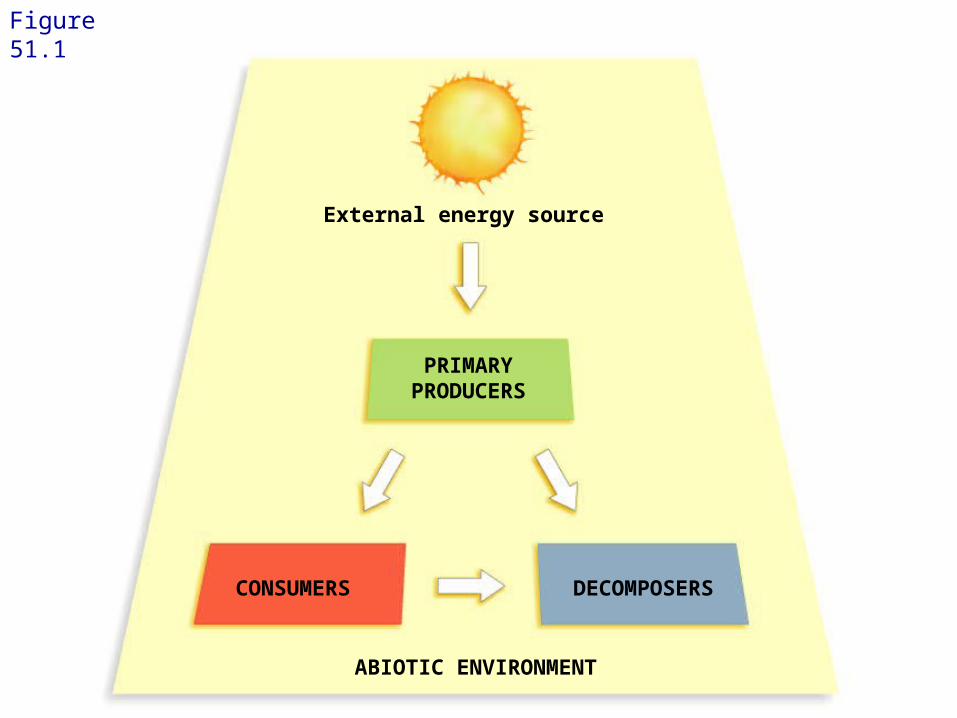
External energy source
PRIMARYPRODUCERS
CONSUMERS DECOMPOSERS
ABIOTIC ENVIRONMENT
Figure 51.1
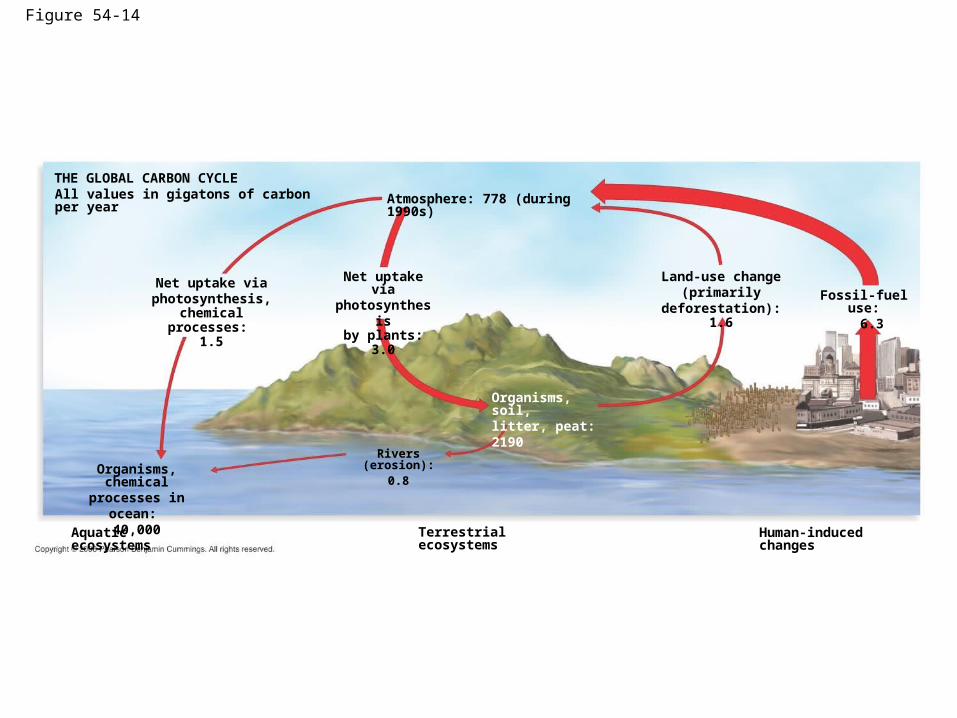
Figure 54-14
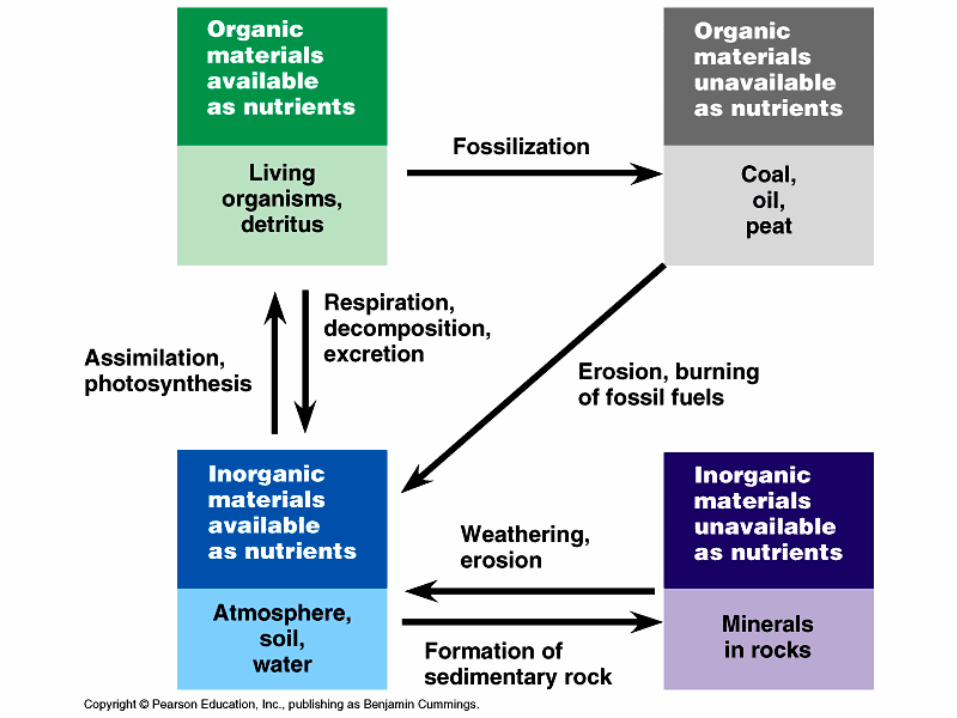
THE GLOBAL CARBON CYCLE
Organisms, chemicalprocesses in ocean:
40,000
All values in gigatons of carbon per year Atmosphere: 778 (during 1990s)
Net uptake viaphotosynthesisby plants: 3.0
Net uptake viaphotosynthesis,
chemical processes: 1.5
Rivers (erosion):0.8
Organisms, soil,litter, peat: 2190
Aquatic ecosystems Terrestrial ecosystems Human-induced changes
Land-use change(primarily deforestation):
1.6Fossil-fuel use:
6.3
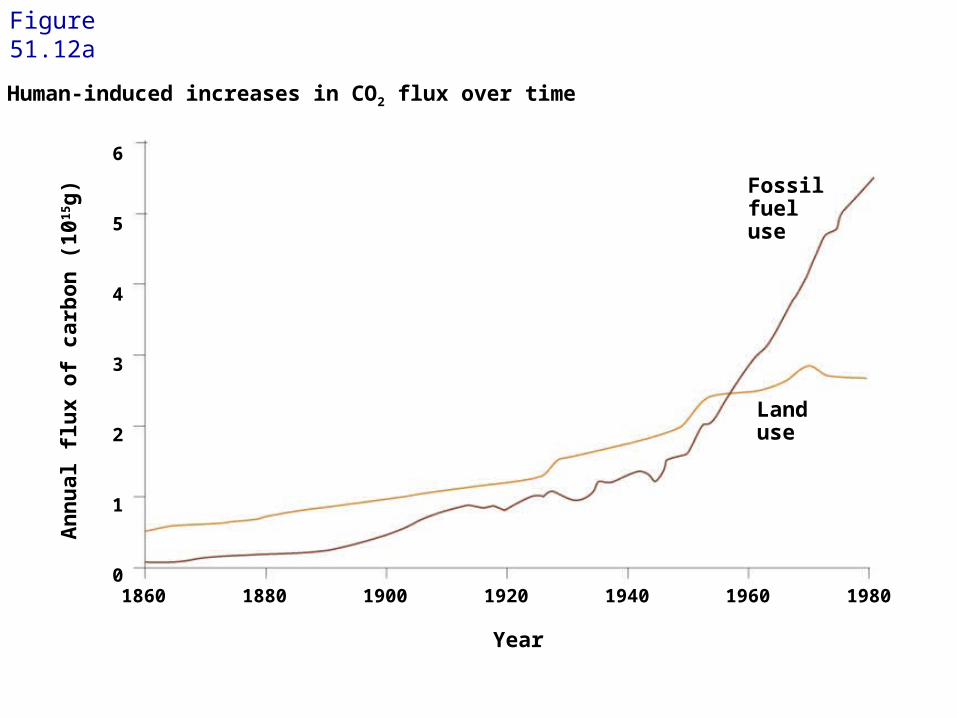
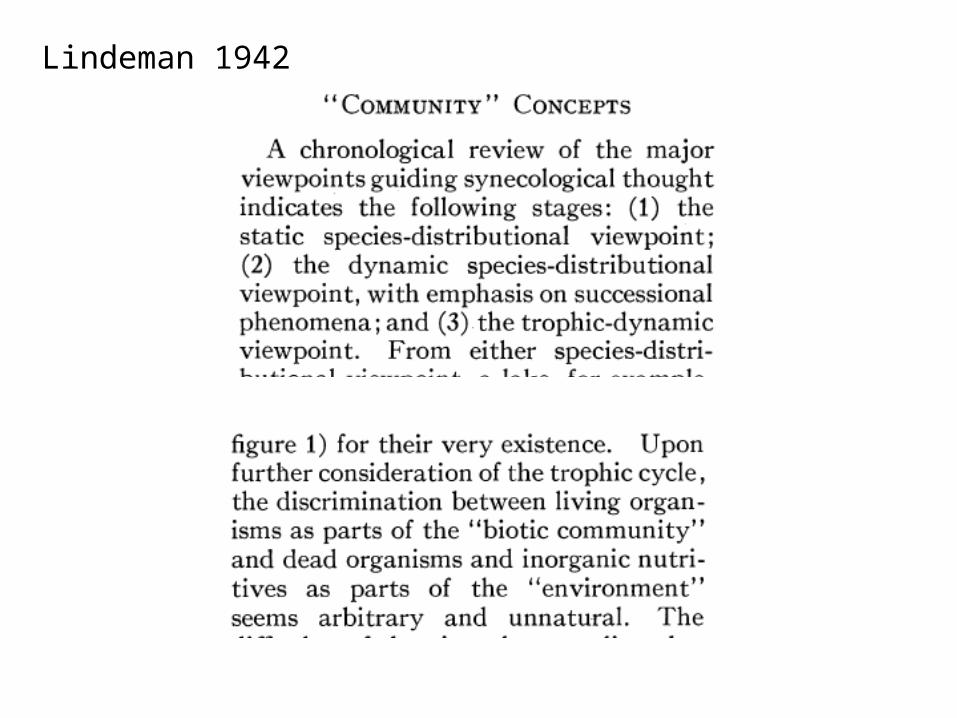
Land use
Fossil fuel use
Year
An
nu
al f
lux
of
carb
on
(10
15g
)
6
5
4
3
2
1
01860 1880 1900 1920 1940 1960 1980
Figure 51.12a
Human-induced increases in CO2 flux over time
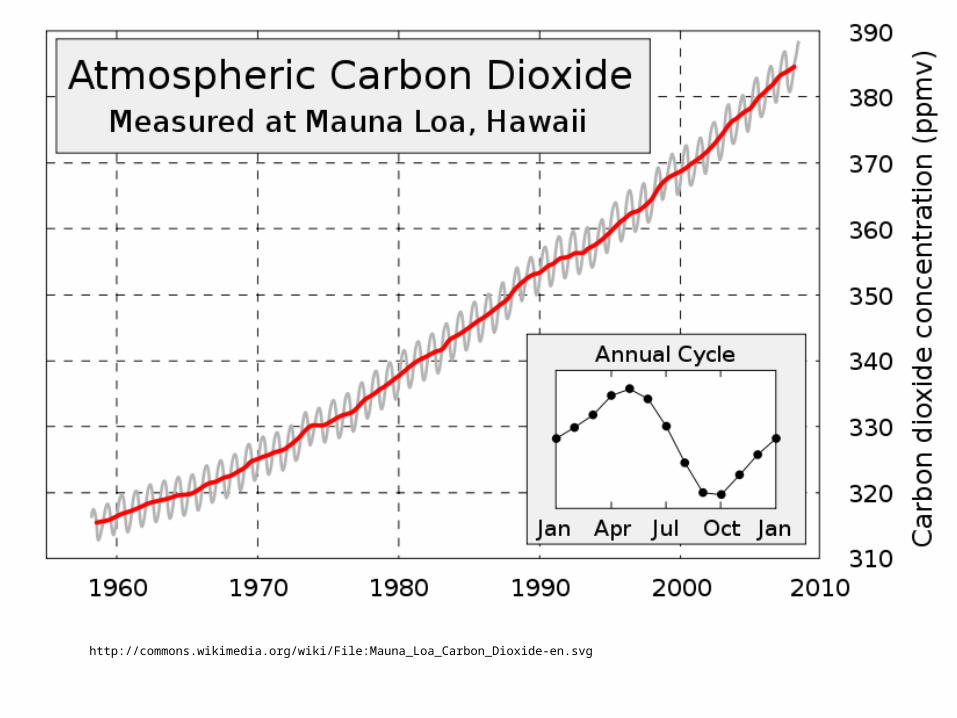
http://commons.wikimedia.org/wiki/File:Mauna_Loa_Carbon_Dioxide-en.svg
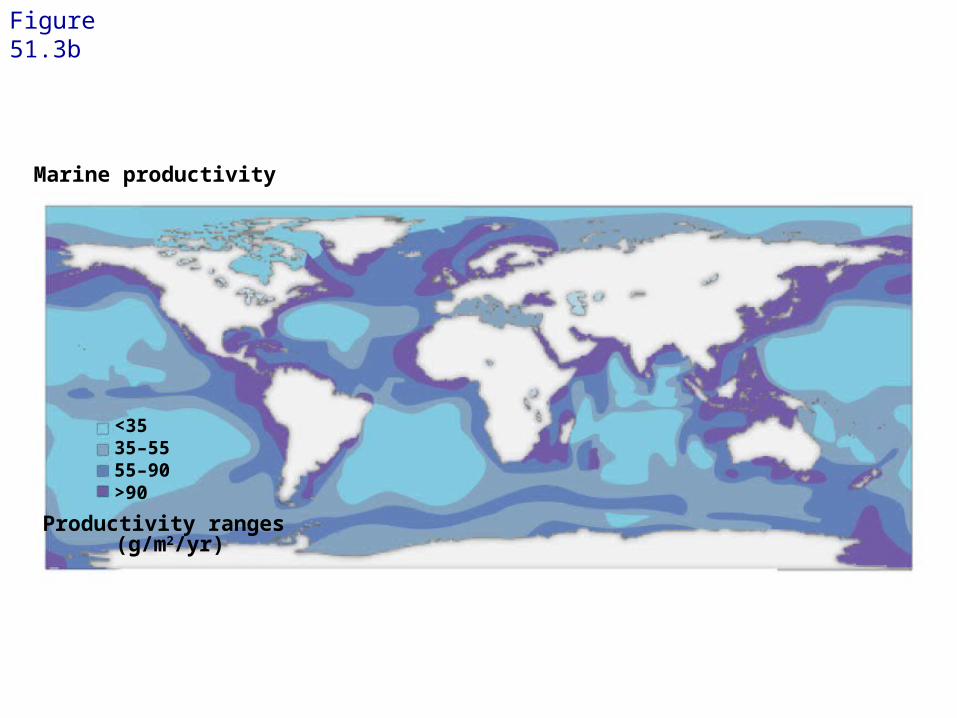
<3535–5555–90>90
Productivity ranges (g/m2/yr)
Figure 51.3b
Marine productivity
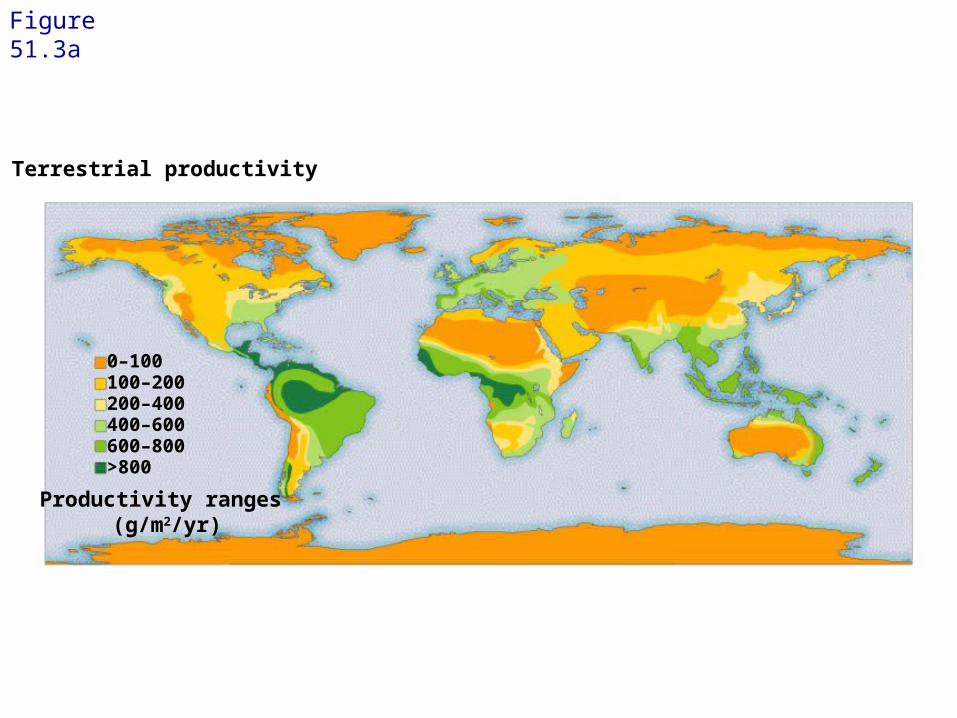
0–100100–200200–400400–600600–800>800
Productivity ranges (g/m2/yr)
Figure 51.3a
Terrestrial productivity
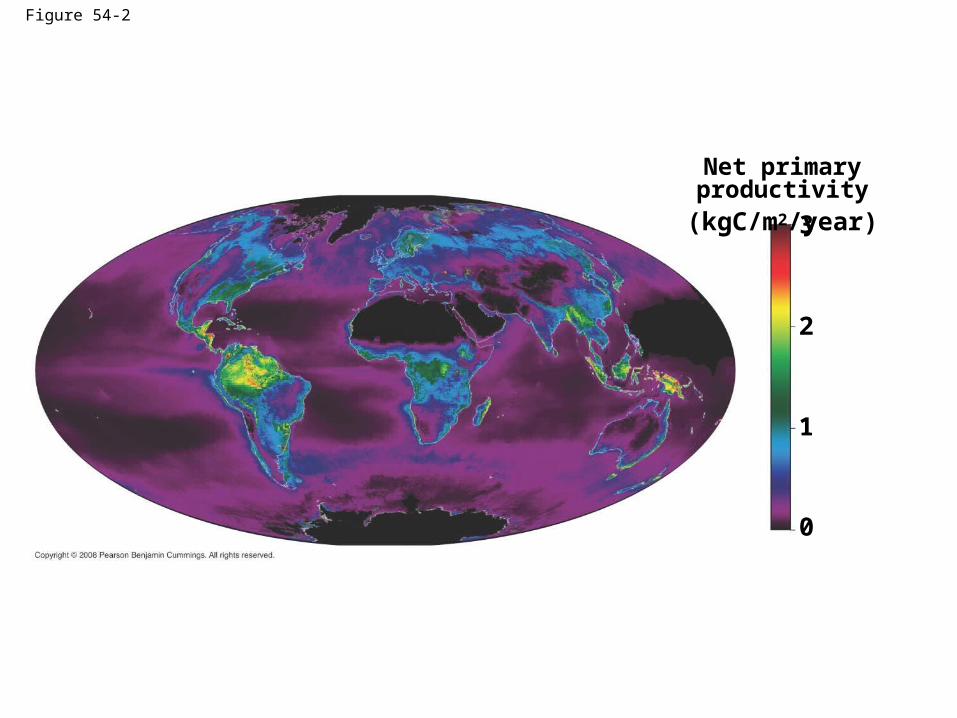
Figure 54-2
0
Net primary productivity(kgC/m2/year)
3
2
1
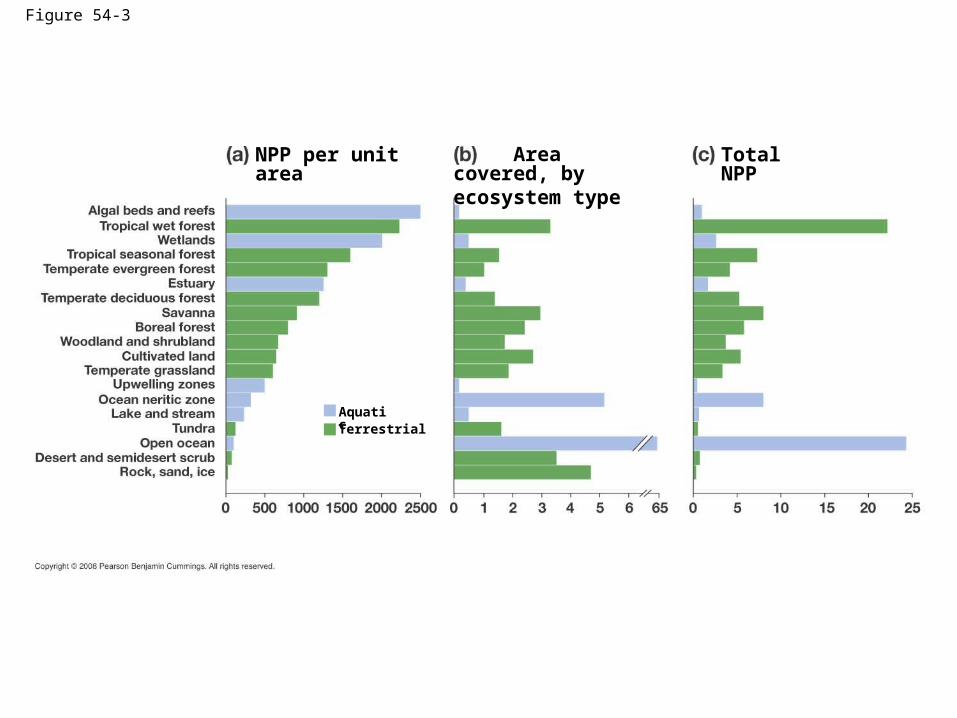
Figure 54-3
NPP per unit area Area covered, byecosystem type
Total NPP
TerrestrialAquatic
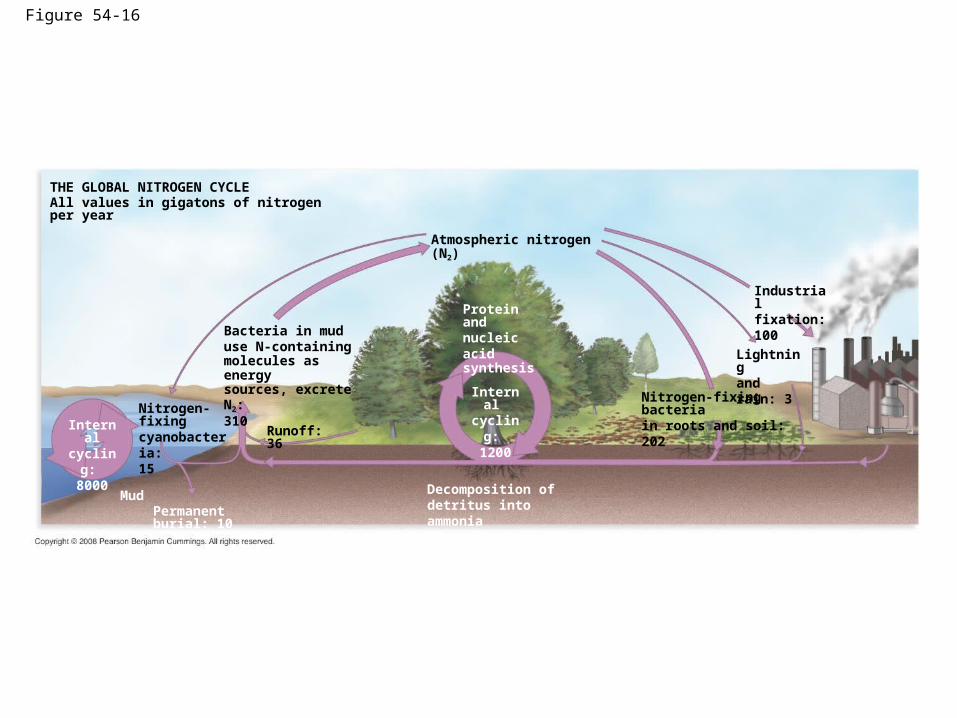
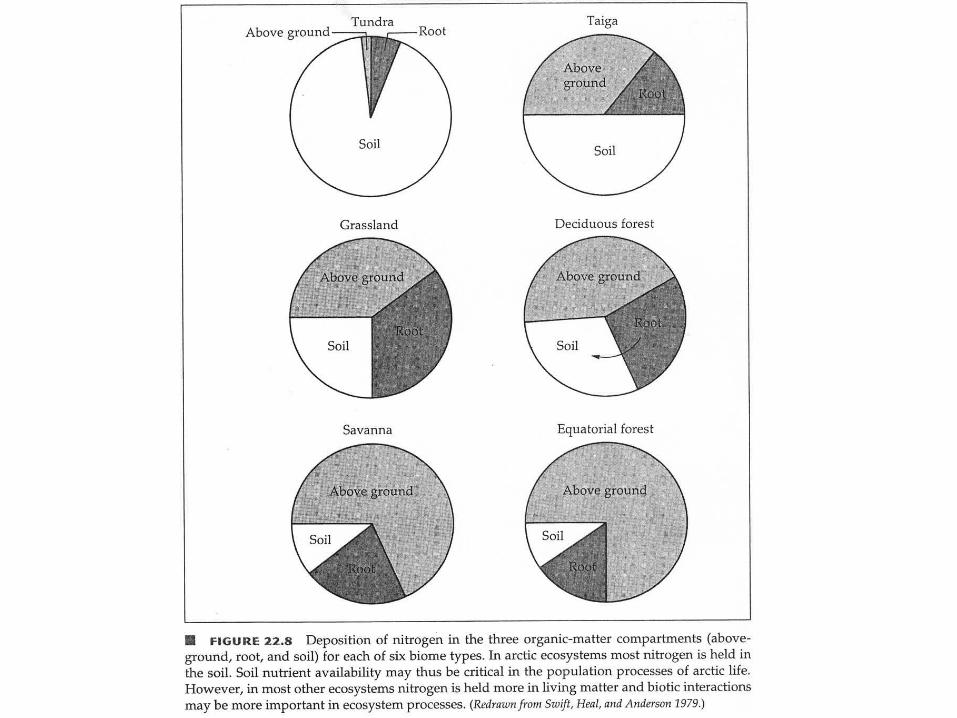
Figure 54-16
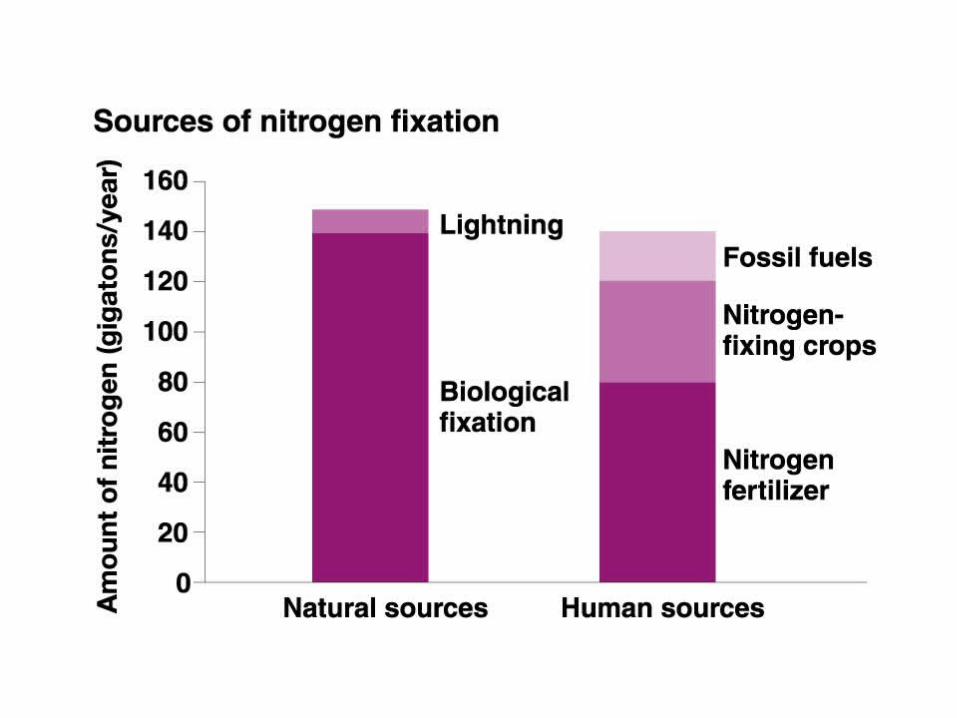
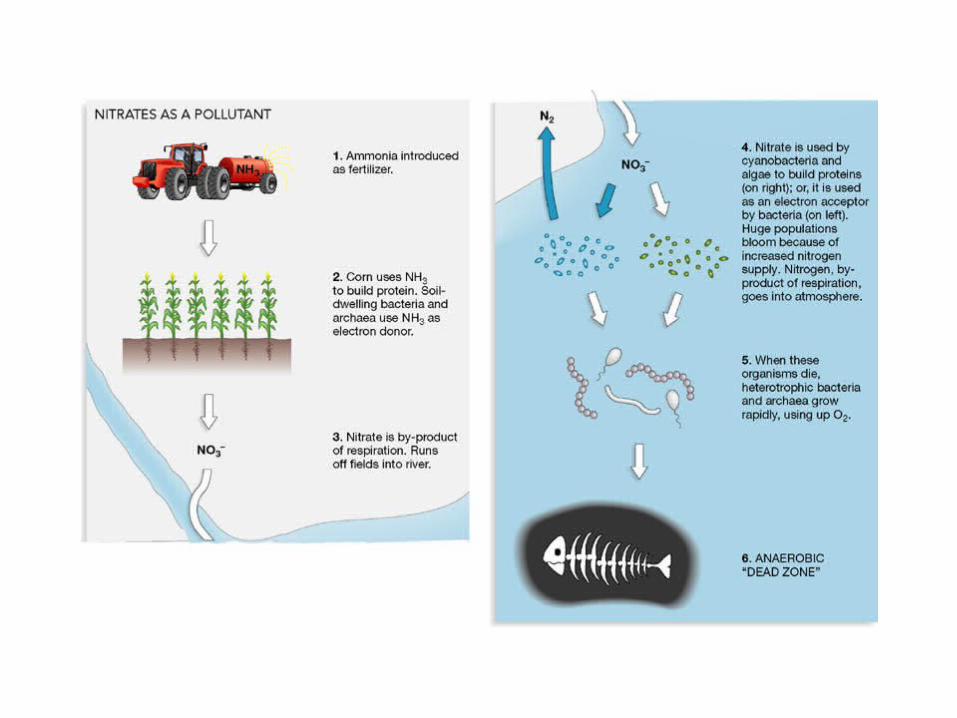
THE GLOBAL NITROGEN CYCLE
Nitrogen-fixingcyanobacteria: 15
All values in gigatons of nitrogen per year
Atmospheric nitrogen (N2)
Protein andnucleic acidsynthesis
Bacteria in muduse N-containingmolecules as energysources, excrete N2: 310
Decomposition ofdetritus into ammonia
Internal cycling:
1200
Industrialfixation: 100
Lightningand rain: 3
Internalcycling:
8000
Permanent burial: 10
Runoff: 36
Mud
Nitrogen-fixing bacteriain roots and soil: 202


![Henry Lindeman - Method for Saxophone[1]](https://img.pdfslide.net/doc/110x75/5571f32149795947648d8c23/henry-lindeman-method-for-saxophone1.jpg)