Embed Size (px)
Citation preview
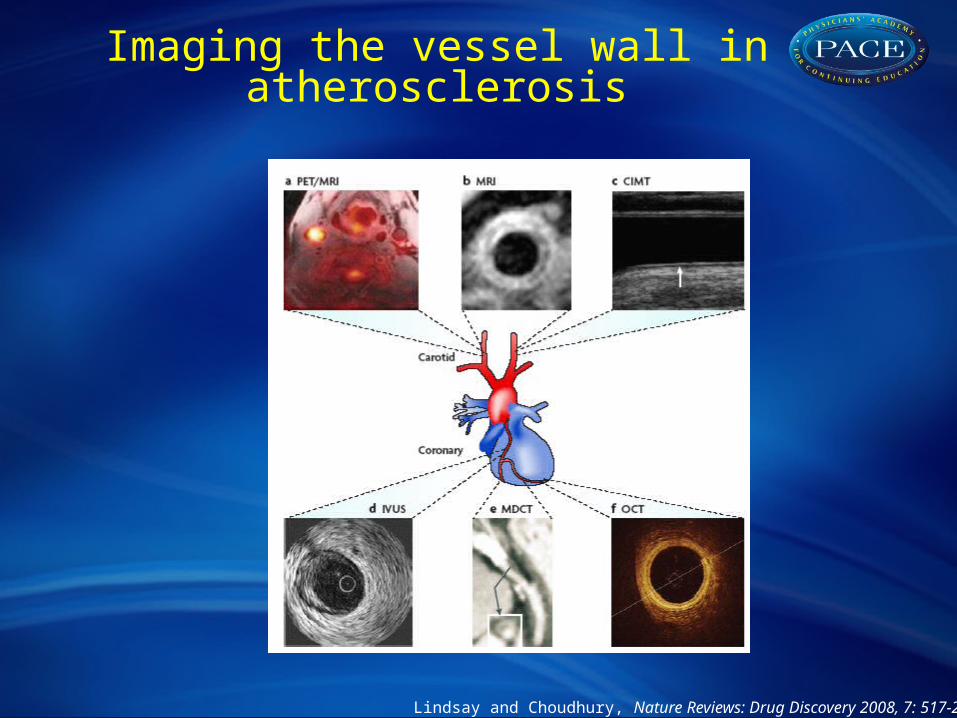
Lindsay and Choudhury, Nature Reviews: Drug Discovery 2008, 7: 517-29
Imaging the vessel wall in atherosclerosis
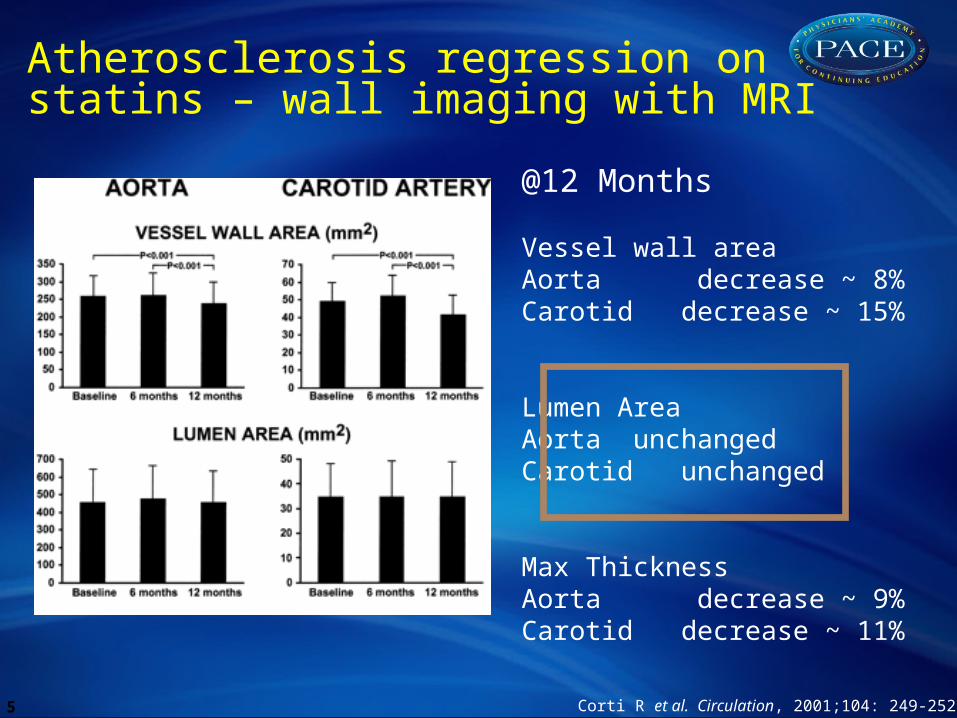
@12 Months
Vessel wall areaAorta decrease ~ 8%Carotid decrease ~ 15%
Lumen AreaAorta unchangedCarotid unchanged
Max ThicknessAorta decrease ~ 9%Carotid decrease ~ 11%
Corti R et al. Circulation, 2001;104: 249-2525
Atherosclerosis regression on statins – wall imaging with MRI
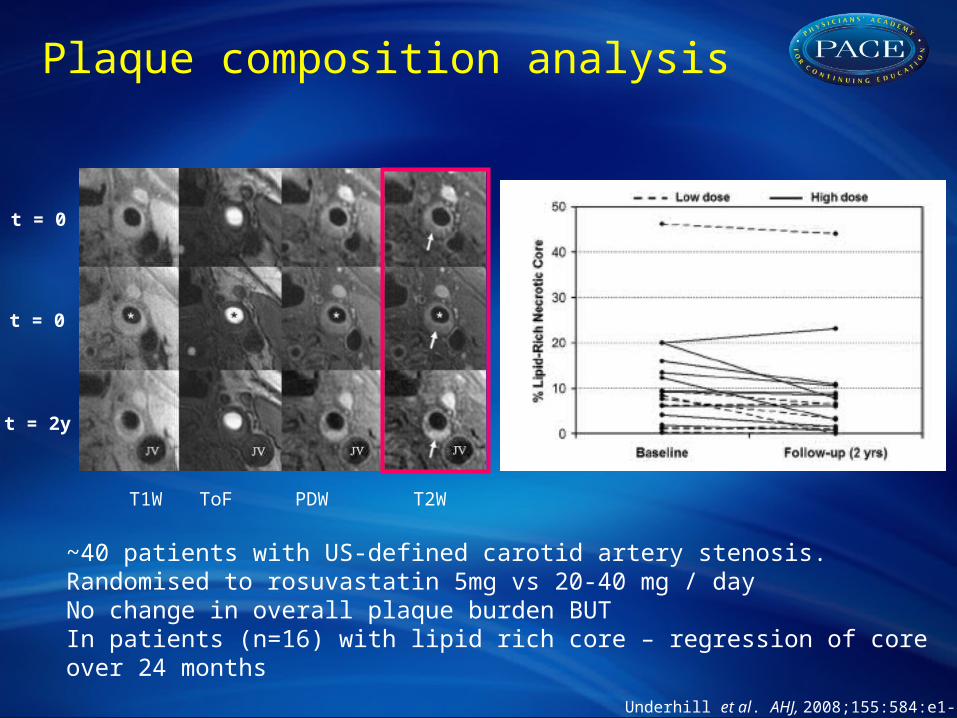
Underhill et al. AHJ, 2008;155:584:e1-8
T1W ToF PDW T2W
t = 0
t = 0
t = 2y
~40 patients with US-defined carotid artery stenosis. Randomised to rosuvastatin 5mg vs 20-40 mg / dayNo change in overall plaque burden BUTIn patients (n=16) with lipid rich core – regression of core over 24 months
Plaque composition analysis
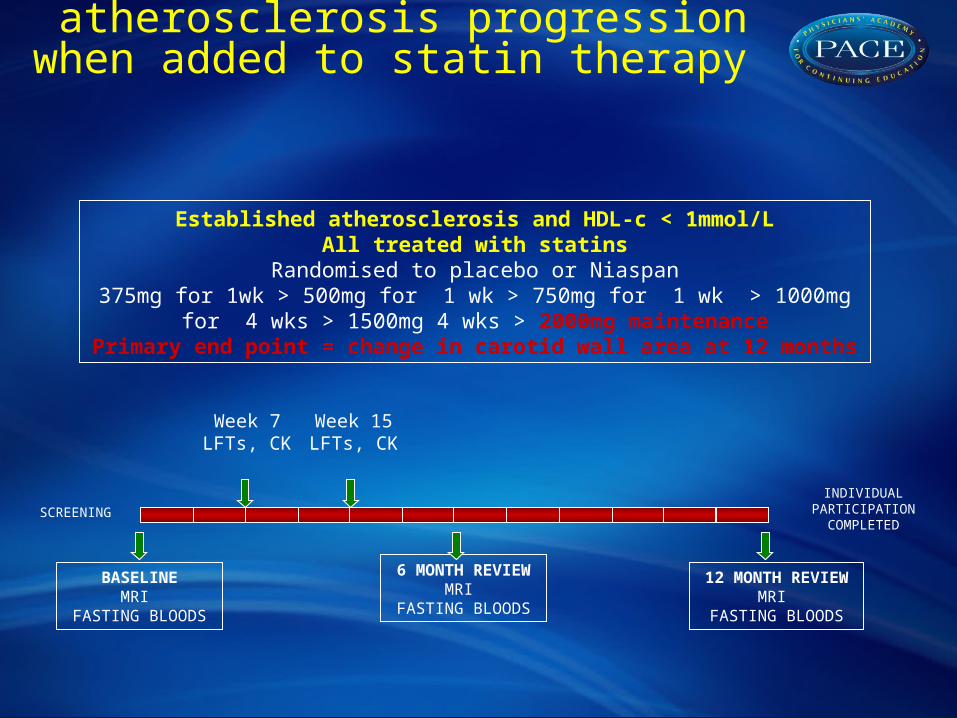
SCREENING
INDIVIDUALPARTICIPATION
COMPLETED
Established atherosclerosis and HDL-c < 1mmol/LAll treated with statins
Randomised to placebo or Niaspan375mg for 1wk > 500mg for 1 wk > 750mg for 1 wk > 1000mg for 4 wks >
1500mg 4 wks > 2000mg maintenancePrimary end point = change in carotid wall area at 12 months
6 MONTH REVIEWMRI
FASTING BLOODS
12 MONTH REVIEWMRI
FASTING BLOODS
Week 7LFTs, CK
Week 15LFTs, CK
BASELINEMRI
FASTING BLOODS
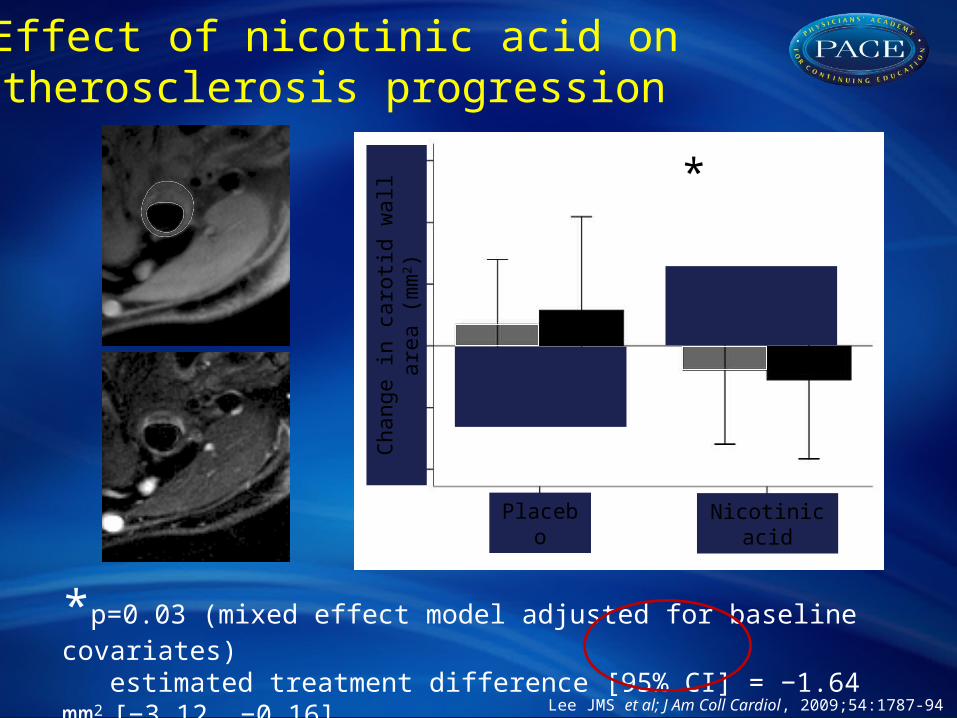
Effect of nicotinic acid on atherosclerosis progression when added to statin therapy
Placebo Nicotinic acid
Cha
nge
in c
arot
id w
all a
rea
(mm
2 ) *
*p=0.03 (mixed effect model adjusted for baseline covariates)estimated treatment difference [95% CI] = −1.64 mm2 [−3.12, −0.16]
Lee JMS et al; J Am Coll Cardiol, 2009;54:1787-94
Effect of nicotinic acid on atherosclerosis progression
TBR >1.6-inflammation
presentby a central
core lab
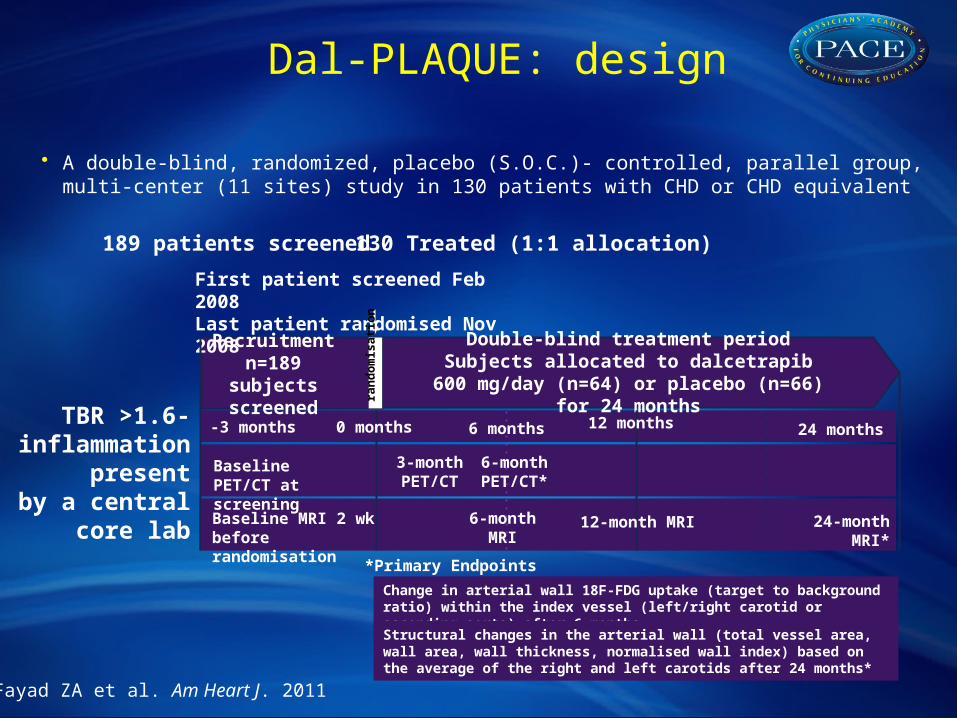
• A double-blind, randomized, placebo (S.O.C.)- controlled, parallel group,multi-center (11 sites) study in 130 patients with CHD or CHD equivalent
Fayad ZA et al. Am Heart J. 2011
130 Treated (1:1 allocation)189 patients screened
Recruitmentn=189 subjects
screened
Double-blind treatment periodSubjects allocated to dalcetrapib 600 mg/day
(n=64) or placebo (n=66) for 24 months
24-month MRI*6-month MRI
3-month PET/CT
Baseline PET/CT at screening
*Primary Endpoints
24 months -3 months
First patient screened Feb 2008Last patient randomised Nov 2008
Change in arterial wall 18F-FDG uptake (target to background ratio) within the index vessel (left/right carotid or ascending aorta) after 6 months
Structural changes in the arterial wall (total vessel area, wall area, wall thickness, normalised wall index) based on the average of the right and left carotids after 24 months*
6-month PET/CT*
Baseline MRI 2 wk before randomisation
0 months 6 months
ran
do
mis
ati
on
12-month MRI
12 months
Dal-PLAQUE: design
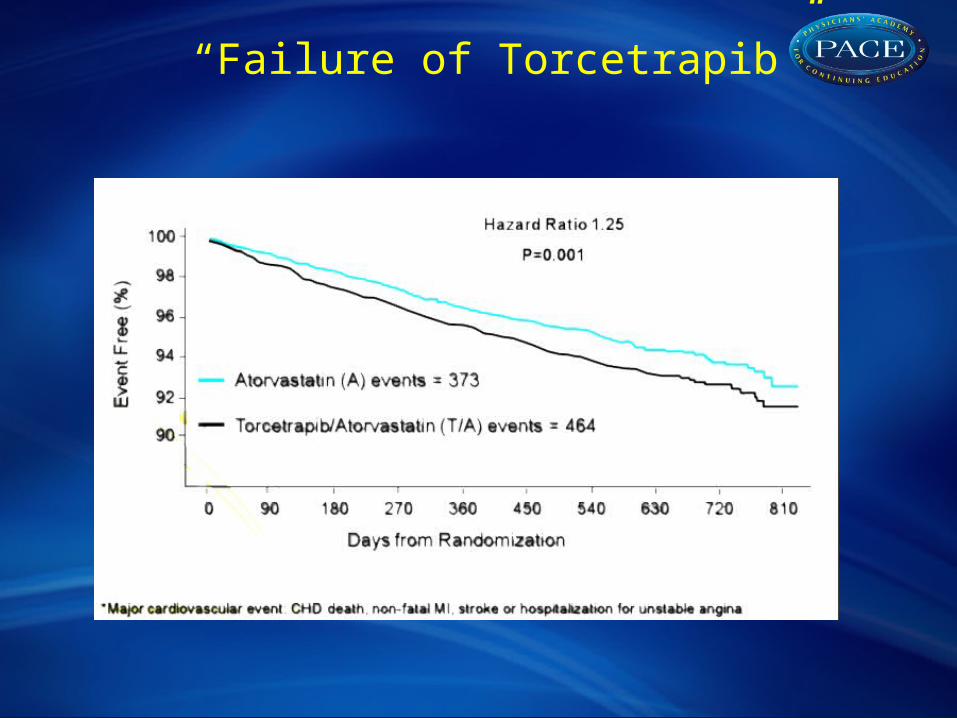
“Failure of Torcetrapib”
VariablePlacebo
(N=65)
Dalcetrapib
(N=63)
Absolute change vs placebo (90%
CI)
P value
No-harm boundary*
*
MRI, mean* (SE)†
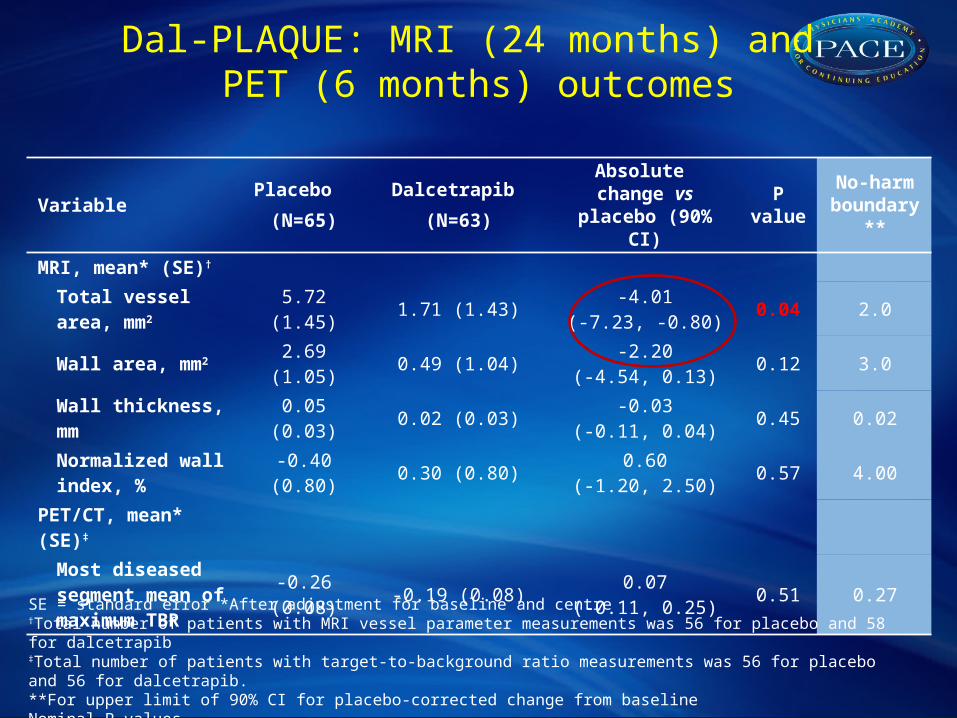
Total vessel area, mm2 5.72 (1.45) 1.71 (1.43)
-4.01(-7.23, -0.80)
0.04 2.0
Wall area, mm2 2.69 (1.05) 0.49 (1.04)-2.20
(-4.54, 0.13)0.12 3.0
Wall thickness, mm 0.05 (0.03) 0.02 (0.03)-0.03
(-0.11, 0.04)0.45 0.02
Normalized wall index, %
-0.40 (0.80) 0.30 (0.80)0.60
(-1.20, 2.50)0.57 4.00
PET/CT, mean* (SE)‡
Most diseased segment mean of maximum TBR
-0.26 (0.08) -0.19 (0.08)0.07
(-0.11, 0.25)0.51 0.27
SE = standard error *After adjustment for baseline and centre†Total number of patients with MRI vessel parameter measurements was 56 for placebo and 58 for dalcetrapib‡Total number of patients with target-to-background ratio measurements was 56 for placebo and 56 for dalcetrapib.**For upper limit of 90% CI for placebo-corrected change from baselineNominal P-values
Dal-PLAQUE: MRI (24 months) and PET (6 months) outcomes