Embed Size (px)
Citation preview
Linear Regression and Support Vector Regression
Paul Paisitkriangkrai
The University of Adelaide
24 October 2012
Outlines
• Regression overview
• Linear regression
• Support vector regression
• Machine learning tools available
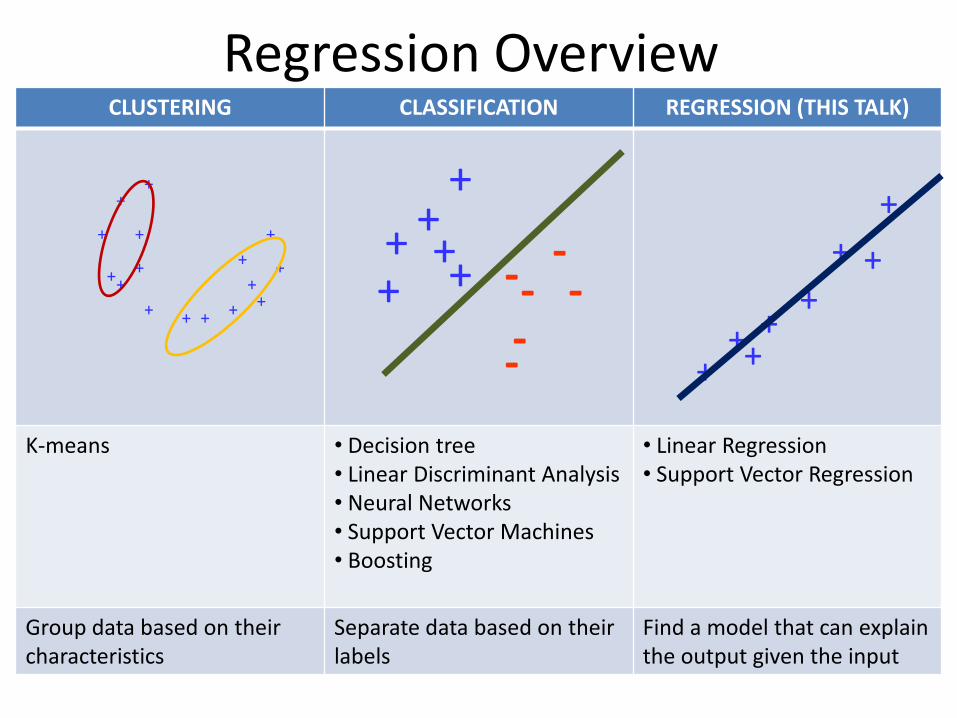
Regression OverviewCLUSTERING CLASSIFICATION REGRESSION (THIS TALK)
K-means • Decision tree• Linear Discriminant Analysis• Neural Networks• Support Vector Machines• Boosting
• Linear Regression• Support Vector Regression
Group data based on their characteristics
Separate data based on their labels
Find a model that can explain the output given the input
+
+
+
+ ++
+
+
++
+++
+
++
+ +
+ ++
+
----
--
+++
++
++
+
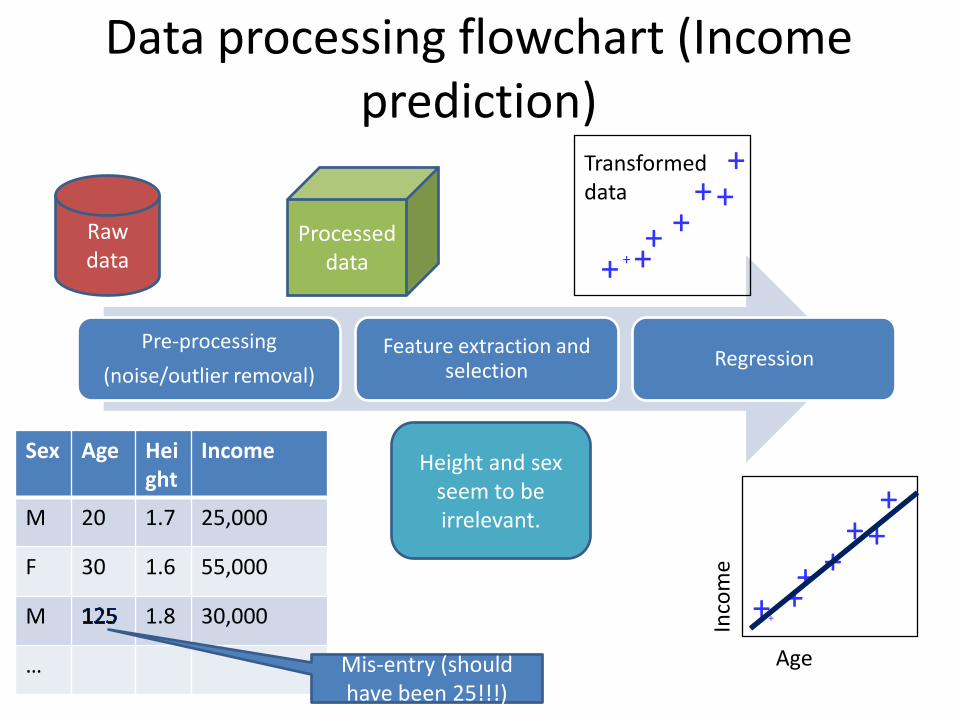
Data processing flowchart (Income prediction)
Pre-processing
(noise/outlier removal)
Feature extraction and selection
Regression
Raw data
Processed data + ++
+ ++++
Sex Age Height
Income
M 20 1.7 25,000
F 30 1.6 55,000
M 1.8 30,000
… Mis-entry (should have been 25!!!)
Height and sex seem to be irrelevant.
++++ +
+++
Age
Inco
me
Transformed data
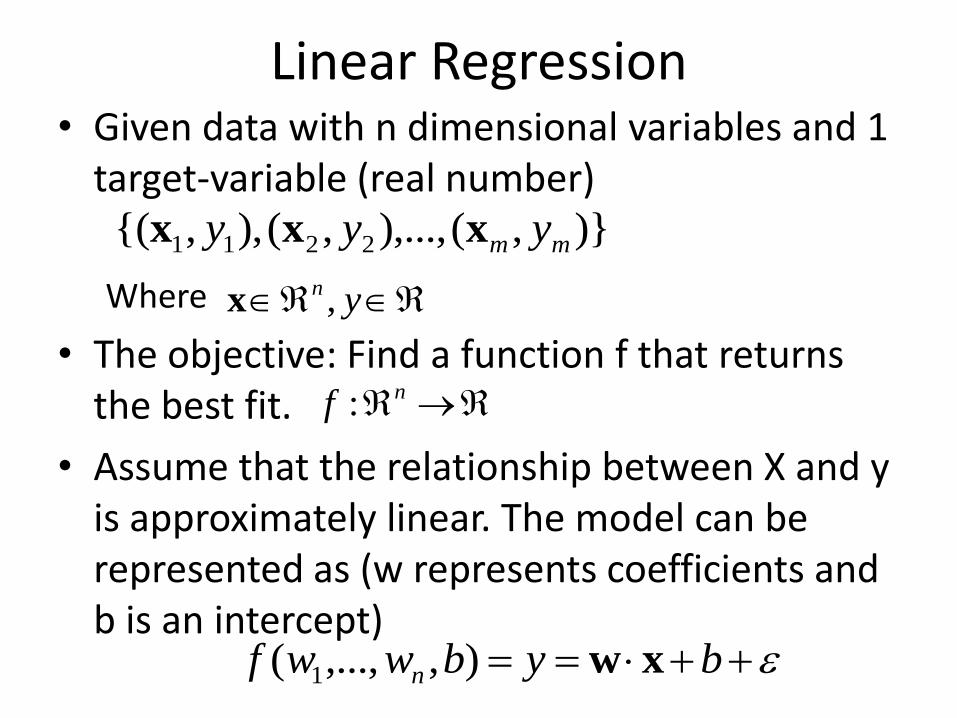
Linear Regression• Given data with n dimensional variables and 1
target-variable (real number)
Where
• The objective: Find a function f that returns the best fit.
• Assume that the relationship between X and y is approximately linear. The model can be represented as (w represents coefficients and b is an intercept)
)},(),...,,(),,{( 2211 mm yyy xxx
yn ,x
nf :
bybwwf n xw),,...,( 1
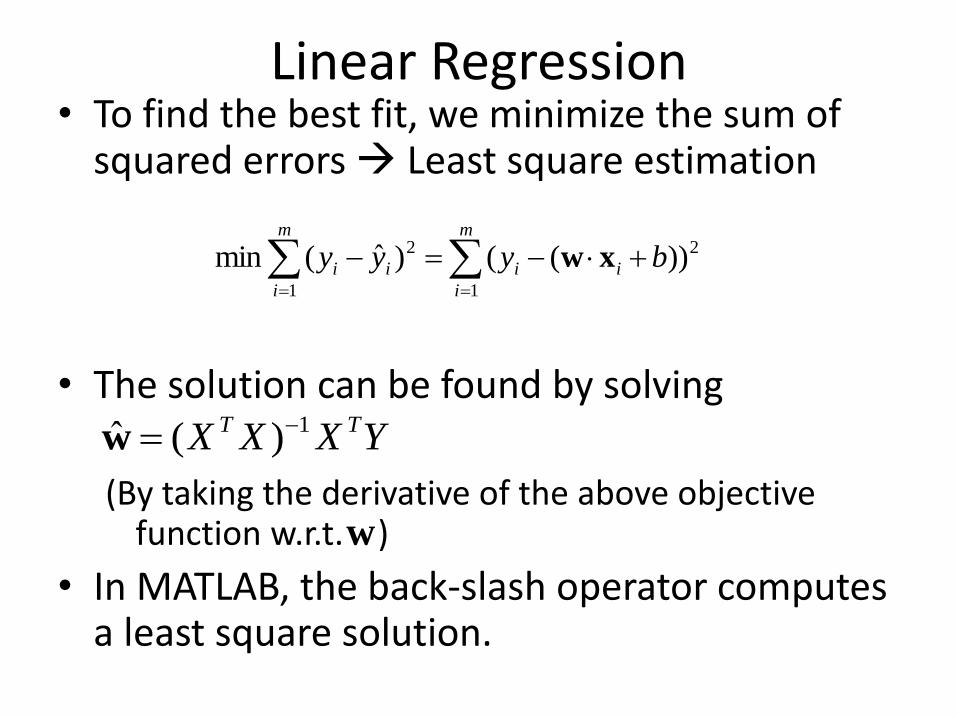
Linear Regression• To find the best fit, we minimize the sum of
squared errors Least square estimation
• The solution can be found by solving
(By taking the derivative of the above objective function w.r.t. )
• In MATLAB, the back-slash operator computes a least square solution.
m
i
ii
m
i
ii byyy1
2
1
2 ))(()ˆ(min xw
YXXX TT 1)(ˆ w
w
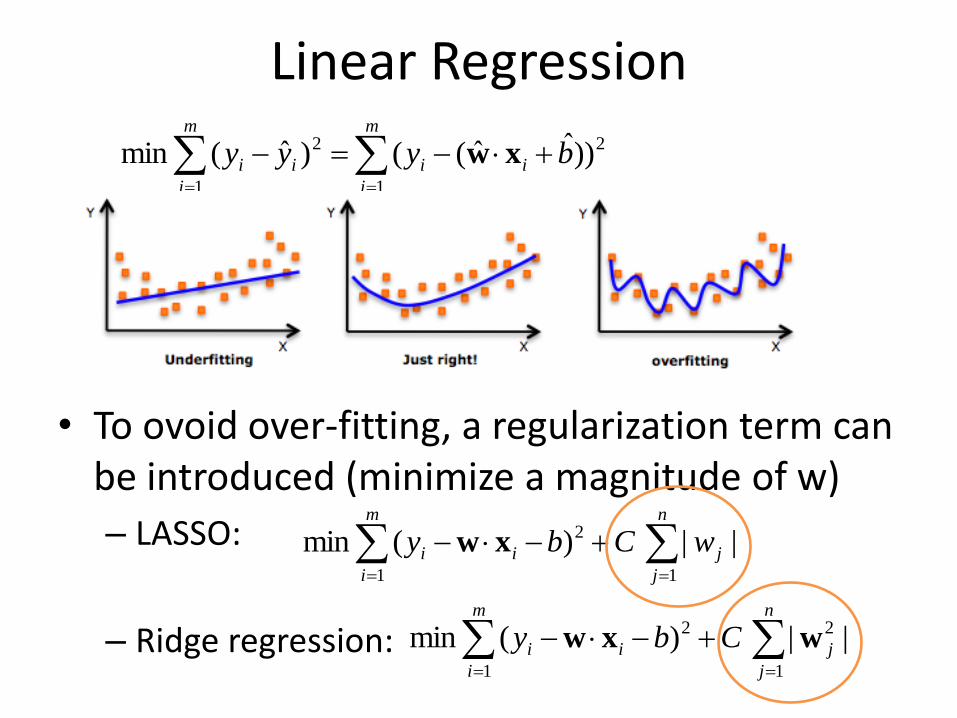
Linear Regression
• To ovoid over-fitting, a regularization term can be introduced (minimize a magnitude of w)
– LASSO:
– Ridge regression:
m
i
ii
m
i
ii byyy1
2
1
2 ))ˆˆ(()ˆ(min xw
n
j
j
m
i
ii wCby11
2 ||)(min xw
n
j
j
m
i
ii Cby1
2
1
2 ||)(min wxw
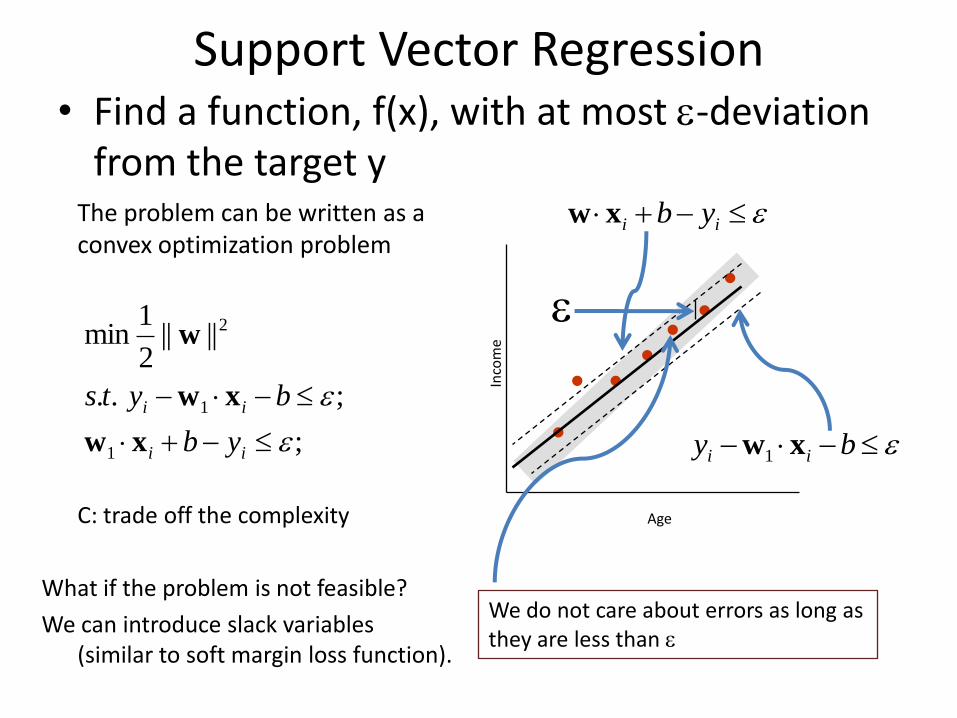
Support Vector Regression• Find a function, f(x), with at most -deviation
from the target y
Inco
me
Age
●
●
●●
●
●
●
We do not care about errors as long as they are less than
The problem can be written as a convex optimization problem
;
;..
||||2
1min
1
1
2
ii
ii
yb
byts
xw
xw
w
by ii xw1
ii ybxw
C: trade off the complexity
What if the problem is not feasible?
We can introduce slack variables (similar to soft margin loss function).
9
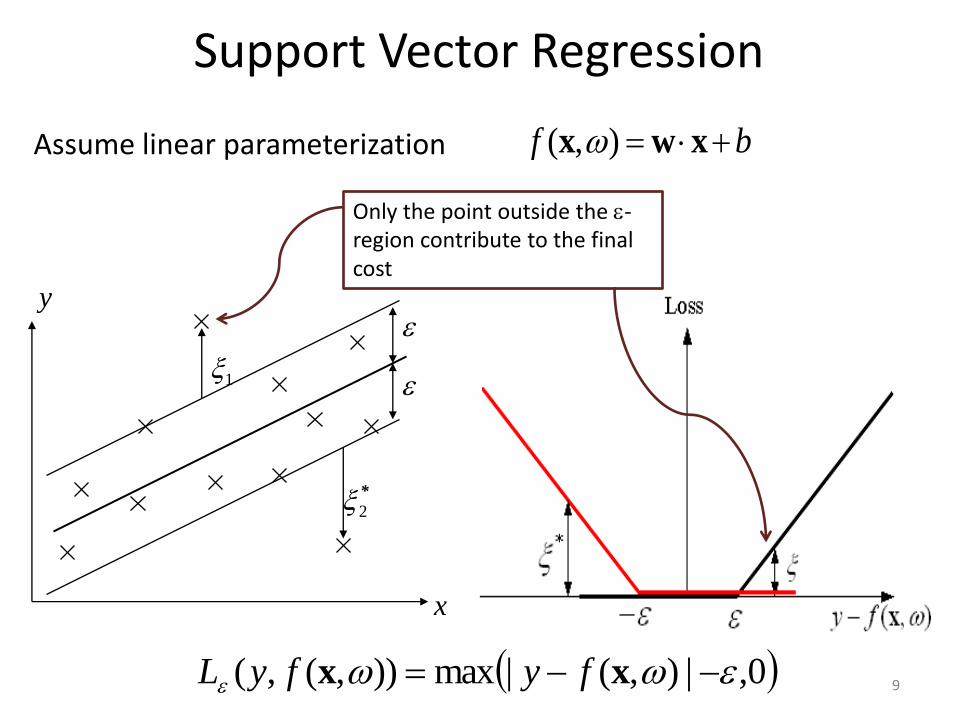
Support Vector Regression
0,|),(|max)),(,( xx fyfyL
bf xwx ),( Assume linear parameterization
x
y
*
2
1
Only the point outside the -region contribute to the final cost
10
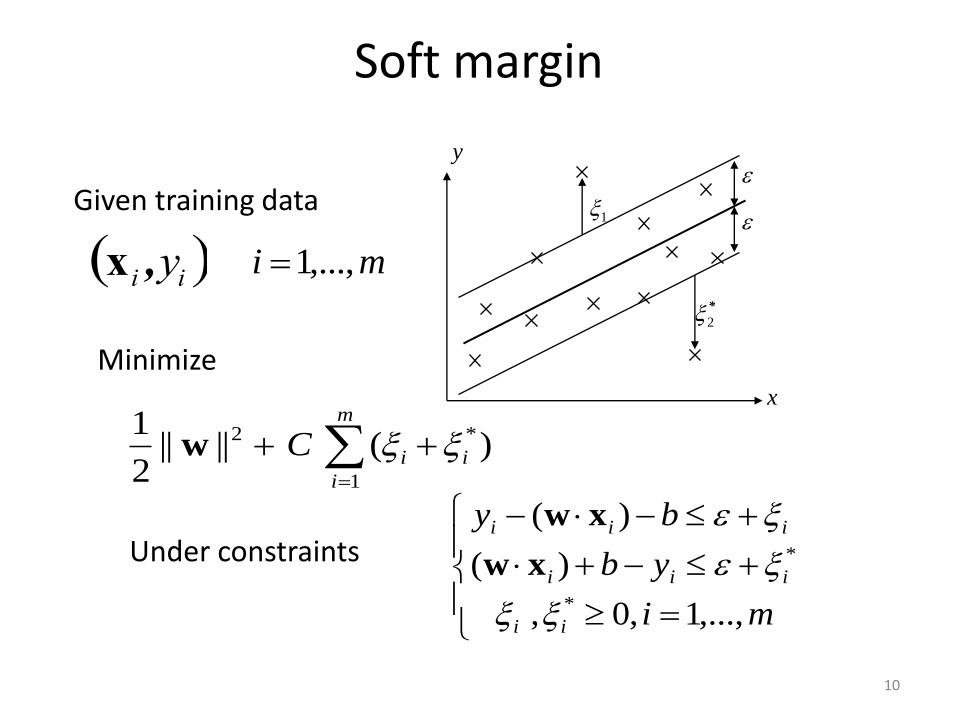
Soft margin
xi ,yi
x
y
*
2
1
Minimize
m
i
iiC1
*2 )(||||2
1w
mi
yb
by
ii
iii
iii
,...,1,0,
)(
)(
*
*
xw
xwUnder constraints
Given training data
mi ,...,1
11
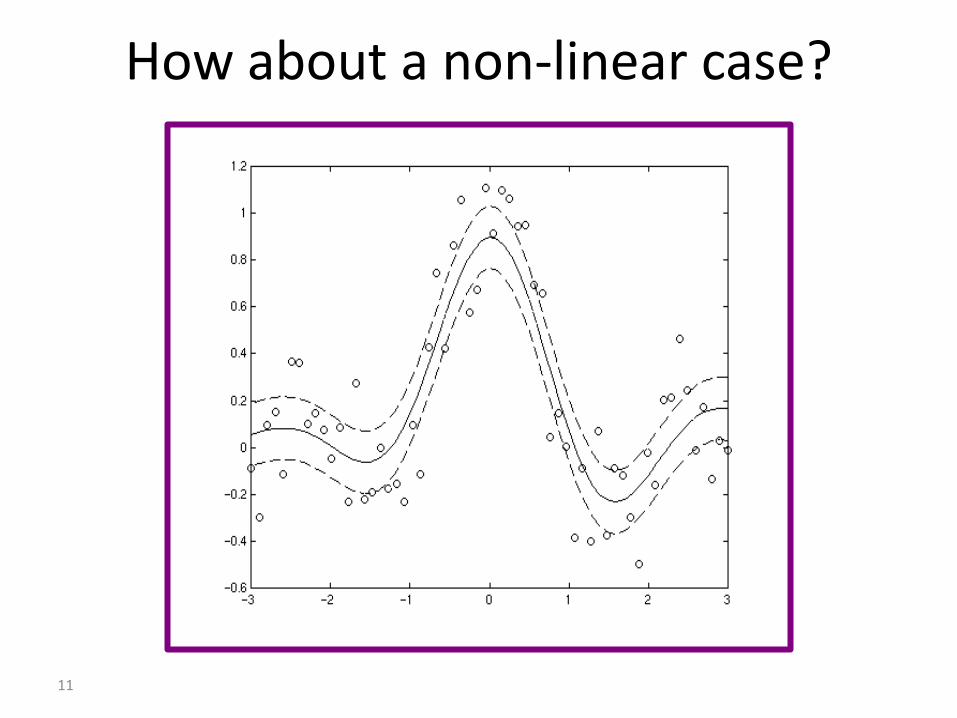
How about a non-linear case?
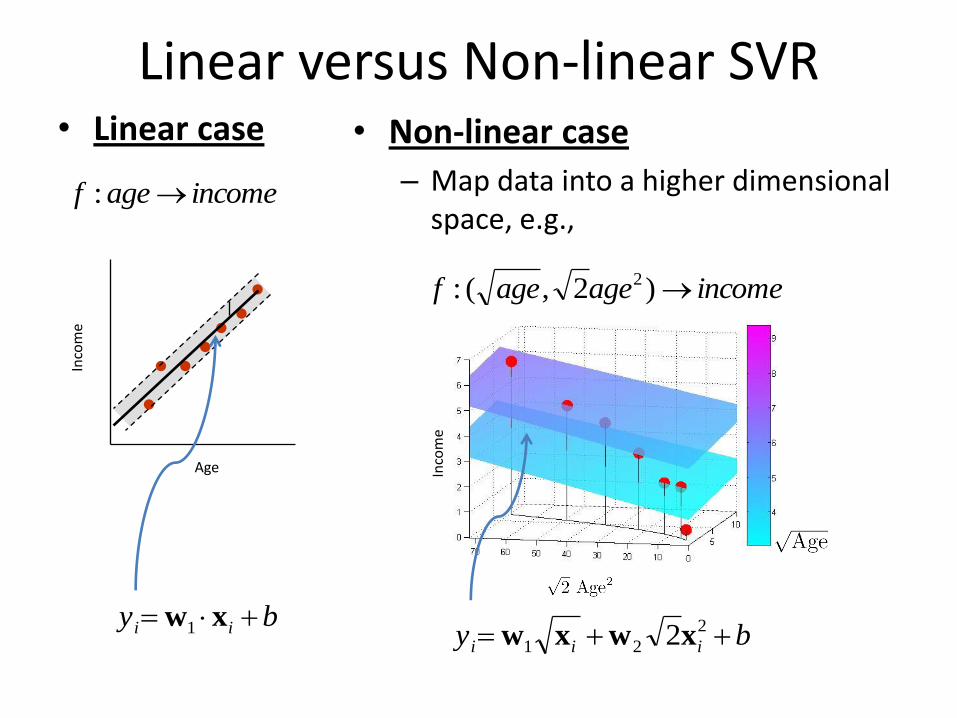
Linear versus Non-linear SVR• Linear case • Non-linear case
– Map data into a higher dimensional space, e.g.,
Inco
me
Age
●
●
●●●
●
●
incomeagef :
incomeageagef )2,(: 2
Inco
me
by ii xw1 by iii 2
21 2xwxw
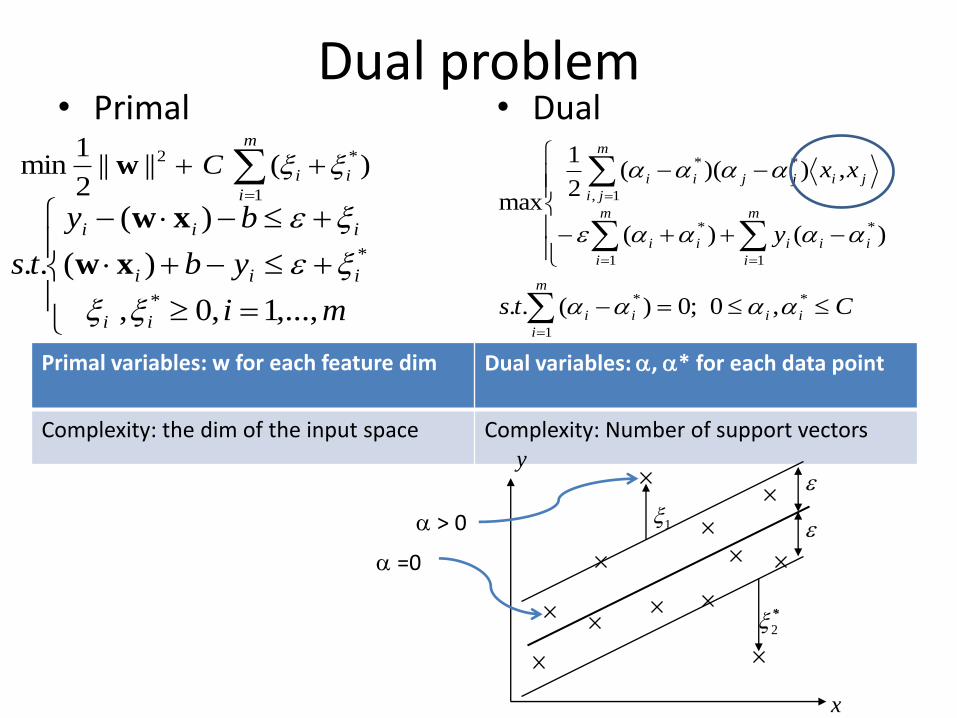
Dual problem• Primal • Dual
m
i
iiC1
*2 )(||||2
1min w
mi
yb
by
ts
ii
iii
iii
,...,1,0,
)(
)(
..*
*
xw
xw
m
i
iiii
m
i
iii
m
i
ii
m
ji
jijjii
Cts
y
xx
1
**
1
*
1
*
1,
**
,0;0)(..
)()(
,))((2
1
max
Primal variables: w for each feature dim Dual variables: , * for each data point
Complexity: the dim of the input space Complexity: Number of support vectors
x
y
*
2
1
=0
> 0
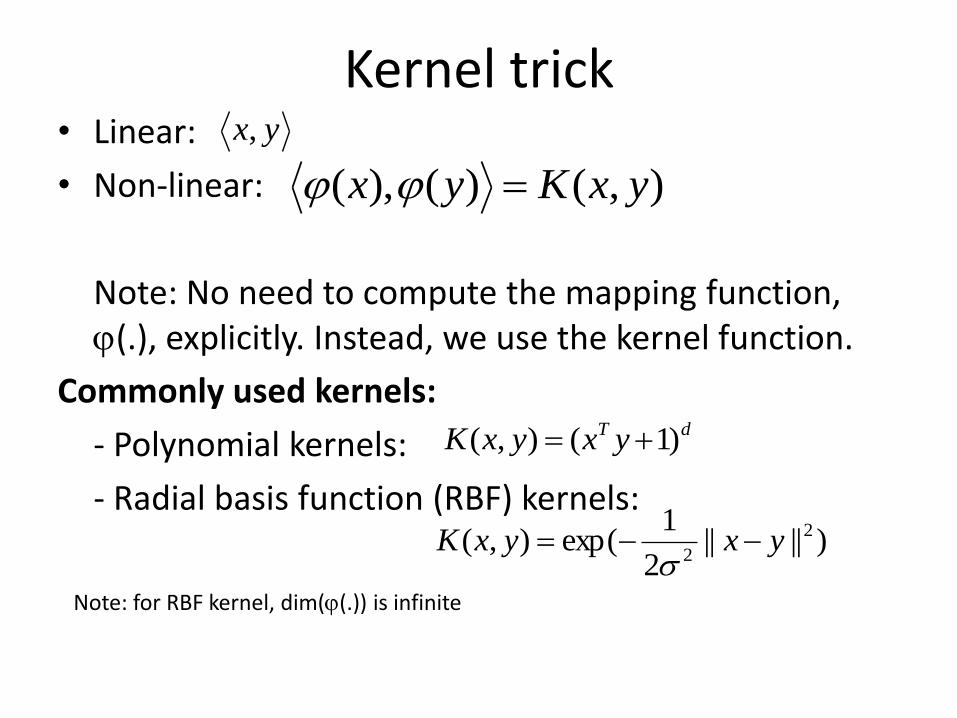
Kernel trick• Linear:
• Non-linear:
Note: No need to compute the mapping function, (.), explicitly. Instead, we use the kernel function.
Commonly used kernels:
- Polynomial kernels:
- Radial basis function (RBF) kernels:
yx,
),()(),( yxKyx
dT yxyxK )1(),(
)||||2
1exp(),( 2
2yxyxK
Note: for RBF kernel, dim((.)) is infinite
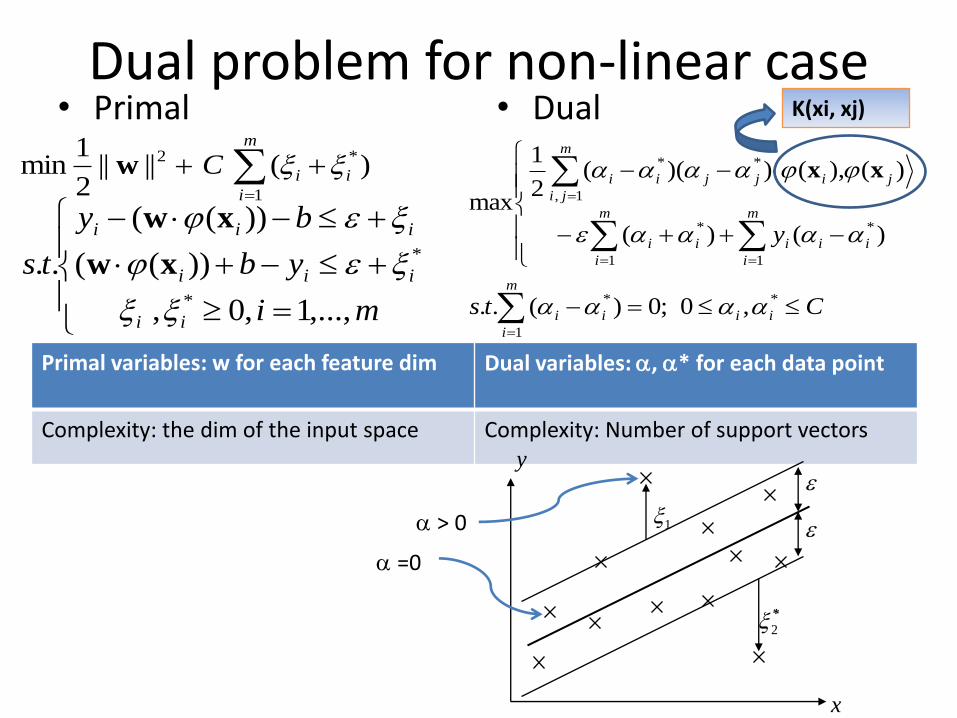
Dual problem for non-linear case• Primal • Dual
m
i
iiC1
*2 )(||||2
1min w
mi
yb
by
ts
ii
iii
iii
,...,1,0,
))((
))((
..*
*
xw
xw
m
i
iiii
m
i
iii
m
i
ii
m
ji
jijjii
Cts
y
1
**
1
*
1
*
1,
**
,0;0)(..
)()(
)(),())((2
1
max
xx
Primal variables: w for each feature dim Dual variables: , * for each data point
Complexity: the dim of the input space Complexity: Number of support vectors
x
y
*
2
1
=0
> 0
K(xi, xj)
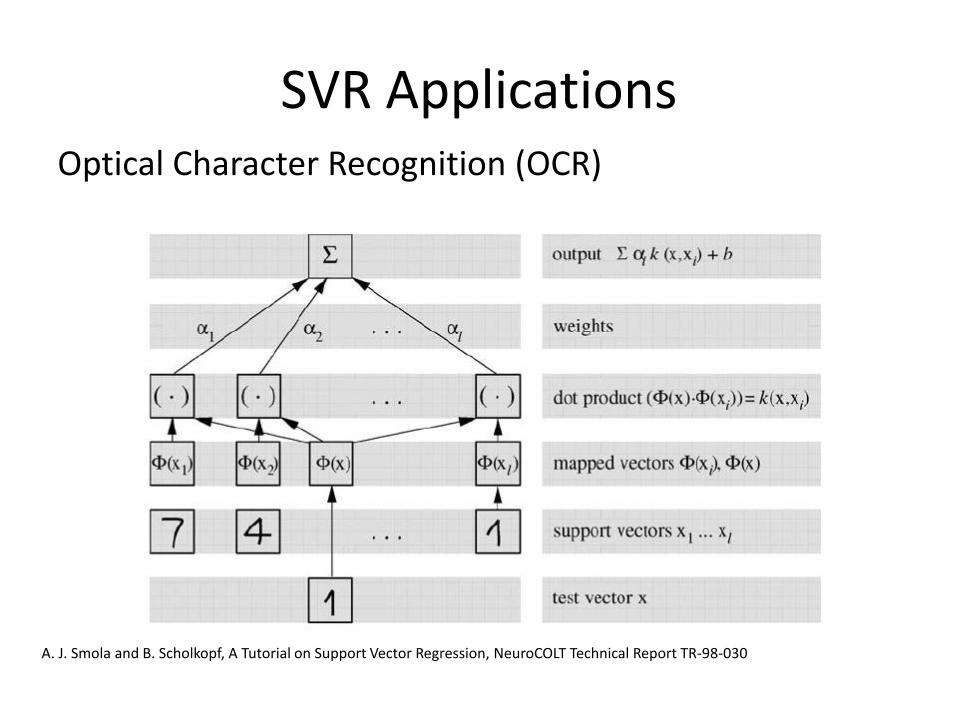
SVR ApplicationsOptical Character Recognition (OCR)
A. J. Smola and B. Scholkopf, A Tutorial on Support Vector Regression, NeuroCOLT Technical Report TR-98-030
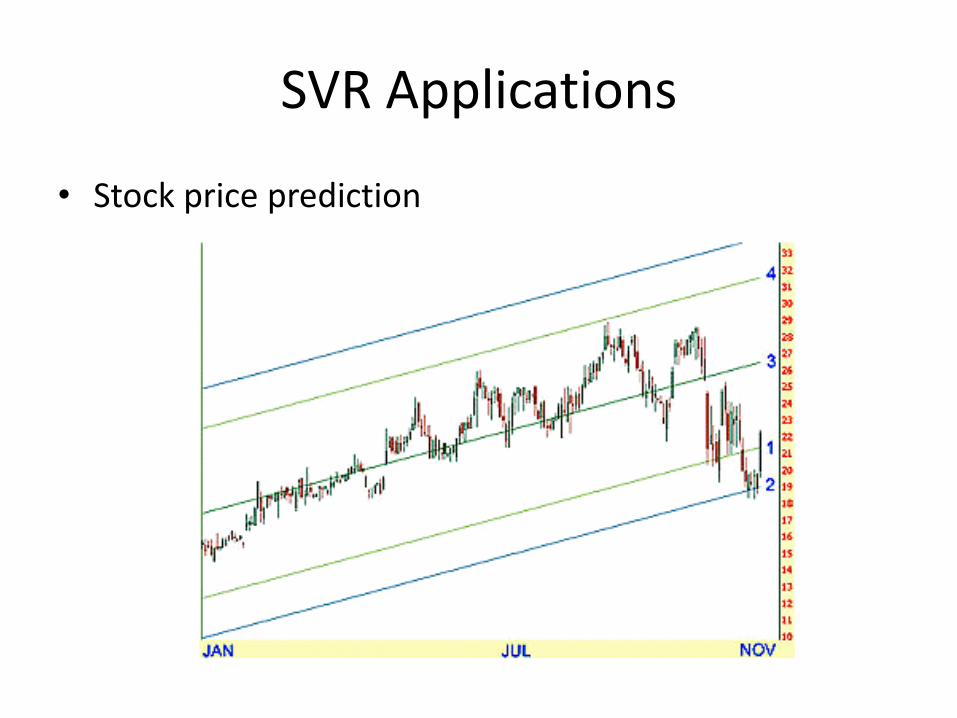
SVR Applications
• Stock price prediction
SVR Demo

WEKA and linear regression• Software can be downloaded from
http://www.cs.waikato.ac.nz/ml/weka/• Data set used in this experiment: Computer hardware• The objective is to predict CPU performance based on
these given attributes:– Machine cycle time in nanoseconds (MYCT)– Minimum main memory in kilobytes (MMIN)– Maximum main memory (MMAX)– Cache memory in kilobytes (CACH)– Minimum channels in units (CHMIN)– Maximum channels in units (CHMAX)
• Output is expressed as a linear combination of the attributes. Each attribute has a specific weight.– Output = bawawaw nn ...2211
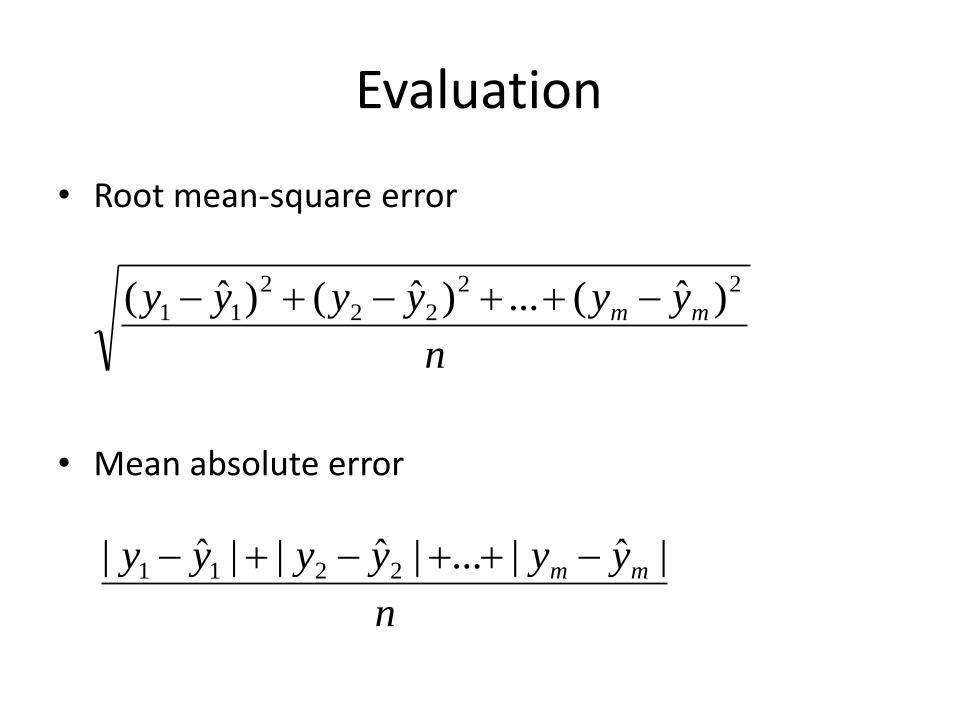
Evaluation
• Root mean-square error
• Mean absolute error
n
yyyyyy mm
22
22
2
11 )ˆ(...)ˆ()ˆ(
n
yyyyyy mm |ˆ|...|ˆ||ˆ| 2211
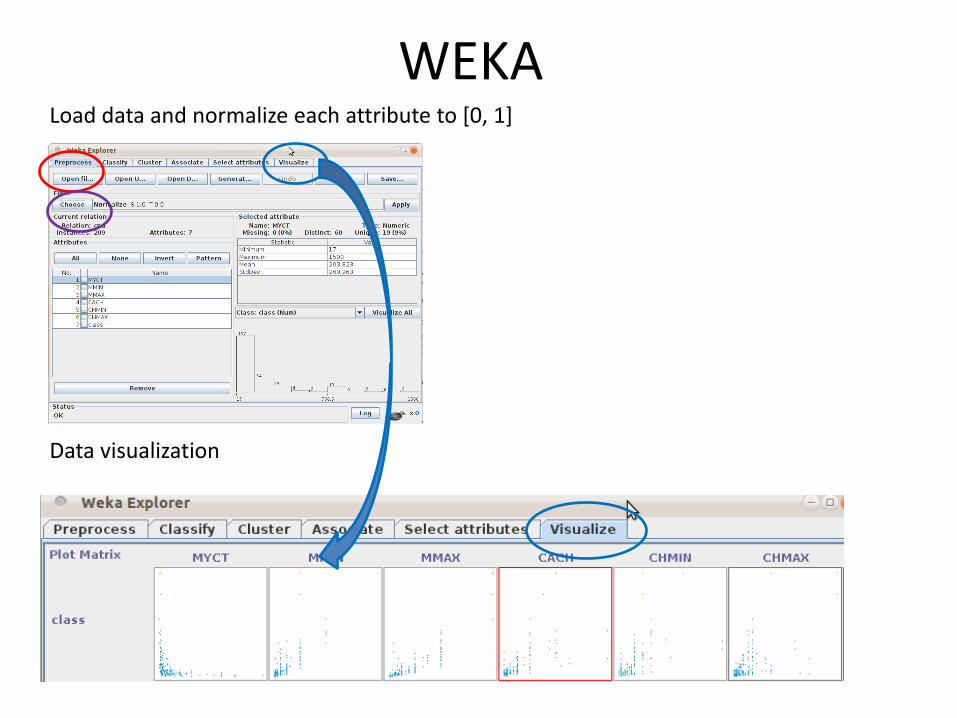
WEKA
Data visualization
Load data and normalize each attribute to [0, 1]
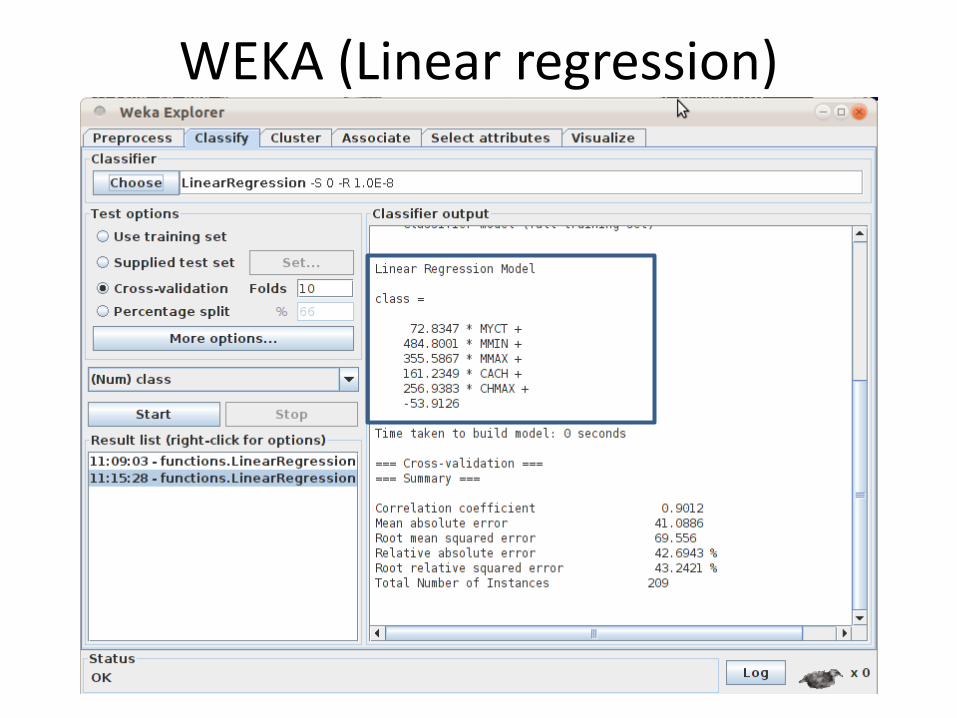
WEKA (Linear regression)

WEKA (Linear Regression)Performance = (72.8 x MYCT) + (484.8 x MMIN) + (355.6 x MMAX) + (161.2 x CACH) + (256.9 x CHMAX) – 53.9
Large Machine cycle time (MYCT) does not indicate the best performance
Main memory plays a more important role in the system performance
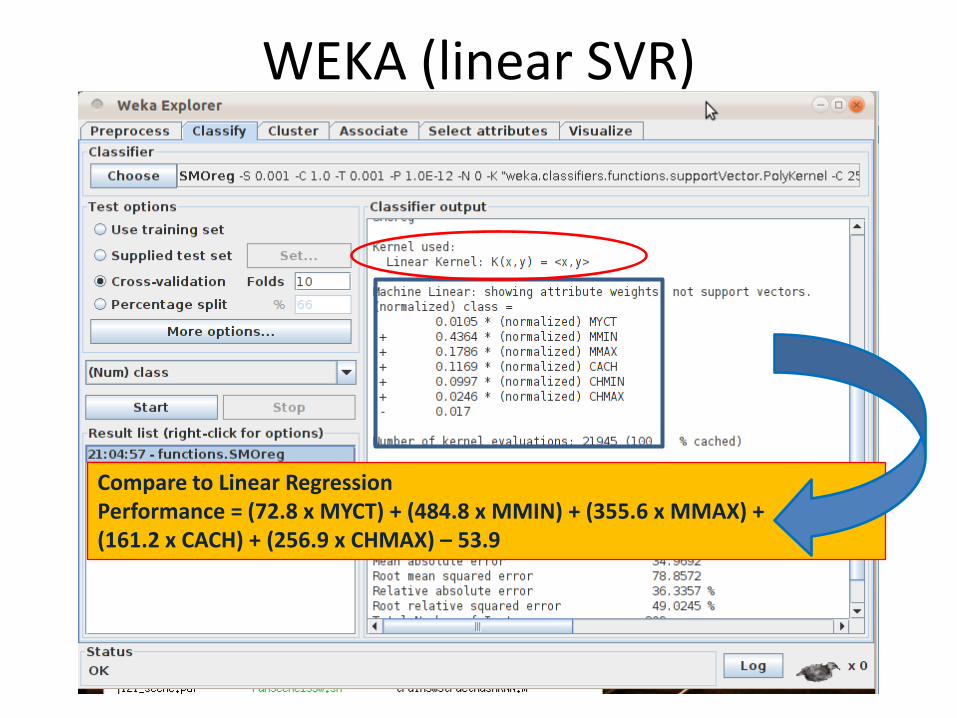
WEKA (linear SVR)
Compare to Linear RegressionPerformance = (72.8 x MYCT) + (484.8 x MMIN) + (355.6 x MMAX) + (161.2 x CACH) + (256.9 x CHMAX) – 53.9
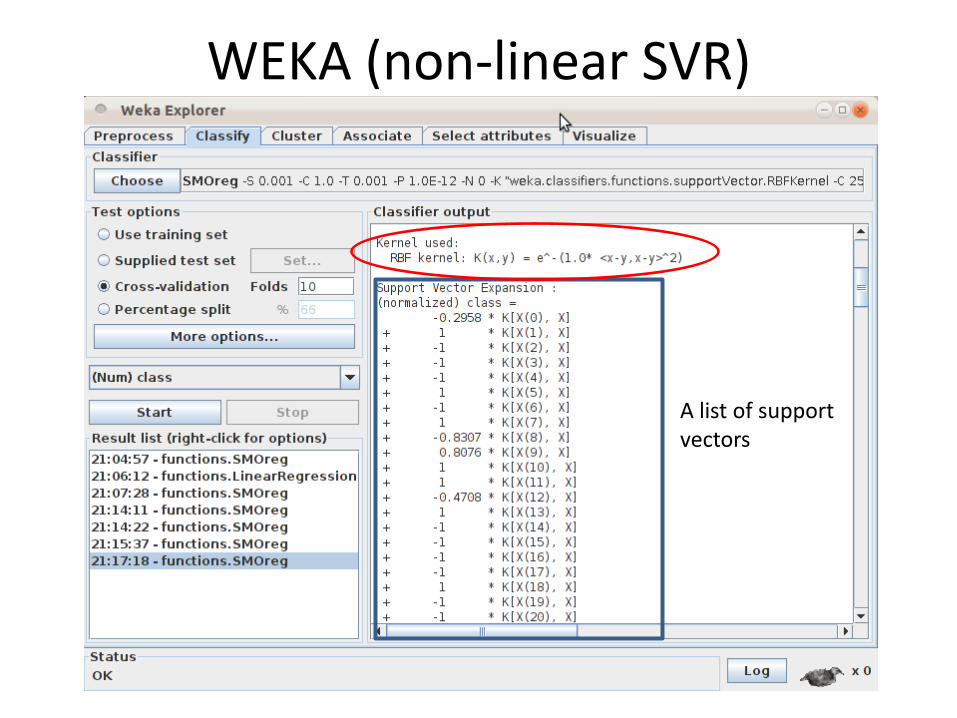
WEKA (non-linear SVR)
A list of support vectors
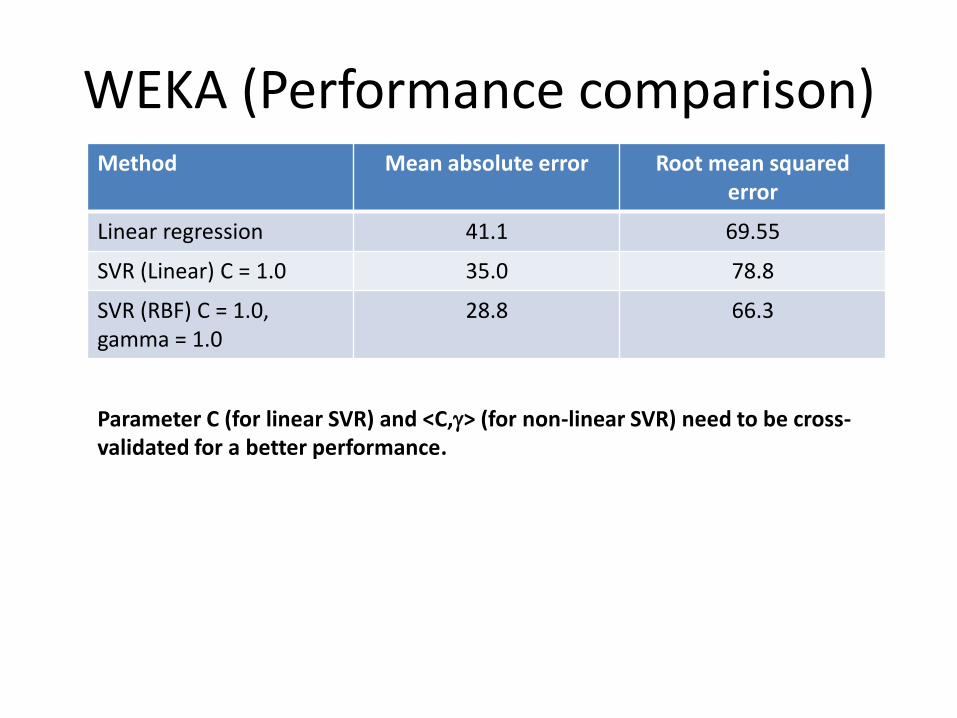
WEKA (Performance comparison)Method Mean absolute error Root mean squared
error
Linear regression 41.1 69.55
SVR (Linear) C = 1.0 35.0 78.8
SVR (RBF) C = 1.0, gamma = 1.0
28.8 66.3
Parameter C (for linear SVR) and <C,> (for non-linear SVR) need to be cross-validated for a better performance.
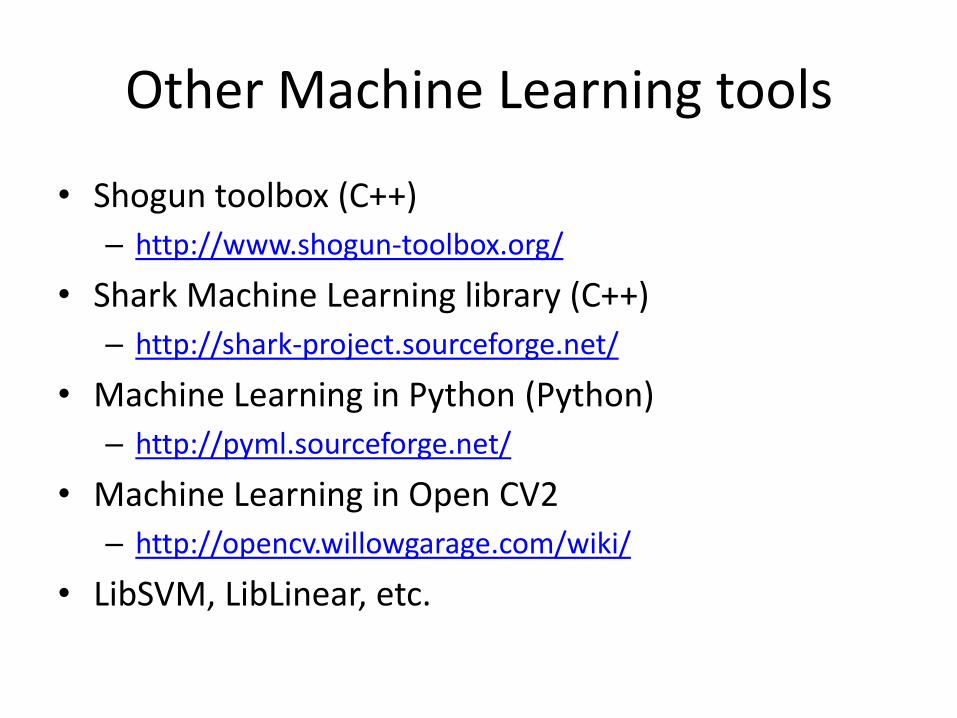
Other Machine Learning tools
• Shogun toolbox (C++)
– http://www.shogun-toolbox.org/
• Shark Machine Learning library (C++)
– http://shark-project.sourceforge.net/
• Machine Learning in Python (Python)
– http://pyml.sourceforge.net/
• Machine Learning in Open CV2
– http://opencv.willowgarage.com/wiki/
• LibSVM, LibLinear, etc.