Embed Size (px)
Citation preview
Linking BRAHMS Mapping and ArcView-based Conservation Assessment Tools (CATS)
Prepared by Vicki Crook, GIS Unit, Royal Botanic Gardens, Kew INTRODUCTION ................................................................................................................................... 2 BRAHMS MAP-RELATED SETUP OPTIONS ..................................................................................... 3
SOME ESSENTIAL BRAHMS SETUP OPTIONS FOR ARCVIEW MAPPING.................................................... 3 PREPARING AN ARCVIEW PROJECT WITH THE CATS EXTENSION............................................ 4
CREATING AND SAVING AN ARCVIEW PROJECT ...................................................................................... 4 REGISTERING ONE OR MORE APR PROJECT TEMPLATES IN BRAHMS................................................... 5
SELECTING DATA FROM BRAHMS TO ANALYSE .......................................................................... 6 QUERYING DATA FOR MAPPING ............................................................................................................. 6 MAPPING THE DATA IN ARCVIEW........................................................................................................... 6 ADDITIONAL NOTES ON DBF FILES AND ARCVIEW MAPPING ................................................................... 7 SAVED MAP PROJECTS (APR/DIV) ....................................................................................................... 7 ADDING DATA POINTS TO YOUR MAP...................................................................................................... 8 CHECKING POINT ACCURACY ................................................................................................................ 9
USING THE CONSERVATION ASSESSMENT TOOLS (CATS) ...................................................... 10 INTRODUCTION .................................................................................................................................. 10 SINGLE VS BATCH PROCESSING.......................................................................................................... 10 UNIQUE FIELD SELECTION................................................................................................................... 11
ADDING THE CATS CONSERVATION ASSESSMENT DATA TO BRAHMS ................................. 12 INTRODUCTION .................................................................................................................................. 12 LINKING THE CATS RESULTS TO THE BRAHMS SPECIES LIST ............................................................. 12
© Copyright Board of Trustees of the Royal Botanic Gardens, Kew
© Copyright Board of Trustees of the Royal Botanic Gardens, Kew
Introduction
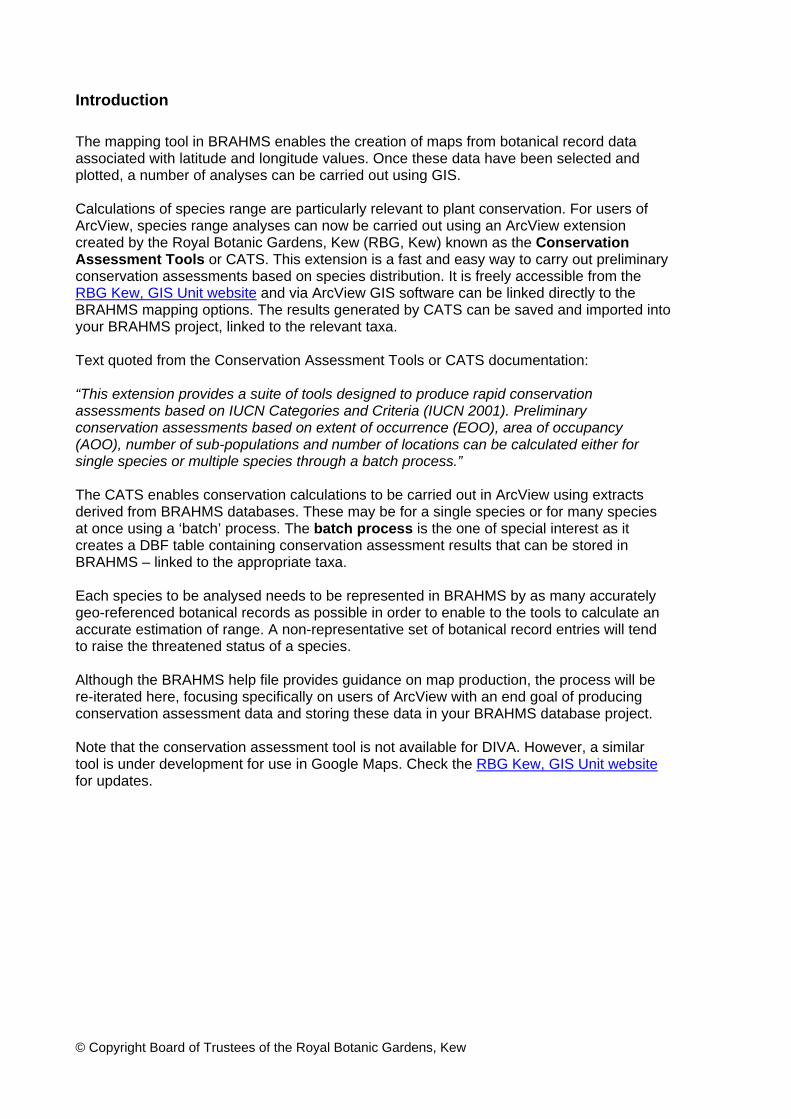
The mapping tool in BRAHMS enables the creation of maps from botanical record data associated with latitude and longitude values. Once these data have been selected and plotted, a number of analyses can be carried out using GIS. Calculations of species range are particularly relevant to plant conservation. For users of ArcView, species range analyses can now be carried out using an ArcView extension created by the Royal Botanic Gardens, Kew (RBG, Kew) known as the Conservation Assessment Tools or CATS. This extension is a fast and easy way to carry out preliminary conservation assessments based on species distribution. It is freely accessible from the RBG Kew, GIS Unit website and via ArcView GIS software can be linked directly to the BRAHMS mapping options. The results generated by CATS can be saved and imported into your BRAHMS project, linked to the relevant taxa. Text quoted from the Conservation Assessment Tools or CATS documentation: “This extension provides a suite of tools designed to produce rapid conservation assessments based on IUCN Categories and Criteria (IUCN 2001). Preliminary conservation assessments based on extent of occurrence (EOO), area of occupancy (AOO), number of sub-populations and number of locations can be calculated either for single species or multiple species through a batch process.” The CATS enables conservation calculations to be carried out in ArcView using extracts derived from BRAHMS databases. These may be for a single species or for many species at once using a ‘batch’ process. The batch process is the one of special interest as it creates a DBF table containing conservation assessment results that can be stored in BRAHMS – linked to the appropriate taxa. Each species to be analysed needs to be represented in BRAHMS by as many accurately geo-referenced botanical records as possible in order to enable to the tools to calculate an accurate estimation of range. A non-representative set of botanical record entries will tend to raise the threatened status of a species. Although the BRAHMS help file provides guidance on map production, the process will be re-iterated here, focusing specifically on users of ArcView with an end goal of producing conservation assessment data and storing these data in your BRAHMS database project. Note that the conservation assessment tool is not available for DIVA. However, a similar tool is under development for use in Google Maps. Check the RBG Kew, GIS Unit website for updates.
© Copyright Board of Trustees of the Royal Botanic Gardens, Kew
BRAHMS map-related setup options
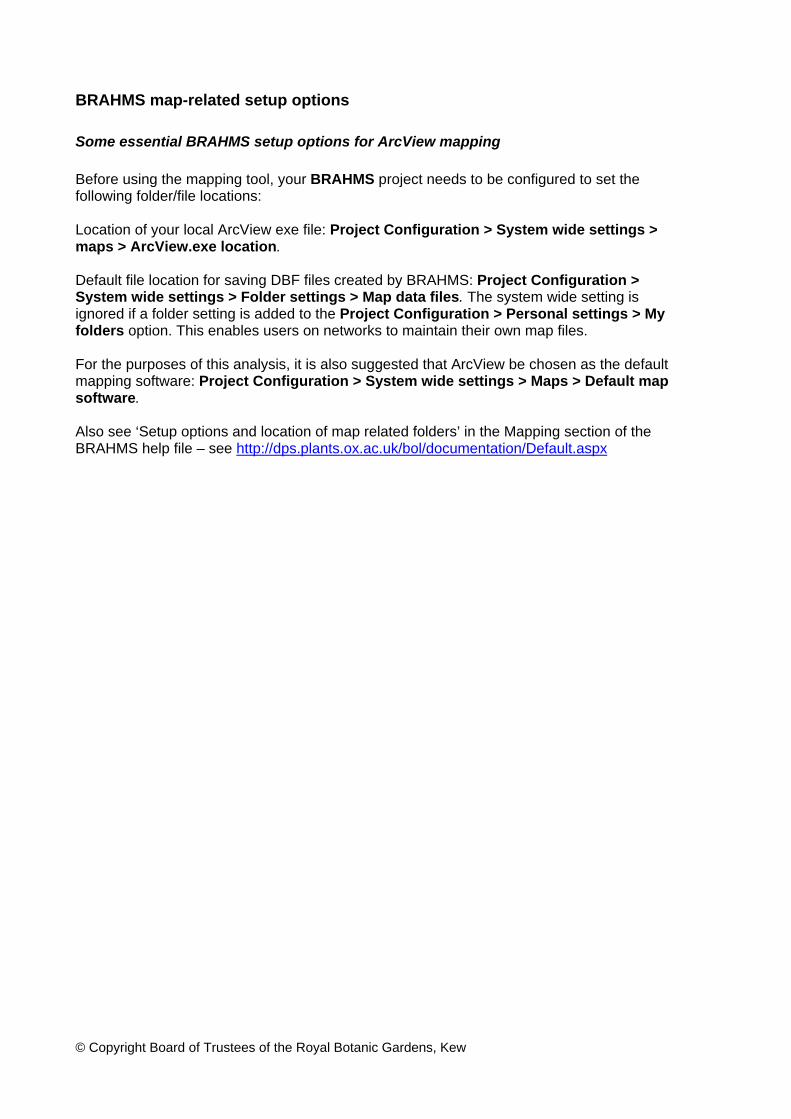
Some essential BRAHMS setup options for ArcView mapping Before using the mapping tool, your BRAHMS project needs to be configured to set the following folder/file locations: Location of your local ArcView exe file: Project Configuration > System wide settings > maps > ArcView.exe location. Default file location for saving DBF files created by BRAHMS: Project Configuration > System wide settings > Folder settings > Map data files. The system wide setting is ignored if a folder setting is added to the Project Configuration > Personal settings > My folders option. This enables users on networks to maintain their own map files. For the purposes of this analysis, it is also suggested that ArcView be chosen as the default mapping software: Project Configuration > System wide settings > Maps > Default map software. Also see ‘Setup options and location of map related folders’ in the Mapping section of the BRAHMS help file – see http://dps.plants.ox.ac.uk/bol/documentation/Default.aspx
© Copyright Board of Trustees of the Royal Botanic Gardens, Kew
Preparing an ArcView project with the CATS extension
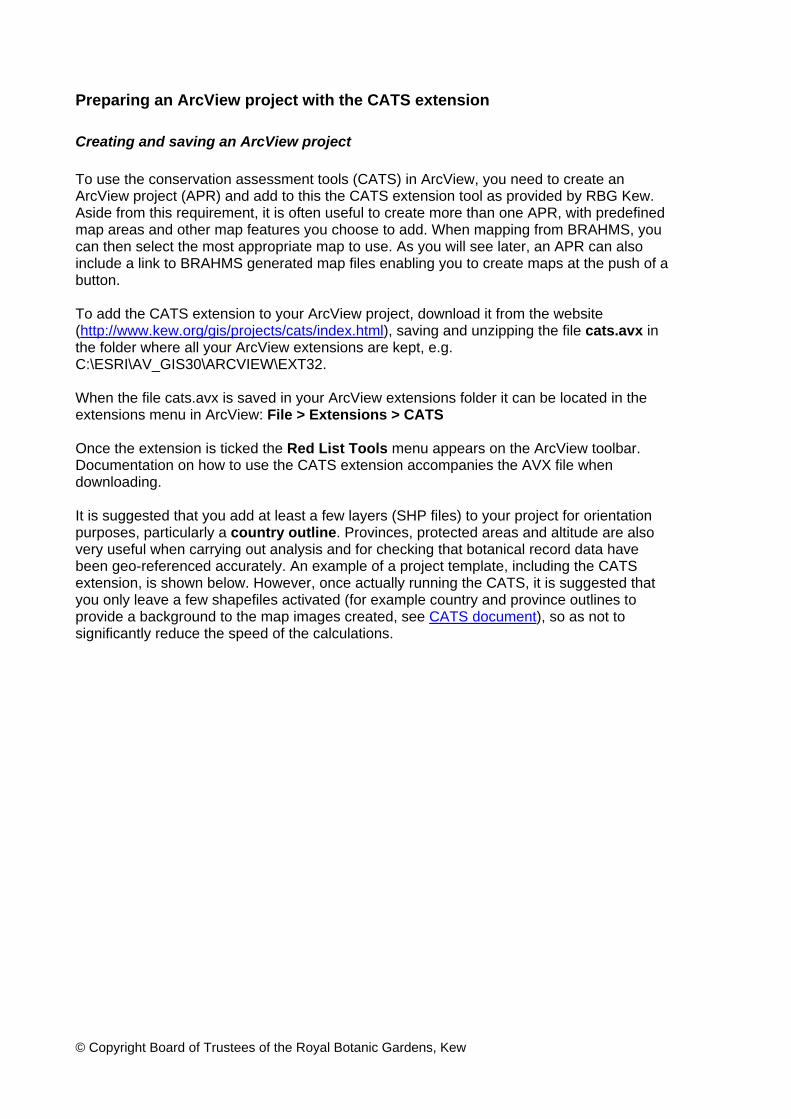
Creating and saving an ArcView project To use the conservation assessment tools (CATS) in ArcView, you need to create an ArcView project (APR) and add to this the CATS extension tool as provided by RBG Kew. Aside from this requirement, it is often useful to create more than one APR, with predefined map areas and other map features you choose to add. When mapping from BRAHMS, you can then select the most appropriate map to use. As you will see later, an APR can also include a link to BRAHMS generated map files enabling you to create maps at the push of a button. To add the CATS extension to your ArcView project, download it from the website (http://www.kew.org/gis/projects/cats/index.html), saving and unzipping the file cats.avx in the folder where all your ArcView extensions are kept, e.g. C:\ESRI\AV_GIS30\ARCVIEW\EXT32. When the file cats.avx is saved in your ArcView extensions folder it can be located in the extensions menu in ArcView: File > Extensions > CATS Once the extension is ticked the Red List Tools menu appears on the ArcView toolbar. Documentation on how to use the CATS extension accompanies the AVX file when downloading. It is suggested that you add at least a few layers (SHP files) to your project for orientation purposes, particularly a country outline. Provinces, protected areas and altitude are also very useful when carrying out analysis and for checking that botanical record data have been geo-referenced accurately. An example of a project template, including the CATS extension, is shown below. However, once actually running the CATS, it is suggested that you only leave a few shapefiles activated (for example country and province outlines to provide a background to the map images created, see CATS document), so as not to significantly reduce the speed of the calculations.
A sample ArcView screen with several SHP files and the CATS extension added
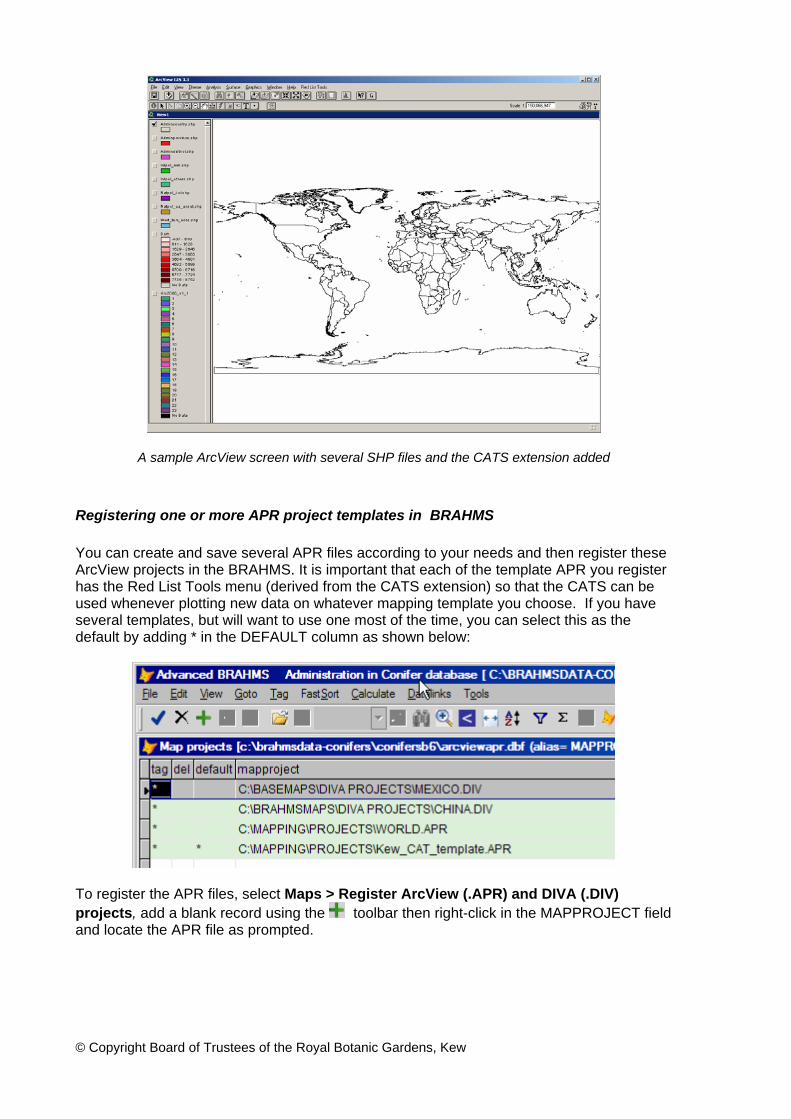
Registering one or more APR project templates in BRAHMS You can create and save several APR files according to your needs and then register these ArcView projects in the BRAHMS. It is important that each of the template APR you register has the Red List Tools menu (derived from the CATS extension) so that the CATS can be used whenever plotting new data on whatever mapping template you choose. If you have several templates, but will want to use one most of the time, you can select this as the default by adding * in the DEFAULT column as shown below:
To register the APR files, select Maps > Register ArcView (.APR) and DIVA (.DIV) projects, add a blank record using the toolbar then right-click in the MAPPROJECT field and locate the APR file as prompted.
© Copyright Board of Trustees of the Royal Botanic Gardens, Kew
Selecting data from BRAHMS to analyse
Querying data for mapping The next step is to query (extract) the data you wish to plot and carry out range analysis on. For example, to map all the species in one genus, select Botanical Records > Extract/Query data > Taxa > Genus. This will query all the data of this genus into your local botanical record extract file. Refer to notes on extracting data in the BRAHMS help file section ‘Queries and extract files’. If the extract file is not set to auto-open after your query, select Extracts > Botanical Records.
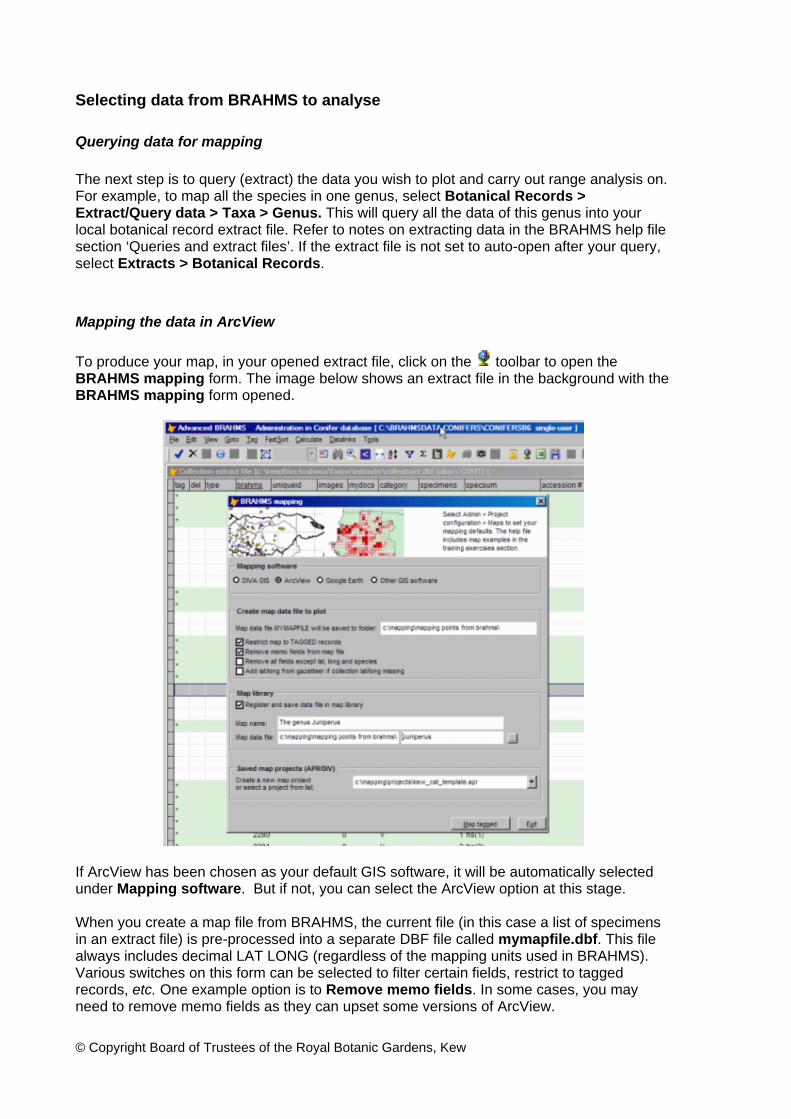
Mapping the data in ArcView To produce your map, in your opened extract file, click on the toolbar to open the BRAHMS mapping form. The image below shows an extract file in the background with the BRAHMS mapping form opened.
If ArcView has been chosen as your default GIS software, it will be automatically selected under Mapping software. But if not, you can select the ArcView option at this stage. When you create a map file from BRAHMS, the current file (in this case a list of specimens in an extract file) is pre-processed into a separate DBF file called mymapfile.dbf. This file always includes decimal LAT LONG (regardless of the mapping units used in BRAHMS). Various switches on this form can be selected to filter certain fields, restrict to tagged records, etc. One example option is to Remove memo fields. In some cases, you may need to remove memo fields as they can upset some versions of ArcView. © Copyright Board of Trustees of the Royal Botanic Gardens, Kew
© Copyright Board of Trustees of the Royal Botanic Gardens, Kew
Bear in mind that for mapping, your data must have latitude and longitude data and that the units (DMS, DD, DM) must be defined in the BRAHMS setup. Records with no lat/long values are ignored. Thus, if there are 25 records in the BRAHMS extract, but 5 have 0,0 in the longitude and latitude fields, the mymapfile.dbf will be composed of only 20 records. The mapping tool incorporates the possibility of adding coordinates from an internal gazetteer to records with no lat/long data. Refer to the help file for more details. The CATS require a unique field on which to base its analysis. This will always be either the species name or species ID code. To link the newly calculated data back into BRAHMS, it is preferable that species ID (SPNUMBER) be used and therefore, do not select Remove all fields except lat, long and species as this keeps only species name and coordinates. In this case the CATS will still work, but will create a table based on species name and not number. Mymapfile.dbf will be created under the same name each time the mapping tool is used to enable plotting and therefore old extract data will be overwritten with new. However, the BRAHMS mapping form also gives you the opportunity to create and save a copy of the mymapfile.dbf under a different name and save this in the BRAHMS map library. The map file can then be accessed and used again at a later date. By using the option Register and save data file in map library, each DBF you map will be saved in the Map library, which can be accessed any time from: Maps > Map library (saved map data files). In the above example, the extract is being saved as ‘The genus Juniperus’.
Additional notes on DBF files and ArcView mapping Any table in a dbf form can be used to plot in ArcView. The minimum that is required for a conservation assessment (species range) to be calculated is species number (spnumber), longitude and latitude. Due to the many additional analyses that can be carried out in ArcView, you may wish to have a dbf with more detailed information, such as altitude and habitat data. BRAHMS botanical record extract files include many fields of potential use for processing/analysis in ArcView. If you want to use fields that are in your collection link file, select the option Tools > Extract file conversions > Add link file fields to standard extract. Memo fields tend to cause problems in ArcView, therefore if you wish to keep memo field data in the table, use Tools > Extract file conversions > Convert memo fields to character fields before preparing your map.
Saved map projects (APR/DIV) All APR projects registered in your BRAHMS map projects manager (as described above) will appear in a drop down menu on the bottom right of the map form next to Saved map projects. Here, select the APR that you want to use. If no APR files are registered, select Create new ArcView map project as prompted. Click Map all or Map tagged when you are happy with the options selected or Exit to cancel the mapping process. Assuming your setup options are correct (i.e. BRAHMS knows where the arcview.exe file is located), ArcView will open using the selected APR.
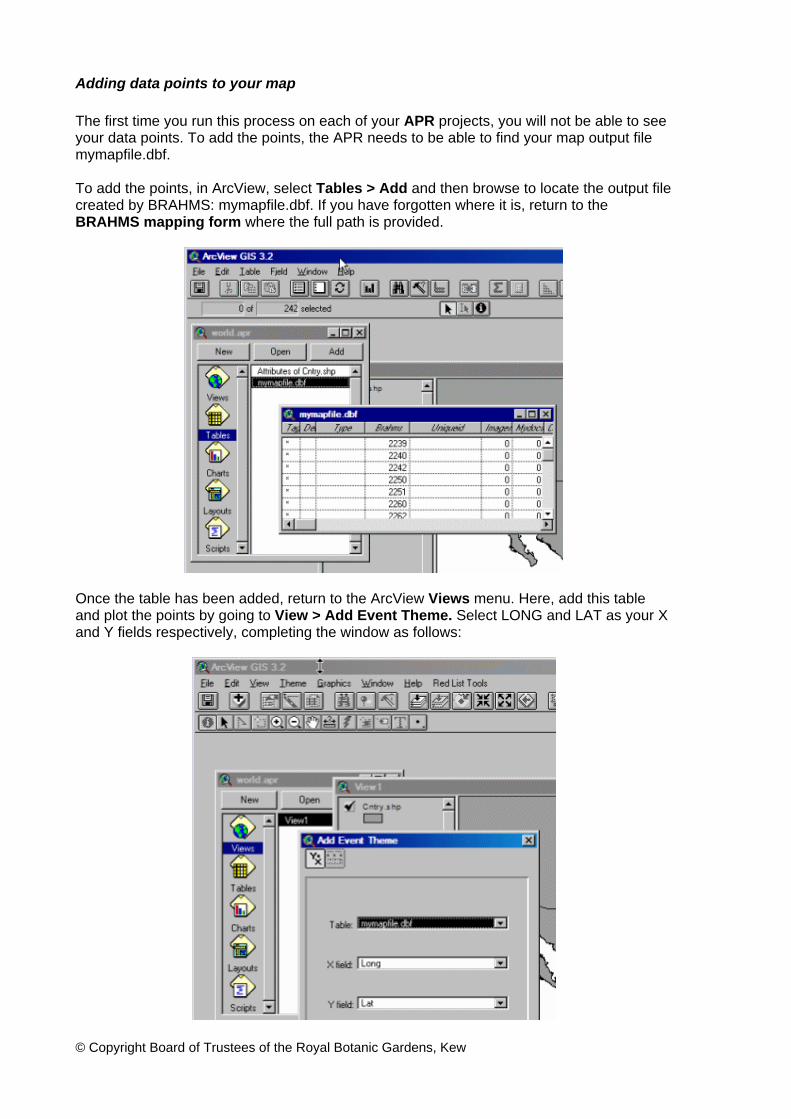
Adding data points to your map The first time you run this process on each of your APR projects, you will not be able to see your data points. To add the points, the APR needs to be able to find your map output file mymapfile.dbf. To add the points, in ArcView, select Tables > Add and then browse to locate the output file created by BRAHMS: mymapfile.dbf. If you have forgotten where it is, return to the BRAHMS mapping form where the full path is provided.
Once the table has been added, return to the ArcView Views menu. Here, add this table and plot the points by going to View > Add Event Theme. Select LONG and LAT as your X and Y fields respectively, completing the window as follows:
© Copyright Board of Trustees of the Royal Botanic Gardens, Kew
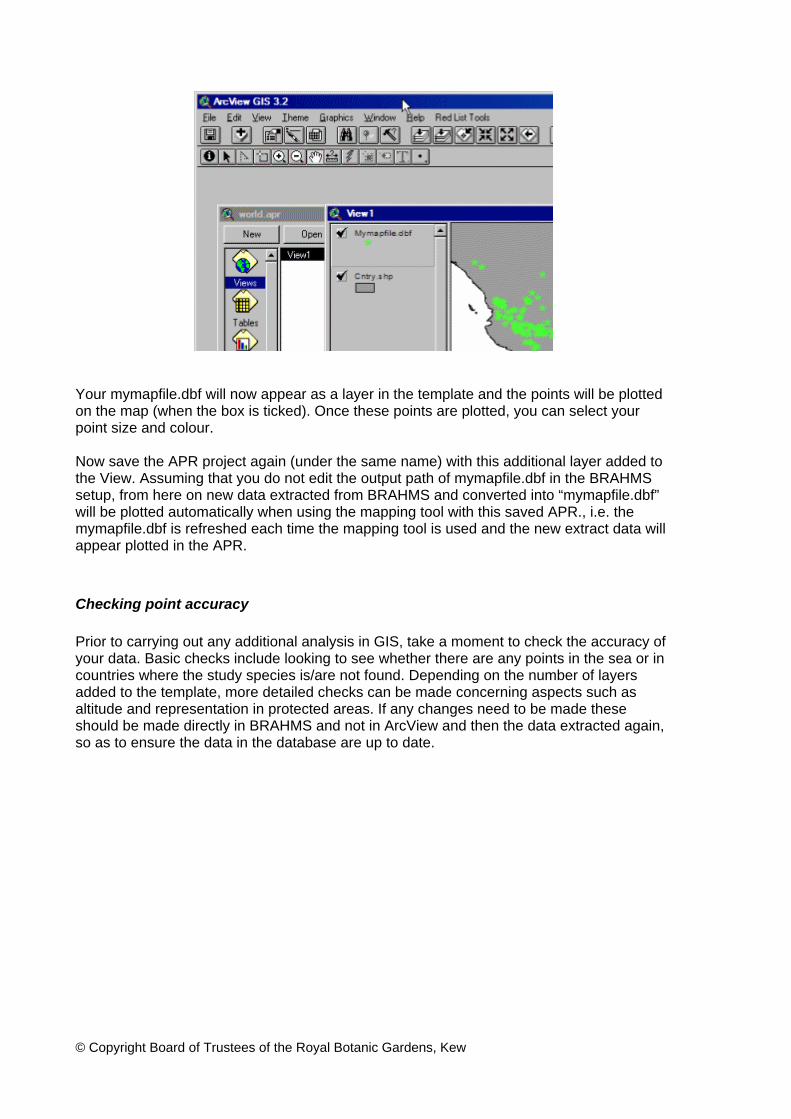
Your mymapfile.dbf will now appear as a layer in the template and the points will be plotted on the map (when the box is ticked). Once these points are plotted, you can select your point size and colour. Now save the APR project again (under the same name) with this additional layer added to the View. Assuming that you do not edit the output path of mymapfile.dbf in the BRAHMS setup, from here on new data extracted from BRAHMS and converted into “mymapfile.dbf” will be plotted automatically when using the mapping tool with this saved APR., i.e. the mymapfile.dbf is refreshed each time the mapping tool is used and the new extract data will appear plotted in the APR.
Checking point accuracy Prior to carrying out any additional analysis in GIS, take a moment to check the accuracy of your data. Basic checks include looking to see whether there are any points in the sea or in countries where the study species is/are not found. Depending on the number of layers added to the template, more detailed checks can be made concerning aspects such as altitude and representation in protected areas. If any changes need to be made these should be made directly in BRAHMS and not in ArcView and then the data extracted again, so as to ensure the data in the database are up to date.
© Copyright Board of Trustees of the Royal Botanic Gardens, Kew
Using the Conservation Assessment Tools (CATS)
Introduction Once you are satisfied with the accuracy of your data, ArcView extensions provide the user with a number of options for further analysis. However, here we are focusing on the functions made available with the CATS extension. The document downloaded with the CATS extension covers all aspects of the tool, and therefore the methodology will not be repeated here. You can also access the documentation directly from here: http://www.kew.org/gis/projects/cats/catsdoc.pdf
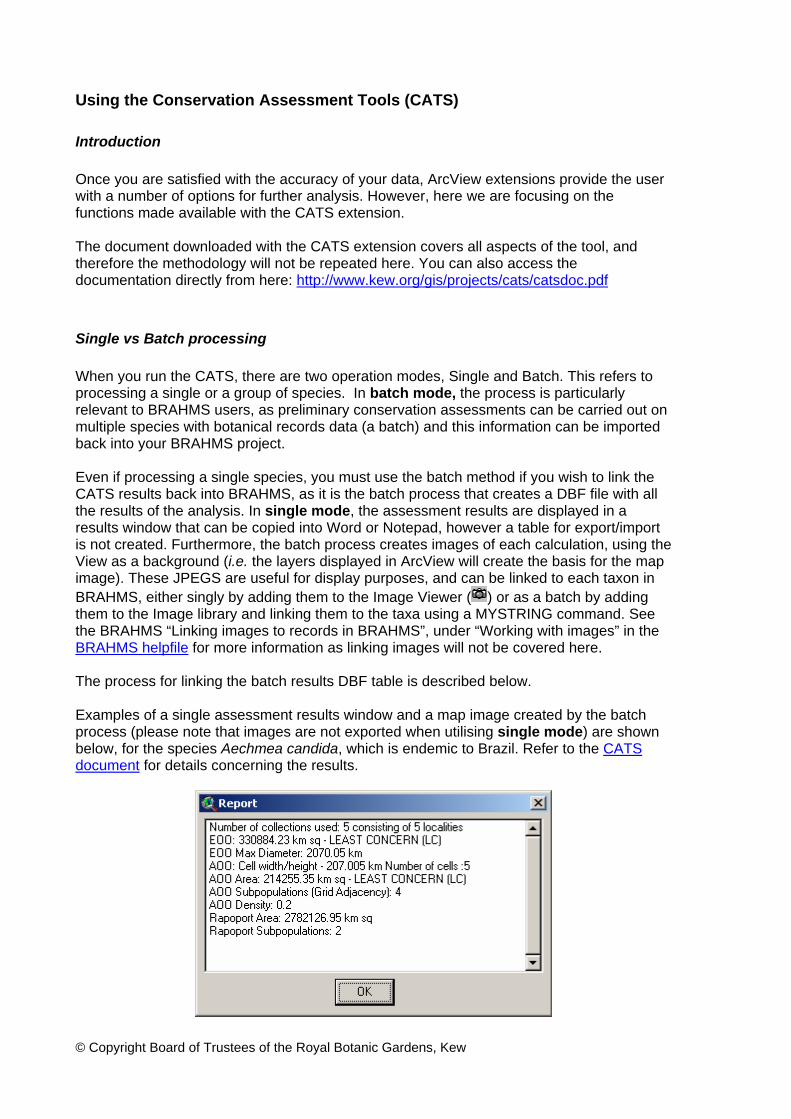
Single vs Batch processing When you run the CATS, there are two operation modes, Single and Batch. This refers to processing a single or a group of species. In batch mode, the process is particularly relevant to BRAHMS users, as preliminary conservation assessments can be carried out on multiple species with botanical records data (a batch) and this information can be imported back into your BRAHMS project. Even if processing a single species, you must use the batch method if you wish to link the CATS results back into BRAHMS, as it is the batch process that creates a DBF file with all the results of the analysis. In single mode, the assessment results are displayed in a results window that can be copied into Word or Notepad, however a table for export/import is not created. Furthermore, the batch process creates images of each calculation, using the View as a background (i.e. the layers displayed in ArcView will create the basis for the map image). These JPEGS are useful for display purposes, and can be linked to each taxon in BRAHMS, either singly by adding them to the Image Viewer ( ) or as a batch by adding them to the Image library and linking them to the taxa using a MYSTRING command. See the BRAHMS “Linking images to records in BRAHMS”, under “Working with images” in the BRAHMS helpfile for more information as linking images will not be covered here. The process for linking the batch results DBF table is described below. Examples of a single assessment results window and a map image created by the batch process (please note that images are not exported when utilising single mode) are shown below, for the species Aechmea candida, which is endemic to Brazil. Refer to the CATS document for details concerning the results.
© Copyright Board of Trustees of the Royal Botanic Gardens, Kew
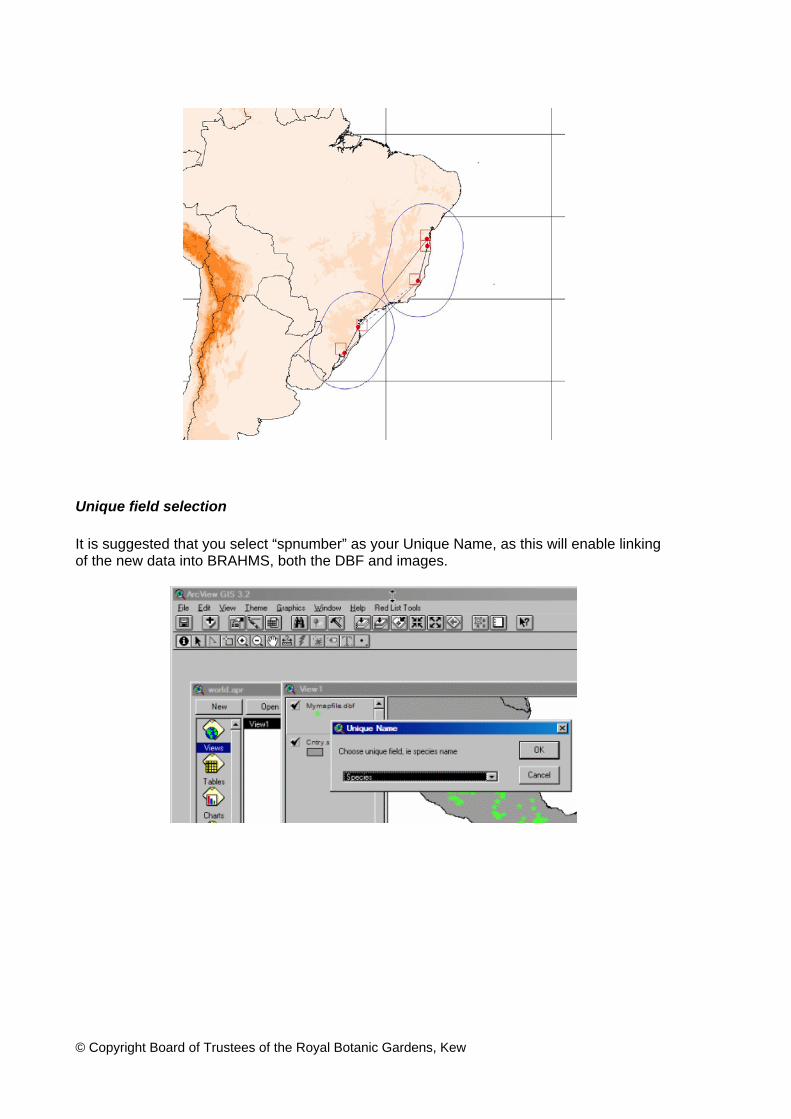
Unique field selection It is suggested that you select “spnumber” as your Unique Name, as this will enable linking of the new data into BRAHMS, both the DBF and images.
© Copyright Board of Trustees of the Royal Botanic Gardens, Kew
Adding the CATS conservation assessment data to BRAHMS
Introduction The results produced by the CATS can be stored back in BRAHMS with enables the data to be included in different types of reports. If you are producing conservation assessments for many species, it is very useful to have these available within BRAHMS, linked to your main species list. A full explanation of the CATS results (Extent of Occurrence, Area of Occupancy, etc.) is provided in the CATS manual.
Linking the CATS results to the BRAHMS species list As BRAHMS does not by default include all the fields generated by the CATS process, the data can be added to a BRAHMS species link file. To ensure that the new data is correctly linked to each species, a field called “spnumber” is required. The field containing the species number (or name) is named “unique_nam” by the CATS and needs to be edited prior to linking in BRAHMS. To do this:
• Open the CATS DBF file in BRAHMS as an external DBF file from: File > Open/browse an external DBF file.
• Select File > Modify file structure and change the field name “unique_nam” created by ArcView to “spnumber”, the type to “Numeric” and the width to “9”.
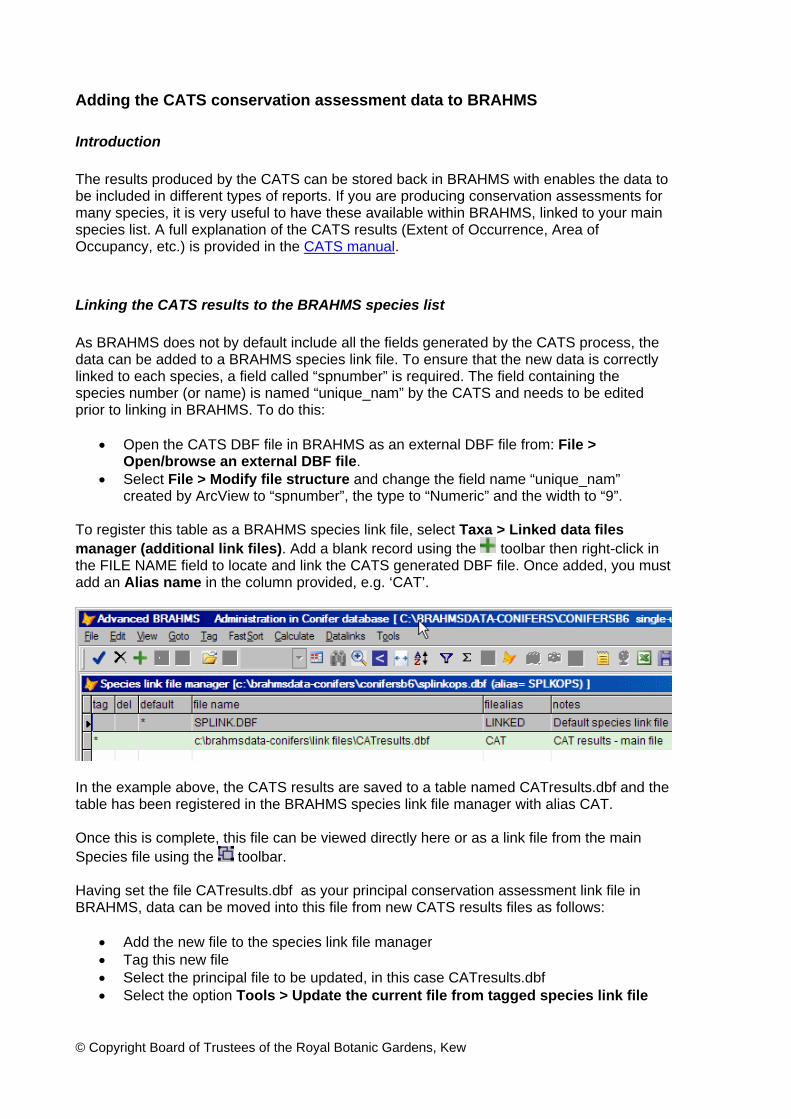
To register this table as a BRAHMS species link file, select Taxa > Linked data files manager (additional link files). Add a blank record using the toolbar then right-click in the FILE NAME field to locate and link the CATS generated DBF file. Once added, you must add an Alias name in the column provided, e.g. ‘CAT’.
In the example above, the CATS results are saved to a table named CATresults.dbf and the table has been registered in the BRAHMS species link file manager with alias CAT. Once this is complete, this file can be viewed directly here or as a link file from the main Species file using the toolbar. Having set the file CATresults.dbf as your principal conservation assessment link file in BRAHMS, data can be moved into this file from new CATS results files as follows:
• Add the new file to the species link file manager • Tag this new file • Select the principal file to be updated, in this case CATresults.dbf
© Copyright Board of Trustees of the Royal Botanic Gardens, Kew
• Select the option Tools > Update the current file from tagged species link file
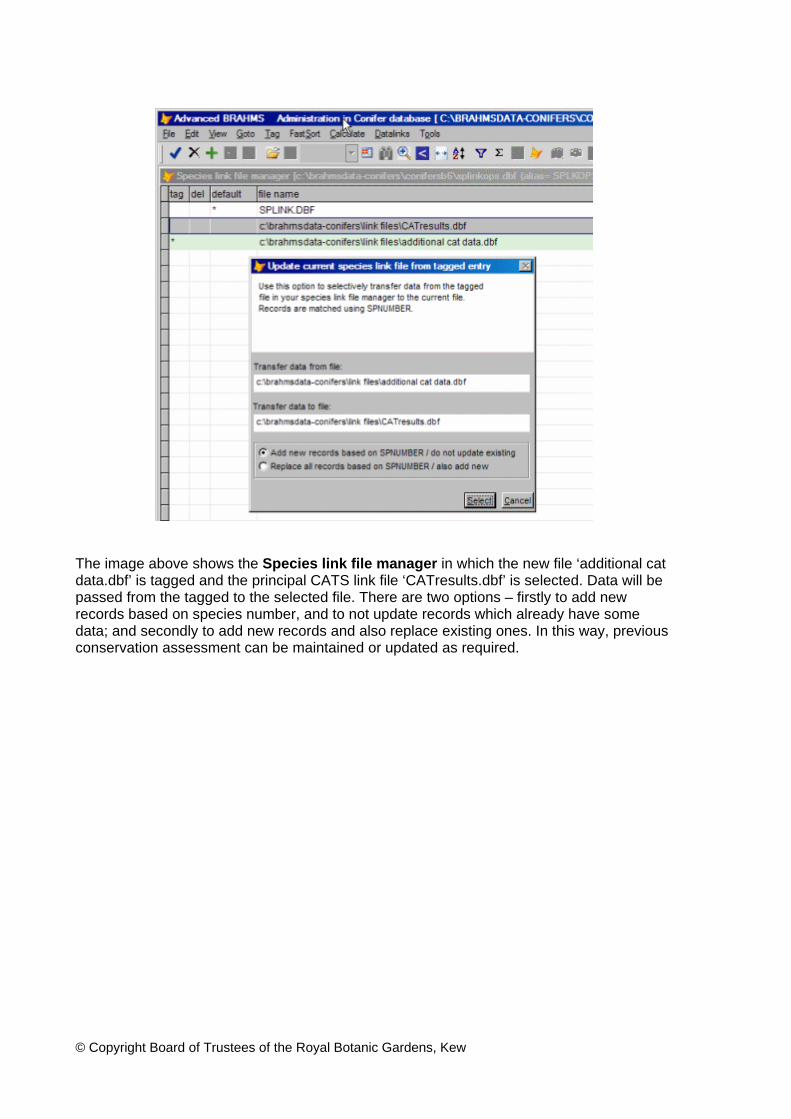
The image above shows the Species link file manager in which the new file ‘additional cat data.dbf’ is tagged and the principal CATS link file ‘CATresults.dbf’ is selected. Data will be passed from the tagged to the selected file. There are two options – firstly to add new records based on species number, and to not update records which already have some data; and secondly to add new records and also replace existing ones. In this way, previous conservation assessment can be maintained or updated as required.
© Copyright Board of Trustees of the Royal Botanic Gardens, Kew