Embed Size (px)
Citation preview

Linking Drug Stability to ManufacturingPhysical Chemical Foundations
Gabapentin
L. E. KirschStability team leader

Stability TeamGroup Team member
Minnesota Raj Suryanarayanan (Co-PI)
Aditya Kaushal (post-doc)
Kansas Eric Munson (Co-PI)
Dewey Barich (post-doc)
Elodie Dempah, Eric Gorman (grad. students)
Iowa Lee Kirsch (Co-PI)
Greg Huang (Analytical Chemist)
Salil Desai, Zhixin Zong, Tinmanee Radaduen, Hoa Nguyen, Jiang Qiu (grad students)
Duquesne(Unit-op team Interface)
Ira Buckner

Linking manufacturing to stability
3
(Stable form)
(Unstable form)

Gabapentin as a model drug substance
NH2
OH
O
gabapentin(Gaba)
• Multiple crystalline forms• Susceptible to stress-induced physical
transformations• Susceptible to chemical degradation
NH3+
O-
O
NH2
O-
O
NH3+
OH
O
pKa 3.7 pKa 10
4
KEY QUESTIONS1. Are physical and chemical instability
linked?2. How can manufacturing-induced stress be
incorporated in a quantitative chemical instability model?

Some Crystalline Forms of Gabapentin
5
API form Crystalline
I
II
III
IV
Ibers., Acta Cryst c57, 2001 and Reece and Levendis., Acta Cryst. c64 2008
Transition between forms by mechanical stress, humidity, and thermal stress
Hydrate
Stable polymorph (API)
Intramolecular H-bonding

4 6 8 10 12 14 16 18 20 22
2Theta
Physical transformation by Mechanical Stress
Form II
Form III
Milled Gabapentin

Physical transformation by Humidity
2theta
7
Inte
nsity
47 hrs in 40C 31 %RH29 hrs17 hrs 7 hrs 0 hr

Physical transformation by Thermal Stress
Kaushal and Suryanarayanan., Minnesota Univ. AAPS poster 2009
8

Chemical Degradation of Gabapentin– nucleophilic attack of nitrogen on carbonyl
O
NH
Gabapentin Gabapentin _lactam
9
toxicUSP limit: < 0.4%

Aqueous degradation kinetics
OOH
NH2NH
O
gabapentin lactam
Irreversible cyclization
+ H2O

Solid state degradation kinetics40 C 5% RH, milled gabapentin
0
1
2
3
4
5
6
7
0 100 200 300 400 500 600
Lac
tam
(m
ole
%)
hours
initial lactamrapid degradation of process-damaged gaba
autocatalytic lactam formation

Solid state Degradation Model
12
GABA (G)(stable form)
LACTAM (L)
autocatalytic branching
spontaneous dehydration
branching termination
LDGk 1
Dk2GABA (D)(unstable form)
DGk3
Hypothesis:Manufacturing stress determines initial conditions (G0, D0 and L0)Environmental (storage) stress determines kinetics (k1, k2 and k3)

Building a quantitative model
13
DrugStability
Compositional Factors
(e.g. excipients)
Environmental Stress
ManufacturingStress

Effects of Manufacturing Stress:Initial Lactam and Instability
0 5 10 15 20 25 300.0
0.5
1.0
1.5
2.0
2.5
% la
ctam
time(days)
60 min milled
45 min milled
15 min milled
API as received
Thermal stressed at 50 °C, 5%RH
Lactam generated during milling(in-process lactam)
Milling caused faster degradation rate
14

Effects of Milling Stress:Specific Surface Area
0 20 40 600
4
8
12
16
20
Surf
ace A
rea
(m2 /g
)
Milling Time (min)
Is the increase of lactamization rate solely due to increase of Surface Area?
15

Can Surface Area account for Lactamization Rate Changes upon
Mechanical Stess?
Samples milled for different time
Sieved aliquots of 15min milled sample
Sieved aliquots of unmilled sample
NO, ALSO increased regions of crystal disorder caused by the mechanical stress.
16

Effects of Milling based on Change in Initial Condition:
lactam formation (50 °C)
17
TreatmentD0
(%)k1*104
(%mole-1hr-1)
k2(hr-1)
unstressed 0.02
0.6 0.017
15min milled 0.5945min milled 1.2860min milled 1.62
Lact
am m
ole
%
Time (hr)
60min mill
45min mill
15min mill
unstressed0
0.5
1
1.5
2
2.5
3
3.5
0 200 400 600 800 1000 1200 1400
milling time effect

Effects of Environmental Stress: temperature and humidity
18
DrugStability
Compositional Factors
(e.g. excipients)
Environmental Stress
ManufacturingStress

Lactam kinetics under controlled temperature (40-60 C) and humidity (5-50% RH)
0
5
10
15
20
0 100 200 300 400 500 600 700 800
Lac
tam
(%
mo
le)
Hours

Effects of Temperature:predicted values based on parameterization of
autocatalytic model

Effects of Moisture
21
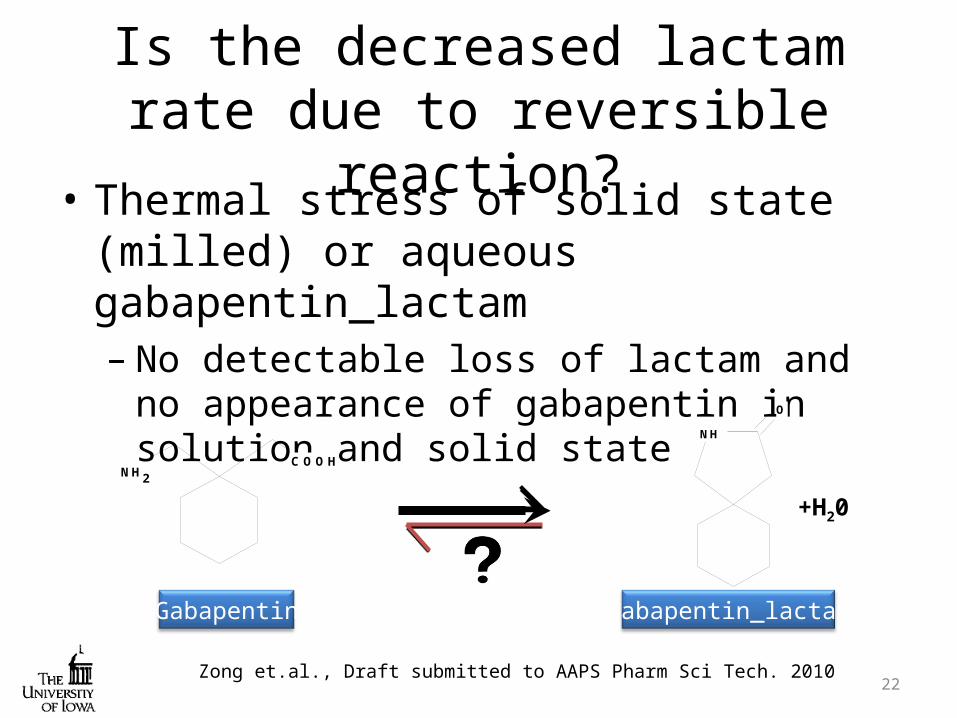
Is the decreased lactam rate due to reversible reaction?
• Thermal stress of solid state (milled) or aqueous gabapentin_lactam– No detectable loss of lactam and no appearance
of gabapentin in solution and solid state
Zong et.al., Draft submitted to AAPS Pharm Sci Tech. 2010
COOHNH2
O
NH
Gabapentin Gabapentin_lactam
+H20
22
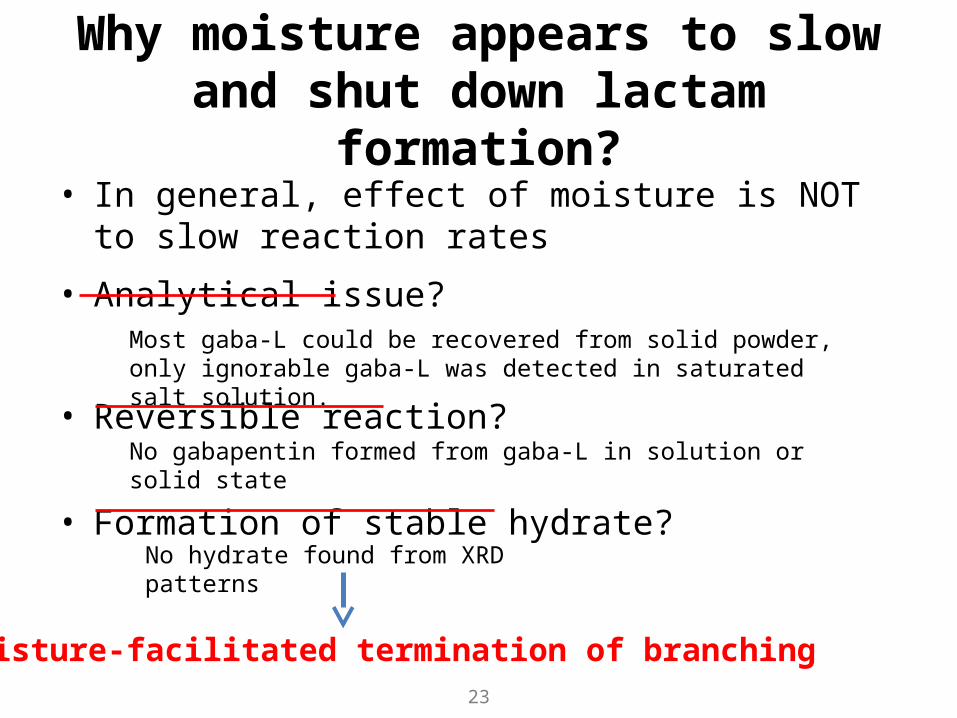
Why moisture appears to slow and shut down lactam formation?
• In general, effect of moisture is NOT to slow reaction rates
• Analytical issue?
• Reversible reaction?
• Formation of stable hydrate?
No gabapentin formed from gaba-L in solution or solid state
No hydrate found from XRD patterns
Most gaba-L could be recovered from solid powder, only ignorable gaba-L was detected in saturated salt solution.
Moisture-facilitated termination of branching23

Effect of Moisture:Shut down Lactam Formation
0
1
2
3
4
0 20 40 60 80 100
Gaba
-L C
once
ntra
tion
(Mol
e %
)
Hours
Pretreated at 5% RH 25°C for 24 hours before thermal stress
Pretreated at 81% RH 25°C for 24 hours before thermal stress
Thermal stress: 50°C 5%RH
24

k1 (%mole-1hr-1)
k2 (hr-1)
D0 (%)
L0 (% mole)
0.000021 0.0074 1.05 0.37k3(%mole-1hr-1)
5%RH 11%RH 30%RH 50%RH
�0 0.014 0.030 0.099
Effects of Moisture
40 C 50%RH
40 C 30%RH
40 C 5%RH
25
Lact
am m
ole
%
Time (hr)
40 C 11%RH
0
1
2
3
4
5
0 100 200 300 400 500
moisture effect gaba simulation

Effects of Compositional Factors: excipient effects
26
DrugStability
Compositional Factors
(e.g. excipients)
Environmental Stress
ManufacturingStress

Excipient EffectsComparison of lactam formation kinetics between neet gabapentin
and gabapentin/HPCcontrolled temperature (40-60 C) and humidity (5-50% RH)
0
10
20
30
40
50
60
0 100 200 300 400 500 600 700 800
La
cta
m (
%m
ole
)
Hours
Gabapentin
0
10
20
30
40
50
60
0 100 200 300 400 500 600 700 800
La
cta
m (
% m
ole
)
Hours
Gabapentin & 6.5% HPC

– Mixtures of gabapentin & excipients– Co-milled– Storage conditions: 5 to 50% RH at 50 ˚C
• Excipients (50% w/w)
– CaHPO4.2H20 (Emcompress)
– Corn starch– Microcrystalline cellulose (Avicel PH101)– HPMC 4000
– Colloidal SiO2 (Cab-O-Sil)
– Talc (Mg silicate)– HPC (6.5% w/w)
Evaluation of the role of excipients in gabapentin SS degradation
Saturated solution Saturated solution 50˚C
0
10
20
30
40
50
0 100 200 300 400 500
5RH 4:47:40 AM 10/22/2010
gabaAviHPMCCabTalcHPC Calccorngaba obscalc obscorn obsAvi obsHPMC obsCab obsTalc obsHPC obs
Gaba
Starch
CaHPO4SiO2
HPC AvicelHPMC
Talc
Lact
am m
ole
%Time (hr)

Model parameterization usingexcipient-induced variation in crystal damage during
milling and termination rate
0
10
20
30
40
50
0 100 200 300 400 500
La
cta
m (
% m
ole
)
Hours
SiO2
CaHPO4
Starch
MCC
HPMC
Talc
HPC (6.5%)
Excipient effects•Crystal damage (D0) during milling•Kinetics of branching and termination(k3)

Effect of Excipients based on Change in Initial Conditions and Rate Constants:
under low humidity
30
k1 *104
(%mole-1hr-1) k2(hr-1)
D0
(%)L0
(% mole)SiO2 0.27 0.0208 21.16 2.6Talc 0.33 0.0116 8.44 0.98Starch 0.35 0.0150 4.54 0.30HPMC 0.41 0.0123 7.42 0.30Avicel 0.49 0.0148 7.21 0.26
HPC (6.5%) 0.55 0.0209 6.52 0.30Gaba 0.74 0.0149 1.05 0.37

Effect of Excipients based on Change in Rate Constants: under low humidity
31

Moisture and excipient effectsNo excipient Co-milled excipient (SiO2)
5 %RH 11 %RH30 %RH
50 %RH
11 %RH
30 %RH
50 %RH
5 %RH
32
0
10
20
30
40
50
0 100 200 300 400 500 600
Data 10
BDFH
Lact
am m
ole
%
Time (hr)
0
5
10
15
20
0 100 200 300 400 500 600 700 800
moisture effect gaba50RH
0RH11RH30RH50RH

Linking Stability in Design SpaceManuf.Design SpaceModel
L0
D0
Post-Manuf.
Degradation
Model
LtEndof
Expiry
• Key Research Findings• Manufacturing Stress impacts drug stability upon storage:
L0 (in-process lactam) D0 (unstable gabapentin)
• Predictive model for drug stability includes:• Environment factor: temperature () & humidity ()
• Compositional factors: both kinetic and initial condition effects
• Manufacturing factors: L0 and D0
• Model validation: completion of long term stability

Measuring the manufacturing stress effects• Physical methods
– Raj Suryanarayanan (University of Minnesota) – Eric Munson (University of Kentucky)
• Chemical and kinetic measurements– Lee Kirsch (University of Iowa
Solid State NMR KansasRaman spectroscopy MinnesotaPowder x-ray diffraction (XRD) MinnesotaDSC/TGA All Water vapor sorption MinnesotaHPLC Iowa

Chromatographic methods
Minutes
1 2 3 4 5 6 7 8 9 10
mAU
0.00
0.25
0.50
0.75
1.00
1.25
1.50
mAU
0.00
0.25
0.50
0.75
1.00
1.25
1.50
4093
741
Ga
bape
ntin
3.6
58
2388
5.390 43
39
Lacta
m
7.288
3853
9.117
Detector 1-210nmhydBt0H
AreaNameRetention Time
Detector 1-210nmhydBt24H
Comparison of HPLC chromatograms before (black) and after (red) thermal stress:
∆ lactam = 0.004%.
Minutes
1 2 3 4 5 6 7 8 9 10
mAU
0
1
2
3
4
mAU
0
1
2
3
4
2801
635
Ga
bape
ntin
3.6
68
8278
La
ctam
7.3
07
Detector 1-210nmhydAt0H
AreaNameRetention Time
Detector 1-210nmhydAt24H
Comparison of HPLC chromatograms before (black) and after (red) thermal stress:
∆ lactam = 0.059%.
Minutes
1 2 3 4 5 6 7 8 9 10
mAU
0
5
10
15
20
mAU
0
5
10
15
20
4635
741
Ga
bape
ntin
3.618
2878
43
7.5
72
(La
ctam)
Detector 1-210nmlotAH
AreaNameRetention Time
Detector 1-210nmlotAHbefore
Comparison of HPLC chromatograms before (black) and after (red) thermal stress:
∆ lactam = 0.174%.

Manufacturing-stability measurements
• In process lactam (L0)– Change in lactam levels during specific treatment or unit operation in
% lactam/gabapentin on molar basis
• Initial Rate of Lactam Formation (V0 or STS)– Daily rate of lactam formation upon thermal stress at 50°C under low
humidity
• D0 from Chemical Analysis
dayCk
k
VD
DkV
o %/37.0)50(2
2
00
020

Insert Sury

Insert Eric

Applied Manufacturing-stability Measurements to Design Space and Risk Assessment
• Laboratory scale stability design space• Pilot scale stability design space• Risk assessment using Manufacturing-
stability Measurements