Embed Size (px)
Citation preview

Linking Study Report: Predicting Performance on the
Georgia Milestones End-of-Grade (EOG) Assessments
based on NWEA MAP Growth Scores
July 2020
NWEA Psychometric Solutions

© 2020 NWEA. NWEA and MAP Growth are registered trademarks of NWEA in the U.S. and in
other countries. All rights reserved. No part of this document may be modified or further
distributed without written permission from NWEA.
Suggested citation: NWEA. (2020). Linking study report: Predicting performance on the Georgia
Milestones End-of-Grade (EOG) assessments based on NWEA MAP Growth scores. Portland,
OR: Author.

Linking Study: Predicting Performance on GA Milestones EOG from MAP Growth Page 3
Table of Contents
Executive Summary ...................................................................................................................... 4
1. Introduction ............................................................................................................................... 7
1.1. Purpose of the Study ...................................................................................................... 7
1.2. Assessment Overview .................................................................................................... 7
2. Methods .................................................................................................................................... 8
2.1. Data Collection ............................................................................................................... 8
2.2. Post-Stratification Weighting ........................................................................................... 8
2.3. MAP Growth Cut Scores ................................................................................................. 8
2.4. Classification Accuracy ................................................................................................... 9
2.5. Proficiency Projection ................................................................................................... 10
3. Results .................................................................................................................................... 11
3.1. Study Sample ............................................................................................................... 11
3.2. Descriptive Statistics ..................................................................................................... 13
3.3. MAP Growth Cut Scores ............................................................................................... 14
3.4. Classification Accuracy ................................................................................................. 17
3.5. Proficiency Projection ................................................................................................... 18
References .................................................................................................................................. 26
List of Tables
Table 2.1. Description of Classification Accuracy Summary Statistics ....................................... 10
Table 3.1. Linking Study Sample Demographics (Unweighted) .................................................. 11
Table 3.2. Spring 2019 Georgia Milestones EOG Student Population Demographics ............... 12
Table 3.3. Linking Study Sample Demographics (Weighted) ..................................................... 13
Table 3.4. Descriptive Statistics of Test Scores .......................................................................... 14
Table 3.5. MAP Growth Cut Scores—ELA/Reading ................................................................... 15
Table 3.6. MAP Growth Cut Scores—Mathematics .................................................................... 16
Table 3.7. Classification Accuracy Results ................................................................................. 17
Table 3.8. Proficiency Projection based on RIT Scores—ELA/Reading ..................................... 18
Table 3.9. Proficiency Projection based on RIT Scores—Mathematics ...................................... 22

Linking Study: Predicting Performance on GA Milestones EOG from MAP Growth Page 4
Executive Summary
To predict student achievement on the Georgia Milestones End-of-Grade (EOG) assessments
in English Language Arts (ELA) and Mathematics, NWEA® conducted a linking study using
Spring 2019 data to derive Rasch Unit (RIT) cut scores on the MAP® Growth™ assessments
that correspond to the Georgia Milestones achievement levels. With this information, educators
can identify students at risk of failing to meet state proficiency standards early in the year and
provide tailored educational interventions. The linking study has been updated since the
previous version published in February 2016 to incorporate the new 2020 NWEA MAP Growth
norms (Thum & Kuhfeld, 2020).
Table E.1 presents the Georgia Milestones Proficient Learner achievement level cut scores and
the corresponding MAP Growth RIT cut scores that allow teachers to identify students who are
on track for proficiency on the state summative test and those who are not. For example, the
Proficient Learner cut score on the Georgia Milestones Grade 3 ELA test is 525. A Grade 3
student with a MAP Growth Reading RIT score of 192 in the fall is likely to meet proficiency on
the Georgia Milestones ELA test in the spring, whereas a Grade 3 student with a MAP Growth
Reading RIT score lower than 192 in the fall is in jeopardy of not meeting proficiency. MAP
Growth cut scores for Grade 2 are also provided so educators can track early learners’ progress
toward proficiency on the Georgia Milestones test by Grade 3. These cut scores were derived
based on the Grade 3 cuts and the 2020 NWEA growth norms for the adjacent grade (i.e.,
Grades 2 to 3).
Table E.1. MAP Growth Cut Scores for Georgia Milestones EOG Proficiency
Proficient Learner Cut Scores by Grade
Assessment 2 3 4 5 6 7 8
ELA/Reading
GA Milestones Spring – 525 525 525 525 525 525
MAP Growth
Fall 180 192 201 208 213 220 222
Winter 188 199 207 212 217 223 224
Spring 192 202 209 214 218 224 225
Mathematics
GA Milestones Spring – 525 525 525 525 525 525
MAP Growth
Fall 178 190 202 214 218 224 230
Winter 187 198 209 220 223 228 233
Spring 192 203 213 224 226 231 235
Please note that the results in this report may differ from those found in the NWEA reporting
system for individual districts. The typical growth scores from fall to spring or winter to spring
used in this report are based on the default instructional weeks most commonly encountered for
each term (i.e., Weeks 4, 20, and 32 for fall, winter, and spring, respectively). However,
instructional weeks often vary by district, so the cut scores in this report may differ slightly from
the MAP Growth score reports that reflect spring instructional weeks set by partners.

Linking Study: Predicting Performance on GA Milestones EOG from MAP Growth Page 5
E.1. Assessment Overview
The Georgia Milestones EOG ELA and Mathematics tests are Georgia’s state summative
assessments aligned to the Georgia Standards of Excellence and administered in Grades 3–8.
Based on their test scores, students are placed into one of four achievement levels: Beginning
Learner, Developing Learner, Proficient Learner, and Distinguished Learner. These tests are
used to provide evidence of student achievement in ELA and Mathematics for various test score
uses such as meeting the requirements of the state’s accountability system. The Proficient
Learner cut score demarks the minimum level of achievement considered to be proficient. MAP
Growth tests are adaptive interim assessments aligned to state-specific content standards and
administered in the fall, winter, and spring. Scores are reported on the RIT vertical scale with a
range of 100–350.
E.2. Linking Methods
Based on scores from the Spring 2019 test administration, the equipercentile linking method
was used to identify the spring MAP Growth scores that correspond to the spring Georgia
Milestones achievement level cut scores. Spring cuts for Grade 2 were derived based on the
cuts for Grade 3 and the 2020 NWEA growth norms. MAP Growth fall and winter cut scores that
predict proficiency on the spring Georgia Milestones test were then projected using the 2020
NWEA growth norms that provide expected score gains across test administrations.
E.3. Student Sample
Only students who took both the MAP Growth and Georgia Milestones assessments in Spring
2019 were included in the study sample. Table E.2 presents the weighted number of Georgia
students from 28 districts and 219 schools who were included in the linking study. The linking
study sample is voluntary, so the data can only include student scores from partners who share
their data. Also, not all students in a state take MAP Growth. The sample may therefore not
represent the general student population as well as it should. To ensure that the linking study
sample represents the state student population in terms of race, sex, and achievement level,
weighting (i.e., a statistical method that matches the distributions of the variables of interest to
those of the target population) was applied to the sample. As a result, the RIT cuts derived from
the study sample can be generalized to any student from the target population. All analyses for
Grades 3–8 in this study were conducted based on the weighted sample.
Table E.2. Linking Study Sample
#Students
Grade ELA/Reading Mathematics
3 12,930 12,890
4 14,537 14,652
5 13,826 13,837
6 14,545 14,791
7 11,752 11,816
8 10,096 9,974

Linking Study: Predicting Performance on GA Milestones EOG from MAP Growth Page 6
E.4. Test Score Relationships
Correlations between MAP Growth RIT scores and Georgia Milestones EOG scores range from
0.80 to 0.87 across both content areas, as shown in Figure E.1. These values indicate a strong
relationship among the scores, which is important validity evidence for the claim that MAP
Growth scores are good predictors of performance on the Georgia Milestones EOG
assessments.
Figure E.1. Correlations between MAP Growth and Georgia Milestones EOG
E.5. Accuracy of MAP Growth Classifications
Figure E.2 presents the classification accuracy statistics that show the proportion of students
correctly classified by their RIT scores as proficient or not proficient on the Georgia Milestones
EOG tests. For example, the MAP Growth Reading Grade 3 Proficient Learner cut score has a
0.84 accuracy rate, meaning it accurately classified student achievement on the state test for
84% of the sample. The results range from 0.82 to 0.88 across both content areas, indicating
that RIT scores have a high accuracy rate of identifying student proficiency on the Georgia
Milestones EOG tests.
Figure E.2. Accuracy of MAP Growth Classifications

Linking Study: Predicting Performance on GA Milestones EOG from MAP Growth Page 7
1. Introduction
1.1. Purpose of the Study
NWEA® is committed to providing partners with useful tools to help make inferences about
student learning from MAP® Growth™ test scores. One important use of MAP Growth results is
to predict a student’s performance on the state summative assessment at different times
throughout the year. This allows educators and parents to determine if a student is on track in
their learning to meet state standards by the end of the year or, given a student’s learning
profile, is on track to obtain rigorous, realistic growth in their content knowledge and skills.
This document presents results from a linking study conducted by NWEA in July 2020 to
statistically connect the scores of the Georgia Milestones End-of-Grade (EOG) assessments in
English Language Arts (ELA) and Mathematics with Rasch Unit (RIT) scores from the MAP
Growth assessments taken during the Spring 2019 term. The linking study has been updated
since the previous version published in February 2016 to incorporate the new 2020 NWEA MAP
Growth norms (Thum & Kuhfeld, 2020). In this updated study, MAP Growth cut scores are also
included for Grade 2 so educators can track early learners’ progress toward proficiency on the
Georgia Milestones test by Grade 3. This report presents the following results:
1. Student sample demographics
2. Descriptive statistics of test scores
3. MAP Growth cut scores that correspond to the Georgia Milestones EOG achievement
levels using the equipercentile linking procedure for the spring results and the 2020
norms for the fall and winter results
4. Classification accuracy statistics to determine the degree to which MAP Growth
accurately predicts student proficiency status on the Georgia Milestones EOG tests
5. The probability of achieving grade-level proficiency on the Georgia Milestones
assessment based on MAP Growth RIT scores from fall, winter, and spring using the
2020 norms
1.2. Assessment Overview
The Georgia Milestones EOG ELA and Mathematics summative assessments are aligned to the
Georgia Standards of Excellence and administered in Grades 3–8. Each assessment has three
cut scores (i.e., the minimum score a student must get on a test to be placed in a certain
achievement level) that distinguish between the following achievement levels: Beginning
Learner, Developing Learner, Proficient Learner, and Distinguished Learner. The Proficient
Learner cut score demarks the minimum level of performance considered to be proficient for
accountability purposes.
MAP Growth interim assessments from NWEA are computer adaptive and aligned to state-
specific content standards. Scores are reported on the RIT vertical scale with a range of 100–
350. Each content area has its own scale. To aid the interpretation of scores, NWEA periodically
conducts norming studies of student and school performance on MAP Growth. Achievement
status norms show how well a student performed on the MAP Growth test compared to students
in the norming group by associating the student’s performance on the MAP Growth test,
expressed as a RIT score, with a percentile ranking. Growth norms provide expected score
gains across test administrations (e.g., the relative evaluation of a student’s growth from fall to
spring). The most recent norms study was conducted in 2020 (Thum & Kuhfeld, 2020).

Linking Study: Predicting Performance on GA Milestones EOG from MAP Growth Page 8
2. Methods
2.1. Data Collection
This linking study is based on data from the Spring 2019 administrations of the MAP Growth
and Georgia Milestones EOG assessments. NWEA recruited Georgia districts to participate in
the study by sharing their student and score data for the target term. Districts also gave NWEA
permission to access students’ associated RIT scores from the NWEA in-house database. Once
Georgia state score information was received by NWEA, each student’s state testing record was
matched to their RIT score by using the student’s first and last names, date of birth, student ID,
and other available identifying information. Only students who took both the MAP Growth and
Georgia Milestones EOG assessments in Spring 2019 were included in the study sample.
2.2. Post-Stratification Weighting
Post-stratification weights were applied to the calculations to ensure that the linking study
sample represented the state population in terms of race, sex, and achievement level. These
variables were selected because they are correlated with the student’s academic achievement
within this study and are often provided in the data for the state population. The weighted
sample matches the target population as closely as possible on the key demographics and test
score characteristics. Specifically, a raking procedure was used to calculate the post-
stratification weights and improve the representativeness of the sample. Raking uses iterative
procedures to obtain weights that match sample marginal distributions to known population
margins. The following steps were taken during this process:
• Calculate marginal distributions of race, sex, and achievement level for the sample and
population.
• Calculate post-stratification weights with the rake function from the survey package in R
(Lumley, 2019).
• Trim the weight if it is not in the range of 0.3 to 3.0.
• Apply the weights to the sample before conducting the linking study analyses.
2.3. MAP Growth Cut Scores
The equipercentile linking method (Kolen & Brennan, 2004) was used to identify the spring RIT
scores that correspond to the spring Georgia Milestones EOG achievement level cut scores.
Spring cuts for Grade 2 were derived based on the cuts for Grade 3 and the 2020 NWEA growth
norms. RIT fall and winter cut scores that predict proficiency on the spring summative test were
then projected using the 2020 growth norms. Percentile ranks are also provided that show how a
nationally representative sample of students in the same grade scored on RIT for each
administration, which is an important interpretation of RIT scores. This is useful for
understanding (1) how student scores compare to peers nationwide and (2) the relative rigor of a
state’s achievement level designations for its summative assessment.
The MAP Growth spring cut scores for Grades 3–8 could be calculated using the equipercentile
linking method because that data are directly connected to the Georgia Milestones spring data
used in the study. The equipercentile linking procedure matches scores on the two scales that
have the same percentile rank (i.e., the proportion of tests at or below each score). For
example, let 𝑥 represent a score on Test 𝑋 (e.g., Georgia Milestones). Its equipercentile
equivalent score on Test 𝑌 (e.g., MAP Growth), 𝑒𝑦(𝑥), can be obtained through a cumulative-
distribution-based linking function defined in Equation 1:

Linking Study: Predicting Performance on GA Milestones EOG from MAP Growth Page 9
𝑒𝑦(𝑥) = 𝐺−1[𝑃(𝑥)] (1)
where 𝑒𝑦(𝑥) is the equipercentile equivalent of score 𝑥 on Georgia Milestones on the scale of
MAP Growth, 𝑃(𝑥) is the percentile rank of a given score on Georgia Milestones, and 𝐺−1 is the
inverse of the percentile rank function for MAP Growth that indicates the score on MAP Growth
corresponding to a given percentile. Polynomial loglinear pre-smoothing was applied to reduce
irregularities of the score distributions and equipercentile linking curve.
The MAP Growth conditional growth norms provide students’ expected score gains across
terms, such as growth from fall or winter to spring within the same grade or from spring of a
lower grade to the spring of the adjacent higher grade. This information can be used to calculate
the fall and winter cut scores for Grades 3–8 and the fall, winter, and spring cut scores for
Grade 2. Equation 2 was used to determine the previous term’s or grade’s MAP Growth score
needed to reach the spring cut score, considering the expected growth associated with the
previous RIT score:
𝑅𝐼𝑇𝑃𝑟𝑒𝑑𝑆𝑝𝑟𝑖𝑛𝑔 = 𝑅𝐼𝑇𝑝𝑟𝑒𝑣𝑖𝑜𝑢𝑠 + 𝑔 (2)
where:
• 𝑅𝐼𝑇𝑃𝑟𝑒𝑑𝑆𝑝𝑟𝑖𝑛𝑔 is the predicted MAP Growth spring score.
• 𝑅𝐼𝑇𝑝𝑟𝑒𝑣𝑖𝑜𝑢𝑠 is the previous term’s or grade’s RIT score.
• 𝑔 is the expected growth from the previous RIT (e.g., fall or winter) to the spring RIT.
To derive the spring cut scores from Grade 2, the growth score from spring of one year to the
next was used (i.e., the growth score from spring Grade 2 to spring Grade 3). The calculation of
fall and winter cuts for Grade 2 followed the same process as the other grades. For example,
the growth score from fall to spring in Grade 2 was used to calculate the fall cuts for Grade 2.
2.4. Classification Accuracy
The degree to which MAP Growth predicts student proficiency status on the Georgia Milestones
tests can be described using classification accuracy statistics based on the MAP Growth spring
cut scores that show the proportion of students correctly classified by their RIT scores as
proficient (Proficient Learner or Distinguished Learner) or not proficient (Beginning Learner or
Developing Learner). Table 2.1 describes the classification accuracy statistics provided in this
report (Pommerich, Hanson, Harris, & Sconing, 2004). The results are based on the Spring
2019 MAP Growth and Georgia Milestones data for the Proficient Learners cut score.
Since Georgia students do not begin taking the Georgia Milestones EOG assessments until
Grade 3, longitudinal data were collected for the 2018–2019 Grade 3 cohort in order to link the
Georgia Milestones assessment to MAP Growth for Grade 2 to calculate the classification
accuracy statistics. To accomplish this, 2018–2019 Georgia Milestones Grade 3 results were
linked to MAP Growth data from Grade 3 students in 2018–2019 and Grade 2 students in 2017–
2018. In this way, the data came from the same cohort of students beginning when they were in
Grade 2 and continuing through Grade 3.

Linking Study: Predicting Performance on GA Milestones EOG from MAP Growth Page 10
Table 2.1. Description of Classification Accuracy Summary Statistics
Statistic Description* Interpretation
Overall
Classification
Accuracy Rate
(TP + TN) / (total
sample size)
Proportion of the study sample whose proficiency classification
on the state test was correctly predicted by MAP Growth cut
scores
False Negative
(FN) Rate FN / (FN + TP)
Proportion of not-proficient students identified by MAP Growth
in those observed as proficient on the state test
False Positive
(FP) Rate FP / (FP + TN)
Proportion of proficient students identified by MAP Growth in
those observed as not proficient on the state test
Sensitivity TP / (TP + FN) Proportion of proficient students identified by MAP Growth in
those observed as such on the state test
Specificity TN / (TN + FP) Proportion of not-proficient students identified by MAP Growth
in those observed as such on the state test
Precision TP / (TP + FP) Proportion of observed proficient students on the state test in
those identified as such by the MAP Growth test
Area Under the
Curve (AUC)
Area under the
receiver operating
characteristics
(ROC) curve
How well MAP Growth cut scores separate the study sample
into proficiency categories that match those from the state test
cut scores. An AUC at or above 0.80 is considered “good”
accuracy.
*FP = false positives. FN = false negatives. TP = true positives. TN = true negatives.
2.5. Proficiency Projection
In addition to calculating the MAP Growth fall and winter cut scores, the MAP Growth
conditional growth norms data were also used to calculate the probability of reaching proficiency
on the Georgia Milestones test based on a student’s RIT scores from fall, winter, and spring.
Equation 3 was used to calculate the probability of a student achieving Proficient Learner on the
Georgia Milestones test based on their fall or winter RIT score:
𝑃𝑟(𝐴𝑐ℎ𝑖𝑒𝑣𝑖𝑛𝑔 𝑃𝑟𝑜𝑓𝑖𝑐𝑖𝑒𝑛𝑡 𝐿𝑒𝑎𝑟𝑛𝑒𝑟 𝑖𝑛 𝑠𝑝𝑟𝑖𝑛𝑔| 𝑠𝑡𝑎𝑟𝑡𝑖𝑛𝑔 𝑅𝐼𝑇) = Φ ( 𝑅𝐼𝑇𝑝𝑟𝑒𝑣𝑖𝑜𝑢𝑠 + 𝑔 − 𝑅𝐼𝑇𝑆𝑝𝑟𝑖𝑛𝑔𝐶𝑢𝑡
𝑆𝐷) (3)
where:
• Φ is a standardized normal cumulative distribution.
• 𝑅𝐼𝑇𝑝𝑟𝑒𝑣𝑖𝑜𝑢𝑠 is the student’s RIT score in fall or winter (or in spring of Grade 2).
• 𝑔 is the expected growth from the previous RIT (e.g., fall or winter) to the spring RIT.
• 𝑅𝐼𝑇𝑆𝑝𝑟𝑖𝑛𝑔𝐶𝑢𝑡 is the MAP Growth Proficient Learner cut score for spring. For Grade 2, this
is the Grade 3 cut score for spring.
• 𝑆𝐷 is the conditional standard deviation of the expected growth, 𝑔.
Equation 4 was used to estimate the probability of a student achieving Proficient Learner on the
Georgia Milestones test based on their spring RIT score (𝑅𝐼𝑇𝑆𝑝𝑟𝑖𝑛𝑔):
𝑃𝑟(𝐴𝑐ℎ𝑖𝑒𝑣𝑖𝑛𝑔 𝑃𝑟𝑜𝑓𝑖𝑐𝑖𝑒𝑛𝑡 𝐿𝑒𝑎𝑟𝑛𝑒𝑟 𝑖𝑛 𝑠𝑝𝑟𝑖𝑛𝑔 | 𝑠𝑝𝑟𝑖𝑛𝑔 𝑅𝐼𝑇) = Φ ( 𝑅𝐼𝑇𝑆𝑝𝑟𝑖𝑛𝑔−𝑅𝐼𝑇𝑆𝑝𝑟𝑖𝑛𝑔𝐶𝑢𝑡
𝑆𝐸) (4)
where 𝑆𝐸 is the standard error of measurement for MAP Growth.

Linking Study: Predicting Performance on GA Milestones EOG from MAP Growth Page 11
3. Results
3.1. Study Sample
Only students who took both the MAP Growth and Georgia Milestones EOG assessments in
Spring 2019 were included in the study sample. Data used in this study were collected from 28
districts and 219 schools in Georgia. Table 3.1 presents the demographic distributions of race,
sex, and achievement level in the original unweighted study sample, and Table 3.2 presents the
distributions of the student population that took the Spring 2019 Georgia Milestones EOG tests
(GOSA, 2019). Since the unweighted data are different from the general Georgia Milestones
population, post-stratification weights were applied to the linking study sample to improve its
representativeness. Table 3.3 presents the demographic distributions of the sample after
weighting, which are almost identical to the Georgia student population distributions. The
analyses in this study were therefore conducted based on the weighted sample.
Table 3.1. Linking Study Sample Demographics (Unweighted)
Linking Study Sample (Unweighted)
%Students by Grade
Demographic Subgroup 3 4 5 6 7 8
ELA/Reading
Total N 12,930 14,537 13,826 14,545 11,764 10,106
Race
Asian 1.9 2.1 1.9 2.2 2.2 2.2
Black 29.4 30.6 29.6 31.0 28.0 28.7
Hispanic 17.5 17.3 17.8 17.7 19.0 19.7
Multi-Race 4.5 4.4 4.1 4.3 4.0 3.7
Other 1.7 1.6 1.6 1.7 2.0 2.5
White 45.0 44.1 45.1 43.0 44.8 43.2
Sex Female 49.0 49.2 48.7 47.9 49.9 49.1
Male 51.0 50.8 51.3 52.1 50.1 50.9
Achievement
Level
Beginning 30.0 25.6 22.8 27.2 30.3 19.3
Developing 32.0 34.0 35.9 30.6 35.6 38.3
Proficient 26.7 26.8 32.6 32.8 27.9 34.2
Distinguished 11.4 13.6 8.6 9.3 6.2 8.1
Mathematics
Total N 12,877 14,652 13,837 14,776 11,828 9,964
Race
Asian 1.9 2.1 1.9 2.2 2.2 1.6
Black 29.4 30.7 29.6 31.4 28.6 29.5
Hispanic 17.6 17.2 17.8 17.6 18.9 19.3
Multi-Race 4.5 4.4 4.2 4.4 4.0 3.8
Other 1.7 1.6 1.6 1.7 2.0 2.3
White 45.0 44.0 45.0 42.7 44.4 43.4
Sex Female 49.0 49.3 48.7 47.9 49.9 49.6
Male 51.0 50.7 51.3 52.1 50.1 50.4
Achievement
Level
Beginning 16.9 16.4 22.4 19.5 21.8 20.1
Developing 33.5 36.3 40.2 41.9 39.0 42.6
Proficient 39.1 36.1 27.2 29.0 28.3 29.4
Distinguished 10.5 11.2 10.2 9.6 10.9 7.9

Linking Study: Predicting Performance on GA Milestones EOG from MAP Growth Page 12
Table 3.2. Spring 2019 Georgia Milestones EOG Student Population Demographics
Spring 2019 Georgia Milestones EOG Population
%Students by Grade
Demographic Subgroup 3 4 5 6 7 8
ELA
Total N 128,777 133,027 135,905 136,207 132,786 124,134
Race
Asian 4.4 4.2 4.2 4.2 4.2 4.2
Black 36.6 37.2 37.1 37.2 36.6 36.8
Hispanic 17.0 17.0 17.0 17.1 17.0 16.6
Multi-Race 4.2 4.0 3.9 3.8 3.6 3.5
Other 0.3 0.3 0.3 0.3 0.3 0.3
White 37.5 37.3 37.5 37.4 38.3 38.5
Sex Female 49.1 48.9 48.9 49.1 49.0 48.6
Male 50.9 51.1 51.1 50.9 51.0 51.4
Achievement
Level
Beginning 26.3 25.2 19.8 26.4 28.2 17.8
Developing 31.7 32.4 34.8 27.7 32.9 34.8
Proficient 27.9 26.6 34.3 34.9 30.7 35.5
Distinguished 14.1 15.8 11.1 11.0 8.1 11.8
Mathematics
Total N 128,610 132,967 135,855 136,159 132,322 102,928
Race
Asian 4.4 4.2 4.2 4.2 4.1 2.2
Black 36.6 37.2 37.1 37.2 36.6 39.5
Hispanic 17.0 17.0 17.0 17.1 17.1 16.9
Multi-Race 4.2 4.0 3.9 3.8 3.6 3.4
Other 0.3 0.3 0.3 0.3 0.3 0.3
White 37.5 37.3 37.5 37.4 38.3 37.7
Sex Female 49.1 48.9 48.9 49.1 49.0 48.4
Male 50.9 51.1 51.1 50.9 51.0 51.6
Achievement
Level
Beginning 17.5 17.7 19.4 21.8 22.0 21.9
Developing 30.8 33.1 39.8 38.7 35.3 43.1
Proficient 38.6 35.7 27.3 27.3 28.0 27.5
Distinguished 13.2 13.5 13.5 12.3 14.6 7.6

Linking Study: Predicting Performance on GA Milestones EOG from MAP Growth Page 13
Table 3.3. Linking Study Sample Demographics (Weighted)
Linking Study Sample (Weighted)
%Students by Grade
Demographic Subgroup 3 4 5 6 7 8
ELA/Reading
Total N 12,930 14,537 13,826 14,545 11,752 10,096
Race
Asian 4.4 4.2 4.2 4.2 4.2 4.2
Black 36.6 37.2 37.1 37.2 36.6 36.8
Hispanic 17.0 17.0 17.0 17.1 17.0 16.6
Multi-Race 4.2 4.0 3.9 3.8 3.6 3.5
Other 0.3 0.3 0.3 0.3 0.3 0.3
White 37.5 37.3 37.5 37.4 38.3 38.5
Sex Female 49.1 48.9 48.9 49.1 49.0 48.6
Male 50.9 51.1 51.1 50.9 51.0 51.4
Achievement
Level
Beginning 26.3 25.2 19.8 26.4 28.2 17.8
Developing 31.7 32.4 34.8 27.7 32.9 34.8
Proficient 27.9 26.6 34.3 34.9 30.7 35.5
Distinguished 14.1 15.8 11.1 11.0 8.1 11.8
Mathematics
Total N 12,890 14,652 13,837 14,791 11,816 9,974
Race
Asian 4.4 4.2 4.2 4.2 4.1 2.2
Black 36.6 37.2 37.1 37.2 36.6 39.5
Hispanic 17.0 17.0 17.0 17.1 17.1 16.9
Multi-Race 4.2 4.0 3.9 3.8 3.6 3.4
Other 0.3 0.3 0.3 0.3 0.3 0.3
White 37.5 37.3 37.5 37.4 38.3 37.7
Sex Female 49.1 48.9 48.9 49.1 49.0 48.4
Male 50.9 51.1 51.1 50.9 51.0 51.6
Achievement
Level
Beginning 17.5 17.7 19.4 21.8 22.0 21.9
Developing 30.8 33.1 39.8 38.7 35.3 43.1
Proficient 38.6 35.7 27.3 27.3 28.0 27.5
Distinguished 13.2 13.5 13.5 12.3 14.6 7.6
3.2. Descriptive Statistics
Table 3.4 presents descriptive statistics of the MAP Growth and Georgia Milestones EOG test
scores from Spring 2019, including the correlation coefficient (r) between them. The correlation
coefficients between the scores range from 0.80 to 0.84 for ELA/Reading and 0.81 to 0.87 for
Mathematics. These values indicate a strong relationship among the scores, which is important
validity evidence for the claim that MAP Growth scores are good predictors of performance on
the Georgia Milestones EOG assessments.

Linking Study: Predicting Performance on GA Milestones EOG from MAP Growth Page 14
Table 3.4. Descriptive Statistics of Test Scores
Grade N r
Georgia Milestones* MAP Growth*
Mean SD Min. Max. Mean SD Min. Max.
ELA/Reading
3 12,930 0.84 513.2 59.9 270 779 197.5 15.7 142 243
4 14,537 0.83 513.8 55.1 316 775 204.3 15.7 141 256
5 13,826 0.82 519.7 53.2 316 760 211.0 14.7 142 265
6 14,545 0.82 515.8 65.3 295 769 214.2 15.1 154 262
7 11,752 0.82 510.3 56.8 331 785 218.2 15.6 154 267
8 10,096 0.80 519.8 49.6 339 730 221.3 14.7 152 266
Mathematics
3 12,890 0.87 524.8 50.8 320 705 201.2 13.5 136 251
4 14,652 0.87 524.7 50.9 360 715 210.9 15.0 134 261
5 13,837 0.86 518.8 52.4 352 725 219.3 16.1 143 277
6 14,791 0.87 516.3 49.8 381 700 220.7 17.0 141 275
7 11,816 0.86 520.6 53.9 381 740 226.9 18.1 144 278
8 9,974 0.81 510.9 45.9 363 755 227.3 16.6 151 298
*SD = standard deviation. Min. = minimum. Max. = maximum.
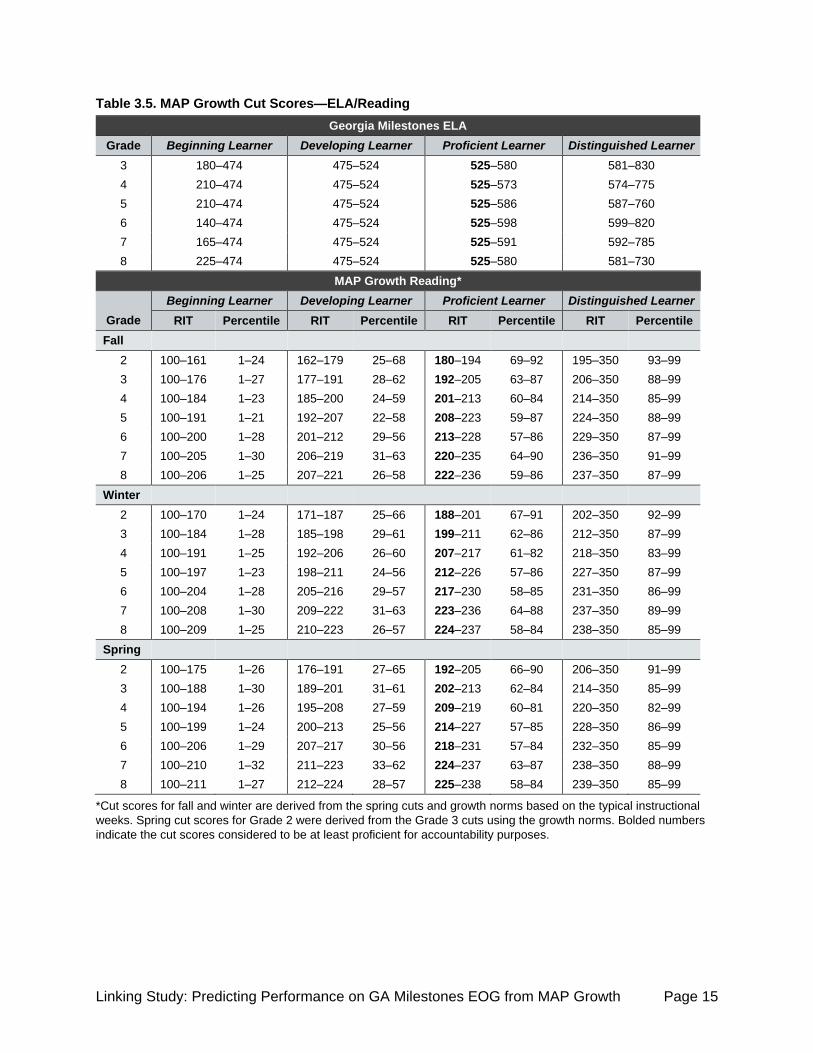
3.3. MAP Growth Cut Scores
Table 3.5 and Table 3.6 present the Georgia scale score ranges and the corresponding MAP
Growth RIT cut scores and percentile ranges by content area and grade. These tables can be
used to predict a student’s likely achievement level on the Georgia Milestones EOG spring
assessment when MAP Growth is taken in the fall, winter, or spring. For example, a Grade 3
student who obtained a MAP Growth Reading RIT score of 192 in the fall is likely to reach
Proficient Learner on the Georgia Milestones Grade 3 ELA test in the spring. A Grade 3 student
who obtained a MAP Growth Reading RIT score of 202 in the spring is also likely to reach
Proficient Learner on the Georgia Milestones assessment. The spring cut score is higher than
the fall cut score because growth is expected between fall and spring as students receive more
instruction during the school year.
Within this report, the cut scores for fall and winter are derived from the spring cuts and the
typical growth scores from fall-to-spring or winter-to-spring. The typical growth scores are based
on the default instructional weeks most commonly encountered for each term (Weeks 4, 20, and
32 for fall, winter, and spring, respectively). Since instructional weeks often vary by district, the
cut scores in this report may differ slightly from the MAP Growth score reports that reflect
instructional weeks set by partners. If the actual instructional weeks deviate from the default
ones, a student’s projected achievement level could be different from the generic projection
presented in this document. Partners are therefore encouraged to use the projected
achievement level in students’ profile, classroom, and grade reports in the NWEA reporting
system since they reflect the specific instructional weeks set by partners.
Linking Study: Predicting Performance on GA Milestones EOG from MAP Growth Page 15
Table 3.5. MAP Growth Cut Scores—ELA/Reading
Georgia Milestones ELA
Grade Beginning Learner Developing Learner Proficient Learner Distinguished Learner
3 180–474 475–524 525–580 581–830
4 210–474 475–524 525–573 574–775
5 210–474 475–524 525–586 587–760
6 140–474 475–524 525–598 599–820
7 165–474 475–524 525–591 592–785
8 225–474 475–524 525–580 581–730
MAP Growth Reading*
Grade
Beginning Learner Developing Learner Proficient Learner Distinguished Learner
RIT Percentile RIT Percentile RIT Percentile RIT Percentile
Fall
2 100–161 1–24 162–179 25–68 180–194 69–92 195–350 93–99
3 100–176 1–27 177–191 28–62 192–205 63–87 206–350 88–99
4 100–184 1–23 185–200 24–59 201–213 60–84 214–350 85–99
5 100–191 1–21 192–207 22–58 208–223 59–87 224–350 88–99
6 100–200 1–28 201–212 29–56 213–228 57–86 229–350 87–99
7 100–205 1–30 206–219 31–63 220–235 64–90 236–350 91–99
8 100–206 1–25 207–221 26–58 222–236 59–86 237–350 87–99
Winter
2 100–170 1–24 171–187 25–66 188–201 67–91 202–350 92–99
3 100–184 1–28 185–198 29–61 199–211 62–86 212–350 87–99
4 100–191 1–25 192–206 26–60 207–217 61–82 218–350 83–99
5 100–197 1–23 198–211 24–56 212–226 57–86 227–350 87–99
6 100–204 1–28 205–216 29–57 217–230 58–85 231–350 86–99
7 100–208 1–30 209–222 31–63 223–236 64–88 237–350 89–99
8 100–209 1–25 210–223 26–57 224–237 58–84 238–350 85–99
Spring
2 100–175 1–26 176–191 27–65 192–205 66–90 206–350 91–99
3 100–188 1–30 189–201 31–61 202–213 62–84 214–350 85–99
4 100–194 1–26 195–208 27–59 209–219 60–81 220–350 82–99
5 100–199 1–24 200–213 25–56 214–227 57–85 228–350 86–99
6 100–206 1–29 207–217 30–56 218–231 57–84 232–350 85–99
7 100–210 1–32 211–223 33–62 224–237 63–87 238–350 88–99
8 100–211 1–27 212–224 28–57 225–238 58–84 239–350 85–99
*Cut scores for fall and winter are derived from the spring cuts and growth norms based on the typical instructional
weeks. Spring cut scores for Grade 2 were derived from the Grade 3 cuts using the growth norms. Bolded numbers
indicate the cut scores considered to be at least proficient for accountability purposes.

Linking Study: Predicting Performance on GA Milestones EOG from MAP Growth Page 16
Table 3.6. MAP Growth Cut Scores—Mathematics
Georgia Milestones Mathematics
Grade Beginning Learner Developing Learner Proficient Learner Distinguished Learner
3 290–474 475–524 525–579 580–705
4 270–474 475–524 525–584 585–715
5 265–474 475–524 525–579 580–725
6 285–474 475–524 525–579 580–700
7 265–474 475–524 525–579 580–740
8 275–474 475–524 525–578 579–755
MAP Growth Mathematics*
Grade
Beginning Learner Developing Learner Proficient Learner Distinguished Learner
RIT Percentile RIT Percentile RIT Percentile RIT Percentile
Fall
2 100–159 1–11 160–177 12–58 178–191 59–89 192–350 90–99
3 100–175 1–17 176–189 18–54 190–202 55–85 203–350 86–99
4 100–185 1–16 186–201 17–56 202–216 57–88 217–350 89–99
5 100–196 1–20 197–213 21–62 214–227 63–88 228–350 89–99
6 100–198 1–15 199–217 16–57 218–232 58–86 233–350 87–99
7 100–206 1–21 207–223 22–58 224–238 59–85 239–350 86–99
8 100–208 1–19 209–229 20–60 230–244 61–85 245–350 86–99
Winter
2 100–169 1–13 170–186 14–58 187–199 59–88 200–350 89–99
3 100–183 1–17 184–197 18–54 198–209 55–83 210–350 84–99
4 100–191 1–16 192–208 17–57 209–223 58–88 224–350 89–99
5 100–201 1–20 202–219 21–62 220–233 63–88 234–350 89–99
6 100–203 1–17 204–222 18–57 223–237 58–85 238–350 86–99
7 100–209 1–21 210–227 22–58 228–242 59–84 243–350 85–99
8 100–212 1–21 213–232 22–59 233–247 60–84 248–350 85–99
Spring
2 100–175 1–15 176–191 16–57 192–204 58–87 205–350 88–99
3 100–188 1–19 189–202 20–54 203–214 55–83 215–350 84–99
4 100–196 1–18 197–212 19–55 213–227 56–86 228–350 87–99
5 100–205 1–21 206–223 22–61 224–237 62–87 238–350 88–99
6 100–206 1–17 207–225 18–56 226–240 57–84 241–350 85–99
7 100–212 1–22 213–230 23–58 231–245 59–84 246–350 85–99
8 100–214 1–21 215–234 22–58 235–249 59–83 250–350 84–99
*Cut scores for fall and winter are derived from the spring cuts and growth norms based on the typical instructional
weeks. Spring cut scores for Grade 2 were derived from the Grade 3 cuts using the growth norms. Bolded numbers
indicate the cut scores considered to be at least proficient for accountability purposes.

Linking Study: Predicting Performance on GA Milestones EOG from MAP Growth Page 17
3.4. Classification Accuracy
Table 3.7 presents the classification accuracy summary statistics, including the overall
classification accuracy rate. These results indicate how well MAP Growth spring RIT scores
predict proficiency on the Georgia Milestones EOG tests, providing insight into the predictive
validity of MAP Growth. The overall classification accuracy rate ranges from 0.80 to 0.84 for
ELA/Reading and 0.81 to 0.88 for Mathematics. These values suggest that the RIT cut scores
are good at classifying students as proficient or not proficient on the Georgia Milestones EOG
assessment. For Grade 2, the classification accuracy rate refers to how well the MAP Growth
cuts can predict students’ proficiency status on Georgia Milestones in Grade 3.
Although the results show that MAP Growth scores can be used to accurately classify students
as likely to be proficient on the Georgia Milestones tests, there is a notable limitation to how
these results should be used and interpreted. Georgia Milestones and MAP Growth
assessments are designed for different purposes and measure slightly different constructs even
within the same content area. Therefore, scores on the two tests cannot be assumed to be
interchangeable. MAP Growth may not be used as a substitute for the state tests and vice
versa.
Table 3.7. Classification Accuracy Results
Grade N
Cut Score
Class.
Accuracy*
Rate*
Sensitivity Specificity Precision AUC*
MAP
Growth
Georgia
Milestones FP FN
ELA/Reading
2 9,451 192 525 0.80 0.15 0.28 0.72 0.85 0.75 0.88
3 12,930 202 525 0.84 0.15 0.17 0.83 0.85 0.80 0.92
4 14,537 209 525 0.84 0.15 0.18 0.82 0.85 0.80 0.92
5 13,826 214 525 0.83 0.18 0.16 0.84 0.82 0.79 0.92
6 14,545 218 525 0.83 0.15 0.20 0.80 0.85 0.82 0.91
7 11,752 224 525 0.84 0.12 0.21 0.79 0.88 0.80 0.92
8 10,096 225 525 0.82 0.13 0.23 0.77 0.87 0.84 0.90
Mathematics
2 9,334 192 525 0.81 0.16 0.22 0.78 0.84 0.83 0.89
3 12,890 203 525 0.86 0.13 0.15 0.85 0.87 0.88 0.94
4 14,652 213 525 0.87 0.12 0.13 0.87 0.88 0.87 0.95
5 13,837 224 525 0.87 0.11 0.15 0.85 0.89 0.84 0.95
6 14,791 226 525 0.87 0.12 0.14 0.86 0.88 0.83 0.95
7 11,816 231 525 0.88 0.12 0.12 0.88 0.88 0.84 0.95
8 9,974 235 525 0.84 0.10 0.25 0.75 0.90 0.80 0.91
*Class. Accuracy = overall classification accuracy rate. FP = false positives. FN = false negatives. AUC = area under
the ROC curve.

Linking Study: Predicting Performance on GA Milestones EOG from MAP Growth Page 18
3.5. Proficiency Projection
Table 3.8 and Table 3.9 present the estimated probability of achieving Proficient Learner
achievement on the Georgia Milestones EOG test based on RIT scores from fall, winter, or
spring. For example, a Grade 3 student who obtained a MAP Growth Reading score of 201 in
the fall has an 86% chance of reaching Proficient Learner or higher on the Georgia Milestones
Grade 3 test. “Prob.” indicates the probability of obtaining proficient status on the Georgia
Milestones test in the spring.
Table 3.8. Proficiency Projection based on RIT Scores—ELA/Reading
ELA/Reading
Fall Winter Spring
Start
%ile
Spring
Cut
Fall
RIT
Projected Proficiency Winter
RIT
Projected Proficiency Spring
RIT
Projected Proficiency
Grade Proficient Prob. Proficient Prob. Proficient Prob.
2
5 192 147 No <0.01 156 No <0.01 160 No <0.01
10 192 153 No <0.01 162 No <0.01 166 No <0.01
15 192 157 No <0.01 166 No <0.01 170 No <0.01
20 192 160 No 0.01 169 No <0.01 173 No <0.01
25 192 162 No 0.02 171 No <0.01 175 No <0.01
30 192 164 No 0.03 173 No <0.01 177 No <0.01
35 192 166 No 0.06 175 No 0.01 180 No <0.01
40 192 168 No 0.09 177 No 0.03 182 No <0.01
45 192 170 No 0.12 179 No 0.05 184 No 0.01
50 192 172 No 0.18 181 No 0.10 186 No 0.03
55 192 174 No 0.25 183 No 0.17 188 No 0.11
60 192 176 No 0.35 185 No 0.29 189 No 0.17
65 192 178 No 0.45 187 No 0.43 192 Yes 0.50
70 192 180 Yes 0.50 189 Yes 0.57 194 Yes 0.73
75 192 183 Yes 0.65 191 Yes 0.71 196 Yes 0.89
80 192 185 Yes 0.75 194 Yes 0.87 199 Yes 0.99
85 192 188 Yes 0.82 197 Yes 0.95 202 Yes >0.99
90 192 192 Yes 0.93 200 Yes 0.99 205 Yes >0.99
95 192 197 Yes 0.98 206 Yes >0.99 211 Yes >0.99

Linking Study: Predicting Performance on GA Milestones EOG from MAP Growth Page 19
ELA/Reading
Fall Winter Spring
Start
%ile
Spring
Cut
Fall
RIT
Projected Proficiency Winter
RIT
Projected Proficiency Spring
RIT
Projected Proficiency
Grade Proficient Prob. Proficient Prob. Proficient Prob.
3
5 202 159 No <0.01 167 No <0.01 170 No <0.01
10 202 165 No <0.01 173 No <0.01 176 No <0.01
15 202 169 No <0.01 177 No <0.01 180 No <0.01
20 202 173 No 0.01 180 No <0.01 183 No <0.01
25 202 175 No 0.02 183 No <0.01 186 No <0.01
30 202 178 No 0.05 185 No 0.01 189 No <0.01
35 202 180 No 0.07 188 No 0.03 191 No <0.01
40 202 182 No 0.11 190 No 0.05 193 No <0.01
45 202 185 No 0.21 192 No 0.09 195 No 0.01
50 202 187 No 0.25 194 No 0.17 197 No 0.06
55 202 189 No 0.34 196 No 0.29 199 No 0.17
60 202 191 No 0.45 198 No 0.43 201 No 0.38
65 202 193 Yes 0.55 200 Yes 0.57 203 Yes 0.62
70 202 195 Yes 0.61 202 Yes 0.71 206 Yes 0.89
75 202 198 Yes 0.75 205 Yes 0.87 208 Yes 0.97
80 202 201 Yes 0.86 207 Yes 0.93 211 Yes >0.99
85 202 204 Yes 0.91 211 Yes 0.98 214 Yes >0.99
90 202 208 Yes 0.97 215 Yes >0.99 218 Yes >0.99
95 202 214 Yes 0.99 220 Yes >0.99 224 Yes >0.99
4
5 209 169 No <0.01 176 No <0.01 178 No <0.01
10 209 175 No <0.01 182 No <0.01 184 No <0.01
15 209 179 No <0.01 186 No <0.01 188 No <0.01
20 209 183 No 0.01 189 No <0.01 191 No <0.01
25 209 185 No 0.03 192 No <0.01 194 No <0.01
30 209 188 No 0.05 194 No 0.01 196 No <0.01
35 209 190 No 0.08 196 No 0.03 199 No <0.01
40 209 192 No 0.13 198 No 0.06 201 No 0.01
45 209 195 No 0.20 200 No 0.09 203 No 0.03
50 209 197 No 0.29 202 No 0.17 205 No 0.11
55 209 199 No 0.39 205 No 0.35 207 No 0.27
60 209 201 Yes 0.50 207 Yes 0.50 209 Yes 0.50
65 209 203 Yes 0.56 209 Yes 0.65 211 Yes 0.73
70 209 205 Yes 0.66 211 Yes 0.78 213 Yes 0.89
75 209 208 Yes 0.80 213 Yes 0.87 216 Yes 0.99
80 209 211 Yes 0.87 216 Yes 0.96 219 Yes >0.99
85 209 214 Yes 0.94 219 Yes 0.99 222 Yes >0.99
90 209 218 Yes 0.97 223 Yes >0.99 226 Yes >0.99
95 209 224 Yes >0.99 229 Yes >0.99 232 Yes >0.99

Linking Study: Predicting Performance on GA Milestones EOG from MAP Growth Page 20
ELA/Reading
Fall Winter Spring
Start
%ile
Spring
Cut
Fall
RIT
Projected Proficiency Winter
RIT
Projected Proficiency Spring
RIT
Projected Proficiency
Grade Proficient Prob. Proficient Prob. Proficient Prob.
5
5 214 178 No <0.01 183 No <0.01 185 No <0.01
10 214 183 No <0.01 189 No <0.01 191 No <0.01
15 214 187 No 0.01 193 No <0.01 194 No <0.01
20 214 191 No 0.02 196 No <0.01 198 No <0.01
25 214 193 No 0.04 198 No <0.01 200 No <0.01
30 214 196 No 0.08 201 No 0.02 203 No <0.01
35 214 198 No 0.11 203 No 0.04 205 No <0.01
40 214 200 No 0.17 205 No 0.09 207 No 0.01
45 214 202 No 0.24 207 No 0.17 209 No 0.06
50 214 204 No 0.34 209 No 0.28 211 No 0.17
55 214 207 No 0.44 211 No 0.42 213 No 0.38
60 214 209 Yes 0.56 213 Yes 0.58 215 Yes 0.62
65 214 211 Yes 0.66 215 Yes 0.72 217 Yes 0.83
70 214 213 Yes 0.71 217 Yes 0.78 219 Yes 0.94
75 214 216 Yes 0.83 220 Yes 0.91 222 Yes 0.99
80 214 218 Yes 0.89 222 Yes 0.96 224 Yes >0.99
85 214 221 Yes 0.94 226 Yes 0.99 228 Yes >0.99
90 214 225 Yes 0.98 229 Yes >0.99 231 Yes >0.99
95 214 231 Yes >0.99 235 Yes >0.99 237 Yes >0.99
6
5 218 183 No <0.01 188 No <0.01 189 No <0.01
10 218 189 No <0.01 193 No <0.01 195 No <0.01
15 218 193 No <0.01 197 No <0.01 199 No <0.01
20 218 196 No 0.02 200 No <0.01 202 No <0.01
25 218 199 No 0.04 203 No 0.01 205 No <0.01
30 218 202 No 0.08 205 No 0.02 207 No <0.01
35 218 204 No 0.13 208 No 0.06 209 No <0.01
40 218 206 No 0.19 210 No 0.12 211 No 0.01
45 218 208 No 0.24 212 No 0.22 213 No 0.06
50 218 210 No 0.33 214 No 0.35 215 No 0.17
55 218 212 No 0.44 216 No 0.42 217 No 0.38
60 218 214 Yes 0.56 218 Yes 0.58 219 Yes 0.62
65 218 217 Yes 0.67 220 Yes 0.72 222 Yes 0.89
70 218 219 Yes 0.76 222 Yes 0.83 224 Yes 0.97
75 218 221 Yes 0.84 225 Yes 0.94 226 Yes 0.99
80 218 224 Yes 0.90 227 Yes 0.97 229 Yes >0.99
85 218 227 Yes 0.96 230 Yes 0.99 232 Yes >0.99
90 218 231 Yes 0.99 234 Yes >0.99 236 Yes >0.99
95 218 237 Yes >0.99 240 Yes >0.99 242 Yes >0.99

Linking Study: Predicting Performance on GA Milestones EOG from MAP Growth Page 21
ELA/Reading
Fall Winter Spring
Start
%ile
Spring
Cut
Fall
RIT
Projected Proficiency Winter
RIT
Projected Proficiency Spring
RIT
Projected Proficiency
Grade Proficient Prob. Proficient Prob. Proficient Prob.
7
5 224 187 No <0.01 190 No <0.01 191 No <0.01
10 224 193 No <0.01 196 No <0.01 197 No <0.01
15 224 197 No <0.01 200 No <0.01 201 No <0.01
20 224 200 No <0.01 203 No <0.01 205 No <0.01
25 224 203 No 0.01 206 No <0.01 207 No <0.01
30 224 206 No 0.03 209 No 0.01 210 No <0.01
35 224 208 No 0.06 211 No 0.02 212 No <0.01
40 224 210 No 0.10 213 No 0.03 214 No <0.01
45 224 212 No 0.12 215 No 0.06 216 No 0.01
50 224 214 No 0.19 217 No 0.12 218 No 0.03
55 224 216 No 0.28 219 No 0.22 220 No 0.11
60 224 218 No 0.39 221 No 0.35 223 No 0.38
65 224 221 Yes 0.50 223 Yes 0.50 225 Yes 0.62
70 224 223 Yes 0.61 226 Yes 0.72 227 Yes 0.83
75 224 225 Yes 0.72 228 Yes 0.83 229 Yes 0.94
80 224 228 Yes 0.84 231 Yes 0.94 232 Yes 0.99
85 224 231 Yes 0.90 234 Yes 0.98 235 Yes >0.99
90 224 235 Yes 0.97 238 Yes >0.99 239 Yes >0.99
95 224 241 Yes >0.99 244 Yes >0.99 245 Yes >0.99
8
5 225 190 No <0.01 193 No <0.01 194 No <0.01
10 225 196 No <0.01 199 No <0.01 200 No <0.01
15 225 200 No <0.01 203 No <0.01 204 No <0.01
20 225 204 No 0.01 206 No <0.01 207 No <0.01
25 225 207 No 0.04 209 No <0.01 210 No <0.01
30 225 209 No 0.06 212 No 0.01 213 No <0.01
35 225 211 No 0.08 214 No 0.03 215 No <0.01
40 225 214 No 0.17 216 No 0.06 217 No 0.01
45 225 216 No 0.24 218 No 0.13 220 No 0.06
50 225 218 No 0.34 221 No 0.28 222 No 0.17
55 225 220 No 0.39 223 No 0.42 224 No 0.38
60 225 222 Yes 0.50 225 Yes 0.58 226 Yes 0.62
65 225 225 Yes 0.66 227 Yes 0.72 228 Yes 0.83
70 225 227 Yes 0.76 229 Yes 0.83 231 Yes 0.97
75 225 230 Yes 0.83 232 Yes 0.94 233 Yes 0.99
80 225 232 Yes 0.89 235 Yes 0.98 236 Yes >0.99
85 225 236 Yes 0.96 238 Yes >0.99 239 Yes >0.99
90 225 240 Yes 0.99 242 Yes >0.99 243 Yes >0.99
95 225 246 Yes >0.99 248 Yes >0.99 249 Yes >0.99

Linking Study: Predicting Performance on GA Milestones EOG from MAP Growth Page 22
Table 3.9. Proficiency Projection based on RIT Scores—Mathematics
Mathematics
Fall Winter Spring
Start
%ile
Spring
Cut
Fall
RIT
Projected Proficiency Winter
RIT
Projected Proficiency Spring
RIT
Projected Proficiency
Grade Proficient Prob. Proficient Prob. Proficient Prob.
2
5 192 154 No <0.01 163 No <0.01 167 No <0.01
10 192 158 No <0.01 167 No <0.01 172 No <0.01
15 192 162 No 0.01 171 No <0.01 175 No <0.01
20 192 164 No 0.02 173 No <0.01 178 No <0.01
25 192 166 No 0.04 175 No 0.01 180 No <0.01
30 192 168 No 0.08 177 No 0.03 182 No <0.01
35 192 170 No 0.14 179 No 0.07 184 No <0.01
40 192 172 No 0.22 181 No 0.10 186 No 0.02
45 192 173 No 0.27 182 No 0.15 188 No 0.08
50 192 175 No 0.32 184 No 0.26 189 No 0.15
55 192 177 No 0.44 186 No 0.42 191 No 0.37
60 192 178 Yes 0.50 187 Yes 0.50 193 Yes 0.63
65 192 180 Yes 0.62 189 Yes 0.66 195 Yes 0.85
70 192 182 Yes 0.73 191 Yes 0.80 196 Yes 0.92
75 192 184 Yes 0.82 193 Yes 0.90 198 Yes 0.98
80 192 186 Yes 0.86 195 Yes 0.95 201 Yes >0.99
85 192 188 Yes 0.92 198 Yes 0.99 203 Yes >0.99
90 192 192 Yes 0.98 201 Yes >0.99 207 Yes >0.99
95 192 196 Yes 0.99 205 Yes >0.99 212 Yes >0.99
3
5 203 166 No <0.01 174 No <0.01 178 No <0.01
10 203 171 No <0.01 179 No <0.01 183 No <0.01
15 203 175 No 0.01 182 No <0.01 186 No <0.01
20 203 177 No 0.02 185 No <0.01 189 No <0.01
25 203 179 No 0.04 187 No 0.01 192 No <0.01
30 203 181 No 0.07 189 No 0.03 194 No <0.01
35 203 183 No 0.13 191 No 0.07 196 No 0.01
40 203 185 No 0.21 193 No 0.14 198 No 0.04
45 203 187 No 0.31 195 No 0.26 199 No 0.08
50 203 188 No 0.37 196 No 0.33 201 No 0.25
55 203 190 Yes 0.50 198 Yes 0.50 203 Yes 0.50
60 203 192 Yes 0.56 200 Yes 0.67 205 Yes 0.75
65 203 194 Yes 0.69 201 Yes 0.74 207 Yes 0.92
70 203 196 Yes 0.79 203 Yes 0.86 208 Yes 0.96
75 203 198 Yes 0.87 205 Yes 0.93 211 Yes >0.99
80 203 200 Yes 0.93 208 Yes 0.98 213 Yes >0.99
85 203 202 Yes 0.96 210 Yes 0.99 216 Yes >0.99
90 203 206 Yes 0.99 214 Yes >0.99 219 Yes >0.99
95 203 211 Yes >0.99 219 Yes >0.99 224 Yes >0.99

Linking Study: Predicting Performance on GA Milestones EOG from MAP Growth Page 23
Mathematics
Fall Winter Spring
Start
%ile
Spring
Cut
Fall
RIT
Projected Proficiency Winter
RIT
Projected Proficiency Spring
RIT
Projected Proficiency
Grade Proficient Prob. Proficient Prob. Proficient Prob.
4
5 213 176 No <0.01 182 No <0.01 185 No <0.01
10 213 181 No <0.01 187 No <0.01 191 No <0.01
15 213 185 No <0.01 191 No <0.01 194 No <0.01
20 213 187 No 0.01 194 No <0.01 197 No <0.01
25 213 190 No 0.03 196 No <0.01 200 No <0.01
30 213 192 No 0.05 198 No 0.01 202 No <0.01
35 213 194 No 0.10 200 No 0.03 205 No <0.01
40 213 196 No 0.17 202 No 0.07 207 No 0.02
45 213 198 No 0.26 204 No 0.14 209 No 0.08
50 213 200 No 0.37 206 No 0.26 211 No 0.25
55 213 201 No 0.44 208 No 0.42 212 No 0.37
60 213 203 Yes 0.56 210 Yes 0.58 214 Yes 0.63
65 213 205 Yes 0.68 212 Yes 0.74 217 Yes 0.92
70 213 207 Yes 0.79 214 Yes 0.86 219 Yes 0.98
75 213 209 Yes 0.87 216 Yes 0.93 221 Yes >0.99
80 213 212 Yes 0.95 219 Yes 0.98 224 Yes >0.99
85 213 214 Yes 0.97 221 Yes 0.99 227 Yes >0.99
90 213 218 Yes 0.99 225 Yes >0.99 230 Yes >0.99
95 213 223 Yes >0.99 231 Yes >0.99 236 Yes >0.99
5
5 224 184 No <0.01 189 No <0.01 191 No <0.01
10 224 190 No <0.01 194 No <0.01 197 No <0.01
15 224 193 No <0.01 198 No <0.01 201 No <0.01
20 224 196 No <0.01 201 No <0.01 205 No <0.01
25 224 199 No 0.01 204 No <0.01 207 No <0.01
30 224 201 No 0.02 206 No <0.01 210 No <0.01
35 224 203 No 0.05 209 No 0.01 212 No <0.01
40 224 205 No 0.08 211 No 0.03 215 No <0.01
45 224 207 No 0.14 213 No 0.07 217 No 0.01
50 224 209 No 0.22 215 No 0.15 219 No 0.04
55 224 211 No 0.32 217 No 0.26 221 No 0.15
60 224 213 No 0.44 219 No 0.42 223 No 0.37
65 224 215 Yes 0.56 221 Yes 0.58 225 Yes 0.63
70 224 217 Yes 0.68 223 Yes 0.74 228 Yes 0.92
75 224 219 Yes 0.78 225 Yes 0.85 230 Yes 0.98
80 224 222 Yes 0.89 228 Yes 0.95 233 Yes >0.99
85 224 225 Yes 0.95 231 Yes 0.99 236 Yes >0.99
90 224 229 Yes 0.99 235 Yes >0.99 240 Yes >0.99
95 224 234 Yes >0.99 241 Yes >0.99 246 Yes >0.99

Linking Study: Predicting Performance on GA Milestones EOG from MAP Growth Page 24
Mathematics
Fall Winter Spring
Start
%ile
Spring
Cut
Fall
RIT
Projected Proficiency Winter
RIT
Projected Proficiency Spring
RIT
Projected Proficiency
Grade Proficient Prob. Proficient Prob. Proficient Prob.
6
5 226 188 No <0.01 192 No <0.01 194 No <0.01
10 226 194 No <0.01 198 No <0.01 200 No <0.01
15 226 198 No <0.01 202 No <0.01 205 No <0.01
20 226 201 No <0.01 205 No <0.01 208 No <0.01
25 226 204 No 0.01 208 No <0.01 211 No <0.01
30 226 206 No 0.03 211 No 0.01 214 No <0.01
35 226 209 No 0.08 213 No 0.02 216 No <0.01
40 226 211 No 0.14 215 No 0.04 218 No <0.01
45 226 213 No 0.22 217 No 0.10 221 No 0.04
50 226 215 No 0.32 220 No 0.26 223 No 0.15
55 226 217 No 0.44 222 No 0.42 225 No 0.37
60 226 219 Yes 0.56 224 Yes 0.58 227 Yes 0.63
65 226 221 Yes 0.68 226 Yes 0.74 230 Yes 0.92
70 226 223 Yes 0.78 228 Yes 0.86 232 Yes 0.98
75 226 226 Yes 0.90 231 Yes 0.96 235 Yes >0.99
80 226 228 Yes 0.94 234 Yes 0.99 238 Yes >0.99
85 226 231 Yes 0.98 237 Yes >0.99 241 Yes >0.99
90 226 235 Yes >0.99 241 Yes >0.99 245 Yes >0.99
95 226 241 Yes >0.99 247 Yes >0.99 252 Yes >0.99
7
5 231 192 No <0.01 194 No <0.01 196 No <0.01
10 231 198 No <0.01 201 No <0.01 203 No <0.01
15 231 202 No <0.01 205 No <0.01 207 No <0.01
20 231 206 No <0.01 209 No <0.01 211 No <0.01
25 231 208 No <0.01 212 No <0.01 214 No <0.01
30 231 211 No 0.01 215 No <0.01 217 No <0.01
35 231 213 No 0.03 217 No 0.01 220 No <0.01
40 231 216 No 0.07 219 No 0.03 222 No <0.01
45 231 218 No 0.17 222 No 0.10 224 No 0.01
50 231 220 No 0.26 224 No 0.20 227 No 0.08
55 231 222 No 0.37 226 No 0.33 229 No 0.25
60 231 225 Yes 0.56 229 Yes 0.58 231 Yes 0.50
65 231 227 Yes 0.69 231 Yes 0.74 234 Yes 0.85
70 231 229 Yes 0.79 233 Yes 0.86 236 Yes 0.96
75 231 232 Yes 0.90 236 Yes 0.96 239 Yes >0.99
80 231 235 Yes 0.96 239 Yes 0.99 242 Yes >0.99
85 231 238 Yes 0.99 243 Yes >0.99 246 Yes >0.99
90 231 243 Yes >0.99 247 Yes >0.99 251 Yes >0.99
95 231 249 Yes >0.99 254 Yes >0.99 257 Yes >0.99

Linking Study: Predicting Performance on GA Milestones EOG from MAP Growth Page 25
Mathematics
Fall Winter Spring
Start
%ile
Spring
Cut
Fall
RIT
Projected Proficiency Winter
RIT
Projected Proficiency Spring
RIT
Projected Proficiency
Grade Proficient Prob. Proficient Prob. Proficient Prob.
8
5 235 194 No <0.01 196 No <0.01 197 No <0.01
10 235 201 No <0.01 203 No <0.01 205 No <0.01
15 235 205 No <0.01 208 No <0.01 210 No <0.01
20 235 209 No <0.01 212 No <0.01 214 No <0.01
25 235 212 No 0.01 215 No <0.01 217 No <0.01
30 235 215 No 0.02 218 No <0.01 220 No <0.01
35 235 218 No 0.04 221 No 0.01 223 No <0.01
40 235 220 No 0.07 223 No 0.02 225 No <0.01
45 235 223 No 0.16 226 No 0.07 228 No 0.01
50 235 225 No 0.24 228 No 0.15 230 No 0.04
55 235 227 No 0.33 231 No 0.34 233 No 0.25
60 235 230 Yes 0.50 233 Yes 0.50 235 Yes 0.50
65 235 232 Yes 0.61 236 Yes 0.73 238 Yes 0.85
70 235 235 Yes 0.76 238 Yes 0.85 241 Yes 0.98
75 235 238 Yes 0.88 241 Yes 0.95 244 Yes >0.99
80 235 241 Yes 0.94 244 Yes 0.99 247 Yes >0.99
85 235 245 Yes 0.98 248 Yes >0.99 251 Yes >0.99
90 235 249 Yes >0.99 253 Yes >0.99 256 Yes >0.99
95 235 256 Yes >0.99 260 Yes >0.99 263 Yes >0.99

Linking Study: Predicting Performance on GA Milestones EOG from MAP Growth Page 26
References
Governor’s Office of Student Achievement (GOSA). (2019). Georgia Milestones End-of-Grade
(EOG) assessments 2018–19 report card. Retrieved from
https://gosa.georgia.gov/report-card-dashboards-data/downloadable-data.
Kolen, M. J., & Brennan, R. L. (2004). Test equating, scaling, and linking. New York: Springer.
Lumley, T. (2019). Survey: analysis of complex survey samples. R package version 3.36.
Retrieved from https://CRAN.R-project.org/package=survey.
Pommerich, M., Hanson, B., Harris, D., & Sconing, J. (2004). Issues in conducting linkage
between distinct tests. Applied Psychological Measurement, 28(4), 247–273.
Thum, Y. M., & Kuhfeld, M. (2020). NWEA 2020 MAP Growth achievement status and growth
norms for students and schools. NWEA Research Report. Portland, OR: NWEA.