Embed Size (px)
Citation preview
Linking Study Report: Predicting Performance on the New Jersey State Learning Assessment (NJSLA) based on MAP® Growth™ Scores
November 2016*
NWEA Psychometric Solutions
*Updated in January 2020 to reflect the current NWEA® branding
© 2020 NWEA. NWEA and MAP Growth are registered trademarks of NWEA in the U.S. and in other countries. All rights reserved. No part of this document may be modified or further distributed without written permission from NWEA. Suggested citation: NWEA. (2016). Linking study report: Predicting performance on the New Jersey State Learning Assessment (NJSLA) based on MAP® Growth™ scores. Portland, OR: Author.
Linking Study Report: Predicting Performance on NJSLA from MAP® Growth™ Page 3
Table of Contents
1. Introduction ............................................................................................................................... 4
2. Overview of Assessments ......................................................................................................... 4
3. Estimated MAP Growth Cut Scores .......................................................................................... 5
4. Consistency Rate of Classification ............................................................................................ 8
5. Proficiency Projections .............................................................................................................. 8
6. Summary and Discussion ....................................................................................................... 21
7. References .............................................................................................................................. 22
Appendix A: Data and Analysis ................................................................................................... 23
A.1. Data .............................................................................................................................. 23 A.2. Equipercentile Linking Procedure ................................................................................. 23 A.3. Consistency Rate of Classification ............................................................................... 24 A.4. Proficiency Projection ................................................................................................... 24
List of Tables
Table 3.1. Concordance of Performance Level Score Ranges between State Summative ELA and MAP Growth Reading (when MAP Growth is taken in Spring) ............................. 5
Table 3.2. Concordance of Performance Level Score Ranges between State Summative and MAP Growth Mathematics (when MAP Growth is taken in Spring) ............................. 6
Table 3.3. Concordance of Performance Level Score Ranges between State Summative ELA and MAP Growth Reading (when MAP Growth is taken in Fall or Winter) .................. 6
Table 3.4. Concordance of Performance Level Score Ranges between State Summative and MAP Growth Mathematics (when MAP Growth is taken in Fall or Winter) .................. 7
Table 4.1. Consistency Rate of Classification for MAP Growth and Level 4 Equipercentile Concordances ............................................................................................................. 8
Table 5.1. Proficiency Projection and Probability for Passing Level 4 (Meeting Expectations) when MAP Growth is taken in the Spring .................................................................... 9
Table 5.2. Proficiency Projection and Probability for Passing Level 4 (Meeting Expectations) in ELA when MAP Growth Reading is taken in the Fall and Winter .............................. 13
Table 5.3. Proficiency Projection and Probability for Passing Level 4 (Meeting Expectations) in Mathematics when MAP Growth Mathematics is taken in the Fall or Winter ............ 17
Linking Study Report: Predicting Performance on NJSLA from MAP® Growth™ Page 4
1. Introduction
NWEA® is committed to providing partners with useful tools to help make inferences from the MAP® Growth™ interim assessment scores. One important tool is to use the MAP Growth scores to predict students’ performance levels on the state summative assessments. The equipercentile method (Kolen & Brennan, 2004) has been used for decades to link scores on different tests measuring similar but distinct constructs. The linking study results provide a direct link between scores on different tests and serve various purposes. Aside from describing how a score on one test relates to performance on another test, they can also be used to identify benchmark scores on one test corresponding to performance categories on another test, or to maintain continuity of scores on a test after the test is redesigned or changed. The linking study results are helpful for educators, parents, administrators, researchers, and policy makers to evaluate and formulate academic standing and growth. NWEA completed a linking study to connect the scales of the New Jersey State Learning Assessment (NJSLA) in English Language Arts (ELA) and Mathematics with those of the MAP
Growth Reading and Mathematics assessments as part of a study combining data from several states. This report presents the Grades 2–8 cut scores on the MAP Growth Reading and Mathematics scales that correspond to the state summative benchmarks. Information about the consistency rate of classification based on the estimated MAP Growth cut scores is also provided, along with a series of tables that predict the probability of receiving a Level 4 (i.e., “Meeting Expectations”) or higher performance designation on the state summative tests based on the observed MAP Growth scores taken during the same school year. A detailed description of the data and analysis method used in this study is provided in Appendix A.
2. Overview of Assessments
NJSLA tests include a series of computer-based achievement tests aligned to the New Jersey Student Learning Standards incorporating the Common Core State Standards (CCSS) in ELA and Mathematics for Grades K–8 and high school. Each grade and subject has four cut scores that distinguish between performance levels: Level 1: Not Yet Meeting Expectations, Level 2: Partially Meeting Expectations, Level 3: Approaching Expectations, Level 4: Meeting Expectations, and Level 5: Exceeding Expectations. The Level 4 cut score demarks the minimum level of performance considered to be proficient for accountability purposes. MAP Growth tests are interim assessments administered in the form of a computerized adaptive test (CAT). MAP Growth tests are constructed to measure student achievement from Grades K–12 in Mathematics, Reading, Language Usage, and Science and are aligned to the New Jersey Student Learning Standards. Unlike NJSLA tests, MAP Growth assessments are vertically scaled across grades, a feature that supports direct measurement of academic growth and change. MAP Growth scores are reported on a Rasch Unit (RIT) scale with a range from 100–350. Each subject has its own RIT scale. To aid interpretation of MAP Growth scores, NWEA periodically conducts norming studies of student and school performance on MAP Growth. For example, the 2015 RIT Scale norming study (Thum & Hauser, 2015) employed multi-level growth models on nearly 500,000 longitudinal test scores from over 100,000 students that were weighted to create large, nationally representative norms for Mathematics, Reading, Language Usage, and general Science.
Linking Study Report: Predicting Performance on NJSLA from MAP® Growth™ Page 5
3. Estimated MAP Growth Cut Scores
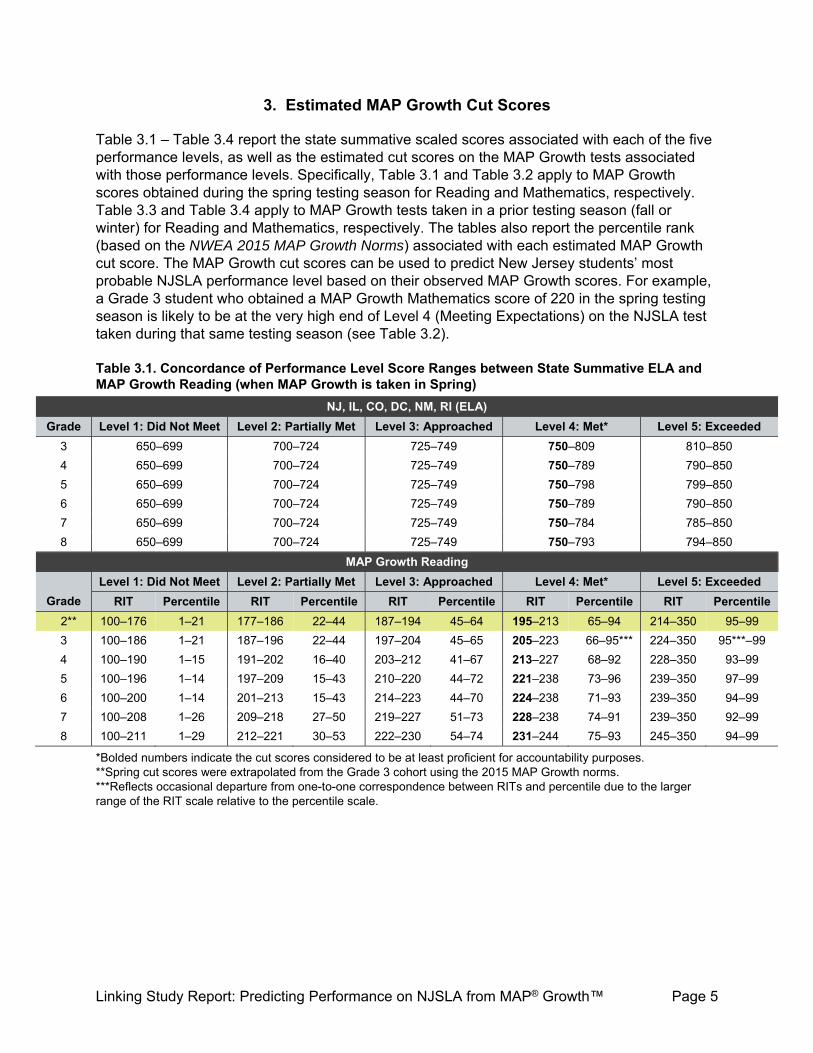
Table 3.1 – Table 3.4 report the state summative scaled scores associated with each of the five performance levels, as well as the estimated cut scores on the MAP Growth tests associated with those performance levels. Specifically, Table 3.1 and Table 3.2 apply to MAP Growth scores obtained during the spring testing season for Reading and Mathematics, respectively. Table 3.3 and Table 3.4 apply to MAP Growth tests taken in a prior testing season (fall or winter) for Reading and Mathematics, respectively. The tables also report the percentile rank (based on the NWEA 2015 MAP Growth Norms) associated with each estimated MAP Growth cut score. The MAP Growth cut scores can be used to predict New Jersey students’ most probable NJSLA performance level based on their observed MAP Growth scores. For example, a Grade 3 student who obtained a MAP Growth Mathematics score of 220 in the spring testing season is likely to be at the very high end of Level 4 (Meeting Expectations) on the NJSLA test taken during that same testing season (see Table 3.2). Table 3.1. Concordance of Performance Level Score Ranges between State Summative ELA and MAP Growth Reading (when MAP Growth is taken in Spring)
NJ, IL, CO, DC, NM, RI (ELA)
Grade Level 1: Did Not Meet Level 2: Partially Met Level 3: Approached Level 4: Met* Level 5: Exceeded
3 650–699 700–724 725–749 750–809 810–850
4 650–699 700–724 725–749 750–789 790–850
5 650–699 700–724 725–749 750–798 799–850
6 650–699 700–724 725–749 750–789 790–850
7 650–699 700–724 725–749 750–784 785–850
8 650–699 700–724 725–749 750–793 794–850
MAP Growth Reading
Grade
Level 1: Did Not Meet Level 2: Partially Met Level 3: Approached Level 4: Met* Level 5: Exceeded
RIT Percentile RIT Percentile RIT Percentile RIT Percentile RIT Percentile
2** 100–176 1–21 177–186 22–44 187–194 45–64 195–213 65–94 214–350 95–99
3 100–186 1–21 187–196 22–44 197–204 45–65 205–223 66–95*** 224–350 95***–99
4 100–190 1–15 191–202 16–40 203–212 41–67 213–227 68–92 228–350 93–99
5 100–196 1–14 197–209 15–43 210–220 44–72 221–238 73–96 239–350 97–99
6 100–200 1–14 201–213 15–43 214–223 44–70 224–238 71–93 239–350 94–99
7 100–208 1–26 209–218 27–50 219–227 51–73 228–238 74–91 239–350 92–99
8 100–211 1–29 212–221 30–53 222–230 54–74 231–244 75–93 245–350 94–99
*Bolded numbers indicate the cut scores considered to be at least proficient for accountability purposes. **Spring cut scores were extrapolated from the Grade 3 cohort using the 2015 MAP Growth norms. ***Reflects occasional departure from one-to-one correspondence between RITs and percentile due to the larger range of the RIT scale relative to the percentile scale.
Linking Study Report: Predicting Performance on NJSLA from MAP® Growth™ Page 6
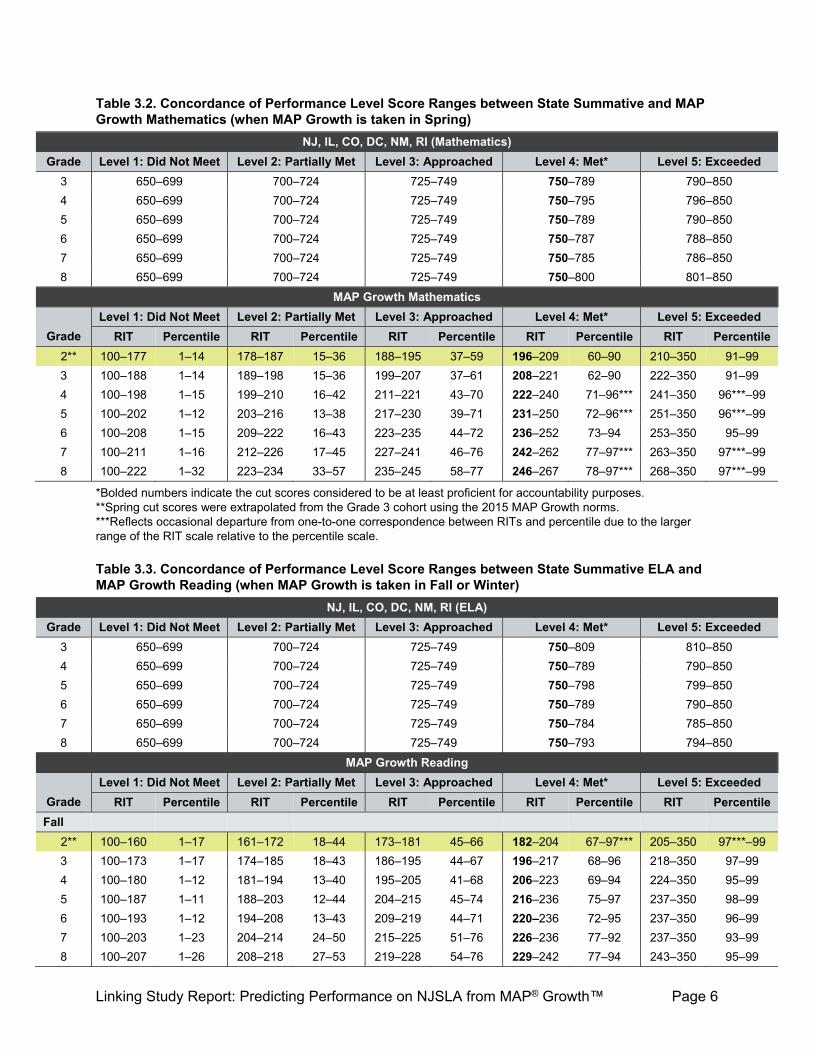
Table 3.2. Concordance of Performance Level Score Ranges between State Summative and MAP Growth Mathematics (when MAP Growth is taken in Spring)
NJ, IL, CO, DC, NM, RI (Mathematics)
Grade Level 1: Did Not Meet Level 2: Partially Met Level 3: Approached Level 4: Met* Level 5: Exceeded
3 650–699 700–724 725–749 750–789 790–850
4 650–699 700–724 725–749 750–795 796–850
5 650–699 700–724 725–749 750–789 790–850
6 650–699 700–724 725–749 750–787 788–850
7 650–699 700–724 725–749 750–785 786–850
8 650–699 700–724 725–749 750–800 801–850
MAP Growth Mathematics
Grade
Level 1: Did Not Meet Level 2: Partially Met Level 3: Approached Level 4: Met* Level 5: Exceeded
RIT Percentile RIT Percentile RIT Percentile RIT Percentile RIT Percentile
2** 100–177 1–14 178–187 15–36 188–195 37–59 196–209 60–90 210–350 91–99
3 100–188 1–14 189–198 15–36 199–207 37–61 208–221 62–90 222–350 91–99
4 100–198 1–15 199–210 16–42 211–221 43–70 222–240 71–96*** 241–350 96***–99
5 100–202 1–12 203–216 13–38 217–230 39–71 231–250 72–96*** 251–350 96***–99
6 100–208 1–15 209–222 16–43 223–235 44–72 236–252 73–94 253–350 95–99
7 100–211 1–16 212–226 17–45 227–241 46–76 242–262 77–97*** 263–350 97***–99
8 100–222 1–32 223–234 33–57 235–245 58–77 246–267 78–97*** 268–350 97***–99
*Bolded numbers indicate the cut scores considered to be at least proficient for accountability purposes. **Spring cut scores were extrapolated from the Grade 3 cohort using the 2015 MAP Growth norms. ***Reflects occasional departure from one-to-one correspondence between RITs and percentile due to the larger range of the RIT scale relative to the percentile scale.
Table 3.3. Concordance of Performance Level Score Ranges between State Summative ELA and MAP Growth Reading (when MAP Growth is taken in Fall or Winter)
NJ, IL, CO, DC, NM, RI (ELA)
Grade Level 1: Did Not Meet Level 2: Partially Met Level 3: Approached Level 4: Met* Level 5: Exceeded
3 650–699 700–724 725–749 750–809 810–850
4 650–699 700–724 725–749 750–789 790–850
5 650–699 700–724 725–749 750–798 799–850
6 650–699 700–724 725–749 750–789 790–850
7 650–699 700–724 725–749 750–784 785–850
8 650–699 700–724 725–749 750–793 794–850
MAP Growth Reading
Grade
Level 1: Did Not Meet Level 2: Partially Met Level 3: Approached Level 4: Met* Level 5: Exceeded
RIT Percentile RIT Percentile RIT Percentile RIT Percentile RIT Percentile
Fall
2** 100–160 1–17 161–172 18–44 173–181 45–66 182–204 67–97*** 205–350 97***–99
3 100–173 1–17 174–185 18–43 186–195 44–67 196–217 68–96 218–350 97–99
4 100–180 1–12 181–194 13–40 195–205 41–68 206–223 69–94 224–350 95–99
5 100–187 1–11 188–203 12–44 204–215 45–74 216–236 75–97 237–350 98–99
6 100–193 1–12 194–208 13–43 209–219 44–71 220–236 72–95 237–350 96–99
7 100–203 1–23 204–214 24–50 215–225 51–76 226–236 77–92 237–350 93–99
8 100–207 1–26 208–218 27–53 219–228 54–76 229–242 77–94 243–350 95–99
Linking Study Report: Predicting Performance on NJSLA from MAP® Growth™ Page 7
MAP Growth Reading
Level 1: Did Not Meet Level 2: Partially Met Level 3: Approached Level 4: Met* Level 5: Exceeded
Grade RIT Percentile RIT Percentile RIT Percentile RIT Percentile RIT Percentile
Winter
2** 100–171 1–19 172–181 20–42 182–190 43–66 191–210 67–96*** 221–350 96***–99
3 100–182 1–19 183–193 20–44 194–201 45–65 202–222 66–96*** 223–350 96***–99
4 100–187 1–14 188–199 15–39 200–210 40–67 211–226 68–93 227–350 94–99
5 100–193 1–13 194–207 14–43 208–219 44–74 220–237 75–97*** 238–350 97***–99
6 100–198 1–13 199–211 14–42 212–222 43–71 223–237 72–94 238–350 95–99
7 100–206 1–24 207–217 25–51 218–226 52–73 227–237 74–91 238–350 92–99
8 100–210 1–28 211–220 29–53 221–229 54–75 230–243 76–94 244–350 95–99
*Bolded numbers indicate the cut scores considered to be at least proficient for accountability purposes. **Spring cut scores were extrapolated from the Grade 3 cohort using the 2015 MAP Growth norms. ***Reflects occasional departure from one-to-one correspondence between RITs and percentile due to the larger range of the RIT scale relative to the percentile scale.
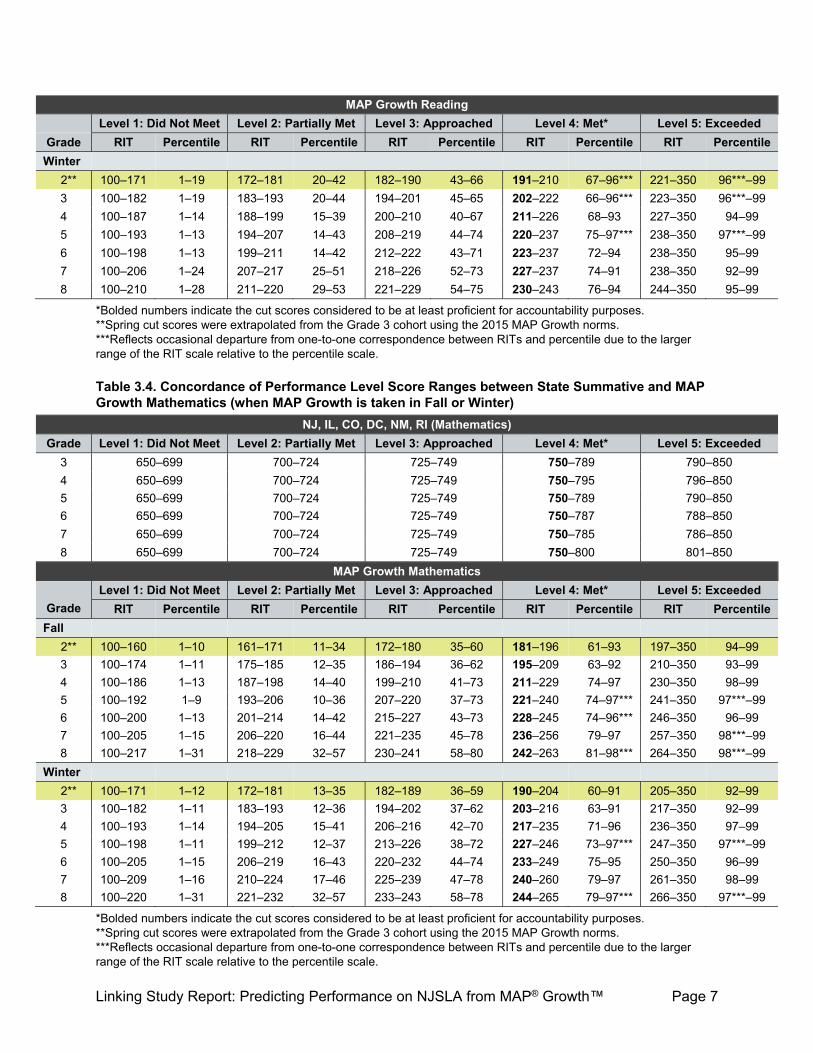
Table 3.4. Concordance of Performance Level Score Ranges between State Summative and MAP Growth Mathematics (when MAP Growth is taken in Fall or Winter)
NJ, IL, CO, DC, NM, RI (Mathematics)
Grade Level 1: Did Not Meet Level 2: Partially Met Level 3: Approached Level 4: Met* Level 5: Exceeded
3 650–699 700–724 725–749 750–789 790–850
4 650–699 700–724 725–749 750–795 796–850
5 650–699 700–724 725–749 750–789 790–850
6 650–699 700–724 725–749 750–787 788–850
7 650–699 700–724 725–749 750–785 786–850
8 650–699 700–724 725–749 750–800 801–850
MAP Growth Mathematics
Grade
Level 1: Did Not Meet Level 2: Partially Met Level 3: Approached Level 4: Met* Level 5: Exceeded
RIT Percentile RIT Percentile RIT Percentile RIT Percentile RIT Percentile
Fall
2** 100–160 1–10 161–171 11–34 172–180 35–60 181–196 61–93 197–350 94–99
3 100–174 1–11 175–185 12–35 186–194 36–62 195–209 63–92 210–350 93–99
4 100–186 1–13 187–198 14–40 199–210 41–73 211–229 74–97 230–350 98–99
5 100–192 1–9 193–206 10–36 207–220 37–73 221–240 74–97*** 241–350 97***–99
6 100–200 1–13 201–214 14–42 215–227 43–73 228–245 74–96*** 246–350 96–99
7 100–205 1–15 206–220 16–44 221–235 45–78 236–256 79–97 257–350 98***–99
8 100–217 1–31 218–229 32–57 230–241 58–80 242–263 81–98*** 264–350 98***–99
Winter
2** 100–171 1–12 172–181 13–35 182–189 36–59 190–204 60–91 205–350 92–99
3 100–182 1–11 183–193 12–36 194–202 37–62 203–216 63–91 217–350 92–99
4 100–193 1–14 194–205 15–41 206–216 42–70 217–235 71–96 236–350 97–99
5 100–198 1–11 199–212 12–37 213–226 38–72 227–246 73–97*** 247–350 97***–99
6 100–205 1–15 206–219 16–43 220–232 44–74 233–249 75–95 250–350 96–99
7 100–209 1–16 210–224 17–46 225–239 47–78 240–260 79–97 261–350 98–99
8 100–220 1–31 221–232 32–57 233–243 58–78 244–265 79–97*** 266–350 97***–99
*Bolded numbers indicate the cut scores considered to be at least proficient for accountability purposes. **Spring cut scores were extrapolated from the Grade 3 cohort using the 2015 MAP Growth norms. ***Reflects occasional departure from one-to-one correspondence between RITs and percentile due to the larger range of the RIT scale relative to the percentile scale.
Linking Study Report: Predicting Performance on NJSLA from MAP® Growth™ Page 8
4. Consistency Rate of Classification
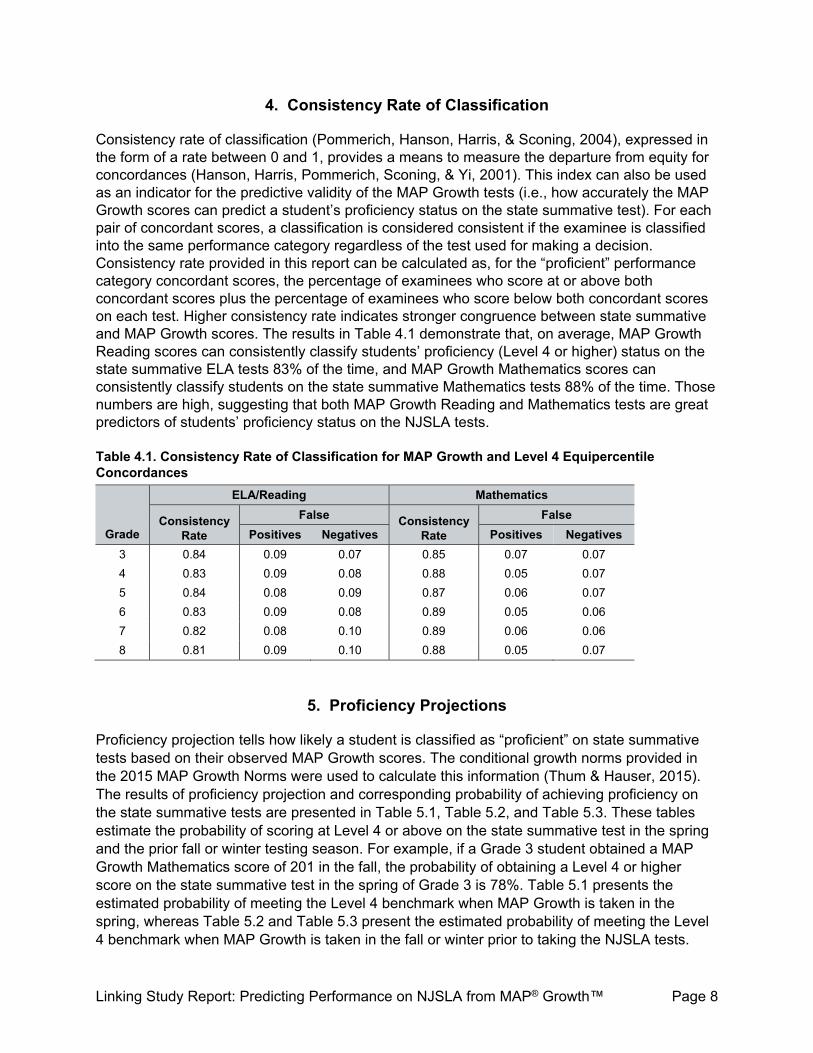
Consistency rate of classification (Pommerich, Hanson, Harris, & Sconing, 2004), expressed in the form of a rate between 0 and 1, provides a means to measure the departure from equity for concordances (Hanson, Harris, Pommerich, Sconing, & Yi, 2001). This index can also be used as an indicator for the predictive validity of the MAP Growth tests (i.e., how accurately the MAP Growth scores can predict a student’s proficiency status on the state summative test). For each pair of concordant scores, a classification is considered consistent if the examinee is classified into the same performance category regardless of the test used for making a decision. Consistency rate provided in this report can be calculated as, for the “proficient” performance category concordant scores, the percentage of examinees who score at or above both concordant scores plus the percentage of examinees who score below both concordant scores on each test. Higher consistency rate indicates stronger congruence between state summative and MAP Growth scores. The results in Table 4.1 demonstrate that, on average, MAP Growth Reading scores can consistently classify students’ proficiency (Level 4 or higher) status on the state summative ELA tests 83% of the time, and MAP Growth Mathematics scores can consistently classify students on the state summative Mathematics tests 88% of the time. Those numbers are high, suggesting that both MAP Growth Reading and Mathematics tests are great predictors of students’ proficiency status on the NJSLA tests. Table 4.1. Consistency Rate of Classification for MAP Growth and Level 4 Equipercentile Concordances
Grade
ELA/Reading Mathematics
Consistency Rate
False Consistency Rate
False
Positives Negatives Positives Negatives
3 0.84 0.09 0.07 0.85 0.07 0.07
4 0.83 0.09 0.08 0.88 0.05 0.07
5 0.84 0.08 0.09 0.87 0.06 0.07
6 0.83 0.09 0.08 0.89 0.05 0.06
7 0.82 0.08 0.10 0.89 0.06 0.06
8 0.81 0.09 0.10 0.88 0.05 0.07
5. Proficiency Projections
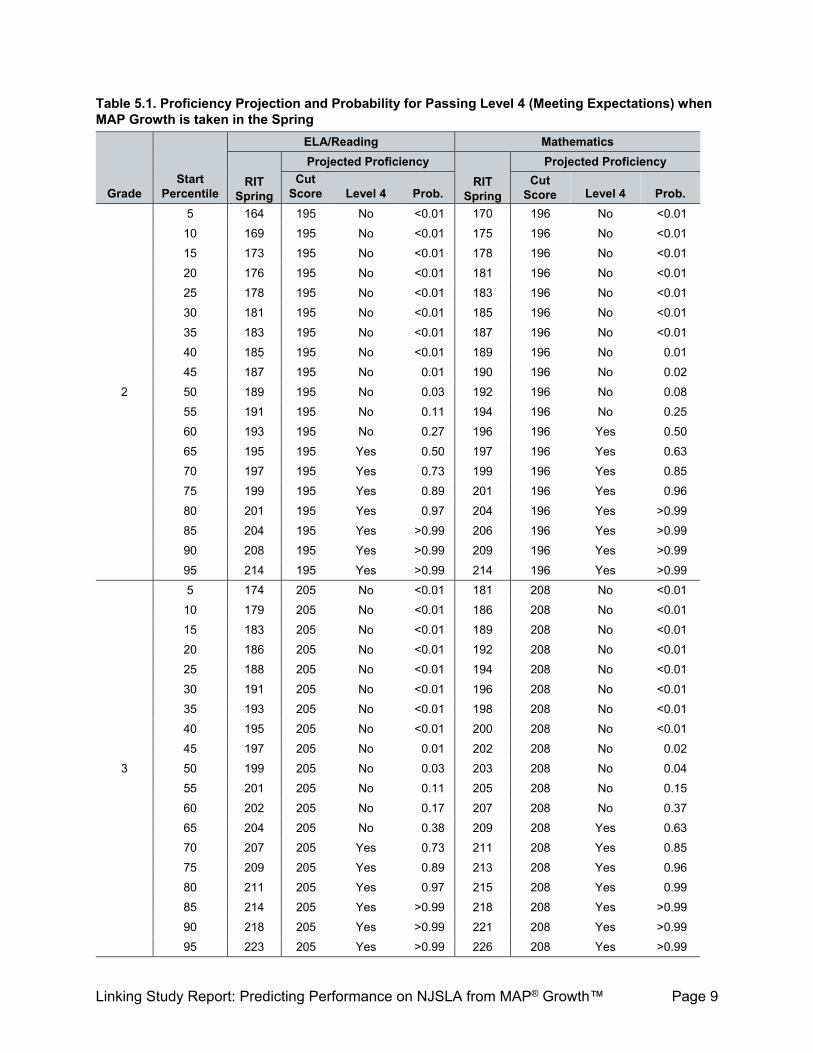
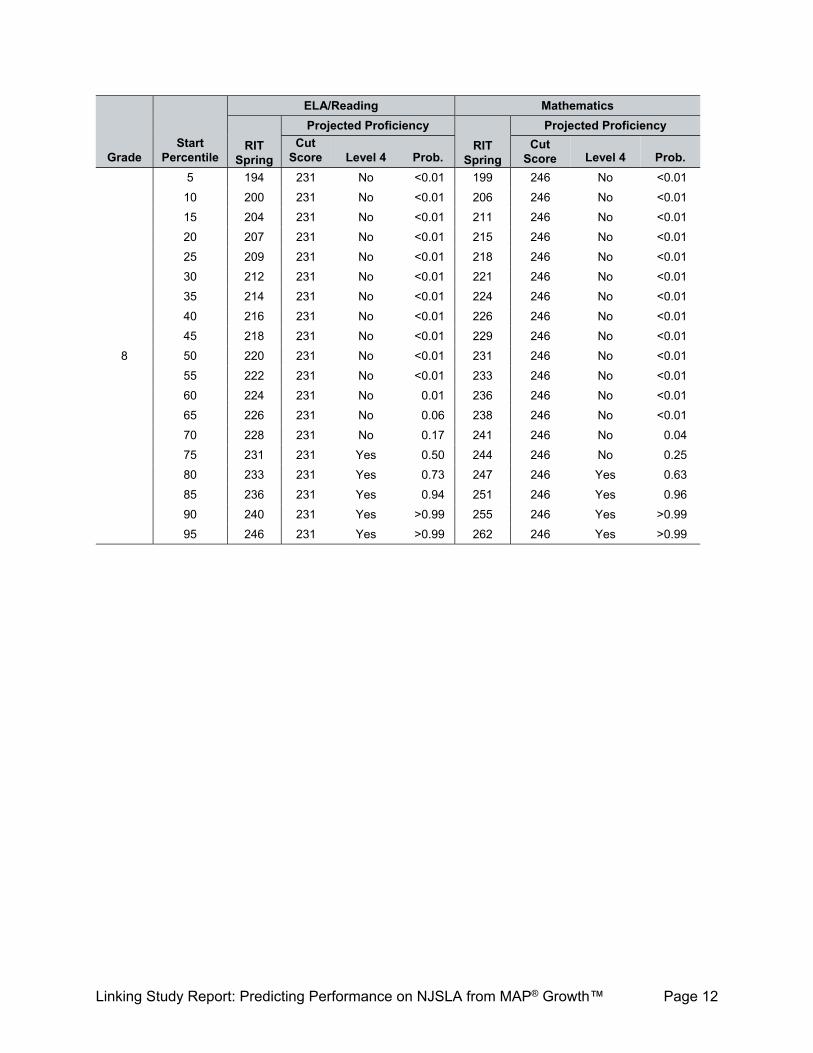
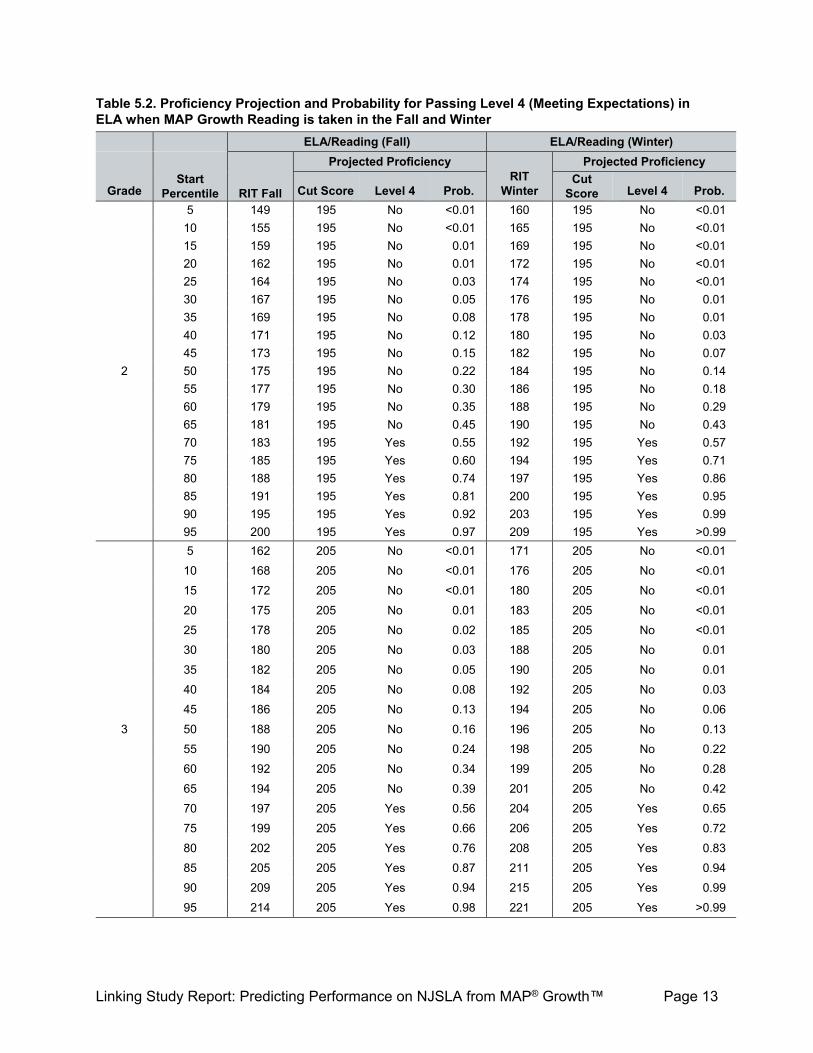
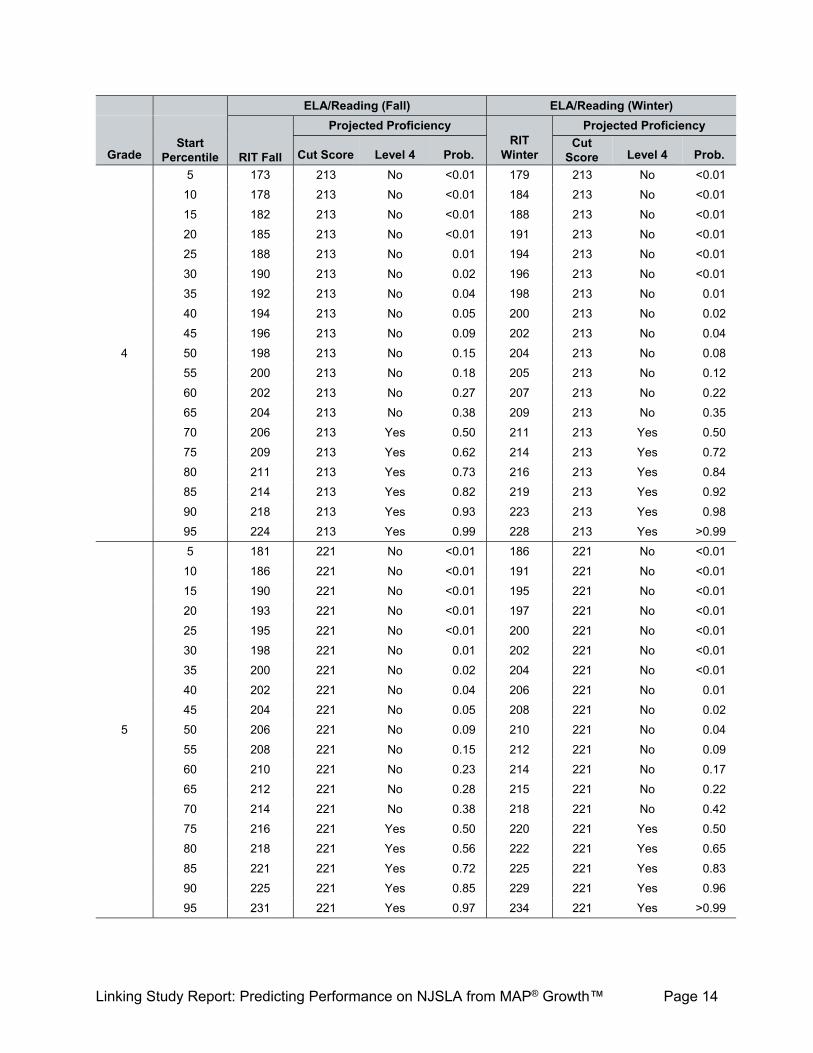
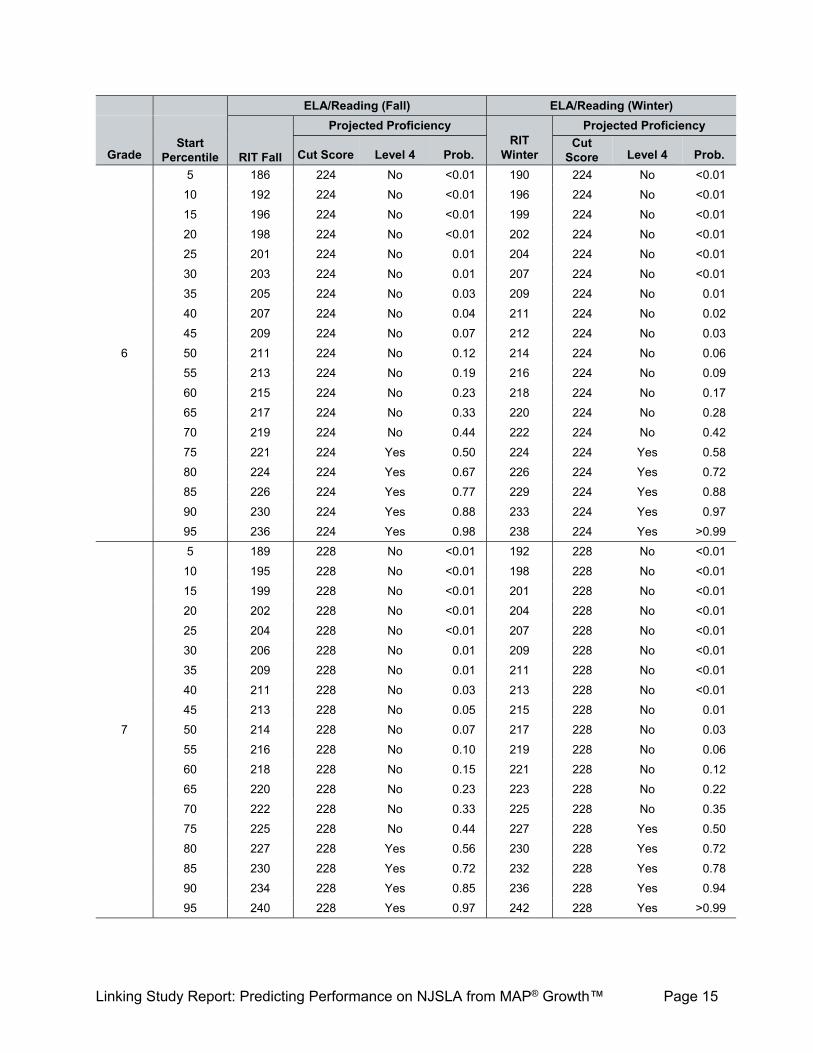
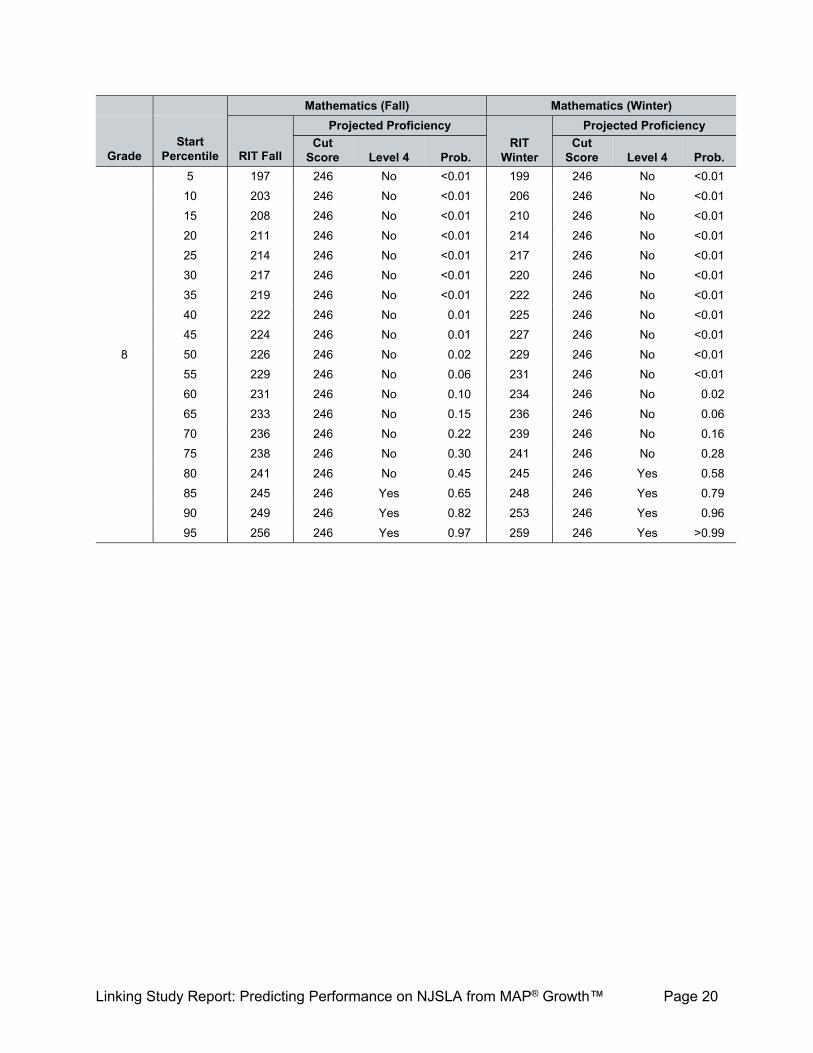
Proficiency projection tells how likely a student is classified as “proficient” on state summative tests based on their observed MAP Growth scores. The conditional growth norms provided in the 2015 MAP Growth Norms were used to calculate this information (Thum & Hauser, 2015). The results of proficiency projection and corresponding probability of achieving proficiency on the state summative tests are presented in Table 5.1, Table 5.2, and Table 5.3. These tables estimate the probability of scoring at Level 4 or above on the state summative test in the spring and the prior fall or winter testing season. For example, if a Grade 3 student obtained a MAP Growth Mathematics score of 201 in the fall, the probability of obtaining a Level 4 or higher score on the state summative test in the spring of Grade 3 is 78%. Table 5.1 presents the estimated probability of meeting the Level 4 benchmark when MAP Growth is taken in the spring, whereas Table 5.2 and Table 5.3 present the estimated probability of meeting the Level 4 benchmark when MAP Growth is taken in the fall or winter prior to taking the NJSLA tests.
Linking Study Report: Predicting Performance on NJSLA from MAP® Growth™ Page 9
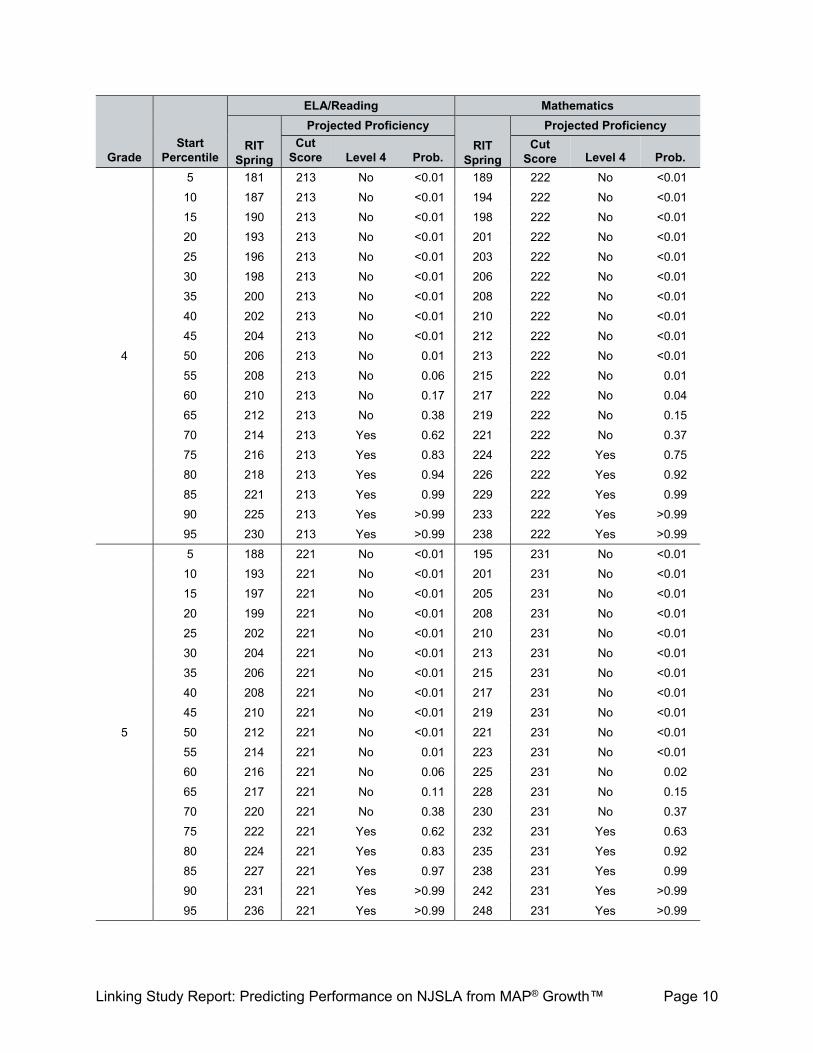
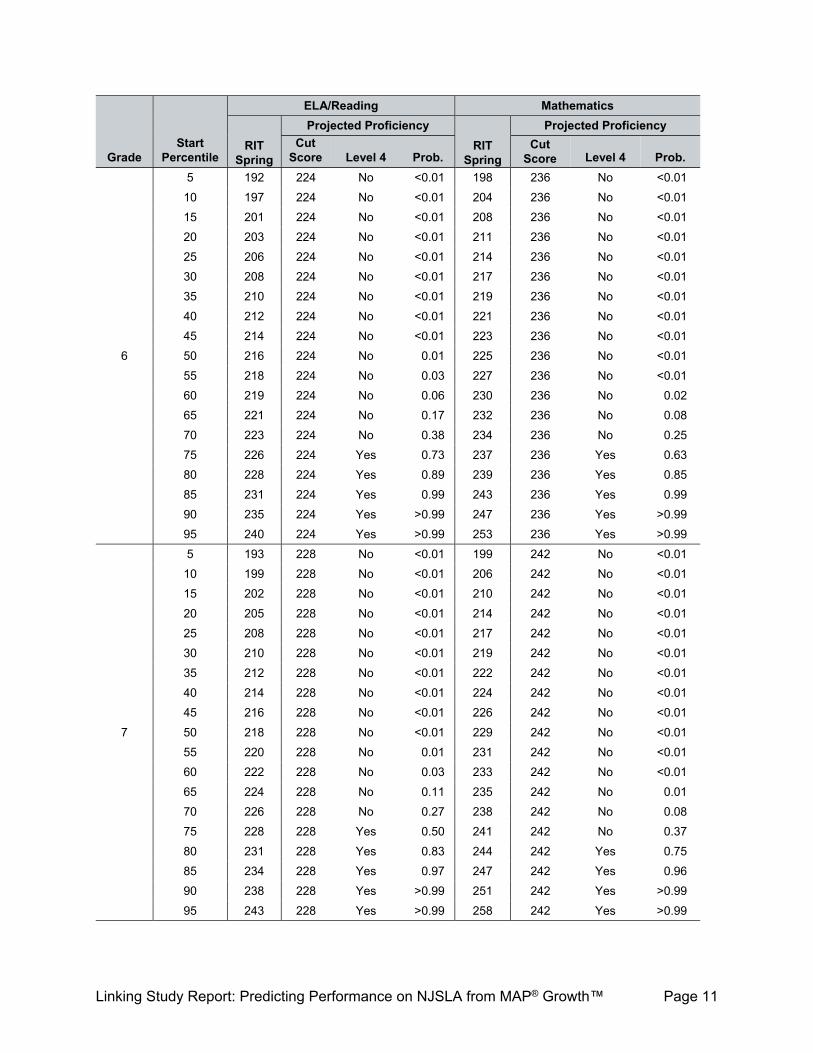
Table 5.1. Proficiency Projection and Probability for Passing Level 4 (Meeting Expectations) when MAP Growth is taken in the Spring
Grade Start
Percentile
ELA/Reading Mathematics
RIT Spring
Projected Proficiency
RIT Spring
Projected Proficiency
Cut Score Level 4 Prob.
Cut Score Level 4 Prob.
2
5 164 195 No <0.01 170 196 No <0.01
10 169 195 No <0.01 175 196 No <0.01
15 173 195 No <0.01 178 196 No <0.01
20 176 195 No <0.01 181 196 No <0.01
25 178 195 No <0.01 183 196 No <0.01
30 181 195 No <0.01 185 196 No <0.01
35 183 195 No <0.01 187 196 No <0.01
40 185 195 No <0.01 189 196 No 0.01
45 187 195 No 0.01 190 196 No 0.02
50 189 195 No 0.03 192 196 No 0.08
55 191 195 No 0.11 194 196 No 0.25
60 193 195 No 0.27 196 196 Yes 0.50
65 195 195 Yes 0.50 197 196 Yes 0.63
70 197 195 Yes 0.73 199 196 Yes 0.85
75 199 195 Yes 0.89 201 196 Yes 0.96
80 201 195 Yes 0.97 204 196 Yes >0.99
85 204 195 Yes >0.99 206 196 Yes >0.99
90 208 195 Yes >0.99 209 196 Yes >0.99
95 214 195 Yes >0.99 214 196 Yes >0.99
3
5 174 205 No <0.01 181 208 No <0.01
10 179 205 No <0.01 186 208 No <0.01
15 183 205 No <0.01 189 208 No <0.01
20 186 205 No <0.01 192 208 No <0.01
25 188 205 No <0.01 194 208 No <0.01
30 191 205 No <0.01 196 208 No <0.01
35 193 205 No <0.01 198 208 No <0.01
40 195 205 No <0.01 200 208 No <0.01
45 197 205 No 0.01 202 208 No 0.02
50 199 205 No 0.03 203 208 No 0.04
55 201 205 No 0.11 205 208 No 0.15
60 202 205 No 0.17 207 208 No 0.37
65 204 205 No 0.38 209 208 Yes 0.63
70 207 205 Yes 0.73 211 208 Yes 0.85
75 209 205 Yes 0.89 213 208 Yes 0.96
80 211 205 Yes 0.97 215 208 Yes 0.99
85 214 205 Yes >0.99 218 208 Yes >0.99
90 218 205 Yes >0.99 221 208 Yes >0.99
95 223 205 Yes >0.99 226 208 Yes >0.99
Linking Study Report: Predicting Performance on NJSLA from MAP® Growth™ Page 10
Grade Start
Percentile
ELA/Reading Mathematics
RIT Spring
Projected Proficiency
RIT Spring
Projected Proficiency
Cut Score Level 4 Prob.
Cut Score Level 4 Prob.
4
5 181 213 No <0.01 189 222 No <0.01
10 187 213 No <0.01 194 222 No <0.01
15 190 213 No <0.01 198 222 No <0.01
20 193 213 No <0.01 201 222 No <0.01
25 196 213 No <0.01 203 222 No <0.01
30 198 213 No <0.01 206 222 No <0.01
35 200 213 No <0.01 208 222 No <0.01
40 202 213 No <0.01 210 222 No <0.01
45 204 213 No <0.01 212 222 No <0.01
50 206 213 No 0.01 213 222 No <0.01
55 208 213 No 0.06 215 222 No 0.01
60 210 213 No 0.17 217 222 No 0.04
65 212 213 No 0.38 219 222 No 0.15
70 214 213 Yes 0.62 221 222 No 0.37
75 216 213 Yes 0.83 224 222 Yes 0.75
80 218 213 Yes 0.94 226 222 Yes 0.92
85 221 213 Yes 0.99 229 222 Yes 0.99
90 225 213 Yes >0.99 233 222 Yes >0.99
95 230 213 Yes >0.99 238 222 Yes >0.99
5
5 188 221 No <0.01 195 231 No <0.01
10 193 221 No <0.01 201 231 No <0.01
15 197 221 No <0.01 205 231 No <0.01
20 199 221 No <0.01 208 231 No <0.01
25 202 221 No <0.01 210 231 No <0.01
30 204 221 No <0.01 213 231 No <0.01
35 206 221 No <0.01 215 231 No <0.01
40 208 221 No <0.01 217 231 No <0.01
45 210 221 No <0.01 219 231 No <0.01
50 212 221 No <0.01 221 231 No <0.01
55 214 221 No 0.01 223 231 No <0.01
60 216 221 No 0.06 225 231 No 0.02
65 217 221 No 0.11 228 231 No 0.15
70 220 221 No 0.38 230 231 No 0.37
75 222 221 Yes 0.62 232 231 Yes 0.63
80 224 221 Yes 0.83 235 231 Yes 0.92
85 227 221 Yes 0.97 238 231 Yes 0.99
90 231 221 Yes >0.99 242 231 Yes >0.99
95 236 221 Yes >0.99 248 231 Yes >0.99
Linking Study Report: Predicting Performance on NJSLA from MAP® Growth™ Page 11
Grade Start
Percentile
ELA/Reading Mathematics
RIT Spring
Projected Proficiency
RIT Spring
Projected Proficiency
Cut Score Level 4 Prob.
Cut Score Level 4 Prob.
6
5 192 224 No <0.01 198 236 No <0.01
10 197 224 No <0.01 204 236 No <0.01
15 201 224 No <0.01 208 236 No <0.01
20 203 224 No <0.01 211 236 No <0.01
25 206 224 No <0.01 214 236 No <0.01
30 208 224 No <0.01 217 236 No <0.01
35 210 224 No <0.01 219 236 No <0.01
40 212 224 No <0.01 221 236 No <0.01
45 214 224 No <0.01 223 236 No <0.01
50 216 224 No 0.01 225 236 No <0.01
55 218 224 No 0.03 227 236 No <0.01
60 219 224 No 0.06 230 236 No 0.02
65 221 224 No 0.17 232 236 No 0.08
70 223 224 No 0.38 234 236 No 0.25
75 226 224 Yes 0.73 237 236 Yes 0.63
80 228 224 Yes 0.89 239 236 Yes 0.85
85 231 224 Yes 0.99 243 236 Yes 0.99
90 235 224 Yes >0.99 247 236 Yes >0.99
95 240 224 Yes >0.99 253 236 Yes >0.99
7
5 193 228 No <0.01 199 242 No <0.01
10 199 228 No <0.01 206 242 No <0.01
15 202 228 No <0.01 210 242 No <0.01
20 205 228 No <0.01 214 242 No <0.01
25 208 228 No <0.01 217 242 No <0.01
30 210 228 No <0.01 219 242 No <0.01
35 212 228 No <0.01 222 242 No <0.01
40 214 228 No <0.01 224 242 No <0.01
45 216 228 No <0.01 226 242 No <0.01
50 218 228 No <0.01 229 242 No <0.01
55 220 228 No 0.01 231 242 No <0.01
60 222 228 No 0.03 233 242 No <0.01
65 224 228 No 0.11 235 242 No 0.01
70 226 228 No 0.27 238 242 No 0.08
75 228 228 Yes 0.50 241 242 No 0.37
80 231 228 Yes 0.83 244 242 Yes 0.75
85 234 228 Yes 0.97 247 242 Yes 0.96
90 238 228 Yes >0.99 251 242 Yes >0.99
95 243 228 Yes >0.99 258 242 Yes >0.99
Linking Study Report: Predicting Performance on NJSLA from MAP® Growth™ Page 12
Grade Start
Percentile
ELA/Reading Mathematics
RIT Spring
Projected Proficiency
RIT Spring
Projected Proficiency
Cut Score Level 4 Prob.
Cut Score Level 4 Prob.
8
5 194 231 No <0.01 199 246 No <0.01
10 200 231 No <0.01 206 246 No <0.01
15 204 231 No <0.01 211 246 No <0.01
20 207 231 No <0.01 215 246 No <0.01
25 209 231 No <0.01 218 246 No <0.01
30 212 231 No <0.01 221 246 No <0.01
35 214 231 No <0.01 224 246 No <0.01
40 216 231 No <0.01 226 246 No <0.01
45 218 231 No <0.01 229 246 No <0.01
50 220 231 No <0.01 231 246 No <0.01
55 222 231 No <0.01 233 246 No <0.01
60 224 231 No 0.01 236 246 No <0.01
65 226 231 No 0.06 238 246 No <0.01
70 228 231 No 0.17 241 246 No 0.04
75 231 231 Yes 0.50 244 246 No 0.25
80 233 231 Yes 0.73 247 246 Yes 0.63
85 236 231 Yes 0.94 251 246 Yes 0.96
90 240 231 Yes >0.99 255 246 Yes >0.99
95 246 231 Yes >0.99 262 246 Yes >0.99
Linking Study Report: Predicting Performance on NJSLA from MAP® Growth™ Page 13
Table 5.2. Proficiency Projection and Probability for Passing Level 4 (Meeting Expectations) in ELA when MAP Growth Reading is taken in the Fall and Winter
ELA/Reading (Fall) ELA/Reading (Winter)
Grade Start
Percentile RIT Fall
Projected Proficiency RIT
Winter
Projected Proficiency
Cut Score Level 4 Prob. Cut
Score Level 4 Prob.
2
5 149 195 No <0.01 160 195 No <0.01
10 155 195 No <0.01 165 195 No <0.01
15 159 195 No 0.01 169 195 No <0.01
20 162 195 No 0.01 172 195 No <0.01
25 164 195 No 0.03 174 195 No <0.01
30 167 195 No 0.05 176 195 No 0.01
35 169 195 No 0.08 178 195 No 0.01
40 171 195 No 0.12 180 195 No 0.03
45 173 195 No 0.15 182 195 No 0.07
50 175 195 No 0.22 184 195 No 0.14
55 177 195 No 0.30 186 195 No 0.18
60 179 195 No 0.35 188 195 No 0.29
65 181 195 No 0.45 190 195 No 0.43
70 183 195 Yes 0.55 192 195 Yes 0.57
75 185 195 Yes 0.60 194 195 Yes 0.71
80 188 195 Yes 0.74 197 195 Yes 0.86
85 191 195 Yes 0.81 200 195 Yes 0.95
90 195 195 Yes 0.92 203 195 Yes 0.99
95 200 195 Yes 0.97 209 195 Yes >0.99
3
5 162 205 No <0.01 171 205 No <0.01
10 168 205 No <0.01 176 205 No <0.01
15 172 205 No <0.01 180 205 No <0.01
20 175 205 No 0.01 183 205 No <0.01
25 178 205 No 0.02 185 205 No <0.01
30 180 205 No 0.03 188 205 No 0.01
35 182 205 No 0.05 190 205 No 0.01
40 184 205 No 0.08 192 205 No 0.03
45 186 205 No 0.13 194 205 No 0.06
50 188 205 No 0.16 196 205 No 0.13
55 190 205 No 0.24 198 205 No 0.22
60 192 205 No 0.34 199 205 No 0.28
65 194 205 No 0.39 201 205 No 0.42
70 197 205 Yes 0.56 204 205 Yes 0.65
75 199 205 Yes 0.66 206 205 Yes 0.72
80 202 205 Yes 0.76 208 205 Yes 0.83
85 205 205 Yes 0.87 211 205 Yes 0.94
90 209 205 Yes 0.94 215 205 Yes 0.99
95 214 205 Yes 0.98 221 205 Yes >0.99
Linking Study Report: Predicting Performance on NJSLA from MAP® Growth™ Page 14
ELA/Reading (Fall) ELA/Reading (Winter)
Grade Start
Percentile RIT Fall
Projected Proficiency RIT
Winter
Projected Proficiency
Cut Score Level 4 Prob. Cut
Score Level 4 Prob.
4
5 173 213 No <0.01 179 213 No <0.01
10 178 213 No <0.01 184 213 No <0.01
15 182 213 No <0.01 188 213 No <0.01
20 185 213 No <0.01 191 213 No <0.01
25 188 213 No 0.01 194 213 No <0.01
30 190 213 No 0.02 196 213 No <0.01
35 192 213 No 0.04 198 213 No 0.01
40 194 213 No 0.05 200 213 No 0.02
45 196 213 No 0.09 202 213 No 0.04
50 198 213 No 0.15 204 213 No 0.08
55 200 213 No 0.18 205 213 No 0.12
60 202 213 No 0.27 207 213 No 0.22
65 204 213 No 0.38 209 213 No 0.35
70 206 213 Yes 0.50 211 213 Yes 0.50
75 209 213 Yes 0.62 214 213 Yes 0.72
80 211 213 Yes 0.73 216 213 Yes 0.84
85 214 213 Yes 0.82 219 213 Yes 0.92
90 218 213 Yes 0.93 223 213 Yes 0.98
95 224 213 Yes 0.99 228 213 Yes >0.99
5
5 181 221 No <0.01 186 221 No <0.01
10 186 221 No <0.01 191 221 No <0.01
15 190 221 No <0.01 195 221 No <0.01
20 193 221 No <0.01 197 221 No <0.01
25 195 221 No <0.01 200 221 No <0.01
30 198 221 No 0.01 202 221 No <0.01
35 200 221 No 0.02 204 221 No <0.01
40 202 221 No 0.04 206 221 No 0.01
45 204 221 No 0.05 208 221 No 0.02
50 206 221 No 0.09 210 221 No 0.04
55 208 221 No 0.15 212 221 No 0.09
60 210 221 No 0.23 214 221 No 0.17
65 212 221 No 0.28 215 221 No 0.22
70 214 221 No 0.38 218 221 No 0.42
75 216 221 Yes 0.50 220 221 Yes 0.50
80 218 221 Yes 0.56 222 221 Yes 0.65
85 221 221 Yes 0.72 225 221 Yes 0.83
90 225 221 Yes 0.85 229 221 Yes 0.96
95 231 221 Yes 0.97 234 221 Yes >0.99
Linking Study Report: Predicting Performance on NJSLA from MAP® Growth™ Page 15
ELA/Reading (Fall) ELA/Reading (Winter)
Grade Start
Percentile RIT Fall
Projected Proficiency RIT
Winter
Projected Proficiency
Cut Score Level 4 Prob. Cut
Score Level 4 Prob.
6
5 186 224 No <0.01 190 224 No <0.01
10 192 224 No <0.01 196 224 No <0.01
15 196 224 No <0.01 199 224 No <0.01
20 198 224 No <0.01 202 224 No <0.01
25 201 224 No 0.01 204 224 No <0.01
30 203 224 No 0.01 207 224 No <0.01
35 205 224 No 0.03 209 224 No 0.01
40 207 224 No 0.04 211 224 No 0.02
45 209 224 No 0.07 212 224 No 0.03
50 211 224 No 0.12 214 224 No 0.06
55 213 224 No 0.19 216 224 No 0.09
60 215 224 No 0.23 218 224 No 0.17
65 217 224 No 0.33 220 224 No 0.28
70 219 224 No 0.44 222 224 No 0.42
75 221 224 Yes 0.50 224 224 Yes 0.58
80 224 224 Yes 0.67 226 224 Yes 0.72
85 226 224 Yes 0.77 229 224 Yes 0.88
90 230 224 Yes 0.88 233 224 Yes 0.97
95 236 224 Yes 0.98 238 224 Yes >0.99
7
5 189 228 No <0.01 192 228 No <0.01
10 195 228 No <0.01 198 228 No <0.01
15 199 228 No <0.01 201 228 No <0.01
20 202 228 No <0.01 204 228 No <0.01
25 204 228 No <0.01 207 228 No <0.01
30 206 228 No 0.01 209 228 No <0.01
35 209 228 No 0.01 211 228 No <0.01
40 211 228 No 0.03 213 228 No <0.01
45 213 228 No 0.05 215 228 No 0.01
50 214 228 No 0.07 217 228 No 0.03
55 216 228 No 0.10 219 228 No 0.06
60 218 228 No 0.15 221 228 No 0.12
65 220 228 No 0.23 223 228 No 0.22
70 222 228 No 0.33 225 228 No 0.35
75 225 228 No 0.44 227 228 Yes 0.50
80 227 228 Yes 0.56 230 228 Yes 0.72
85 230 228 Yes 0.72 232 228 Yes 0.78
90 234 228 Yes 0.85 236 228 Yes 0.94
95 240 228 Yes 0.97 242 228 Yes >0.99
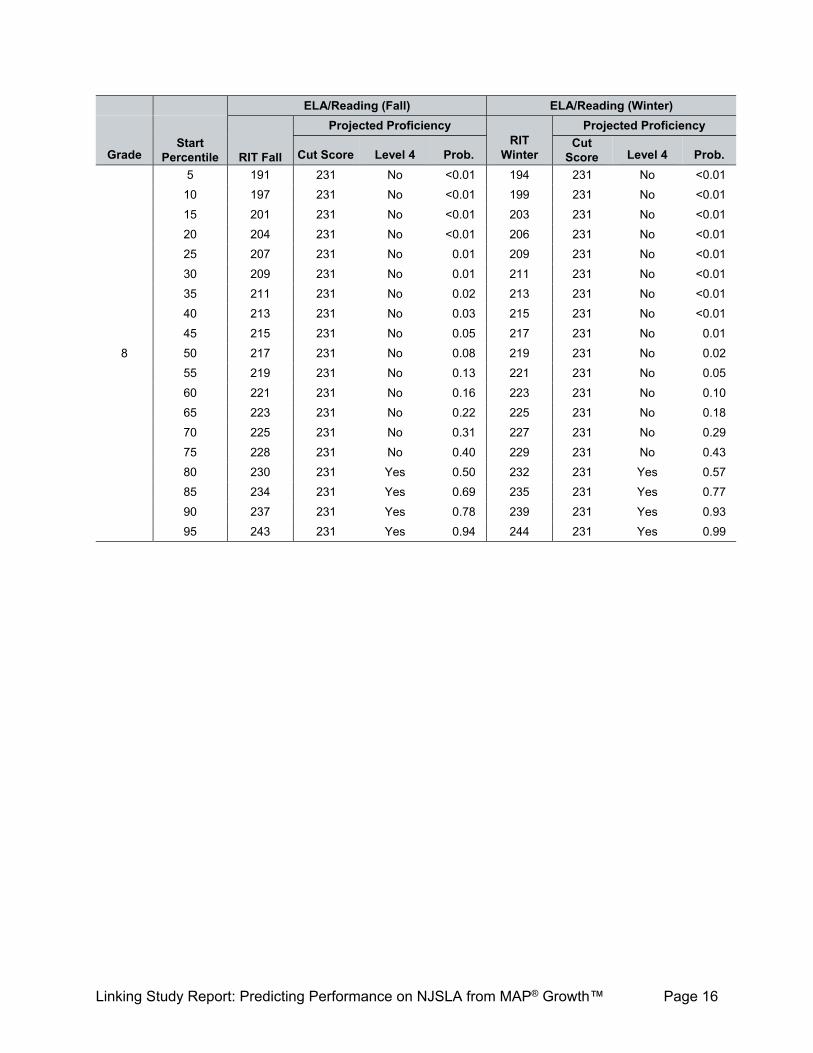
Linking Study Report: Predicting Performance on NJSLA from MAP® Growth™ Page 16
ELA/Reading (Fall) ELA/Reading (Winter)
Grade Start
Percentile RIT Fall
Projected Proficiency RIT
Winter
Projected Proficiency
Cut Score Level 4 Prob. Cut
Score Level 4 Prob.
8
5 191 231 No <0.01 194 231 No <0.01
10 197 231 No <0.01 199 231 No <0.01
15 201 231 No <0.01 203 231 No <0.01
20 204 231 No <0.01 206 231 No <0.01
25 207 231 No 0.01 209 231 No <0.01
30 209 231 No 0.01 211 231 No <0.01
35 211 231 No 0.02 213 231 No <0.01
40 213 231 No 0.03 215 231 No <0.01
45 215 231 No 0.05 217 231 No 0.01
50 217 231 No 0.08 219 231 No 0.02
55 219 231 No 0.13 221 231 No 0.05
60 221 231 No 0.16 223 231 No 0.10
65 223 231 No 0.22 225 231 No 0.18
70 225 231 No 0.31 227 231 No 0.29
75 228 231 No 0.40 229 231 No 0.43
80 230 231 Yes 0.50 232 231 Yes 0.57
85 234 231 Yes 0.69 235 231 Yes 0.77
90 237 231 Yes 0.78 239 231 Yes 0.93
95 243 231 Yes 0.94 244 231 Yes 0.99
Linking Study Report: Predicting Performance on NJSLA from MAP® Growth™ Page 17
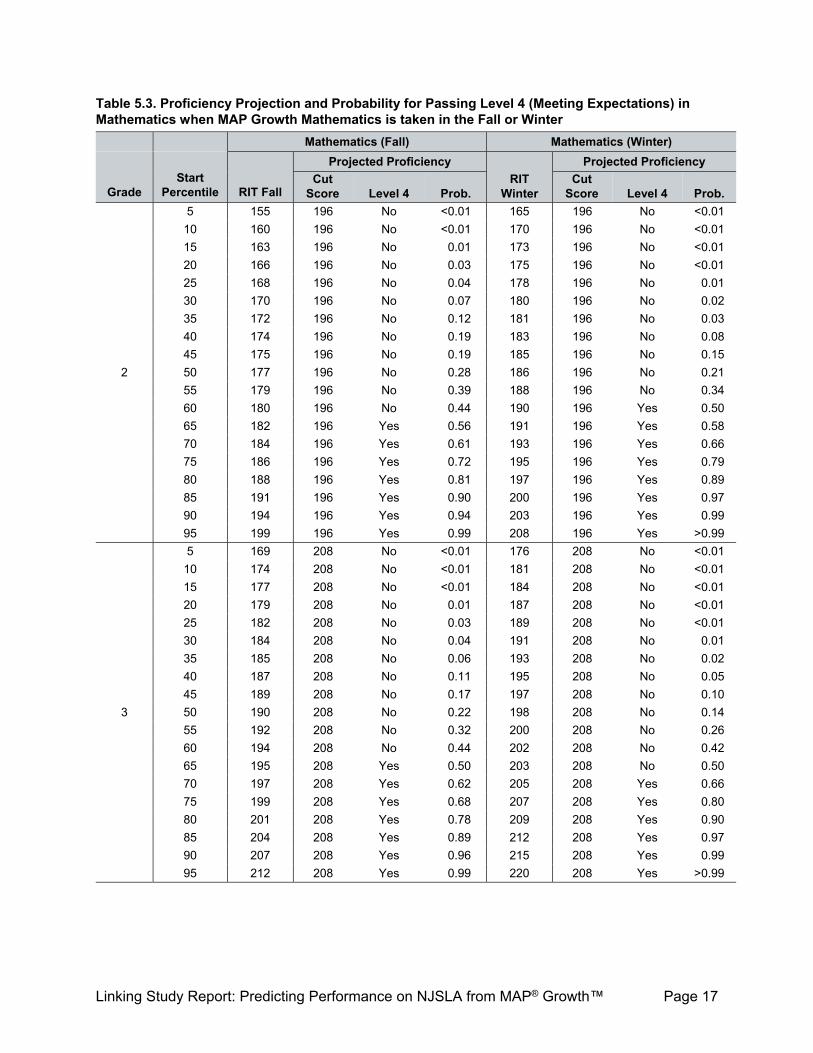
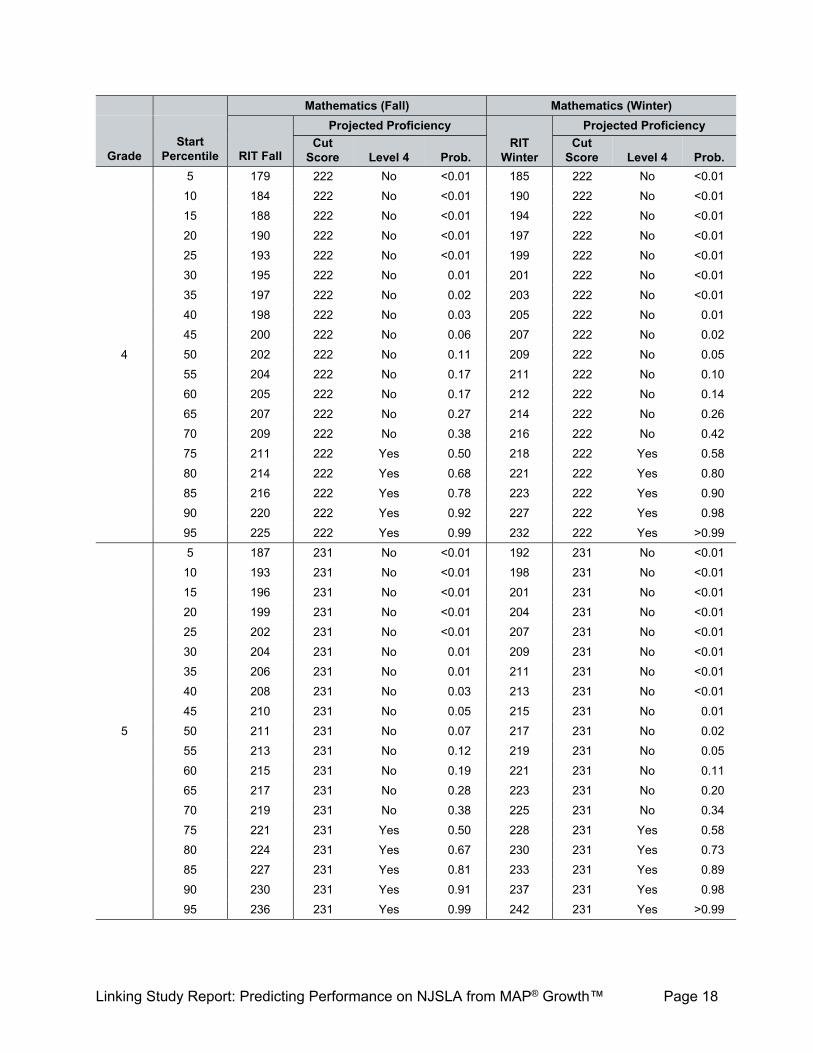
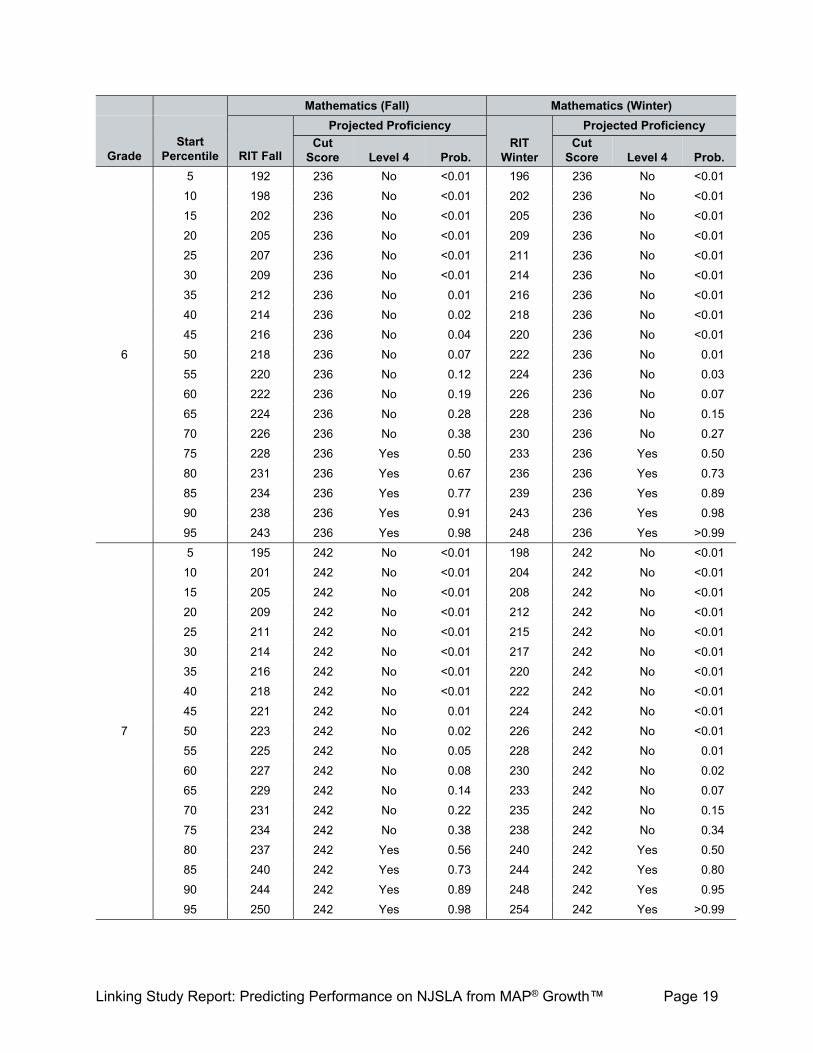
Table 5.3. Proficiency Projection and Probability for Passing Level 4 (Meeting Expectations) in Mathematics when MAP Growth Mathematics is taken in the Fall or Winter
Mathematics (Fall) Mathematics (Winter)
Grade Start
Percentile RIT Fall
Projected Proficiency
RIT Winter
Projected Proficiency
Cut Score Level 4 Prob.
Cut Score Level 4 Prob.
2
5 155 196 No <0.01 165 196 No <0.01
10 160 196 No <0.01 170 196 No <0.01
15 163 196 No 0.01 173 196 No <0.01
20 166 196 No 0.03 175 196 No <0.01
25 168 196 No 0.04 178 196 No 0.01
30 170 196 No 0.07 180 196 No 0.02
35 172 196 No 0.12 181 196 No 0.03
40 174 196 No 0.19 183 196 No 0.08
45 175 196 No 0.19 185 196 No 0.15
50 177 196 No 0.28 186 196 No 0.21
55 179 196 No 0.39 188 196 No 0.34
60 180 196 No 0.44 190 196 Yes 0.50
65 182 196 Yes 0.56 191 196 Yes 0.58
70 184 196 Yes 0.61 193 196 Yes 0.66
75 186 196 Yes 0.72 195 196 Yes 0.79
80 188 196 Yes 0.81 197 196 Yes 0.89
85 191 196 Yes 0.90 200 196 Yes 0.97
90 194 196 Yes 0.94 203 196 Yes 0.99
95 199 196 Yes 0.99 208 196 Yes >0.99
3
5 169 208 No <0.01 176 208 No <0.01
10 174 208 No <0.01 181 208 No <0.01
15 177 208 No <0.01 184 208 No <0.01
20 179 208 No 0.01 187 208 No <0.01
25 182 208 No 0.03 189 208 No <0.01
30 184 208 No 0.04 191 208 No 0.01
35 185 208 No 0.06 193 208 No 0.02
40 187 208 No 0.11 195 208 No 0.05
45 189 208 No 0.17 197 208 No 0.10
50 190 208 No 0.22 198 208 No 0.14
55 192 208 No 0.32 200 208 No 0.26
60 194 208 No 0.44 202 208 No 0.42
65 195 208 Yes 0.50 203 208 No 0.50
70 197 208 Yes 0.62 205 208 Yes 0.66
75 199 208 Yes 0.68 207 208 Yes 0.80
80 201 208 Yes 0.78 209 208 Yes 0.90
85 204 208 Yes 0.89 212 208 Yes 0.97
90 207 208 Yes 0.96 215 208 Yes 0.99
95 212 208 Yes 0.99 220 208 Yes >0.99
Linking Study Report: Predicting Performance on NJSLA from MAP® Growth™ Page 18
Mathematics (Fall) Mathematics (Winter)
Grade Start
Percentile RIT Fall
Projected Proficiency
RIT Winter
Projected Proficiency
Cut Score Level 4 Prob.
Cut Score Level 4 Prob.
4
5 179 222 No <0.01 185 222 No <0.01
10 184 222 No <0.01 190 222 No <0.01
15 188 222 No <0.01 194 222 No <0.01
20 190 222 No <0.01 197 222 No <0.01
25 193 222 No <0.01 199 222 No <0.01
30 195 222 No 0.01 201 222 No <0.01
35 197 222 No 0.02 203 222 No <0.01
40 198 222 No 0.03 205 222 No 0.01
45 200 222 No 0.06 207 222 No 0.02
50 202 222 No 0.11 209 222 No 0.05
55 204 222 No 0.17 211 222 No 0.10
60 205 222 No 0.17 212 222 No 0.14
65 207 222 No 0.27 214 222 No 0.26
70 209 222 No 0.38 216 222 No 0.42
75 211 222 Yes 0.50 218 222 Yes 0.58
80 214 222 Yes 0.68 221 222 Yes 0.80
85 216 222 Yes 0.78 223 222 Yes 0.90
90 220 222 Yes 0.92 227 222 Yes 0.98
95 225 222 Yes 0.99 232 222 Yes >0.99
5
5 187 231 No <0.01 192 231 No <0.01
10 193 231 No <0.01 198 231 No <0.01
15 196 231 No <0.01 201 231 No <0.01
20 199 231 No <0.01 204 231 No <0.01
25 202 231 No <0.01 207 231 No <0.01
30 204 231 No 0.01 209 231 No <0.01
35 206 231 No 0.01 211 231 No <0.01
40 208 231 No 0.03 213 231 No <0.01
45 210 231 No 0.05 215 231 No 0.01
50 211 231 No 0.07 217 231 No 0.02
55 213 231 No 0.12 219 231 No 0.05
60 215 231 No 0.19 221 231 No 0.11
65 217 231 No 0.28 223 231 No 0.20
70 219 231 No 0.38 225 231 No 0.34
75 221 231 Yes 0.50 228 231 Yes 0.58
80 224 231 Yes 0.67 230 231 Yes 0.73
85 227 231 Yes 0.81 233 231 Yes 0.89
90 230 231 Yes 0.91 237 231 Yes 0.98
95 236 231 Yes 0.99 242 231 Yes >0.99
Linking Study Report: Predicting Performance on NJSLA from MAP® Growth™ Page 19
Mathematics (Fall) Mathematics (Winter)
Grade Start
Percentile RIT Fall
Projected Proficiency
RIT Winter
Projected Proficiency
Cut Score Level 4 Prob.
Cut Score Level 4 Prob.
6
5 192 236 No <0.01 196 236 No <0.01
10 198 236 No <0.01 202 236 No <0.01
15 202 236 No <0.01 205 236 No <0.01
20 205 236 No <0.01 209 236 No <0.01
25 207 236 No <0.01 211 236 No <0.01
30 209 236 No <0.01 214 236 No <0.01
35 212 236 No 0.01 216 236 No <0.01
40 214 236 No 0.02 218 236 No <0.01
45 216 236 No 0.04 220 236 No <0.01
50 218 236 No 0.07 222 236 No 0.01
55 220 236 No 0.12 224 236 No 0.03
60 222 236 No 0.19 226 236 No 0.07
65 224 236 No 0.28 228 236 No 0.15
70 226 236 No 0.38 230 236 No 0.27
75 228 236 Yes 0.50 233 236 Yes 0.50
80 231 236 Yes 0.67 236 236 Yes 0.73
85 234 236 Yes 0.77 239 236 Yes 0.89
90 238 236 Yes 0.91 243 236 Yes 0.98
95 243 236 Yes 0.98 248 236 Yes >0.99
7
5 195 242 No <0.01 198 242 No <0.01
10 201 242 No <0.01 204 242 No <0.01
15 205 242 No <0.01 208 242 No <0.01
20 209 242 No <0.01 212 242 No <0.01
25 211 242 No <0.01 215 242 No <0.01
30 214 242 No <0.01 217 242 No <0.01
35 216 242 No <0.01 220 242 No <0.01
40 218 242 No <0.01 222 242 No <0.01
45 221 242 No 0.01 224 242 No <0.01
50 223 242 No 0.02 226 242 No <0.01
55 225 242 No 0.05 228 242 No 0.01
60 227 242 No 0.08 230 242 No 0.02
65 229 242 No 0.14 233 242 No 0.07
70 231 242 No 0.22 235 242 No 0.15
75 234 242 No 0.38 238 242 No 0.34
80 237 242 Yes 0.56 240 242 Yes 0.50
85 240 242 Yes 0.73 244 242 Yes 0.80
90 244 242 Yes 0.89 248 242 Yes 0.95
95 250 242 Yes 0.98 254 242 Yes >0.99
Linking Study Report: Predicting Performance on NJSLA from MAP® Growth™ Page 20
Mathematics (Fall) Mathematics (Winter)
Grade Start
Percentile RIT Fall
Projected Proficiency
RIT Winter
Projected Proficiency
Cut Score Level 4 Prob.
Cut Score Level 4 Prob.
8
5 197 246 No <0.01 199 246 No <0.01
10 203 246 No <0.01 206 246 No <0.01
15 208 246 No <0.01 210 246 No <0.01
20 211 246 No <0.01 214 246 No <0.01
25 214 246 No <0.01 217 246 No <0.01
30 217 246 No <0.01 220 246 No <0.01
35 219 246 No <0.01 222 246 No <0.01
40 222 246 No 0.01 225 246 No <0.01
45 224 246 No 0.01 227 246 No <0.01
50 226 246 No 0.02 229 246 No <0.01
55 229 246 No 0.06 231 246 No <0.01
60 231 246 No 0.10 234 246 No 0.02
65 233 246 No 0.15 236 246 No 0.06
70 236 246 No 0.22 239 246 No 0.16
75 238 246 No 0.30 241 246 No 0.28
80 241 246 No 0.45 245 246 Yes 0.58
85 245 246 Yes 0.65 248 246 Yes 0.79
90 249 246 Yes 0.82 253 246 Yes 0.96
95 256 246 Yes 0.97 259 246 Yes >0.99
Linking Study Report: Predicting Performance on NJSLA from MAP® Growth™ Page 21
6. Summary and Discussion
This study produced a set of cut scores on MAP Growth Reading and Mathematics tests for Grades 2–8 that correspond to each NJSLA performance level and demonstrated that MAP Growth scores can accurately predict whether a student could be proficient or above on the basis of their MAP Growth scores. This study also used the NWEA 2015 RIT Scale norming study results to project a student’s probability to meet proficiency based on that student’s prior MAP Growth scores in fall and winter. These results will help educators predict student performance on NJSLA tests as early as possible and identify those students who are at risk of failing to meet required standards so that they can receive necessary resources and assistance to meet their goals. While linking study results can be helpful and informative, they have general limitations. First, they provide information about score comparability on different tests, but the scores cannot be assumed to be interchangeable. In the case for state summative tests and MAP Growth tests, as they are not parallel in content, scores from the tests should not be directly compared. Second, the sample data used in this study were collected from 393 schools in several states, which may limit the generalizability of the results to test takers who differ significantly from this sample. Finally, cautions should also be exercised if the results are used for a subpopulation. NWEA will continue to gather information about NJSLA performance to enhance the quality and generalizability of the study.
Linking Study Report: Predicting Performance on NJSLA from MAP® Growth™ Page 22
7. References
Hanson, B. A., Harris, D. J., Pommerich, M., Sconing, J. A., & Yi, Q. (2001). Suggestions for the evaluation and use of concordance results. (ACT Research Report No. 2001-1). Iowa City, IA: ACT, Inc.
Kolen, M. J., & Brennan, R. L. (2004). Test equating, scaling, and linking. New York: Springer. Pommerich, M., Hanson, B., Harris, D., & Sconing, J. (2004). Issues in conducting linkage
between distinct tests. Applied Psychological Measurement, 28(4), 247–273. Thum, Y. M., & Hauser, C. H. (2015). NWEA 2015 MAP norms for student and school
achievement status and growth. NWEA Research Report. Portland, OR: NWEA.
Appendix A: Data and Analysis
Linking Study Report: Predicting Performance on NJSLA from MAP® Growth™ Page 23
Appendix A: Data and Analysis
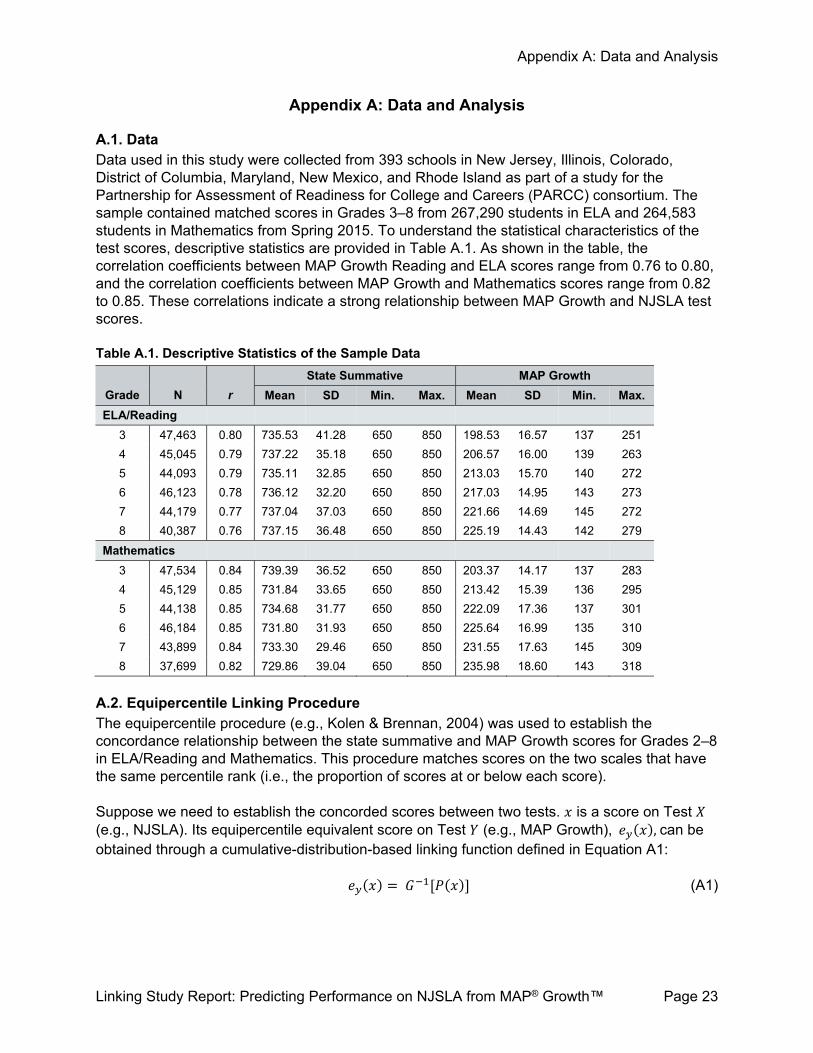
A.1. Data Data used in this study were collected from 393 schools in New Jersey, Illinois, Colorado, District of Columbia, Maryland, New Mexico, and Rhode Island as part of a study for the Partnership for Assessment of Readiness for College and Careers (PARCC) consortium. The sample contained matched scores in Grades 3–8 from 267,290 students in ELA and 264,583 students in Mathematics from Spring 2015. To understand the statistical characteristics of the test scores, descriptive statistics are provided in Table A.1. As shown in the table, the correlation coefficients between MAP Growth Reading and ELA scores range from 0.76 to 0.80, and the correlation coefficients between MAP Growth and Mathematics scores range from 0.82 to 0.85. These correlations indicate a strong relationship between MAP Growth and NJSLA test scores. Table A.1. Descriptive Statistics of the Sample Data
Grade N r
State Summative MAP Growth
Mean SD Min. Max. Mean SD Min. Max.
ELA/Reading
3 47,463 0.80 735.53 41.28 650 850 198.53 16.57 137 251
4 45,045 0.79 737.22 35.18 650 850 206.57 16.00 139 263
5 44,093 0.79 735.11 32.85 650 850 213.03 15.70 140 272
6 46,123 0.78 736.12 32.20 650 850 217.03 14.95 143 273
7 44,179 0.77 737.04 37.03 650 850 221.66 14.69 145 272
8 40,387 0.76 737.15 36.48 650 850 225.19 14.43 142 279
Mathematics
3 47,534 0.84 739.39 36.52 650 850 203.37 14.17 137 283
4 45,129 0.85 731.84 33.65 650 850 213.42 15.39 136 295
5 44,138 0.85 734.68 31.77 650 850 222.09 17.36 137 301
6 46,184 0.85 731.80 31.93 650 850 225.64 16.99 135 310
7 43,899 0.84 733.30 29.46 650 850 231.55 17.63 145 309
8 37,699 0.82 729.86 39.04 650 850 235.98 18.60 143 318
A.2. Equipercentile Linking Procedure The equipercentile procedure (e.g., Kolen & Brennan, 2004) was used to establish the concordance relationship between the state summative and MAP Growth scores for Grades 2–8 in ELA/Reading and Mathematics. This procedure matches scores on the two scales that have the same percentile rank (i.e., the proportion of scores at or below each score). Suppose we need to establish the concorded scores between two tests. 𝑥 is a score on Test 𝑋 (e.g., NJSLA). Its equipercentile equivalent score on Test 𝑌 (e.g., MAP Growth), 𝑒 𝑥 , can be obtained through a cumulative-distribution-based linking function defined in Equation A1:
𝑒 𝑥 𝐺 𝑃 𝑥 (A1)
Appendix A: Data and Analysis
Linking Study Report: Predicting Performance on NJSLA from MAP® Growth™ Page 24
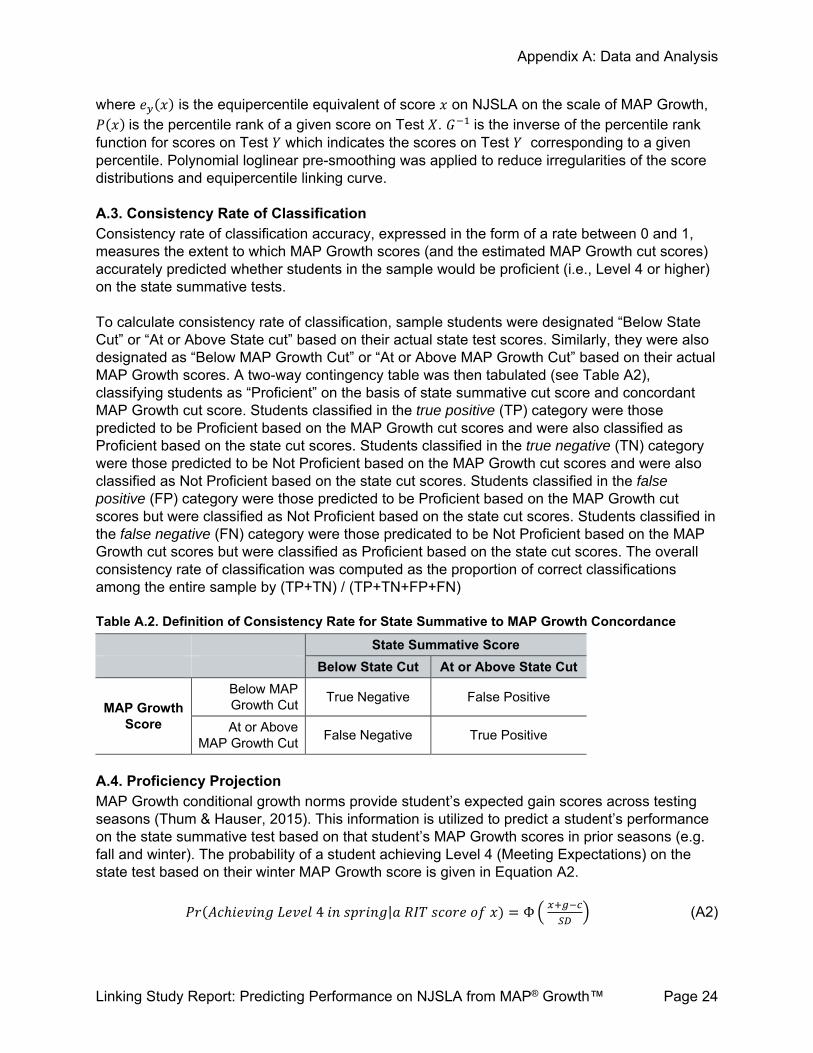
where 𝑒 𝑥 is the equipercentile equivalent of score 𝑥 on NJSLA on the scale of MAP Growth, 𝑃 𝑥 is the percentile rank of a given score on Test 𝑋. 𝐺 is the inverse of the percentile rank function for scores on Test 𝑌 which indicates the scores on Test 𝑌 corresponding to a given percentile. Polynomial loglinear pre-smoothing was applied to reduce irregularities of the score distributions and equipercentile linking curve. A.3. Consistency Rate of Classification Consistency rate of classification accuracy, expressed in the form of a rate between 0 and 1, measures the extent to which MAP Growth scores (and the estimated MAP Growth cut scores) accurately predicted whether students in the sample would be proficient (i.e., Level 4 or higher) on the state summative tests. To calculate consistency rate of classification, sample students were designated “Below State Cut” or “At or Above State cut” based on their actual state test scores. Similarly, they were also designated as “Below MAP Growth Cut” or “At or Above MAP Growth Cut” based on their actual MAP Growth scores. A two-way contingency table was then tabulated (see Table A2), classifying students as “Proficient” on the basis of state summative cut score and concordant MAP Growth cut score. Students classified in the true positive (TP) category were those predicted to be Proficient based on the MAP Growth cut scores and were also classified as Proficient based on the state cut scores. Students classified in the true negative (TN) category were those predicted to be Not Proficient based on the MAP Growth cut scores and were also classified as Not Proficient based on the state cut scores. Students classified in the false positive (FP) category were those predicted to be Proficient based on the MAP Growth cut scores but were classified as Not Proficient based on the state cut scores. Students classified in the false negative (FN) category were those predicated to be Not Proficient based on the MAP Growth cut scores but were classified as Proficient based on the state cut scores. The overall consistency rate of classification was computed as the proportion of correct classifications among the entire sample by (TP+TN) / (TP+TN+FP+FN) Table A.2. Definition of Consistency Rate for State Summative to MAP Growth Concordance
State Summative Score
Below State Cut At or Above State Cut
MAP Growth Score
Below MAP Growth Cut
True Negative False Positive
At or Above MAP Growth Cut
False Negative True Positive
A.4. Proficiency Projection MAP Growth conditional growth norms provide student’s expected gain scores across testing seasons (Thum & Hauser, 2015). This information is utilized to predict a student’s performance on the state summative test based on that student’s MAP Growth scores in prior seasons (e.g. fall and winter). The probability of a student achieving Level 4 (Meeting Expectations) on the state test based on their winter MAP Growth score is given in Equation A2.
𝑃𝑟 𝐴𝑐ℎ𝑖𝑒𝑣𝑖𝑛𝑔 𝐿𝑒𝑣𝑒𝑙 4 𝑖𝑛 𝑠𝑝𝑟𝑖𝑛𝑔|𝑎 𝑅𝐼𝑇 𝑠𝑐𝑜𝑟𝑒 𝑜𝑓 𝑥 Φ (A2)
Appendix A: Data and Analysis
Linking Study Report: Predicting Performance on NJSLA from MAP® Growth™ Page 25
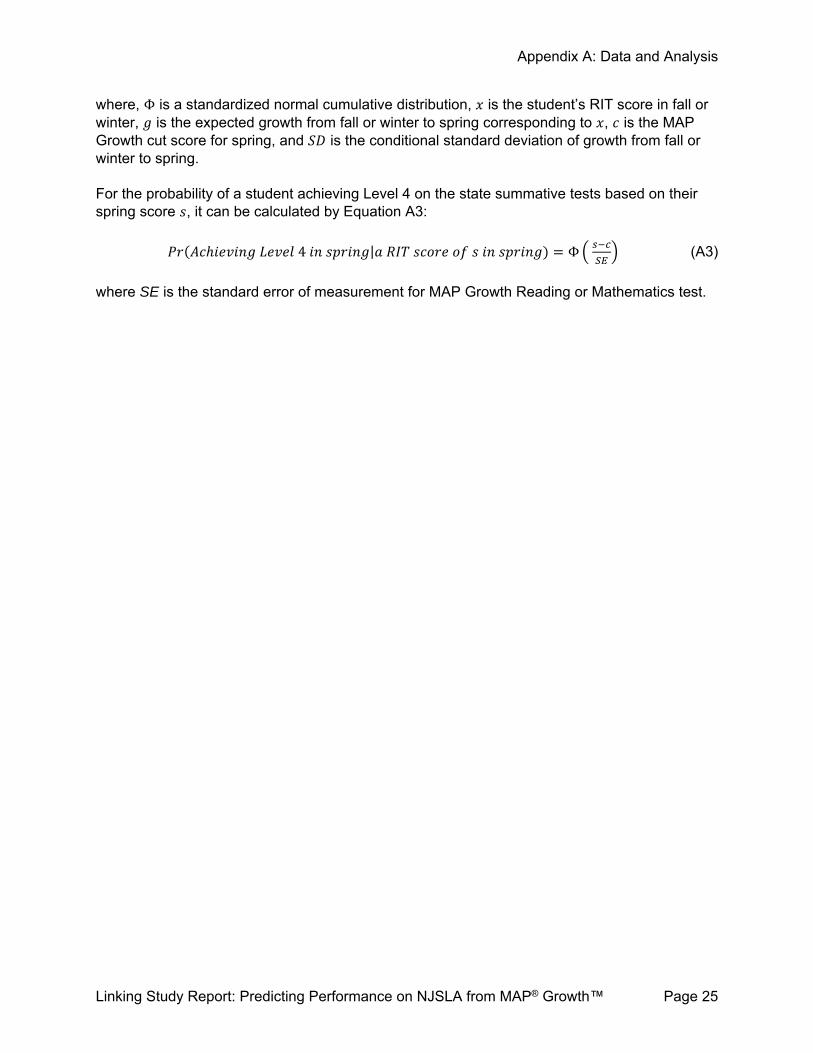
where, Φ is a standardized normal cumulative distribution, 𝑥 is the student’s RIT score in fall or winter, 𝑔 is the expected growth from fall or winter to spring corresponding to 𝑥, 𝑐 is the MAP Growth cut score for spring, and 𝑆𝐷 is the conditional standard deviation of growth from fall or winter to spring. For the probability of a student achieving Level 4 on the state summative tests based on their spring score 𝑠, it can be calculated by Equation A3:
𝑃𝑟 𝐴𝑐ℎ𝑖𝑒𝑣𝑖𝑛𝑔 𝐿𝑒𝑣𝑒𝑙 4 𝑖𝑛 𝑠𝑝𝑟𝑖𝑛𝑔|𝑎 𝑅𝐼𝑇 𝑠𝑐𝑜𝑟𝑒 𝑜𝑓 𝑠 𝑖𝑛 𝑠𝑝𝑟𝑖𝑛𝑔 Φ (A3)
where SE is the standard error of measurement for MAP Growth Reading or Mathematics test.