Embed Size (px)
Citation preview
Media Briefing Backgrounder October 2014
Liquefied natural gas and carbon pollution in British Columbia by Matt Horne
British Columbia intends to introduce new carbon pollution rules for liquefied natural gas (LNG) projects proposed in the province. This backgrounder reviews the sources of carbon pollution from LNG and shale gas development, the opportunities to reduce those emissions, as well as current and emerging climate policies in B.C.
Sources of carbon pollution from LNG and shale gas Carbon pollution is released all along the LNG supply chain, from the point where the shale gas is extracted (the “wellhead”) to the point where it is burned for electricity or transportation. Figure 1 illustrates the relative magnitudes of these carbon pollution sources.
Figure 1: Map of LNG carbon pollution magnitudes1
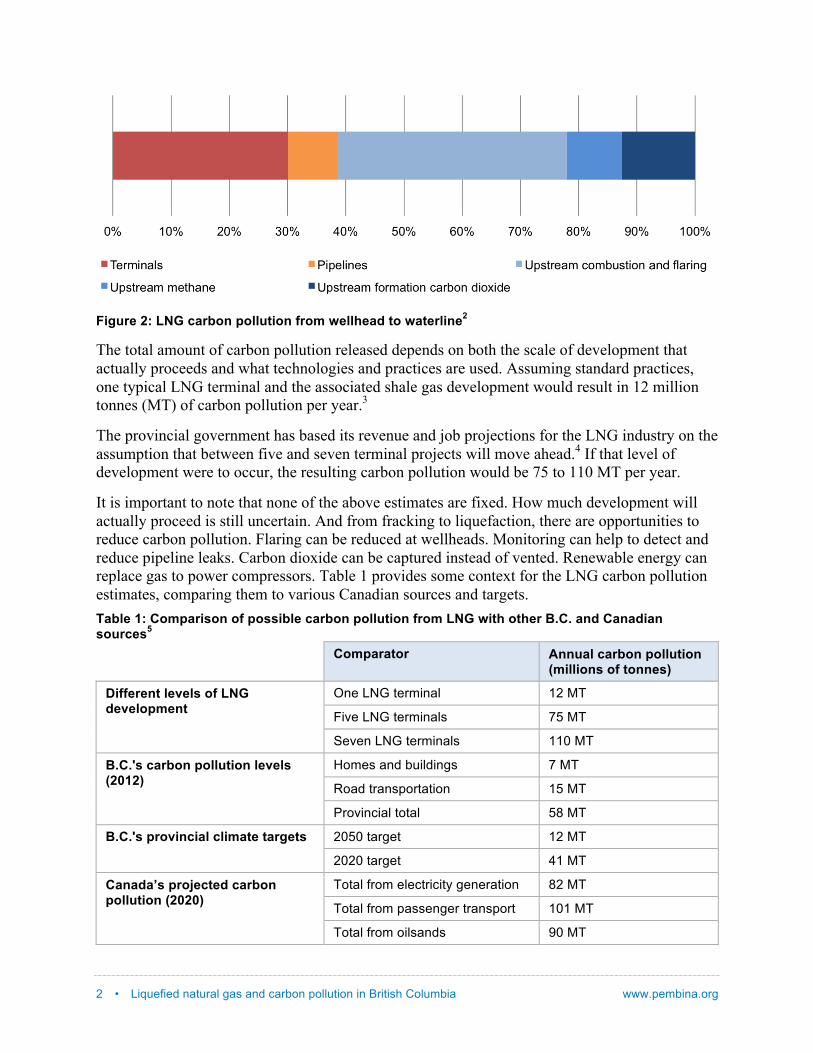
When focusing on British Columbia, we can look at every stage from the wellhead to the “waterline” — that is, the point where LNG leaves the province on tankers. Figure 2 shows a breakdown of these sources of carbon pollution from LNG and shale gas development. Based on these numbers, 9% of the carbon pollution would come from the large east-west pipelines connecting the terminals with northeast B.C., 30% would come from the LNG terminals and 61% would come from extracting and processing shale gas.
2 • Liquefied natural gas and carbon pollution in British Columbia www.pembina.org
Figure 2: LNG carbon pollution from wellhead to waterline2
The total amount of carbon pollution released depends on both the scale of development that actually proceeds and what technologies and practices are used. Assuming standard practices, one typical LNG terminal and the associated shale gas development would result in 12 million tonnes (MT) of carbon pollution per year.3
The provincial government has based its revenue and job projections for the LNG industry on the assumption that between five and seven terminal projects will move ahead.4 If that level of development were to occur, the resulting carbon pollution would be 75 to 110 MT per year.
It is important to note that none of the above estimates are fixed. How much development will actually proceed is still uncertain. And from fracking to liquefaction, there are opportunities to reduce carbon pollution. Flaring can be reduced at wellheads. Monitoring can help to detect and reduce pipeline leaks. Carbon dioxide can be captured instead of vented. Renewable energy can replace gas to power compressors. Table 1 provides some context for the LNG carbon pollution estimates, comparing them to various Canadian sources and targets. Table 1: Comparison of possible carbon pollution from LNG with other B.C. and Canadian sources5
Comparator Annual carbon pollution (millions of tonnes)
Different levels of LNG development
One LNG terminal 12 MT
Five LNG terminals 75 MT
Seven LNG terminals 110 MT
B.C.'s carbon pollution levels (2012)
Homes and buildings 7 MT
Road transportation 15 MT
Provincial total 58 MT
B.C.'s provincial climate targets 2050 target 12 MT
2020 target 41 MT
Canada’s projected carbon pollution (2020)
Total from electricity generation 82 MT
Total from passenger transport 101 MT
Total from oilsands 90 MT
www.pembina.org Liquefied natural gas and carbon pollution in British Columbia • 3
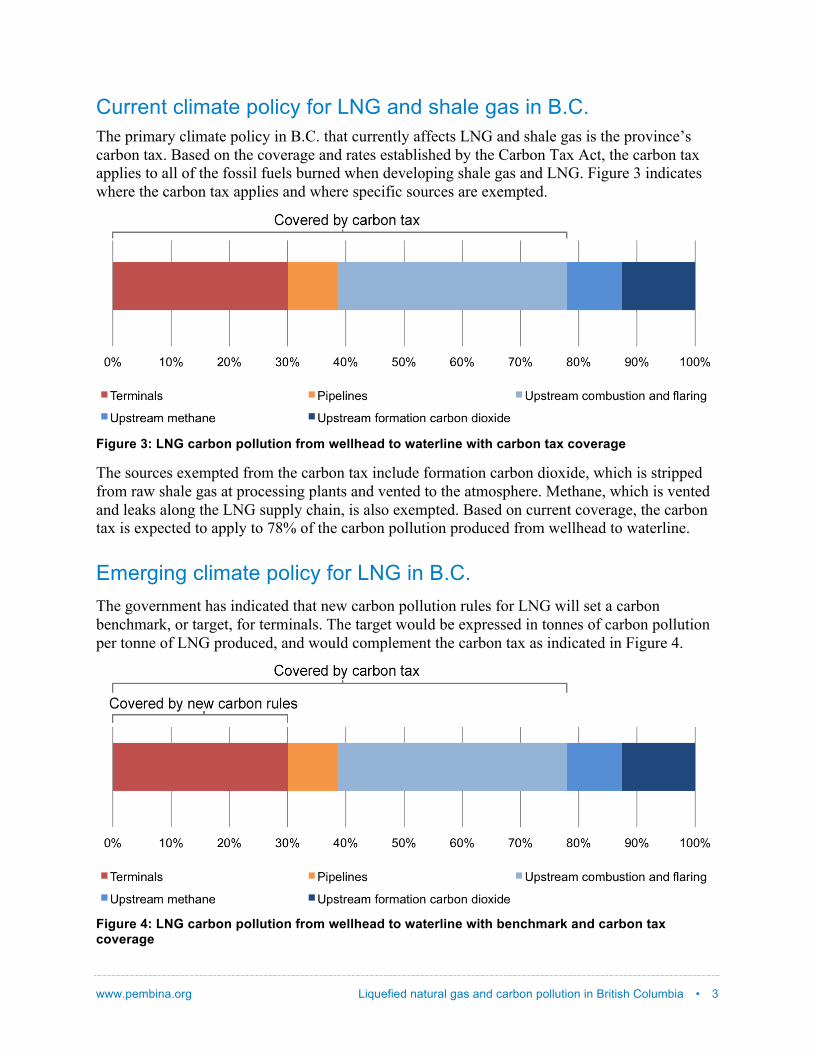
Current climate policy for LNG and shale gas in B.C. The primary climate policy in B.C. that currently affects LNG and shale gas is the province’s carbon tax. Based on the coverage and rates established by the Carbon Tax Act, the carbon tax applies to all of the fossil fuels burned when developing shale gas and LNG. Figure 3 indicates where the carbon tax applies and where specific sources are exempted.
Figure 3: LNG carbon pollution from wellhead to waterline with carbon tax coverage
The sources exempted from the carbon tax include formation carbon dioxide, which is stripped from raw shale gas at processing plants and vented to the atmosphere. Methane, which is vented and leaks along the LNG supply chain, is also exempted. Based on current coverage, the carbon tax is expected to apply to 78% of the carbon pollution produced from wellhead to waterline.
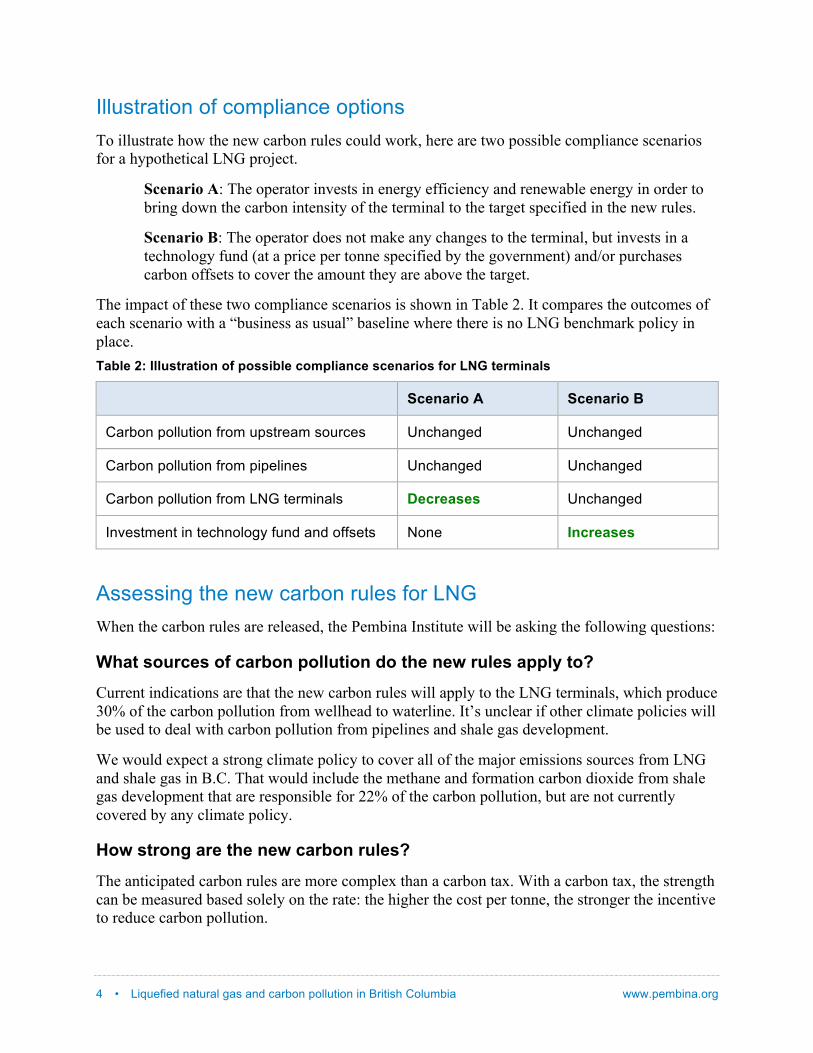
Emerging climate policy for LNG in B.C. The government has indicated that new carbon pollution rules for LNG will set a carbon benchmark, or target, for terminals. The target would be expressed in tonnes of carbon pollution per tonne of LNG produced, and would complement the carbon tax as indicated in Figure 4.
Figure 4: LNG carbon pollution from wellhead to waterline with benchmark and carbon tax coverage
4 • Liquefied natural gas and carbon pollution in British Columbia www.pembina.org
Illustration of compliance options To illustrate how the new carbon rules could work, here are two possible compliance scenarios for a hypothetical LNG project.
Scenario A: The operator invests in energy efficiency and renewable energy in order to bring down the carbon intensity of the terminal to the target specified in the new rules.
Scenario B: The operator does not make any changes to the terminal, but invests in a technology fund (at a price per tonne specified by the government) and/or purchases carbon offsets to cover the amount they are above the target.
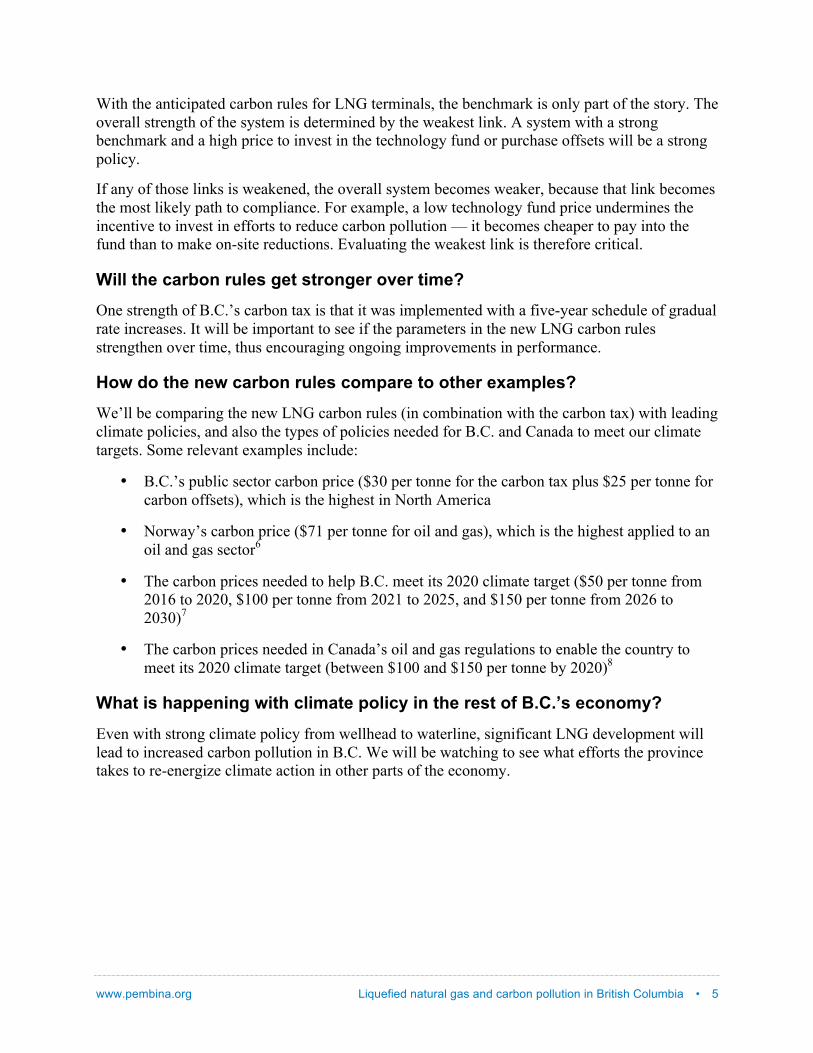
The impact of these two compliance scenarios is shown in Table 2. It compares the outcomes of each scenario with a “business as usual” baseline where there is no LNG benchmark policy in place. Table 2: Illustration of possible compliance scenarios for LNG terminals
Scenario A Scenario B
Carbon pollution from upstream sources Unchanged Unchanged
Carbon pollution from pipelines Unchanged Unchanged
Carbon pollution from LNG terminals Decreases Unchanged
Investment in technology fund and offsets None Increases
Assessing the new carbon rules for LNG When the carbon rules are released, the Pembina Institute will be asking the following questions:
What sources of carbon pollution do the new rules apply to? Current indications are that the new carbon rules will apply to the LNG terminals, which produce 30% of the carbon pollution from wellhead to waterline. It’s unclear if other climate policies will be used to deal with carbon pollution from pipelines and shale gas development.
We would expect a strong climate policy to cover all of the major emissions sources from LNG and shale gas in B.C. That would include the methane and formation carbon dioxide from shale gas development that are responsible for 22% of the carbon pollution, but are not currently covered by any climate policy.
How strong are the new carbon rules?
The anticipated carbon rules are more complex than a carbon tax. With a carbon tax, the strength can be measured based solely on the rate: the higher the cost per tonne, the stronger the incentive to reduce carbon pollution.
www.pembina.org Liquefied natural gas and carbon pollution in British Columbia • 5
With the anticipated carbon rules for LNG terminals, the benchmark is only part of the story. The overall strength of the system is determined by the weakest link. A system with a strong benchmark and a high price to invest in the technology fund or purchase offsets will be a strong policy.
If any of those links is weakened, the overall system becomes weaker, because that link becomes the most likely path to compliance. For example, a low technology fund price undermines the incentive to invest in efforts to reduce carbon pollution — it becomes cheaper to pay into the fund than to make on-site reductions. Evaluating the weakest link is therefore critical.
Will the carbon rules get stronger over time? One strength of B.C.’s carbon tax is that it was implemented with a five-year schedule of gradual rate increases. It will be important to see if the parameters in the new LNG carbon rules strengthen over time, thus encouraging ongoing improvements in performance.
How do the new carbon rules compare to other examples? We’ll be comparing the new LNG carbon rules (in combination with the carbon tax) with leading climate policies, and also the types of policies needed for B.C. and Canada to meet our climate targets. Some relevant examples include:
• B.C.’s public sector carbon price ($30 per tonne for the carbon tax plus $25 per tonne for carbon offsets), which is the highest in North America
• Norway’s carbon price ($71 per tonne for oil and gas), which is the highest applied to an oil and gas sector6
• The carbon prices needed to help B.C. meet its 2020 climate target ($50 per tonne from 2016 to 2020, $100 per tonne from 2021 to 2025, and $150 per tonne from 2026 to 2030)7
• The carbon prices needed in Canada’s oil and gas regulations to enable the country to meet its 2020 climate target (between $100 and $150 per tonne by 2020)8
What is happening with climate policy in the rest of B.C.’s economy?
Even with strong climate policy from wellhead to waterline, significant LNG development will lead to increased carbon pollution in B.C. We will be watching to see what efforts the province takes to re-energize climate action in other parts of the economy.
6 • Liquefied natural gas and carbon pollution in British Columbia www.pembina.org
Additional resources Report: Wellhead to Waterline: Opportunities to limit greenhouse gas emissions from B.C.’s proposed LNG industry (Pembina Institute, 2014): http://www.pembina.org/pub/2524
Report: Carbon Pricing Approaches in oil and gas producing jurisdictions (Pembina Institute, 2013): http://www.pembina.org/pub/2414
Report: The Cleanest LNG in the World? How to Slash Carbon Pollution From Wellhead to Waterline in British Columbia’s Proposed Liquefied Natural Gas Industry (Tides Canada, 2013): http://cleanenergycanada.org/works/cleanest-lng-in-world/
Backgrounder: Climate change policy in Alberta (Pembina Institute, 2014): http://www.pembina.org/pub/climate-change-policy-in-alberta
Blog: “How carbon pricing currently works in Alberta” (Pembina Institute, 2013): http://www.pembina.org/blog/708 1 The LNG terminal estimate is derived from the Environmental Assessment Application (Section 7) for the Pacific NorthWest LNG proposal. The pipeline estimate is derived from the Environmental Assessment Application (Appendix 2-A) for the Westcoast Connector Gas Transmission proposal. The shale gas estimate is derived from earlier analyses by Navius Research, Clean Energy Canada and the Pembina Institute. 2 The LNG terminal, pipeline and combined upstream estimates are from the same sources cited for Figure 1. The breakdown between different upstream estimates is based on facility-level emissions reporting from the B.C. Ministry of Environment. 3 The different LNG proposals vary in location and size. This estimate is based on an LNG terminal that produces 13 million tonnes of LNG per year, which is similar in size to the first phases of the Pacific Northwest LNG and LNG Canada proposals. 4 The five terminal scenario assumes 82 MT of LNG being exported per year, while the seven terminal scenario assumes 120 MT of LNG. The average capacity of a terminal is 15 to 17 MT of LNG per year. 5 The B.C. carbon pollution levels and targets are from B.C.’s provincial inventory. Canada’s projected carbon pollution is based on: Environment Canada, Canada’s Emissions Trends (2013). 6 P.J. Partington and Matt Horne, Carbon Pricing Approaches in oil and gas producing jurisdictions (Pembina Institute, 2013). http://www.pembina.org/pub/2414 7 B.C. Ministry on Environment, Climate Action Plan (2008), Appendix I, Table 10. http://www.livesmartbc.ca/attachments/climateaction_plan_web.pdf 8 P.J Partington, Matt Horne and Clare Demerse, Getting on Track to 2020: Recommendations for greenhouse gas regulations in Canada’s oil and gas sector (Pembina Institute, 2013). http://www.pembina.org/pub/2427