Embed Size (px)
Citation preview
Liquefied Natural Gas (LNG)
March 2017
Sector Overview
LNG Industry
Global Industry
Life Cycle
Industry Dynamics
Trade | Regional Mix
Exporting & Importing Countries
Pricing
Local Industry
Dynamics | Production & Consumption
Government Initiatives
Upcoming Developments
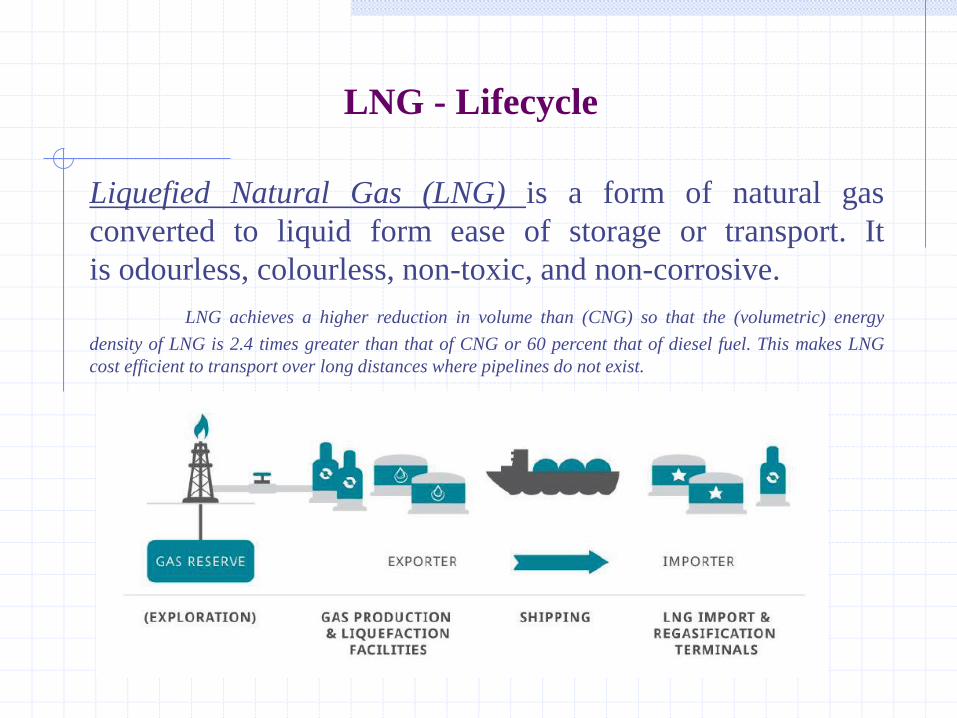
LNG - Lifecycle
Liquefied Natural Gas (LNG) is a form of natural gas
converted to liquid form ease of storage or transport. It
is odourless, colourless, non-toxic, and non-corrosive.
LNG achieves a higher reduction in volume than (CNG) so that the (volumetric) energy
density of LNG is 2.4 times greater than that of CNG or 60 percent that of diesel fuel. This makes LNG
cost efficient to transport over long distances where pipelines do not exist.
Global Gas Industry
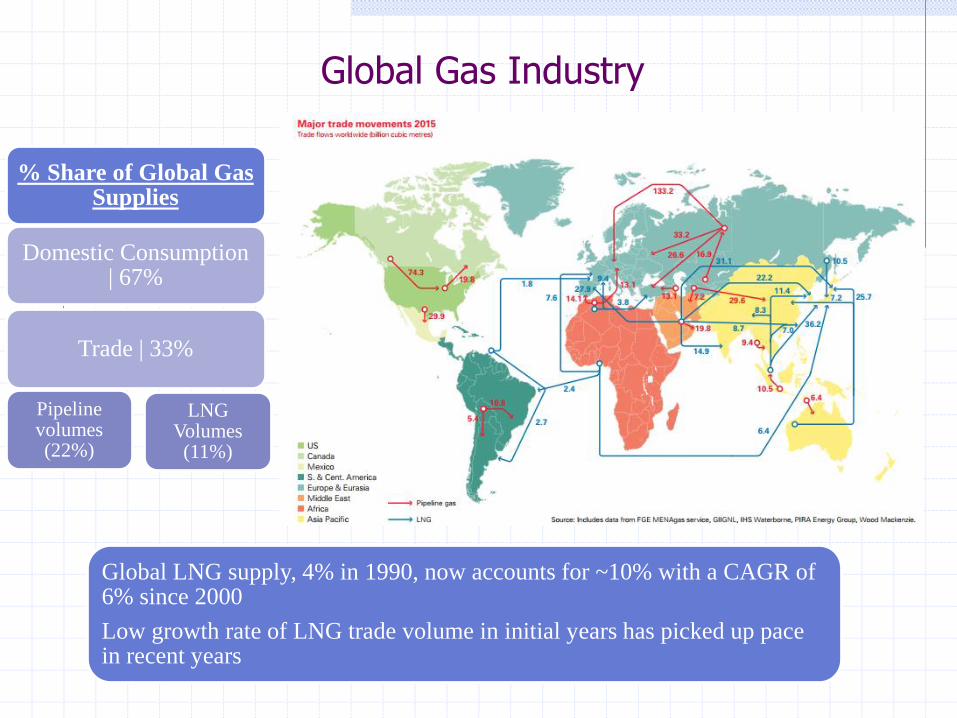
% Share of Global Gas Supplies
Domestic Consumption | 67%
Trade | 33%
Pipeline volumes (22%)
LNG Volumes
(11%)
Global LNG supply, 4% in 1990, now accounts for ~10% with a CAGR of 6% since 2000
Low growth rate of LNG trade volume in initial years has picked up pace in recent years
Global Trade | Regional Mix for CY16
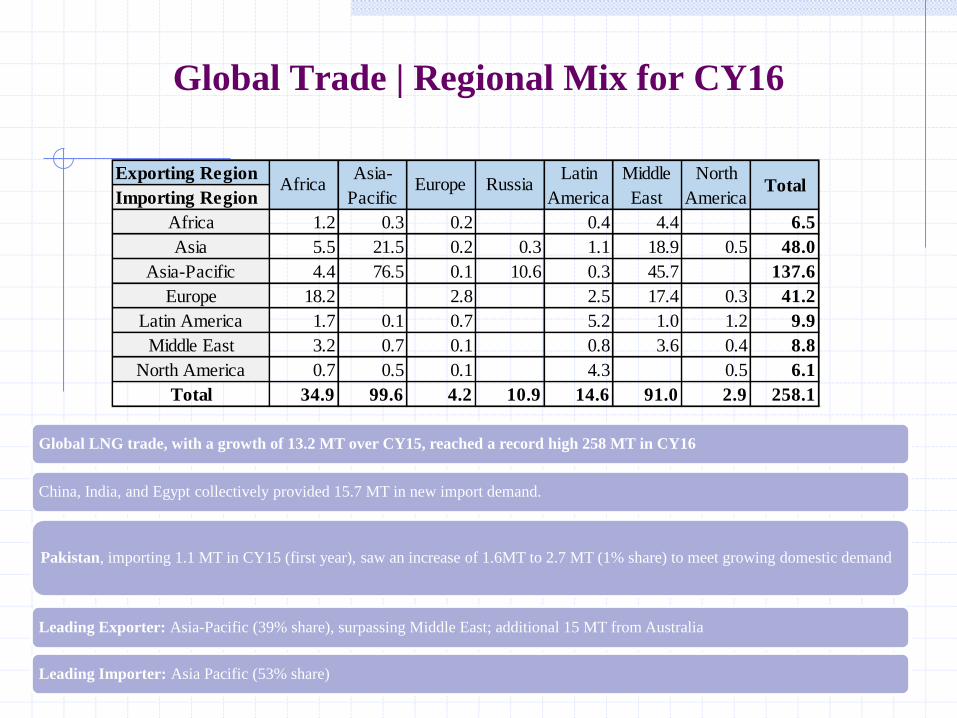
Global LNG trade, with a growth of 13.2 MT over CY15, reached a record high 258 MT in CY16
China, India, and Egypt collectively provided 15.7 MT in new import demand.
Leading Exporter: Asia-Pacific (39% share), surpassing Middle East; additional 15 MT from Australia
Leading Importer: Asia Pacific (53% share)
Pakistan, importing 1.1 MT in CY15 (first year), saw an increase of 1.6MT to 2.7 MT (1% share) to meet growing domestic demand
Exporting Region
Importing Region
1.2 0.3 0.2 0.4 4.4 6.5
5.5 21.5 0.2 0.3 1.1 18.9 0.5 48.0
4.4 76.5 0.1 10.6 0.3 45.7 137.6
18.2 2.8 2.5 17.4 0.3 41.2
1.7 0.1 0.7 5.2 1.0 1.2 9.9
3.2 0.7 0.1 0.8 3.6 0.4 8.8
0.7 0.5 0.1 4.3 0.5 6.1
34.9 99.6 4.2 10.9 14.6 91.0 2.9 258.1Total
EuropeAsia-
PacificAfrica
North America
Middle East
Latin America
Europe
Asia-Pacific
Asia
Africa
Russia TotalNorth
America
Middle
East
Latin
America
Global Trade | Countries
Exporting Countries Importing Countries
Name Qty (MTPA) Name Qty (MTPA)
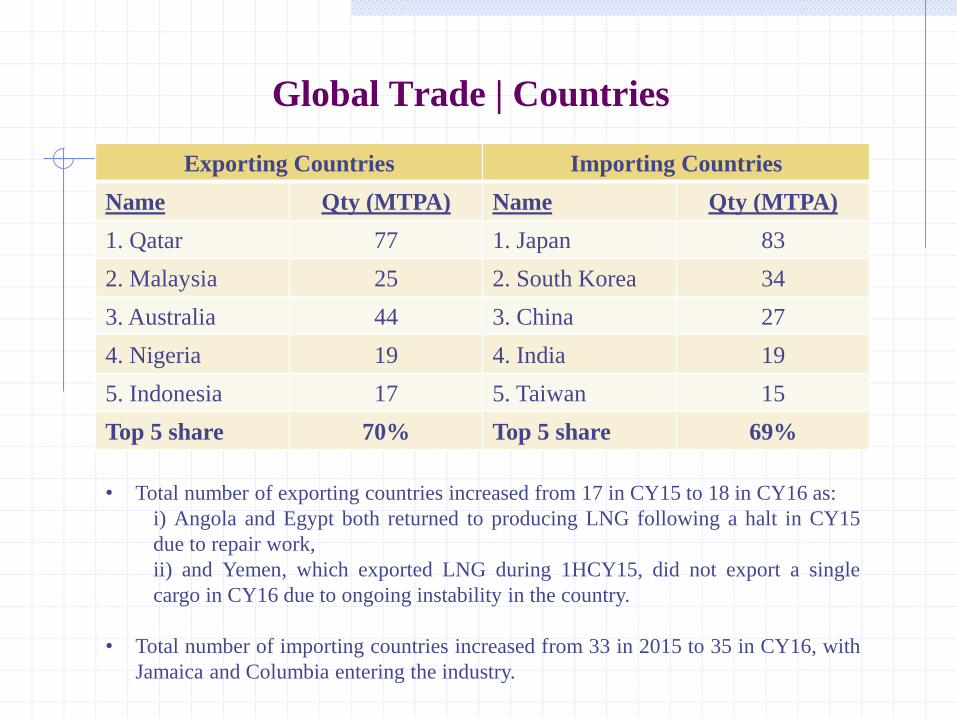
1. Qatar 77 1. Japan 83
2. Malaysia 25 2. South Korea 34
3. Australia 44 3. China 27
4. Nigeria 19 4. India 19
5. Indonesia 17 5. Taiwan 15
Top 5 share 70% Top 5 share 69%
• Total number of exporting countries increased from 17 in CY15 to 18 in CY16 as:
i) Angola and Egypt both returned to producing LNG following a halt in CY15
due to repair work,
ii) and Yemen, which exported LNG during 1HCY15, did not export a single
cargo in CY16 due to ongoing instability in the country.
• Total number of importing countries increased from 33 in 2015 to 35 in CY16, with
Jamaica and Columbia entering the industry.
Global Pricing Mechanism
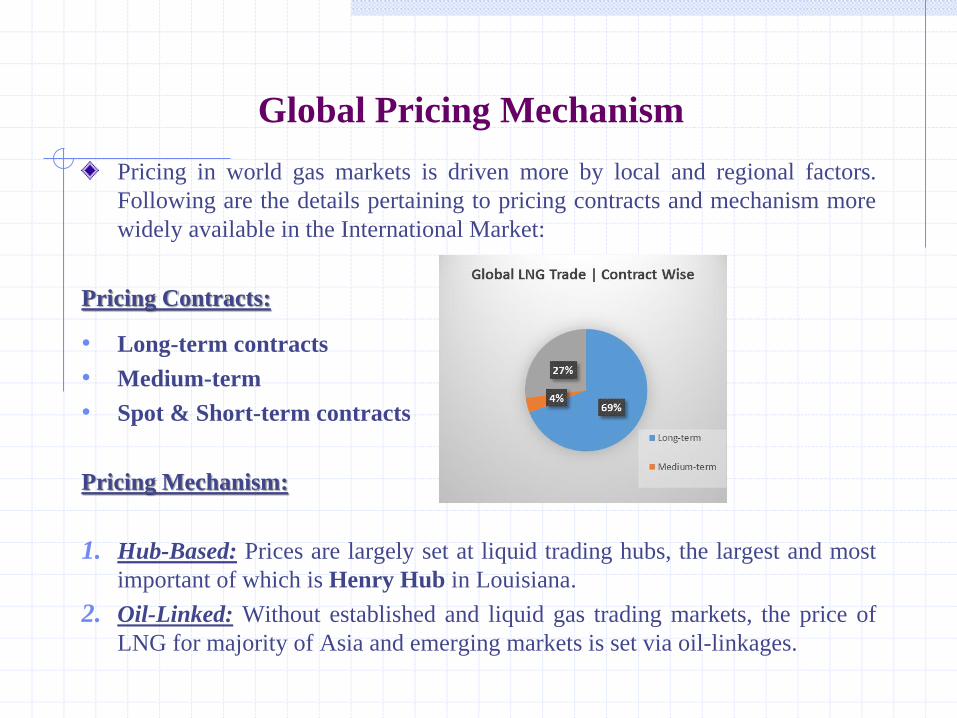
Pricing in world gas markets is driven more by local and regional factors.
Following are the details pertaining to pricing contracts and mechanism more
widely available in the International Market:
Pricing Contracts:
• Long-term contracts
• Medium-term
• Spot & Short-term contracts
Pricing Mechanism:
1. Hub-Based: Prices are largely set at liquid trading hubs, the largest and most
important of which is Henry Hub in Louisiana.
2. Oil-Linked: Without established and liquid gas trading markets, the price of
LNG for majority of Asia and emerging markets is set via oil-linkages.
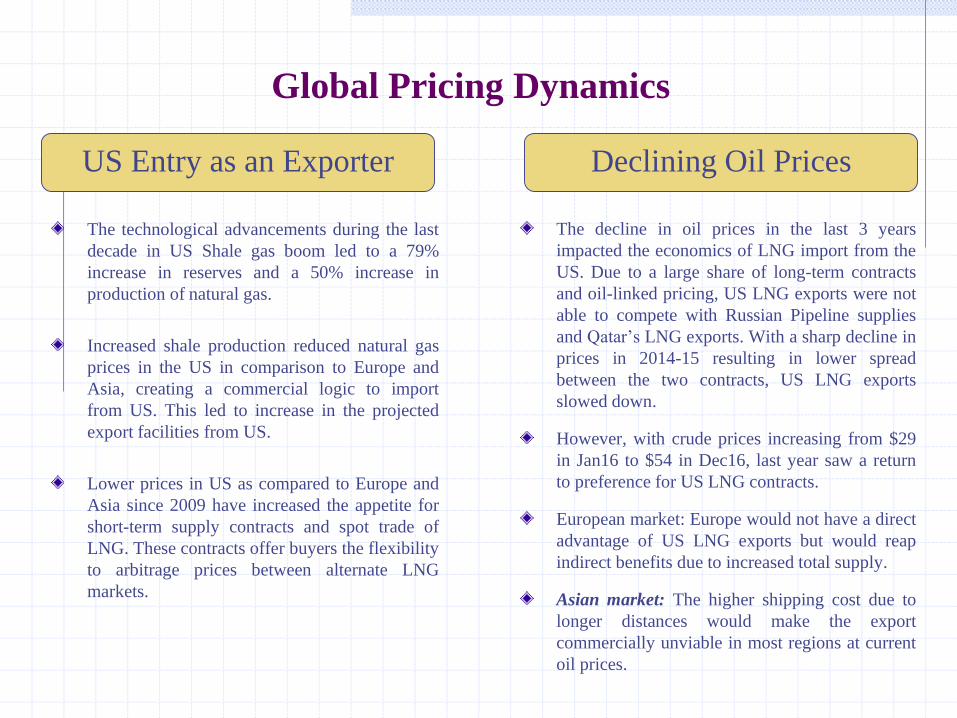
Global Pricing Dynamics
The technological advancements during the last
decade in US Shale gas boom led to a 79%
increase in reserves and a 50% increase in
production of natural gas.
Increased shale production reduced natural gas
prices in the US in comparison to Europe and
Asia, creating a commercial logic to import
from US. This led to increase in the projected
export facilities from US.
Lower prices in US as compared to Europe and
Asia since 2009 have increased the appetite for
short-term supply contracts and spot trade of
LNG. These contracts offer buyers the flexibility
to arbitrage prices between alternate LNG
markets.
The decline in oil prices in the last 3 years
impacted the economics of LNG import from the
US. Due to a large share of long-term contracts
and oil-linked pricing, US LNG exports were not
able to compete with Russian Pipeline supplies
and Qatar’s LNG exports. With a sharp decline in
prices in 2014-15 resulting in lower spread
between the two contracts, US LNG exports
slowed down.
However, with crude prices increasing from $29
in Jan16 to $54 in Dec16, last year saw a return
to preference for US LNG contracts.
European market: Europe would not have a direct
advantage of US LNG exports but would reap
indirect benefits due to increased total supply.
Asian market: The higher shipping cost due to
longer distances would make the export
commercially unviable in most regions at current
oil prices.
US Entry as an Exporter Declining Oil Prices
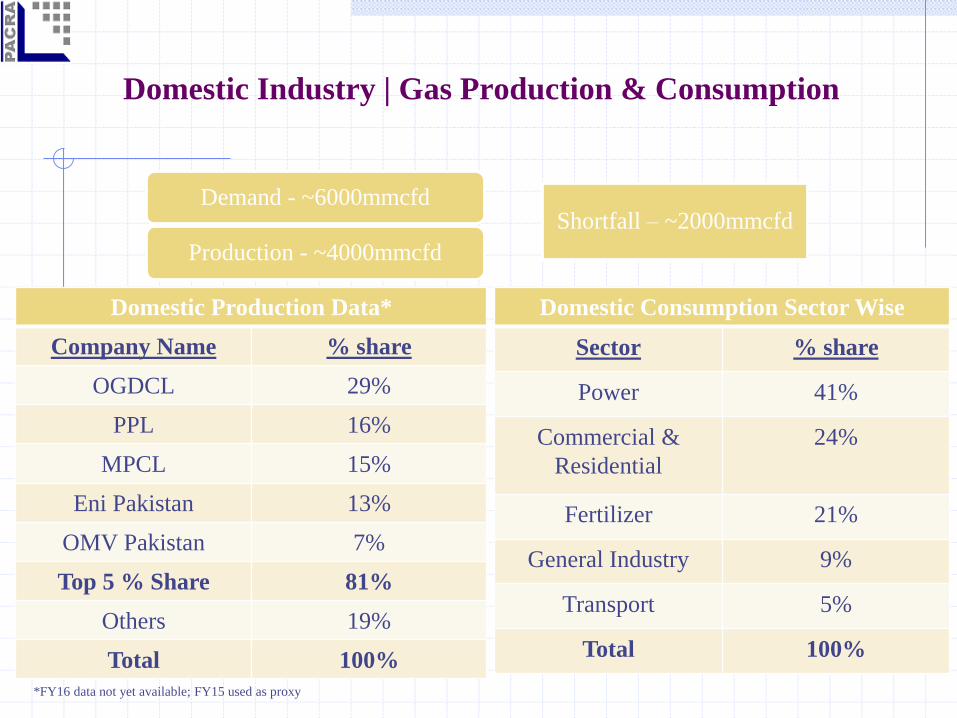
Domestic Industry | Gas Production & Consumption
Demand - ~6000mmcfd
Production - ~4000mmcfd
Shortfall – ~2000mmcfd
Domestic Consumption Sector Wise
Sector % share
Power 41%
Commercial &
Residential
24%
Fertilizer 21%
General Industry 9%
Transport 5%
Total 100%
Domestic Production Data*
Company Name % share
OGDCL 29%
PPL 16%
MPCL 15%
Eni Pakistan 13%
OMV Pakistan 7%
Top 5 % Share 81%
Others 19%
Total 100%
*FY16 data not yet available; FY15 used as proxy
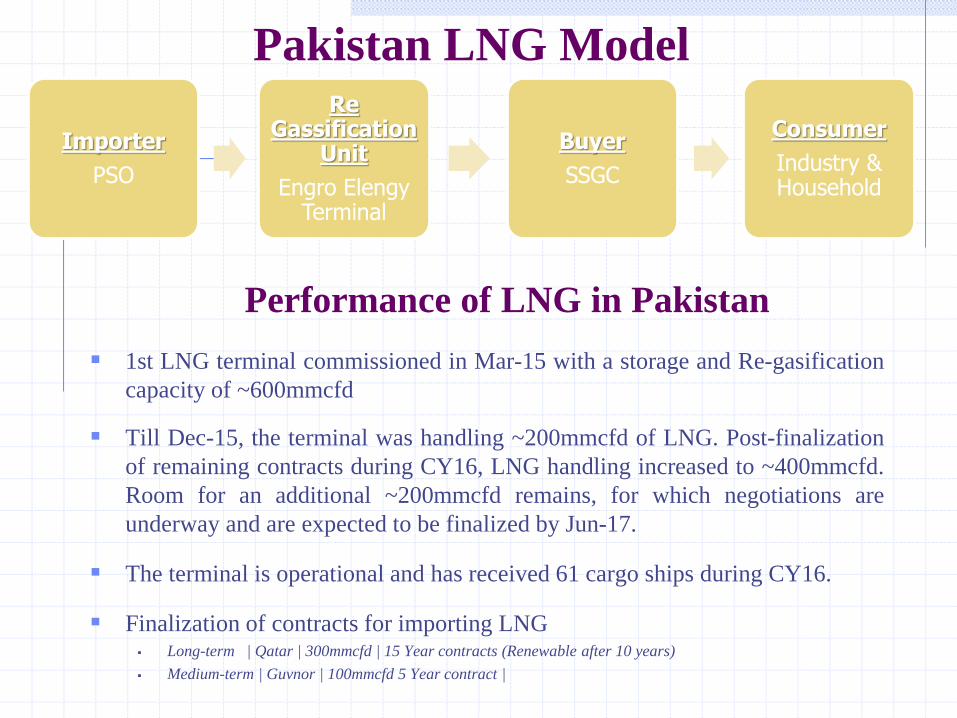
Pakistan LNG Model
Importer
PSO
Re Gassification
Unit
Engro Elengy Terminal
Buyer
SSGC
Consumer
Industry & Household
1st LNG terminal commissioned in Mar-15 with a storage and Re-gasification
capacity of ~600mmcfd
Till Dec-15, the terminal was handling ~200mmcfd of LNG. Post-finalization
of remaining contracts during CY16, LNG handling increased to ~400mmcfd.
Room for an additional ~200mmcfd remains, for which negotiations are
underway and are expected to be finalized by Jun-17.
The terminal is operational and has received 61 cargo ships during CY16.
Finalization of contracts for importing LNG Long-term | Qatar | 300mmcfd | 15 Year contracts (Renewable after 10 years)
Medium-term | Guvnor | 100mmcfd 5 Year contract |
Performance of LNG in Pakistan
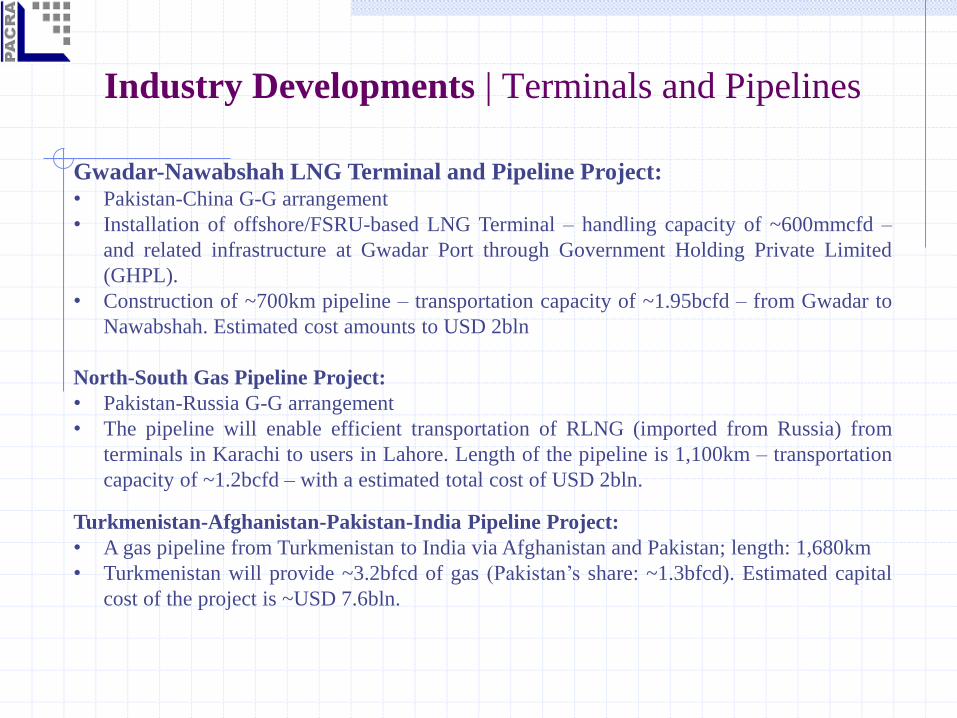
Industry Developments | Terminals and Pipelines
Gwadar-Nawabshah LNG Terminal and Pipeline Project:• Pakistan-China G-G arrangement
• Installation of offshore/FSRU-based LNG Terminal – handling capacity of ~600mmcfd –
and related infrastructure at Gwadar Port through Government Holding Private Limited
(GHPL).
• Construction of ~700km pipeline – transportation capacity of ~1.95bcfd – from Gwadar to
Nawabshah. Estimated cost amounts to USD 2bln
North-South Gas Pipeline Project:
• Pakistan-Russia G-G arrangement
• The pipeline will enable efficient transportation of RLNG (imported from Russia) from
terminals in Karachi to users in Lahore. Length of the pipeline is 1,100km – transportation
capacity of ~1.2bcfd – with a estimated total cost of USD 2bln.
Turkmenistan-Afghanistan-Pakistan-India Pipeline Project:
• A gas pipeline from Turkmenistan to India via Afghanistan and Pakistan; length: 1,680km
• Turkmenistan will provide ~3.2bfcd of gas (Pakistan’s share: ~1.3bfcd). Estimated capital
cost of the project is ~USD 7.6bln.
Industry Developments | Terminals and Pipelines
2nd LNG Terminal (Expected CoD: Jun’17):• Installation of FSRU-based LNG Terminal - handling capacity of ~600mmcfd – and related
infrastructure at Port Qasim
• Constructed by a consortium - Pakistan GasPort Consortium Limited (PGPC) – led by
Pakistan GasPort Limited (PGPL), and including Fauji Oil Terminal and Distribution
Company (FOTCO)
3rd LNG Terminal (Expected CoD: 2HCY18):• Installation of FSRU-based LNG Terminal - handling capacity of ~750mmcfd – and related
infrastructure at Port Qasim. Expected cost is USD 250-300mln
• Project being constructed by Global Energy Infrastructure Limited (GEIL), a Turkish
company former
Industry Developments | Other
Short and Long-Term LNG contracts:• In Jan’17, GoP invited bids for 240 LNG shipments. Post-bidding process, the following are
the results as per lowest bids submitted:
• Medium-term | 5 years | Gunvor | 60 ships | 100mmcfd
• Long-term | 15 years | ENI | 180 ships | 100mmcfd
Currently only Gunvor has been awarded its contract, whereas ENI’s offer has not yet been
accepted on grounds of high offer price.
Pakistan LNG Limited (PLL) and Pakistan LNG Terminal Limited (PLTL):• PLL & PLTL are state-owned companies and subsidiaries of Government Holdings
(Private) Limited (GHPL).
• PLL is mandated by GoP to procure LNG from international markets and enter into onward
arrangements for supply of gas to the end user. PLTL has been established to manage and
procure LNG storage and regasification service.
• Both companies are currently incorporated and operational.
Challenges for LNG in Pakistan
The end consumer for the use of LNG has not yet been finalized.
Pricing mechanism for commercial and households use of LNG is yet
not clear.
The emergence of circular debt may hamper the continuity of smooth
operations.
Bibliography
1. 2017 World LNG Report | www.igu.org/publications
2. BP Statistical Review of World Energy June 2016 | www.bp.com
3. State of the Regulated Petroleum Industry 2015-16 | www.ogra.org.pk
4. US Energy Information Agency (EIA)
5. Impact of US LNG exports on Europe | www.energymining.org
6. Engro Elengy Terminal (Private) Limited
Analysts Haider Imran
Senior Financial Analyst
+92 42 3586 9504
Rai Umar Zafar
Senior Manager Ratings
+92 42 3586 9504
DISCLAIMERPACRA has used due care in preparation of this document. Our information has been obtained
from sources we consider to be reliable but its accuracy or completeness is not guaranteed.
The information in this document may be copied or otherwise reproduced, in whole or in part,
provided the source is duly acknowledged. The presentation should not be relied upon as
professional advice.