Embed Size (px)
Citation preview
1
LIQUID TELECOMMUNICATIONS HOLDINGS LIMITED
FINANCIAL RESULTS FOR THE FOURTH QUARTER AND YEAR ENDED 28 FEBRUARY 2019
Continued progress despite challenging economic conditions
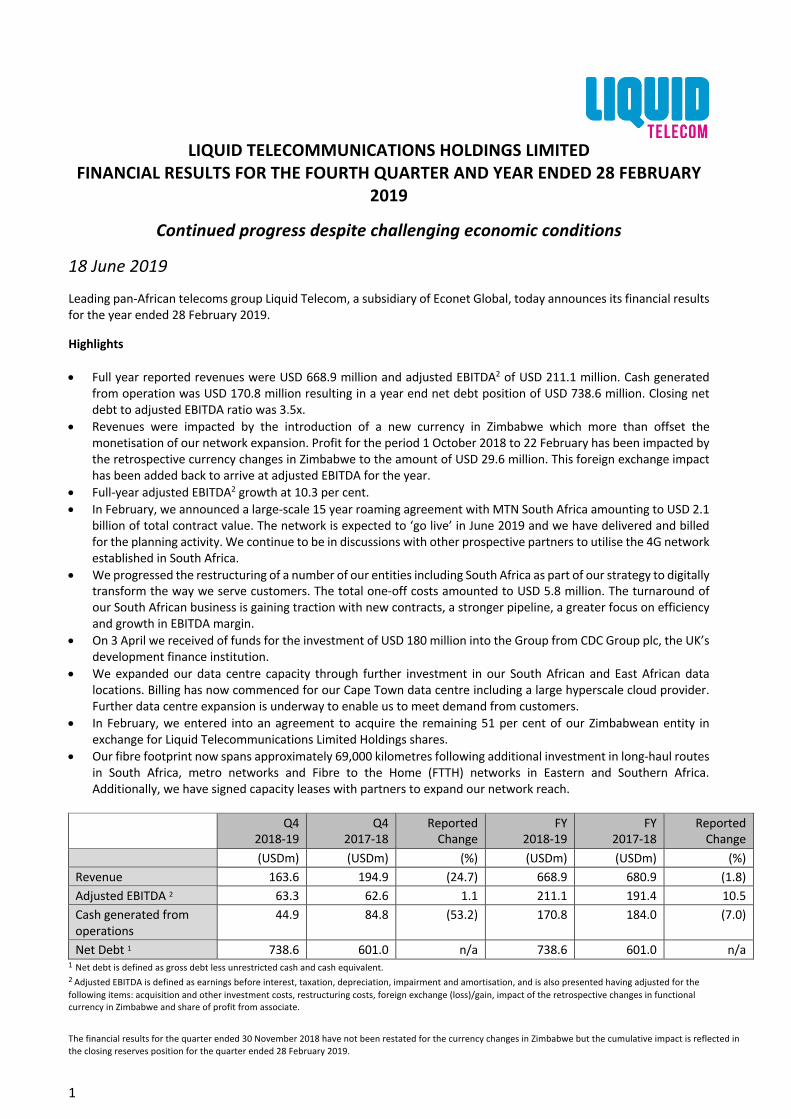
18 June 2019 Leading pan-African telecoms group Liquid Telecom, a subsidiary of Econet Global, today announces its financial results for the year ended 28 February 2019. Highlights • Full year reported revenues were USD 668.9 million and adjusted EBITDA2 of USD 211.1 million. Cash generated
from operation was USD 170.8 million resulting in a year end net debt position of USD 738.6 million. Closing net debt to adjusted EBITDA ratio was 3.5x.
• Revenues were impacted by the introduction of a new currency in Zimbabwe which more than offset the monetisation of our network expansion. Profit for the period 1 October 2018 to 22 February has been impacted by the retrospective currency changes in Zimbabwe to the amount of USD 29.6 million. This foreign exchange impact has been added back to arrive at adjusted EBITDA for the year.
• Full-year adjusted EBITDA2 growth at 10.3 per cent. • In February, we announced a large-scale 15 year roaming agreement with MTN South Africa amounting to USD 2.1
billion of total contract value. The network is expected to ‘go live’ in June 2019 and we have delivered and billed for the planning activity. We continue to be in discussions with other prospective partners to utilise the 4G network established in South Africa.
• We progressed the restructuring of a number of our entities including South Africa as part of our strategy to digitally transform the way we serve customers. The total one-off costs amounted to USD 5.8 million. The turnaround of our South African business is gaining traction with new contracts, a stronger pipeline, a greater focus on efficiency and growth in EBITDA margin.
• On 3 April we received of funds for the investment of USD 180 million into the Group from CDC Group plc, the UK’s development finance institution.
• We expanded our data centre capacity through further investment in our South African and East African data locations. Billing has now commenced for our Cape Town data centre including a large hyperscale cloud provider. Further data centre expansion is underway to enable us to meet demand from customers.
• In February, we entered into an agreement to acquire the remaining 51 per cent of our Zimbabwean entity in exchange for Liquid Telecommunications Limited Holdings shares.
• Our fibre footprint now spans approximately 69,000 kilometres following additional investment in long-haul routes in South Africa, metro networks and Fibre to the Home (FTTH) networks in Eastern and Southern Africa. Additionally, we have signed capacity leases with partners to expand our network reach.
Q4
2018-19 Q4
2017-18 Reported
Change FY
2018-19 FY
2017-18 Reported
Change (USDm) (USDm) (%) (USDm) (USDm) (%) Revenue 163.6 194.9 (24.7) 668.9 680.9 (1.8) Adjusted EBITDA 2 63.3 62.6 1.1 211.1 191.4 10.5 Cash generated from operations
44.9 84.8 (53.2) 170.8 184.0 (7.0)
Net Debt 1 738.6 601.0 n/a 738.6 601.0 n/a 1 Net debt is defined as gross debt less unrestricted cash and cash equivalent. 2 Adjusted EBITDA is defined as earnings before interest, taxation, depreciation, impairment and amortisation, and is also presented having adjusted for the following items: acquisition and other investment costs, restructuring costs, foreign exchange (loss)/gain, impact of the retrospective changes in functional currency in Zimbabwe and share of profit from associate.
The financial results for the quarter ended 30 November 2018 have not been restated for the currency changes in Zimbabwe but the cumulative impact is reflected in the closing reserves position for the quarter ended 28 February 2019.
2
Chief Executive Officer, Nic Rudnick, commented: “Our progress during the year has continued to be positive as we implement our corporate strategy to monetise the networks we have established and further develop the Group as a connectivity and cloud solutions provider across our footprint. Through the year we have continued to expand our fibre footprint as we increase our backbone coverage, connect more sites for Mobile Network Operators (MNOs), SMEs and government buildings and reach more retail customers through our FTTH and fixed Long Term Evolution (LTE) network coverage. Our cross-border network remains a significant competitive advantage for us. Additionally, at the beginning of the year we formally communicated our strategy to digitally transform ourselves and help our customers do the same. This will further strengthen our relationships with enterprise and wholesale customers through access to third-party cloud services with our data centre infrastructure as the foundations on which this offering is built. This action has involved some restructuring in order to decrease our cost base and develop our IT system capability to make us even more relevant and effective for our customers as they embark on their own digital journeys. I expect this transformation to continue over the course of the next couple of years. Following the announcement of a new currency policy by the central bank of Zimbabwe in February 2019, we have adjusted for the introduction of the dual-currency regime in Zimbabwe which has affected our historical cash and earnings. However, despite this we expect to be able to mitigate a reasonable proportion of the impact going forwards by increasing prices to our customers. We have a strong market position and provide essential services, so the demand drivers remain. We increased our prices in April 2019 to reflect the new exchange rate at that time and we expect to increase prices again on an ongoing basis until such time as the situation normalises. I am pleased that we have delivered the expansion of the South Africa Data Centre business. Data centres are a significant growth area for Liquid and further large contracts are in the pipeline. The African Data Centre business will be a real focus for the Group in the coming year as the infrastructure for our cloud services offering and serve our hyperscale cloud and hosting customers. In the forthcoming year our investment in data centres will grow. We are therefore assessing the possibility of appropriate forms of financing in order to quicken the pace of our growth in this area, recognising the longer investment cycle and different capital structures required for data centres. Furthermore, our digital services offering has expanded across our platform, including the installation and delivery of our unified communications service and Microsoft cloud products, such as Azure, in several of our territories. In conclusion, we are not only transforming our offering, but also evolving the way in which we engage with our employees and customers, ensuring that our digital transformation will automate many of our internal processes and our interaction with our customers. Even though we are in the early stages of our development progress has been realised as we deepen the foundations for our growth. I am confident that both the Group and operational management teams have the knowledge, resources and skills to deliver on our vision.” Group Executive Chairman, Strive Masiyiwa, added: “On behalf of the Board, I was pleased with the overall development of the Group against challenging economic conditions and the way in which we continued to deliver our vision of ‘Building Africa’s Digital Future’. Through the year, I have been delighted with the businesses agility to develop further relationships such as in Egypt, where we signed a Memorandum of Understanding with Telecom Egypt to build data centres having connected Cape to Cairo via a terrestrial fibre route. The next step is to connect our customers from East to West, on-net to the Cloud and continue to deliver the vision I first set out in 2004. Despite currency headwinds, the Group is making progress in growing the business by winning of a number of large scale contracts and we have seen a very pleasing take up of data centre space. We continue to see sizable demand in this area which has resulted in the need for further expansion to meet hyperscale customer growth plans. The investment of USD 180 million by CDC Group plc was another historic moment for Liquid Telecom showing the support from a distinguished investment house for a long-term growth business, which we are developing year after year towards the realisation of our vision. The Board continues to consider further strategic options for raising capital in order to provide additional funding to accelerate the Group’s growth plans; building on our continued progress, the consistent delivery of our clear corporate strategy will cement our competitive advantage as we continue to build Africa’s digital future.“
3
There will be an investor call at 14:00 BST in order to present the results and answer questions. Please register on our website to gain access to the details for the call. (Note: these will only be provided to current and prospective approved investors, loan providers and rating agencies) For further information please contact: Liquid Telecom: Matthew Hickman, Head of Investor Relations, +44 (0) 20 7101 6100 FTI Consulting: Charles Palmer, +44 (0) 20 3727 1000 Adam Davidson, +44 (0) 20 3727 1000 About Liquid Telecom Liquid Telecom is a leading communications solutions provider across 13 countries primarily in Eastern, Central and Southern Africa that serves mobile operators, carriers, enterprise, media and content companies and retail customers with high-speed, reliable connectivity, hosting and co-location and digital services. It has built Africa’s largest independent fibre network, approaching 70,000km, and operates state-of-the-art data centres in Johannesburg, Cape Town and Nairobi, with a combined potential 19,000 square metres of rack space and 80 MW of power. This is in addition to offering leading cloud-based services, such as Microsoft Office365 and Microsoft Azure across our fibre footprint. Through this combined offering Liquid Telecom is enhancing customers’ experience on their digital journey. For more information, visit www.liquidtelecom.com
- Ends –
4
OPERATIONAL AND FINANCIAL REVIEW Liquid Telecom is a leading communications solutions provider across 13 countries primarily in Eastern, Southern and South Africa that serves carrier, enterprise and retail customers with high-speed, reliable connectivity and digital services. We have built Africa’s largest independent fibre network, approaching 70,000km, and operate state-of-the-art data centres in Johannesburg, Cape Town and Nairobi and Kigali, with a combined potential capacity of over 6,000 racks. The Group reports in four segments: Wholesale Data, Enterprise, Retail and Wholesale Voice. Wholesale data Our Wholesale Data division provides Global IP Transit and fibre connectivity to 2G, 3G and 4G mobile base stations across our extensive independent and self-owned fibre network and international leased lines. We cover a wide range of customers from international carriers to African mobile and public telecom operators and African Internet Service Providers (ISPs). We also help other ISPs reach more customers with attractive offers using our wholesale FTTH services, monetising our open-access fibre network. In addition, we provide wholesale cloud and colocation services and we are a tier 2 supplier for Microsoft cloud services across Africa. In addition, we provide services to MNOs where they can roam across our network. Enterprise Our Enterprise segment provides solutions to large-scale corporate and governmental consumers of bandwidth with complex, multi-country connectivity, co-location and hosting and cloud services. Here, in partnering with leading software, content and ISPs to package business service offerings, supported by our fibre local access networks and data centre facilities, we provide high-speed broadband, cloud and co-location services, VoIP and global connectivity to small and medium sized enterprises and non-governmental organizations, as well as payment solutions to financial institutions through our Liquid Payments business. We also aim to expand our metro and “Fibre to the Business” (FTTB) networks with a view to driving multi-tenancy growth in the buildings enabled to use the fibre network. Complementary VSAT and fixed-wireless (point-to-point or point-to-multipoint) networks extend the reach of the network to connect remote locations. Retail Our Retail business connects households and small businesses through the provision of our FTTH through GPON and Fixed Wireless Access (FWA), primarily using 4G LTE technology. We believe that both FTTH and FWA, using our own infrastructure deployed in carefully selected areas, represents an important development opportunity for retail revenue growth with a focus on increasing our market share in the middle and top ends of the broadband internet service segment. Our retail customers now have access to a range of digital services (Office365, Azure and laptop backups) and the Kwesé TV platform content across our network. Wholesale Voice We provide connectivity via fibre and satellite, in the voice market, into and out of Africa to national and international operators in addition to African mobile network operators. Many destinations in Africa still offer regulated prices set at levels where margins are attractive for international voice carriers. Our ability to carry voice traffic on our own fibre network from international interconnection points for our customers to the nearest point of interconnection with local voice service providers, is a major differentiator in an otherwise commoditised market place. In doing so, we are able to control the routing of the voice traffic, deliver high quality calls, avoid fraud schemes that are prevalent on the international voice transit market and provide a stable and reliable service for our customers.
5
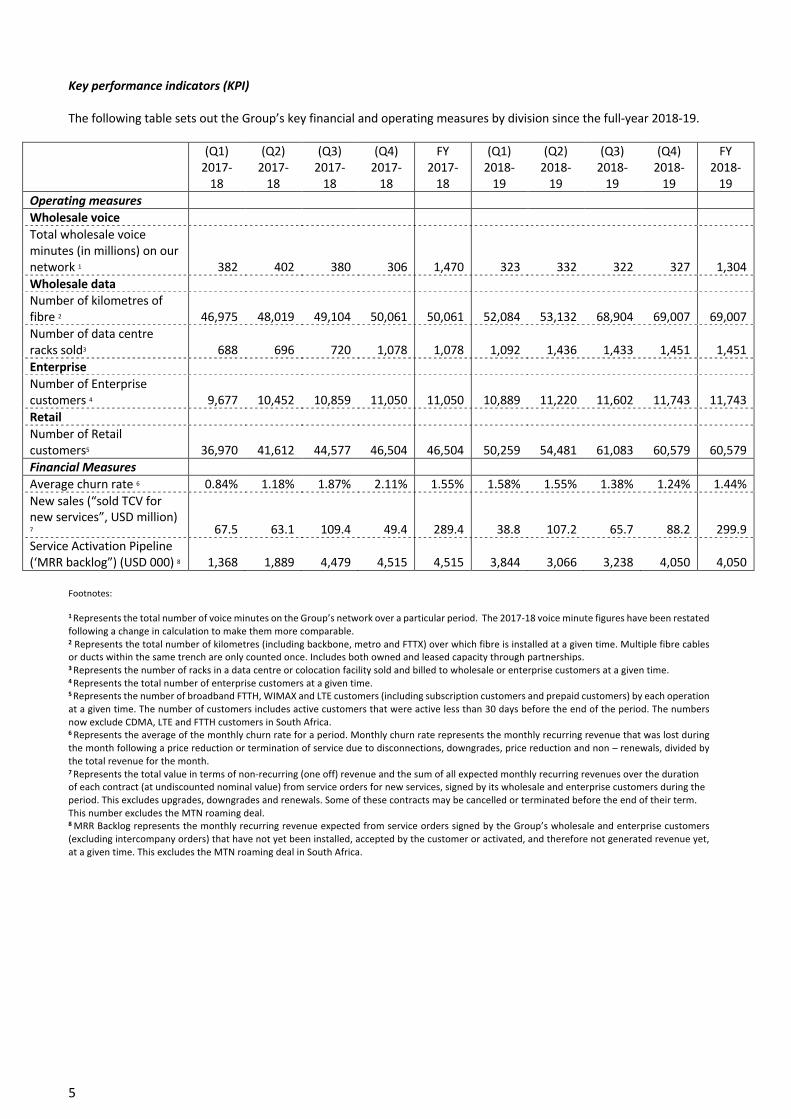
Key performance indicators (KPI) The following table sets out the Group’s key financial and operating measures by division since the full-year 2018-19.
(Q1) 2017-
18
(Q2) 2017-
18
(Q3) 2017-
18
(Q4) 2017-
18
FY 2017-
18
(Q1) 2018-
19
(Q2) 2018-
19
(Q3) 2018-
19
(Q4) 2018-
19
FY 2018-
19 Operating measures Wholesale voice Total wholesale voice minutes (in millions) on our network 1 382 402 380 306 1,470 323 332 322
327
1,304 Wholesale data Number of kilometres of fibre 2 46,975 48,019 49,104 50,061 50,061 52,084 53,132 68,904 69,007 69,007 Number of data centre racks sold3 688 696 720 1,078 1,078 1,092 1,436 1,433 1,451 1,451 Enterprise Number of Enterprise customers 4 9,677 10,452 10,859 11,050 11,050 10,889 11,220 11,602 11,743 11,743 Retail Number of Retail customers5 36,970 41,612 44,577 46,504 46,504 50,259 54,481 61,083 60,579 60,579 Financial Measures Average churn rate 6 0.84% 1.18% 1.87% 2.11% 1.55% 1.58% 1.55% 1.38% 1.24% 1.44% New sales (“sold TCV for new services”, USD million) 7 67.5 63.1 109.4 49.4 289.4 38.8 107.2 65.7
88.2
299.9
Service Activation Pipeline (‘MRR backlog”) (USD 000) 8 1,368 1,889 4,479 4,515 4,515 3,844 3,066 3,238
4,050
4,050
Footnotes: 1 Represents the total number of voice minutes on the Group’s network over a particular period. The 2017-18 voice minute figures have been restated following a change in calculation to make them more comparable. 2 Represents the total number of kilometres (including backbone, metro and FTTX) over which fibre is installed at a given time. Multiple fibre cables or ducts within the same trench are only counted once. Includes both owned and leased capacity through partnerships. 3 Represents the number of racks in a data centre or colocation facility sold and billed to wholesale or enterprise customers at a given time.
4 Represents the total number of enterprise customers at a given time. 5 Represents the number of broadband FTTH, WIMAX and LTE customers (including subscription customers and prepaid customers) by each operation at a given time. The number of customers includes active customers that were active less than 30 days before the end of the period. The numbers now exclude CDMA, LTE and FTTH customers in South Africa. 6 Represents the average of the monthly churn rate for a period. Monthly churn rate represents the monthly recurring revenue that was lost during the month following a price reduction or termination of service due to disconnections, downgrades, price reduction and non – renewals, divided by the total revenue for the month. 7 Represents the total value in terms of non-recurring (one off) revenue and the sum of all expected monthly recurring revenues over the duration of each contract (at undiscounted nominal value) from service orders for new services, signed by its wholesale and enterprise customers during the period. This excludes upgrades, downgrades and renewals. Some of these contracts may be cancelled or terminated before the end of their term. This number excludes the MTN roaming deal.
8 MRR Backlog represents the monthly recurring revenue expected from service orders signed by the Group’s wholesale and enterprise customers (excluding intercompany orders) that have not yet been installed, accepted by the customer or activated, and therefore not generated revenue yet, at a given time. This excludes the MTN roaming deal in South Africa.
6
Wholesale voice minutes remained at similar levels in the fourth quarter versus prior quarters. In the fourth quarter the kilometres of fibre grew slightly as the group reddied for another rollout of a section on its backbone routes in South Africa in the forthcoming quarters. These are usually a significant proportion of the growth in the footprint. In November 2018, to conform with standard industry practice, we changed the way we report the kilometres of our fibre network, which now spans 69,007. The Group has started to expand geographically through partnerships whereby capacity leases are being used to grow the backbone network and this is now included in our network measurement reflecting our actual connectivity capability. The number of data centre racks sold increase by 34.6 per cent during the year as capacity was increased through the building of additional levels at the East Africa Data Centre (EADC) and further development in South Africa. As at 28th February 2019 we continue to have a pipeline of capacity which is available for sale. During the year we secured a total of USD 299.7 million in new total contract value (TCV) compared with a total of USD 289.4 million for the full year 2017-18. These numbers exclude the MTN roaming deal over 15 years amounting to approximately USD 2.1 billion of revenue of which c.USD 13 million was recognised in 2018-19 and c. USD 100 million will be recognised in 2019-20 following the initiation of the use of the network from June 2019. This is likely to be a ten per cent gross margin business. In the fourth quarter and through the year, churn levels decreased relative to the third quarter of 2018-19 and the full year 2017-18 as we began to see the benefits of our renewed focus on customers retention. The service activation pipeline increased from USD 3.2 million per month as at 30 November 2018 to USD 4.1 million (MRR, ”Monthly Recurring Revenue” only) as at 28 February mainly driven by increases in Southern and Eastern Africa as the business saw benefits from the focus on the enterprise customer and development of MRR. Key sales made during the year were:
• MTN roaming deal in South Africa. • IP backhaul and international Multi-Protocol Label Switching (MPLS) and Virtual Private Network (VPN)
connectivity for a large wholesale customer in the Southern region. • 100G connectivity between Jomo Kenyatta International airport and Mombasa in Kenya. • A 10 year IRU with MTN for a 500G link between Mombasa in Kenya and Tororo in Uganda. • Cloud services such as Crashplan, Office365 and Azure sold in conjunction with connectivity to enterprise
customers in all regions. • The provision of multi-site WLAN connectivity and VoIP and managed services for large corporates and regional
governments in South Africa. • Managed connectivity and dark fibre IRUs on key long-haul fibre routes. • 100Gbps backbone connectivity for a large global cloud provider in South Africa. • Dedicated Internet Access (DIA) and national MPLS and VPN connectivity for a number of large financial
institutions, mining locations, universities, media organisations, and retail outlets in the Southern region. • DIA for research organisations, infrastructure groups and MPLS for government organisations in the Eastern
region. • IP transit for a cross border customers. • Co-location and data centre hosting services for mobile operators, global cloud service providers, technology
groups, and financial institutions. • Microsoft ExpressRoute and international VoIP connectivity for a financial services customer and; • IP transit services to mobile operators and other Internet Service Providers (ISP’s) across our footprint and
Microsoft Office365 and Azure subscriptions to corporates.
7
Revenue On 1 October 2018, the Reserve Bank of Zimbabwe (RBZ) directed all banks to ring-fence Nostro Foreign Currency Accounts (FCAs) by separating them into two categories; Nostro FCAs and RTGS FCAs. Authorities maintained that the US Dollar represented in the RTGS system was at a 1:1 exchange ratio. On 20 February 2019, the RBZ announced that with effect from 22 February 2019, the RTGS would be recognised as an official currency and that an interbank foreign exchange market would be established to formalise trading in RTGS balances with other currencies. The official rate on launch was 2.5:1. We have now determined that the recognised date for a change in functional currency in Zimbabwe should be 1 October 2018. The Group has thus restated all balances to RTGS at a rate of RTGS:USD 2.5:1 at 1 October 2018 and recognised a foreign exchange loss on net assets that did not hold their value. In addition, all transactions from 1 October 2018 have been recognised at RTGS:USD 2.5:1 through to 28 February 2019. The statement of financial position has been translated back to USD at an exchange rate of 2.5:1 at 28 February 2019. The statement of profit and loss has been translated at a rate of RTGS:USD 1:1 for the period 1 March 2018 to 30 September 2018. The currency impact for the period after announcement, from 22 February to 28 February 2019, has been reflected in the accounts. The retrospective impact of the introduction of the Zimbabwe currency from 1 October 2018 to 22 February was USD 42.4 million on Revenue and USD 26.7 million on Operating Profit. We adopted IFRS 15 (“Revenue from contracts with customers”) from 1 March 2018 which resulted in the Group amortising its non-recurring revenue over the life of the contract. This has resulted in a USD 7.9 million retrospective adjustment to our opening reserves, within equity, and an increase in our deferred revenue brought forward of USD 7.9 million. There is no material impact on the income statement. In addition, IFRS 9 was implemented as of 1 March 2018 of which the impact was minimal. We are continuing to assess the impact of IFRS 16 (“Leases”) which was adopted by the Group on 1 March 2019 and will be reflected in the first quarter of 2019-20.
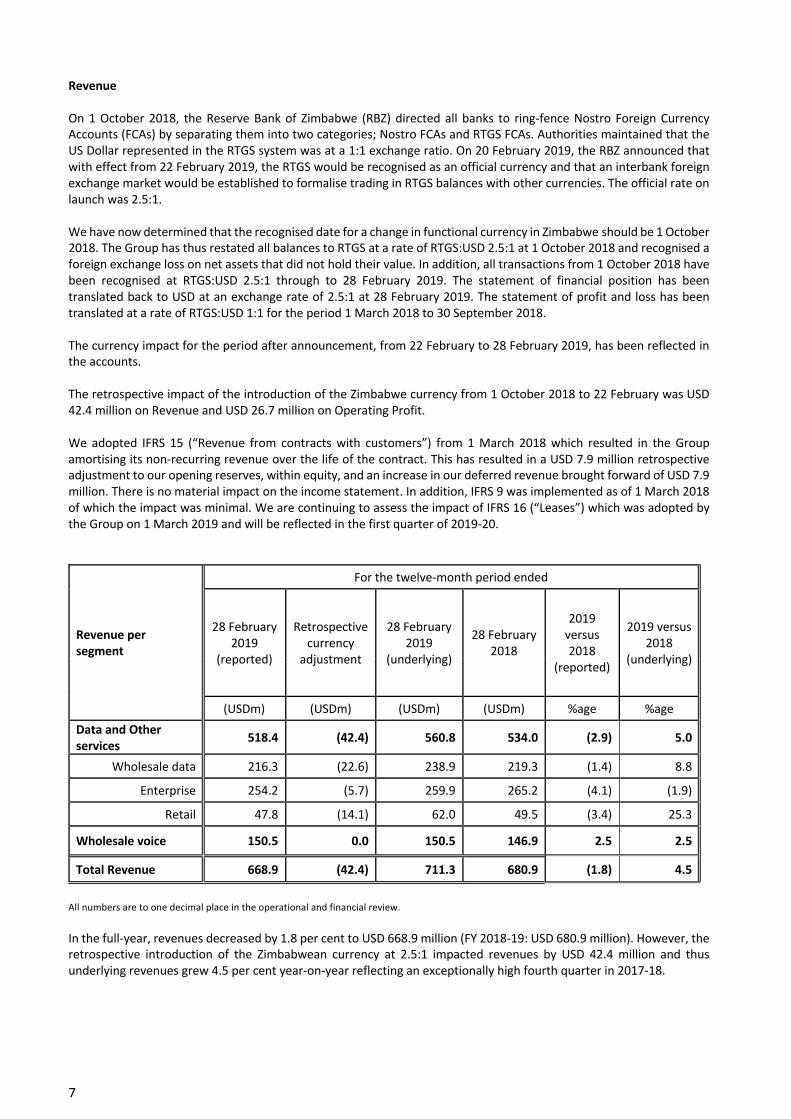
Revenue per segment
For the twelve-month period ended
28 February 2019
(reported)
Retrospective currency
adjustment
28 February 2019
(underlying)
28 February 2018
2019 versus 2018
(reported)
2019 versus 2018
(underlying)
(USDm) (USDm) (USDm) (USDm) %age %age Data and Other services 518.4 (42.4) 560.8 534.0 (2.9) 5.0
Wholesale data 216.3 (22.6) 238.9 219.3 (1.4) 8.8
Enterprise 254.2 (5.7) 259.9 265.2 (4.1) (1.9)
Retail 47.8 (14.1) 62.0 49.5 (3.4) 25.3
Wholesale voice 150.5 0.0 150.5 146.9 2.5 2.5
Total Revenue 668.9 (42.4) 711.3 680.9 (1.8) 4.5
All numbers are to one decimal place in the operational and financial review. In the full-year, revenues decreased by 1.8 per cent to USD 668.9 million (FY 2018-19: USD 680.9 million). However, the retrospective introduction of the Zimbabwean currency at 2.5:1 impacted revenues by USD 42.4 million and thus underlying revenues grew 4.5 per cent year-on-year reflecting an exceptionally high fourth quarter in 2017-18.
8
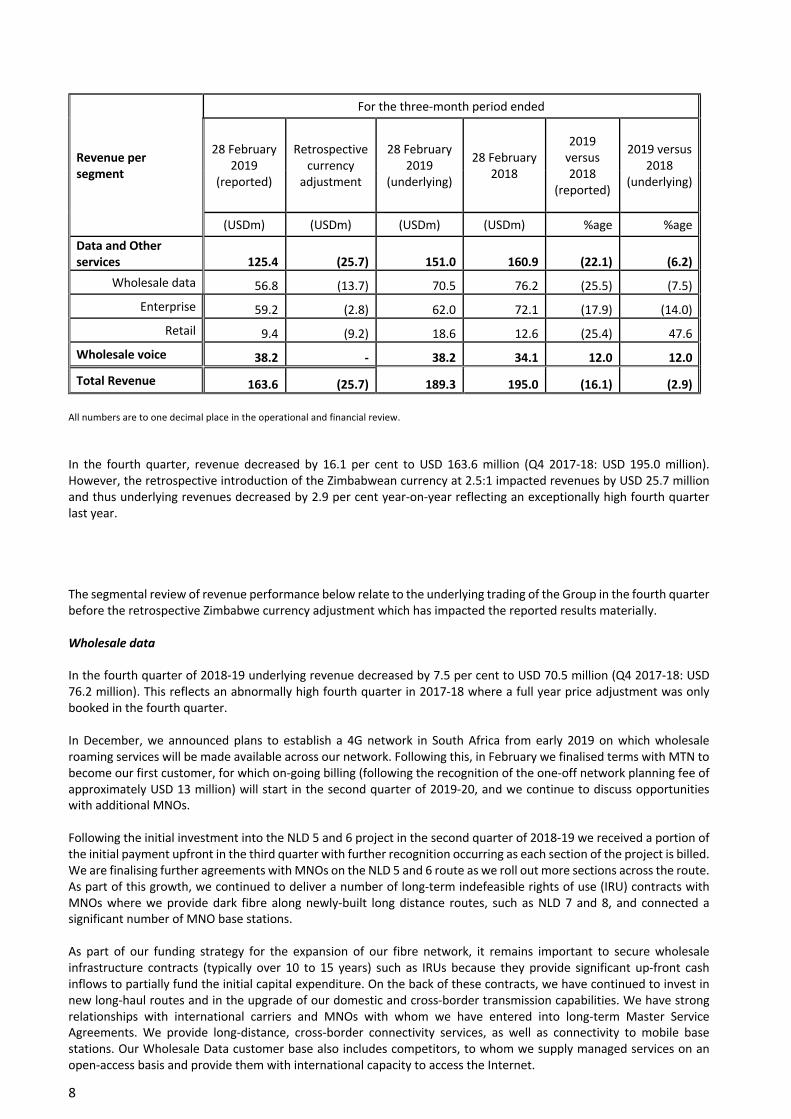
Revenue per segment
For the three-month period ended
28 February 2019
(reported)
Retrospective currency
adjustment
28 February 2019
(underlying)
28 February 2018
2019 versus 2018
(reported)
2019 versus 2018
(underlying)
(USDm) (USDm) (USDm) (USDm) %age %age Data and Other services 125.4 (25.7) 151.0 160.9 (22.1) (6.2)
Wholesale data 56.8 (13.7) 70.5 76.2 (25.5) (7.5) Enterprise 59.2 (2.8) 62.0 72.1 (17.9) (14.0)
Retail 9.4 (9.2) 18.6 12.6 (25.4) 47.6 Wholesale voice 38.2 - 38.2 34.1 12.0 12.0
Total Revenue 163.6 (25.7) 189.3 195.0 (16.1) (2.9) All numbers are to one decimal place in the operational and financial review. In the fourth quarter, revenue decreased by 16.1 per cent to USD 163.6 million (Q4 2017-18: USD 195.0 million). However, the retrospective introduction of the Zimbabwean currency at 2.5:1 impacted revenues by USD 25.7 million and thus underlying revenues decreased by 2.9 per cent year-on-year reflecting an exceptionally high fourth quarter last year. The segmental review of revenue performance below relate to the underlying trading of the Group in the fourth quarter before the retrospective Zimbabwe currency adjustment which has impacted the reported results materially. Wholesale data In the fourth quarter of 2018-19 underlying revenue decreased by 7.5 per cent to USD 70.5 million (Q4 2017-18: USD 76.2 million). This reflects an abnormally high fourth quarter in 2017-18 where a full year price adjustment was only booked in the fourth quarter. In December, we announced plans to establish a 4G network in South Africa from early 2019 on which wholesale roaming services will be made available across our network. Following this, in February we finalised terms with MTN to become our first customer, for which on-going billing (following the recognition of the one-off network planning fee of approximately USD 13 million) will start in the second quarter of 2019-20, and we continue to discuss opportunities with additional MNOs. Following the initial investment into the NLD 5 and 6 project in the second quarter of 2018-19 we received a portion of the initial payment upfront in the third quarter with further recognition occurring as each section of the project is billed. We are finalising further agreements with MNOs on the NLD 5 and 6 route as we roll out more sections across the route. As part of this growth, we continued to deliver a number of long-term indefeasible rights of use (IRU) contracts with MNOs where we provide dark fibre along newly-built long distance routes, such as NLD 7 and 8, and connected a significant number of MNO base stations. As part of our funding strategy for the expansion of our fibre network, it remains important to secure wholesale infrastructure contracts (typically over 10 to 15 years) such as IRUs because they provide significant up-front cash inflows to partially fund the initial capital expenditure. On the back of these contracts, we have continued to invest in new long-haul routes and in the upgrade of our domestic and cross-border transmission capabilities. We have strong relationships with international carriers and MNOs with whom we have entered into long-term Master Service Agreements. We provide long-distance, cross-border connectivity services, as well as connectivity to mobile base stations. Our Wholesale Data customer base also includes competitors, to whom we supply managed services on an open-access basis and provide them with international capacity to access the Internet.
9
Wholesale co-location and hosting services revenues grew significantly particularly in South Africa and our Eastern region, leading to investment in additional floor space in our data centre in Kenya. We will be adding 160 racks to the East Africa Data Centre in Nairobi in the near future. In South Africa, we are continuing to build more space. The extension of the data centres in both Johannesburg and Cape Town for one of the largest global cloud providers continues to progress well with handover of the Johannesburg facility achieved in December 2017 and Cape Town in October 2018. We started billing for our Cape Town data centre in November 2018. In total we have a potential capacity of more than 6,000 racks and a future potential of 80.5 MegaWatts (MW) available power across our footprint. In November, we were recognised for the completion of the connection between Cape Town and Cairo at the AfricaCom Awards for the Best Network Improvement. The network is the first direct land-based communication link between Cape Town in South Africa and Cairo in Egypt and has already been recognised at a number of other award ceremonies this year. Enterprise In the fourth quarter of 2018-19 underlying revenues decreased by 14.0 per cent to USD 62.0 million (Q4 2017-18: USD 72.1 million). The lower growth in the fourth quarter relative to prior period is due to challenging markets in South Africa where there were delays in a couple of key government contracts which have now been resolved accompanied with the impact of churn which led to less MRR in the period, an abnormally high prior year comparator which included some significant one-off revenue from a large customer and a full year and fourth quarter year-on-year impact of the Rand of USD 5 million. This was partially mitigated by consistently strong growth in the Eastern region where churn has been low and monthly recurring revenue increasing. By the end of the fourth quarter, the number of enterprise customers increased to 11,743 customers (Q3 2018-19: 11,602; FY 2017-18: 11,050 customers) primarily through a number of wins in the medium-sized enterprise market in the Eastern region. Following the announcement of our digital transformation strategy we continue to expect that our renewed focus on enterprise customers will deliver growth in the coming quarters notably through monthly recurring revenue. Large governmental and non-governmental agencies rely on our transmission backbone and digital service capabilities to implement critical services to businesses and citizens. The largest contracts this quarter came from government entities and financial sector corporates, for connectivity, VoIP and data centre co-location services, and other multinational corporate accounts. We agreed a number of contracts to provide connectivity to the largest universities, government agencies, entertainment and transportation industries. In November, we announced the availability of Microsoft Azure Stack from Cape to Cairo, as we continue to build on cloud services adoption across our platform whilst leveraging our pan-African fibre network and data centre capabilities. Liquid Telecom now offers Azure Stack services directly to businesses operating in our Southern and Eastern regions with minimised network latency. The launch marks the first time that the Azure Stack platform will be available locally in all these markets, offering businesses greater flexibility, security and cost savings by deploying hybrid cloud architecture. Retail For the fourth quarter underlying revenue increased by 47.6 per cent to USD 18.6 million (Q4 2017-18: USD 12.6 million). This was driven by increased service up-take of the FTTH service across our footprint, price increases in Zimbabwe and from our new fixed wireless LTE broadband services, partially offset by a reduction in CDMA customers in South Africa. Retail customers fell during the fourth quarter by 0.8 per cent to 60,579 but rose 30.3 per cent during the year. This follows strong progress in all countries throughout the year however, in the fourth quarter Zimbabwe fixed LTE customers decreased as price increases and currency fluctuations through the quarter impacted affordability for retail customers. Our CDMA business in South Africa is a legacy business from the acquisition of Neotel in February 2017. We have removed these volumes, following their transfer to another supplier, from our retail customer key performance indicator and the numbers now better represent the volumes of the underlying FTTH and LTE businesses. Prior periods have been adjusted.
10
New FTTH customers, have driven service penetration growth over the year (as a percentage of premises passed), with an average 38.6 per cent of premises passed (Q3 2018-19: 42.3 per cent, Q4 2017-18: 34.6 per cent). Add-on services, such as discounted night-time packages and competitive pricing have contributed to strong commercial performance in terms of rapid customer acquisition, low churn and stable average revenue per customer. Every month we see customers upgrading from entry-level, capped FTTH packages to our unlimited, premium packages, helping sustain a higher average average revenue per user over time. This has continued throughout the year. FTTH networks were expanded in new locations such as Harare and Mutare (Zimbabwe), Lusaka (Zambia) and Kigali (Rwanda) this year. We are expanding the coverage of our LTE fixed wireless broadband network in several cities to address a larger share of the broadband market, following strong demand for our services. In the fourth quarter the number of fixed LTE customers, outside of Zimbabwe, continues to increase driven by an aggressive commercial effort and the deployment of base stations. We also introduced new broadband data bundles from our FTTH packages. Wholesale voice In the fourth quarter of 2018-19 revenue increased by 12.0 per cent to USD 38.2 million as compared with the same period last financial year (Q4 2017-18: USD 34.1 million). Total volume of minutes for the quarter increased by 6.9 per cent to 327.2 million minutes (Q4 2017-18: 306.0 million minutes) with average revenue per minute increasing by 5.4 per cent to 11.7 US cents (Q4 2017-18: 11.1 US cents). The increase in minutes and increase in the average revenue per minute follows a reduction in the trading of minutes to low revenue per minute destinations such as USA partially offset by increases in higher revenue per minute traffic terminating to destinations like Niger, Nigeria, UAE and Saudi Arabia. This traffic came as a result of very competitive rate offerings from our African partners where Liquid Telecom has proven its ability to leverage its strong cross-border presence in the wholesale market and aggregate traffic in the retail market in order to deliver directly to the respective African networks leading to sustained voice margins.
11
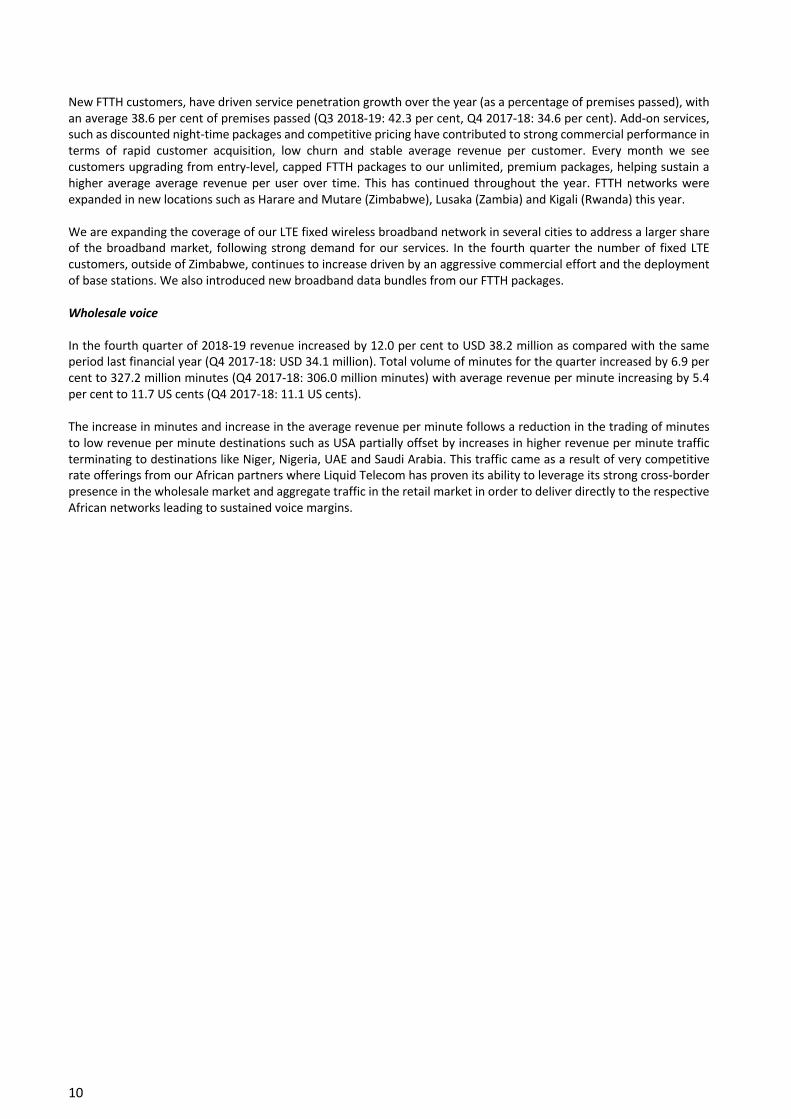
Gross profit
Gross Profit
For the twelve-month period ended
28 February 2019
(reported)
Retrospective currency
adjustment
28 February 2019
(underlying)
28 February 2018
2019 versus 2018
(reported)
2019 versus 2018
(underlying)
(USDm) (USDm) (USDm) (USDm) % %
Gross Profit 415.8 34.9 450.7 426.8 (2.6) 5.6 Gross Profit Margin (%) 62.2 n/a 63.4 62.7 (0.5)pp 0.7pp
In full-year 2018-19, reported gross profit decreased by 2.6 per cent to USD 415.8 million (FY 2017-18: 426.8) as a result of the retrospective Zimbabwe currency adjustment. However, on an underlying basis gross profit increased 5.6 per cent driven by underlying revenue growth and operating leverage.
Gross Profit
For the three-month period ended
28 February 2019
(reported)
Retrospective currency
adjustment
28 February 2019
(underlying)
28 February 2018
2019 versus 2018
(reported)
2019 versus 2018
(underlying)
(USDm) (USDm) (USDm) (USDm) % %
Gross Profit 102.9 20.9 123.8 133.3 (22.8) (7.1) Gross Profit Margin (%) 62.9 n/a 65.4 68.4 (5.5)pp (3.0)pp
In the fourth quarter gross profit decreased by 22.8 per cent to 102.9 (Q4 2017-18: USD 133.3 million). However, the underlying gross profit decreased 7.1 per cent to 123.8 million (Q4 2017-18: USD 133.3 million) largely reflecting the abnormally high fourth quarter billing in Wholesale Data in the prior year. We continue to focus on our strategy of expanding the fibre footprint, broadening the product portfolio, monetising our spectrum assets and digital transformation of us and our customers. It is this diversified business model which has helped maintain our competitiveness within the wholesale data space and going forward, further into the Enterprise segment.
12
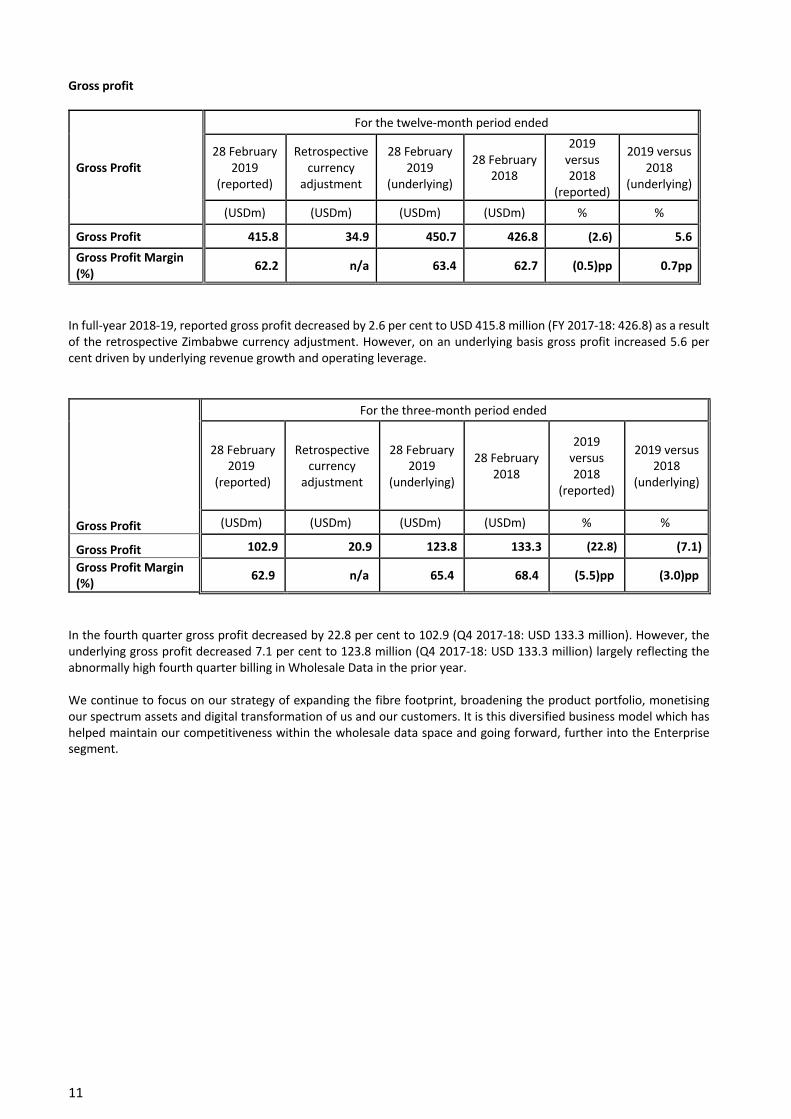
Total overheads and other income
Total Overheads and Other Income
For the twelve-month period ended
28 February 2019
(reported)
Retrospective currency
adjustment
28 February 2019
(underlying)
28 February 2018
2019 versus 2018
(reported)
2019 versus 2018
(underlying)
(USDm) (USDm) (USDm) (USDm) % %
Other income 1.8 0.1 1.9 1.3 38.5 46.2
Dividend received 0.6 0.0 0.6 - n/a n/a
Selling, distribution and marketing costs (18.8) 0.4 (18.4) (19.3) (2.6) (4.7)
Administrative costs (102.5) (2.4) (104.9) (102.7) (0.2) 2.1
Staff costs (115.4) (3.4) (118.8) (114.9) 0.4 3.4
Total overheads and Other income (234.3) (5.3) (239.6) (235.6) (0.6) 1.7
% to Total Revenue (35.0) n/a (33.7) (34.6) n/a n/a
In full-year 2018-19, reported overheads and other income decreased by 0.6 per cent to USD 234.3 million (FY 2017-18: USD 235.6 million). However, on an underlying basis overheads and other income increased 1.7 per cent year-on-year largely due to pay inflation partially offset by lower staff numbers.
Total Overheads and Other Income
For the three-month period ended
28 February 2019
(reported)
Retrospective currency
adjustment
28 February 2019
(underlying)
28 February 2018
2019 versus 2018
(reported)
2019 versus 2018
(underlying)
(USDm) (USDm) (USDm) (USDm) % %
Other income 1.3 0.1 1.4 0.6 110.3 126.3 Selling, distribution and marketing costs (7.6) 0.2 (7.4) (9.9) (23.3) (25.4) Administrative costs (24.6) (1.1) (25.7) (29.9) (17.7) (14.1) Staff costs (26.7) (2.1) (28.8) (31.5) (15.4) (8.6)
Total overheads and Other income (57.6) 2.9 (60.5) (70.7) (18.6) (14.4) % to Total Revenue (35.2) n/a (32.0) (36.3) n/a n/a
In the fourth quarter total reported overheads and other income decreased by 18.6 per cent to USD 57.6 million (Q4 2017-18: USD 70.7 million). However, the underlying overheads and other income decreased 14.4 per cent to USD 60.5 million (Q4 2017-18: USD 70.7 million). Underlying selling and distribution costs decreased 25.4 per cent to USD 7.4 million (Q4 2017-18: USD 9.9 million). The prior year fourth quarter was abnormally high given the inclusion of a bad debt provision to a customer in South Africa. Outside of this, the change would have been approximately flat. We have implemented IFRS 9 and it has had an immaterial impact on the results this quarter and only impacts this line of the income statement. Administration costs decreased by 14.1 per cent to USD 25.7 million (Q4 2017-18: USD 29.9 million) following the reduction in management fee payable by Liquid Zambia to Copperbelt Energy Corporation Plc as a result of the purchase
13
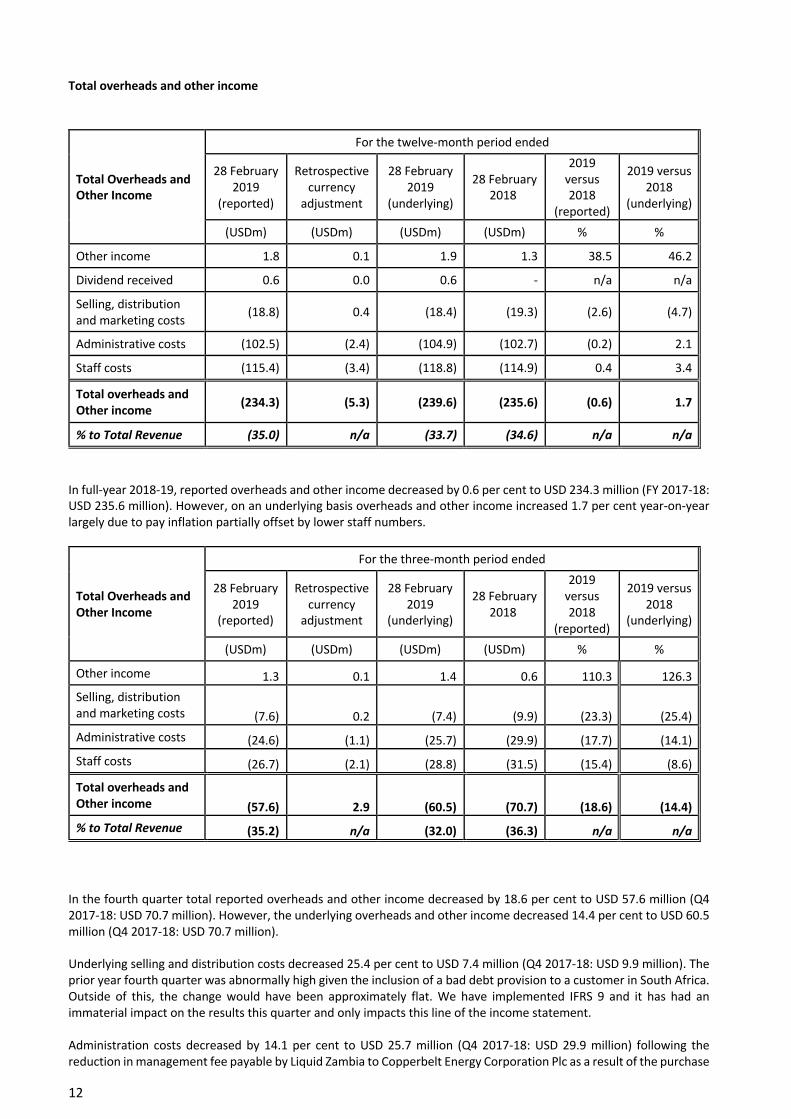
of the minority interest in October 2018 and finalisation in January 2019. In the year, we continued investment in network support as the scale of the Group increased and we expanded our digital services offering. In addition, we received the benefit of migrating computer services away from a previous supplier as part of the integration into our South African operation and we improved the governance structure of the Group. Staff costs in the fourth quarter decreased by 8.6 per cent to USD 28.8 million (Q4 2017-18: USD 31.5 million) reflecting a 7.6 per cent change in employee numbers to 2,186 in the fourth quarter (Q4 2017-18: 2,365) with a significant number of leavers mainly in South Africa in the quarter and the overall trend of upskilling our workforce in-line with the digital transformation strategy notably in South Africa. Other income principally consists of sundry income and profit and loss from the sale of fixed assets. Adjusted EBITDA and profit
Adjusted EBITDA
For the twelve-month period ended For the three-month period ended
28 February 2019
28 February 2018
2019 versus 2018
28 February 2019
28 February
2018
2019 versus 2018
(USDm) (USDm) % (USDm) (USDm) %
Adjusted EBITDA (1) 211.1 191.4 10.3 63.3 62.6 1.2 Retrospective currency adjustment (29.6) - n/a (18.0) - n/a
Depreciation, impairment and amortisation (99.4) (94.3) 5.4 (26.5) (22.3) 18.8 Dividend received (0.6) - n/a - - n/a Operating Profit 81.5 97.0 (16.0) 18.9 40.3 (53.1) Dividend received 0.6 - n/a - - n/a Restructuring costs (5.8) - n/a 1.0 - n/a Acquisition and other investment costs (5.3) (2.5) n/a (1.7) (1.3) n/a Interest income 5.6 3.4 64.4 1.7 0.3 466.7 Finance costs (73.5) (79.0) (7.0) (21.7) (17.3) 25.4 Foreign exchange (loss) / gain (91.8) (1.3) n/a 6.9 (0.6) n/a Share of profit of associate 0.1 0.1 - - - n/a (Loss) / Profit before tax (88.6) 17.7 n/a 5.1 21.5 (76.3) Tax expense (27.5) (17.6) n/a (6.3) (14.7) n/a (Loss) / Profit for the period (116.1) 0.1 n/a (1.2) 6.7 n/a
(1) Adjusted EBITDA is defined as earnings before interest, taxation, depreciation, impairment and amortisation, and is also presented after
adjusting for the following items: acquisition and other investment costs, restructuring costs, foreign exchange (loss)/ gain, share of profit from associate and the retrospective foreign currency impact of the RTGS (2.5) to the USD (1) from 1 October 2018 to 22 February 2019.
Adjusted EBITDA in 2018-19 increased by 10.3 per cent to USD 211.1 million (FY 2017-18: USD 191.4 million) and in the fourth quarter by 1.2 per cent to USD 63.3 million (Q4 2017-18: USD 62.6 million). In the quarter, this increase is driven largely by the revenue performance previously described and the actions to decrease operating costs. The retrospective impact of the introduction of the Zimbabwe currency on EBITDA was USD 18.0 million in the fourth quarter with the total impact of USD 29.6 million between 1 October 2018 and 22 February 2019.
14
Depreciation, impairment and amortisation in the full year increased by 5.4 per cent to USD 99.4 million (FY 2017-18: USD 94.3 million) and in the fourth quarter by 18.8 per cent to USD 26.5 million (Q4 2018-19: USD 22.3 million) principally driven by capital expenditure during the year. Following the announcement of the restructuring across a number of entities to realign the Group in line with our digital transformation strategy we accrued USD 6.8 million of costs in the year to date. However, this was adjusted in the fourth quarter to reflect amounts paid of USD 5.8 million. Further actions to restructure the Group will continue throughout the forthcoming year. In addition, we have expensed USD 5.3 million of acquisition and other investment costs in the year of which USD 1.7 million was in the fourth quarter. These relate to the capital structuring and fund-raising processes that we have guided the market to during the year. The aggregation of the above led to a decrease in Operating Profit in the fourth quarter of 53.1 per cent to USD 18.9 million. (Q4 2017-18: USD 40.3 million) Finance costs in the fourth quarter increased by 25.4 per cent to USD 21.7 million (Q4 2017-18: USD 17.3 million) partially offset by interest receivable and sundry income. In the full-year finance costs reduced because the prior year was impacted by the one-off expense of refinancing the term loan on issuance and tap of the bond. Foreign exchange losses incurred in the full-year were predominantly due to the retranslation of cash and current assets in Zimbabwe. Profit before tax in the fourth quarter of 2018-19 was USD 5.1 million (Q4 2017-18: USD 21.5 million). Tax expense for the fourth quarter of 2018-19 was USD 6.3 million (Q4 2017-18: USD 14.7 million) where the prior year included a catch up accrued in the fourth quarter. As a result of the above, we delivered a loss of USD 1.2 million versus a profit of USD 6.7 million in the fourth quarter in the prior year. Full year losses of USD 116.1 million were largely due to the currency changes previously explained.
15
Cash generated from operations
Cashflow
For the twelve-month period ended For the three-month period ended
28-Feb-19 28-Feb-18 2019
versus 2018
28-Feb-19 28-Feb-18 2019
versus 2018
(USDm) (USDm) % (USDm) (USDm) %
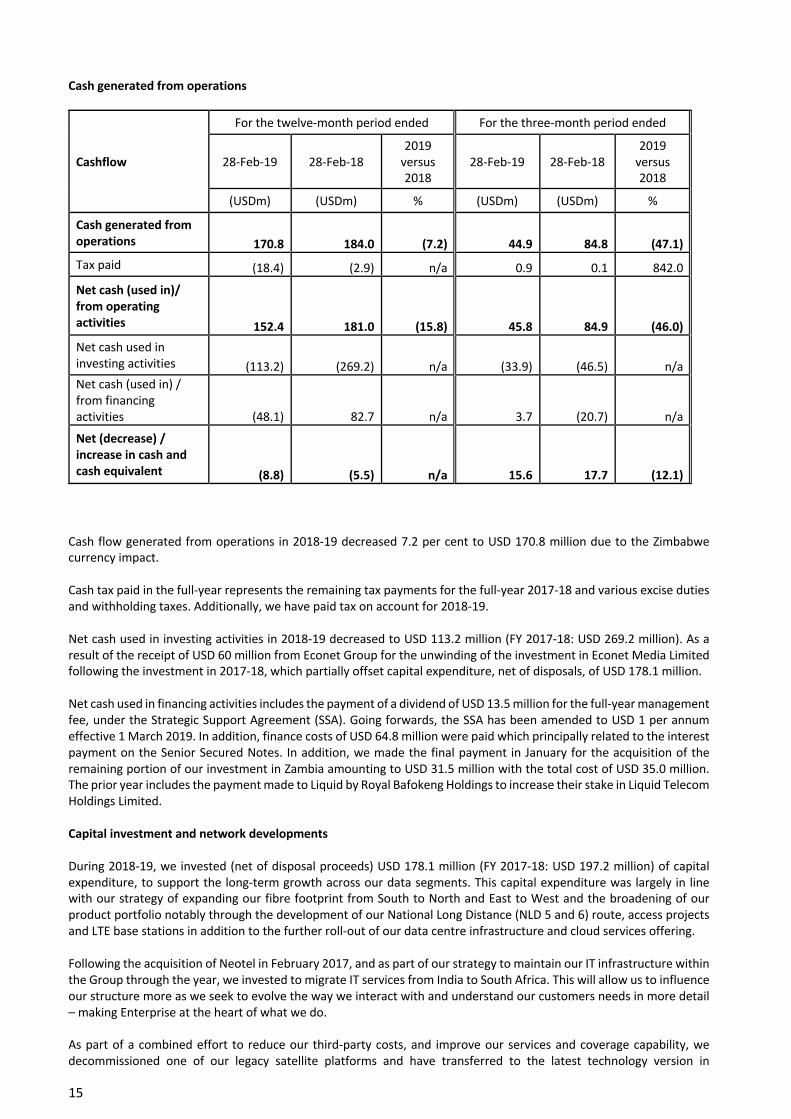
Cash generated from operations 170.8 184.0
(7.2) 44.9 84.8 (47.1)
Tax paid (18.4) (2.9) n/a 0.9 0.1 842.0
Net cash (used in)/ from operating activities 152.4 181.0
(15.8) 45.8 84.9 (46.0)
Net cash used in investing activities (113.2) (269.2) n/a (33.9) (46.5) n/a Net cash (used in) / from financing activities (48.1) 82.7 n/a 3.7 (20.7) n/a
Net (decrease) / increase in cash and cash equivalent (8.8) (5.5) n/a 15.6 17.7 (12.1)
Cash flow generated from operations in 2018-19 decreased 7.2 per cent to USD 170.8 million due to the Zimbabwe currency impact. Cash tax paid in the full-year represents the remaining tax payments for the full-year 2017-18 and various excise duties and withholding taxes. Additionally, we have paid tax on account for 2018-19. Net cash used in investing activities in 2018-19 decreased to USD 113.2 million (FY 2017-18: USD 269.2 million). As a result of the receipt of USD 60 million from Econet Group for the unwinding of the investment in Econet Media Limited following the investment in 2017-18, which partially offset capital expenditure, net of disposals, of USD 178.1 million. Net cash used in financing activities includes the payment of a dividend of USD 13.5 million for the full-year management fee, under the Strategic Support Agreement (SSA). Going forwards, the SSA has been amended to USD 1 per annum effective 1 March 2019. In addition, finance costs of USD 64.8 million were paid which principally related to the interest payment on the Senior Secured Notes. In addition, we made the final payment in January for the acquisition of the remaining portion of our investment in Zambia amounting to USD 31.5 million with the total cost of USD 35.0 million. The prior year includes the payment made to Liquid by Royal Bafokeng Holdings to increase their stake in Liquid Telecom Holdings Limited. Capital investment and network developments During 2018-19, we invested (net of disposal proceeds) USD 178.1 million (FY 2017-18: USD 197.2 million) of capital expenditure, to support the long-term growth across our data segments. This capital expenditure was largely in line with our strategy of expanding our fibre footprint from South to North and East to West and the broadening of our product portfolio notably through the development of our National Long Distance (NLD 5 and 6) route, access projects and LTE base stations in addition to the further roll-out of our data centre infrastructure and cloud services offering. Following the acquisition of Neotel in February 2017, and as part of our strategy to maintain our IT infrastructure within the Group through the year, we invested to migrate IT services from India to South Africa. This will allow us to influence our structure more as we seek to evolve the way we interact with and understand our customers needs in more detail – making Enterprise at the heart of what we do. As part of a combined effort to reduce our third-party costs, and improve our services and coverage capability, we decommissioned one of our legacy satellite platforms and have transferred to the latest technology version in
16
collaboration with a move to an HTS satellite covering DRC and Zimbabwe. As such we are migrating a 7.3m Ku-Band Earth Station from a third-party facility to our in-house teleport in Western Johannesburg. We are continuing to look at the way we work and assess more effective ways of servicing the customer. In Wholesale Data over the year we continued our investment into additional backbone fibre spurs and metropolitan fibre networks and we broadened the reach of our network serving additional wholesale customers by connecting more mobile base stations. In Zimbabwe, at the beginning of the year our 15 year licence was renewed and we have continued to build on our strong position in the country. We completed a new fibre project between Harare and Mutare to provide further physical network redundancy and reliability across the region and we are close to completing the Harare to Masvingo dualisation and improvement in the metro fibre ring. This is in addition to the upgrading of our DWDM equipment from 10G to 100G, upgrades of our wireless offering for customers who originally had Wimax technology to LTE where the capex relates to the establishment of new base stations, our core network for IP backhaul services and our national backbone. In South Africa, during the year we initiated and are continuing to invest in the NLD routes 5 and 6 that connect Cape Town to Durban. This is an important part of our investment strategy to provide connectivity to customers, with MNOs as anchor tenants whilst adding both Enterprise and Retail customers in order to maximise the penetration of the network as we continued to do throughout the year. In addition, we invested in our network to upgrade POP sites and cabinets for POP expansion. In Kenya we are continuing in the investment phase of our long-term partnership with the Kenyan Electricity Transmission Company Limited (KETRACO) to commercialise their fibre links built over the national electricity transmission grid across Kenya. This complements our strategy to further extend our fibre network to remote areas of Kenya, deliver a portion of our strategy to connect south-to-north and east-to-west as we interconnect neighbouring countries such as Ethiopia, Uganda, and Tanzania and onward connectivity to Rwanda, Sudan, Egypt, north-eastern DRC and Burundi. This also serves as a mitigation factor against the cost of relocating fibre routes during the expansion of national highways. In addition, we initiated the roll-out of 4G services for a wholesale customer, started to provide dark fibre to towers for a large wholesale customer as they roll out their LTE network. At the beginning of the year we paid for our DRC operating licence and have initiated investment in the country where we are building a network in Goma, upgrading our network in Katanga and seeking further sites for investment given the strong growth prospects within the country. Separately we are continuing to invest in active telecommunication equipment to improve the reliability (e.g. security systems and power generators) and capacity (e.g. new switches, cabinets and routers) of our network, in particular in Kenya, South Africa and Zimbabwe in order to extend our layer three network to new locations and with improved capacity. We took on a new long-term lease (IRU) for additional international capacity on international submarine cables and in Zambia to support our growth in data traffic. We have also made additional investments in core network and IT infrastructure in South Africa and across the Southern region, which will enable strong growth in connectivity and digital services across our footprint as part of our strategy to diversify into value-added services. In December 2018 we announced the signing of a Memorandum of Understanding to invest in our network infrastructure and Data Centres in Egypt, in conjunction with Telecom Egypt, as part of our strategy to provide local focussed hyper scale data centres in high growth and scalable locations, such as Cairo, with Edge data centres in smaller metro areas in order to meet demand. The strategy continues to be underpinned by anchor tenants and the need from governments in Africa to have data held in country. Throughout the year we have continued to invest in our four current data centres, specifically in South Africa and Nairobi, in order to maximise our capability on the back of anchor tenants, strong demand for co-location facilities in-country and interconnecting points of presence and internet exchanges across the Wholesale and Enterprise customer segments. We continue to have strong demand for data centres however, as previously guided, we are looking at other avenues of financing for future sizable data centre investment given the longer payback periods. In the Enterprise segment we have continued to work on re-aligning our operations business model with customer demand, although it is taking slightly longer than originally estimated, it continues to be a success with a strong buy-in from employees and customers alike and we continue to expect the actions to be imbedded within the business by the
17
end of the first quarter 2019-20. As part of this process we have invested in our systems in order to provide a platform for customers to buy and bill for cloud services and further change in the way we work will continue to occur to meet our customer needs over the coming quarters. Capital expenditure was impacted by a delay to a couple of large contracts through the year which have now been resolved. We also continued to invest significantly in our infrastructure in South Africa and Zimbabwe to use our own local access networks (instead of relying on third parties) to deliver services to enterprises, create a seamless international network from Cape Town to Nairobi (that we are extending terrestrially to Cairo through partner networks), and offering a high-quality customer experience across our operations. In addition, we delivered more MPLS and Direct Internet Access (DIA) connections to our Enterprise customer base, including connectivity between sites, Internet access as well as VoIP and cloud-based services. We are now delivering significant government contracts and corporates, such as financial institutions. This lead to further investment in metro and local access fibre infrastructure on the back of these contracts. In addition to the investment in our infrastructure we have previously mentioned that we need to develop our services and offering to our customers. Through the year we have sought to rollout new services across our Odin platform from Microsoft Office 365 to Microsoft Azure and unified communications but with improved ticketing and billing systems. This will continue through the forthcoming year as exemplified through our partnership with Sigfox and our innovative collaboration with universities and other customers alike. For the retail segment, during the year we continued building fibre-to-the-home (FTTH) local access networks with our GPON technology, connecting over 8000 new premises across our FTTH footprint driving our penetration to 38.6 per cent. This is following a notable increase in the premises passed in the quarter in Zimbabwe, Tanzania and Uganda. We are continuing to extend the coverage of our fixed wireless access networks (mainly using 4G LTE technology) that enable us to deliver broadband Internet access to customers outside of our FTTH areas. We have completed the installation of and brought on air over 397 LTE base stations to significantly extend this coverage. Gross / Net Debt
28 February 2019 30 November 2018
(USDm) (USDm)
Total Gross Debt 831.9 775.9
Long term borrowings including interest accrued 732.8 732.9
Short term portion of long-term borrowings 87.2 30.2
Unamortised arrangement fees 11.9 12.8
Less: Unrestricted cash * 93.3 138.6
Cash and Cash equivalents 95.1 140.8
Restricted cash 1.8 2.2
Net debt 738.6 637.3
Last twelve months Adjusted EBITDA 211.1 210.4
Covenants
Gross debt / LTM Adjusted EBITDA (x) 3.94 3.69
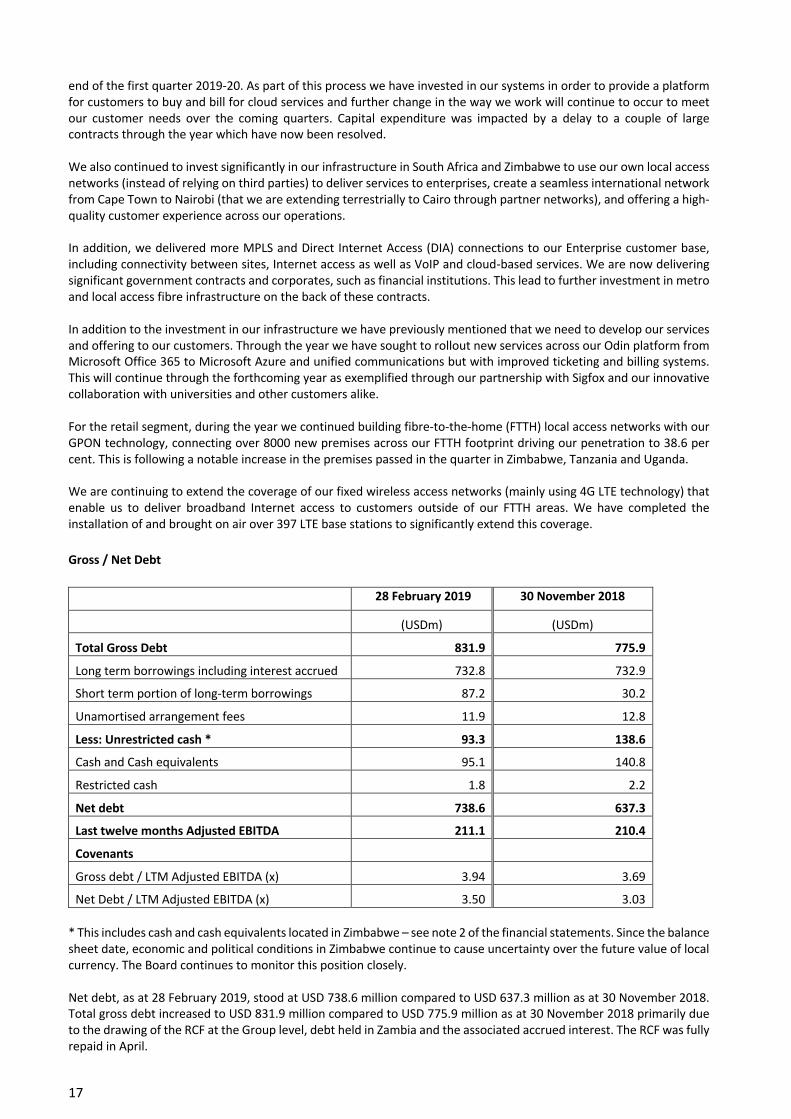
Net Debt / LTM Adjusted EBITDA (x) 3.50 3.03 * This includes cash and cash equivalents located in Zimbabwe – see note 2 of the financial statements. Since the balance sheet date, economic and political conditions in Zimbabwe continue to cause uncertainty over the future value of local currency. The Board continues to monitor this position closely. Net debt, as at 28 February 2019, stood at USD 738.6 million compared to USD 637.3 million as at 30 November 2018. Total gross debt increased to USD 831.9 million compared to USD 775.9 million as at 30 November 2018 primarily due to the drawing of the RCF at the Group level, debt held in Zambia and the associated accrued interest. The RCF was fully repaid in April.

18
The medium-term policy of the Group is to have a net debt to EBITDA ratio of between two and three times. Strive Masiyiwa Nic Rudnick Phil Moses Group Executive Chairman Chief Executive Officer Chief Finance Officer 18 June 2019
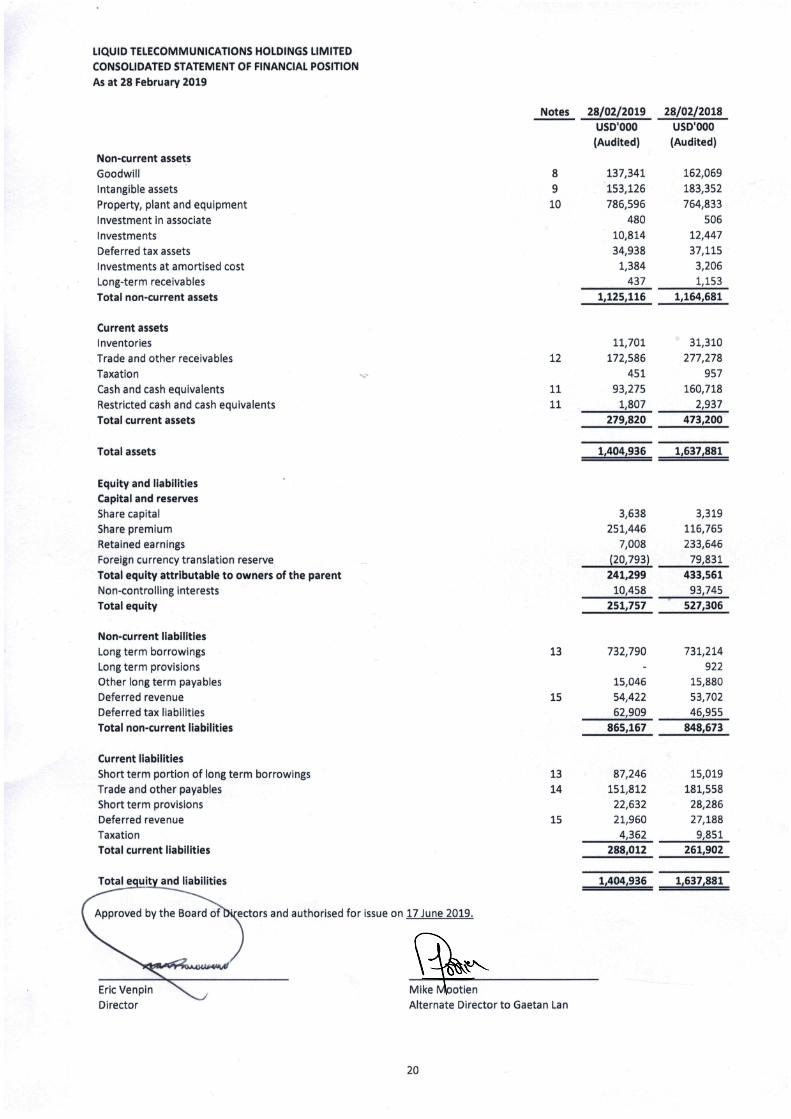
LIQUID TELECOMMUNICATIONS HOLDINGS LIMITED
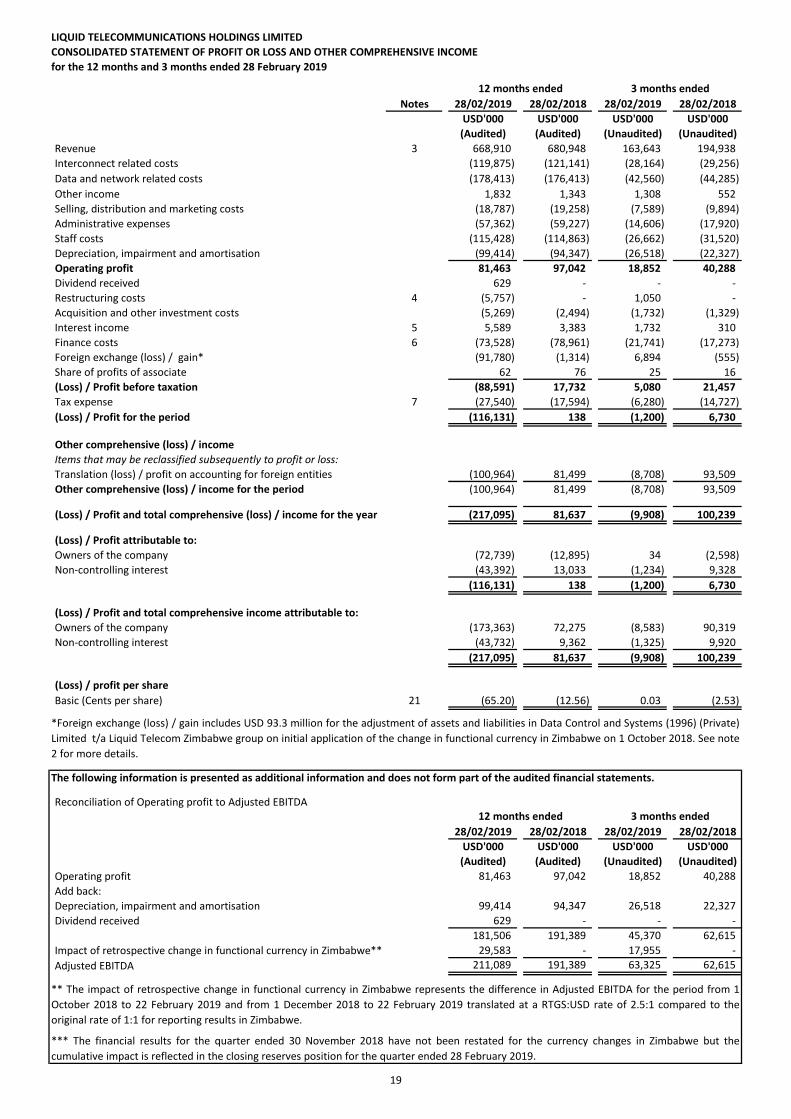
CONSOLIDATED STATEMENT OF PROFIT OR LOSS AND OTHER COMPREHENSIVE INCOME
for the 12 months and 3 months ended 28 February 2019
Notes 28/02/2019 28/02/2018 28/02/2019 28/02/2018
USD'000 USD'000 USD'000 USD'000
(Audited) (Audited) (Unaudited) (Unaudited)
Revenue 3 668,910 680,948 163,643 194,938
Interconnect related costs (119,875) (121,141) (28,164) (29,256)
Data and network related costs (178,413) (176,413) (42,560) (44,285)
Other income 1,832 1,343 1,308 552
Selling, distribution and marketing costs (18,787) (19,258) (7,589) (9,894)
Administrative expenses (57,362) (59,227) (14,606) (17,920)
Staff costs (115,428) (114,863) (26,662) (31,520)
Depreciation, impairment and amortisation (99,414) (94,347) (26,518) (22,327)
Operating profit 81,463 97,042 18,852 40,288
Dividend received 629 - - -
Restructuring costs 4 (5,757) - 1,050 -
Acquisition and other investment costs (5,269) (2,494) (1,732) (1,329)
Interest income 5 5,589 3,383 1,732 310
Finance costs 6 (73,528) (78,961) (21,741) (17,273)
Foreign exchange (loss) / gain* (91,780) (1,314) 6,894 (555)
Share of profits of associate 62 76 25 16
(Loss) / Profit before taxation (88,591) 17,732 5,080 21,457
Tax expense 7 (27,540) (17,594) (6,280) (14,727)
(Loss) / Profit for the period (116,131) 138 (1,200) 6,730
Other comprehensive (loss) / income
Items that may be reclassified subsequently to profit or loss:
Translation (loss) / profit on accounting for foreign entities (100,964) 81,499 (8,708) 93,509
Other comprehensive (loss) / income for the period (100,964) 81,499 (8,708) 93,509
(Loss) / Profit and total comprehensive (loss) / income for the year (217,095) 81,637 (9,908) 100,239
(Loss) / Profit attributable to:
Owners of the company (72,739) (12,895) 34 (2,598)
Non-controlling interest (43,392) 13,033 (1,234) 9,328
(116,131) 138 (1,200) 6,730
(Loss) / Profit and total comprehensive income attributable to:
Owners of the company (173,363) 72,275 (8,583) 90,319
Non-controlling interest (43,732) 9,362 (1,325) 9,920
(217,095) 81,637 (9,908) 100,239
(Loss) / profit per share
Basic (Cents per share) 21 (65.20) (12.56) 0.03 (2.53)
The following information is presented as additional information and does not form part of the audited financial statements.
Reconciliation of Operating profit to Adjusted EBITDA
28/02/2019 28/02/2018 28/02/2019 28/02/2018
USD'000 USD'000 USD'000 USD'000
(Audited) (Audited) (Unaudited) (Unaudited)
Operating profit 81,463 97,042 18,852 40,288
Add back:
Depreciation, impairment and amortisation 99,414 94,347 26,518 22,327
Dividend received 629 - - -
181,506 191,389 45,370 62,615
Impact of retrospective change in functional currency in Zimbabwe** 29,583 - 17,955 -
Adjusted EBITDA 211,089 191,389 63,325 62,615
*Foreign exchange (loss) / gain includes USD 93.3 million for the adjustment of assets and liabilities in Data Control and Systems (1996) (Private)
Limited t/a Liquid Telecom Zimbabwe group on initial application of the change in functional currency in Zimbabwe on 1 October 2018. See note
2 for more details.
12 months ended
12 months ended 3 months ended
3 months ended
*** The financial results for the quarter ended 30 November 2018 have not been restated for the currency changes in Zimbabwe but the
cumulative impact is reflected in the closing reserves position for the quarter ended 28 February 2019.
** The impact of retrospective change in functional currency in Zimbabwe represents the difference in Adjusted EBITDA for the period from 1
October 2018 to 22 February 2019 and from 1 December 2018 to 22 February 2019 translated at a RTGS:USD rate of 2.5:1 compared to the
original rate of 1:1 for reporting results in Zimbabwe.
19
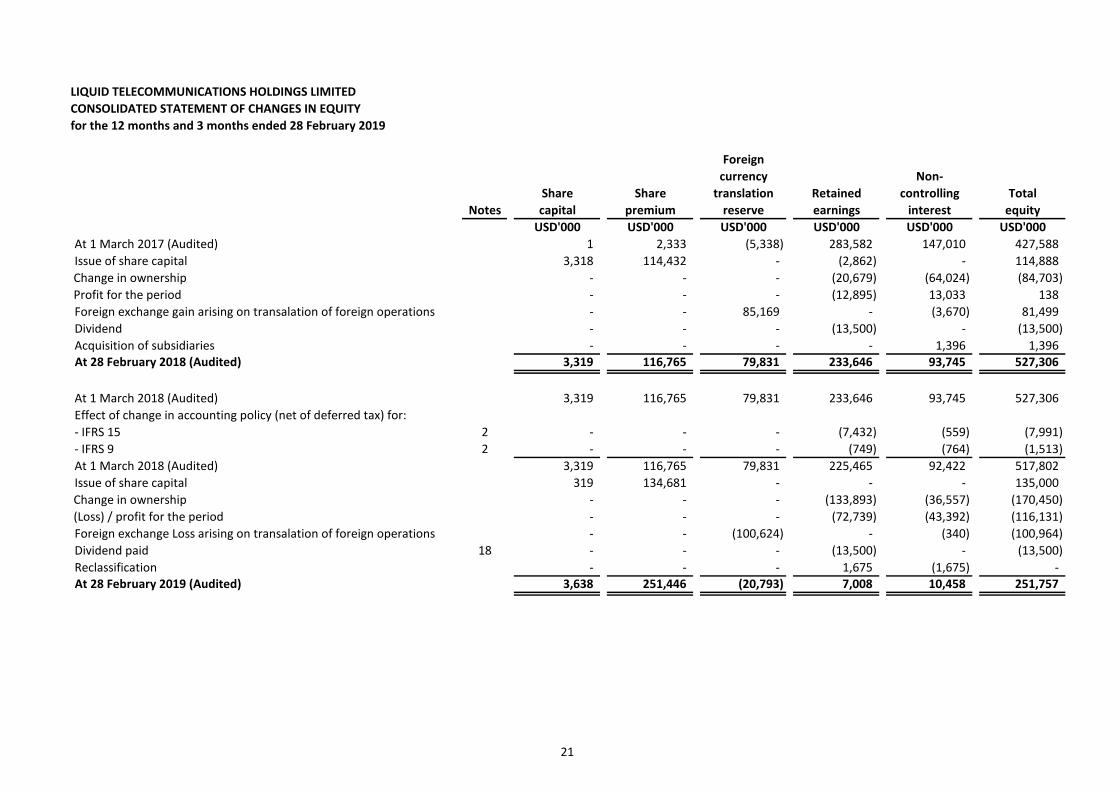
LIQUID TELECOMMUNICATIONS HOLDINGS LIMITED
CONSOLIDATED STATEMENT OF CHANGES IN EQUITY
for the 12 months and 3 months ended 28 February 2019
Foreign
currency Non-
Share Share translation Retained controlling Total
Notes capital premium reserve earnings interest equity
USD'000 USD'000 USD'000 USD'000 USD'000 USD'000
At 1 March 2017 (Audited) 1 2,333 (5,338) 283,582 147,010 427,588
Issue of share capital 3,318 114,432 - (2,862) - 114,888
Change in ownership - - - (20,679) (64,024) (84,703)
Profit for the period - - - (12,895) 13,033 138
Foreign exchange gain arising on transalation of foreign operations - - 85,169 - (3,670) 81,499
Dividend - - - (13,500) - (13,500)
Acquisition of subsidiaries - - - - 1,396 1,396At 28 February 2018 (Audited) 3,319 116,765 79,831 233,646 93,745 527,306
At 1 March 2018 (Audited) 3,319 116,765 79,831 233,646 93,745 527,306
Effect of change in accounting policy (net of deferred tax) for:
- IFRS 15 2 - - - (7,432) (559) (7,991)
- IFRS 9 2 - - - (749) (764) (1,513)
At 1 March 2018 (Audited) 3,319 116,765 79,831 225,465 92,422 517,802
Issue of share capital 319 134,681 - - - 135,000
Change in ownership - - - (133,893) (36,557) (170,450)
(Loss) / profit for the period - - - (72,739) (43,392) (116,131)
Foreign exchange Loss arising on transalation of foreign operations - - (100,624) - (340) (100,964)
Dividend paid 18 - - - (13,500) - (13,500)
Reclassification - - - 1,675 (1,675) - At 28 February 2019 (Audited) 3,638 251,446 (20,793) 7,008 10,458 251,757
21
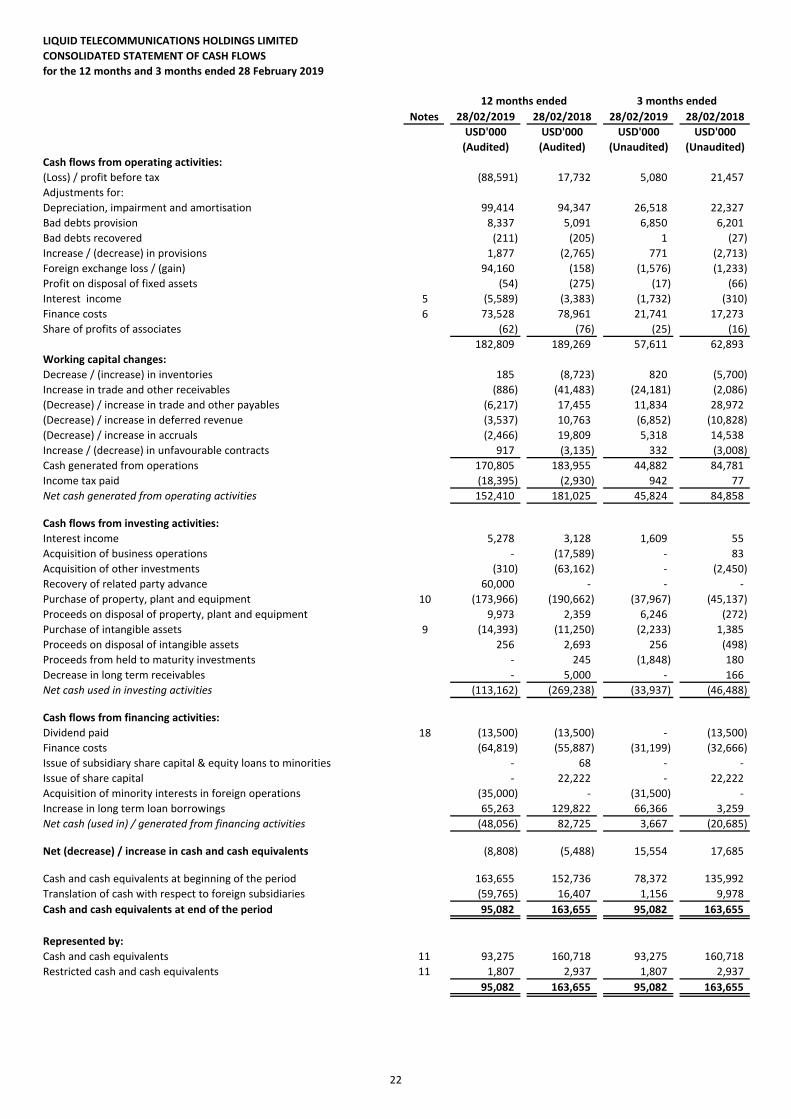
LIQUID TELECOMMUNICATIONS HOLDINGS LIMITED
CONSOLIDATED STATEMENT OF CASH FLOWS
for the 12 months and 3 months ended 28 February 2019
Notes 28/02/2019 28/02/2018 28/02/2019 28/02/2018
USD'000 USD'000 USD'000 USD'000
(Audited) (Audited) (Unaudited) (Unaudited)
Cash flows from operating activities:
(Loss) / profit before tax (88,591) 17,732 5,080 21,457
Adjustments for:
Depreciation, impairment and amortisation 99,414 94,347 26,518 22,327
Bad debts provision 8,337 5,091 6,850 6,201
Bad debts recovered (211) (205) 1 (27)
Increase / (decrease) in provisions 1,877 (2,765) 771 (2,713)
Foreign exchange loss / (gain) 94,160 (158) (1,576) (1,233)
Profit on disposal of fixed assets (54) (275) (17) (66)
Interest income 5 (5,589) (3,383) (1,732) (310)
Finance costs 6 73,528 78,961 21,741 17,273
Share of profits of associates (62) (76) (25) (16)
182,809 189,269 57,611 62,893
Working capital changes:
Decrease / (increase) in inventories 185 (8,723) 820 (5,700)
Increase in trade and other receivables (886) (41,483) (24,181) (2,086)
(Decrease) / increase in trade and other payables (6,217) 17,455 11,834 28,972
(Decrease) / increase in deferred revenue (3,537) 10,763 (6,852) (10,828)
(Decrease) / increase in accruals (2,466) 19,809 5,318 14,538
Increase / (decrease) in unfavourable contracts 917 (3,135) 332 (3,008)
Cash generated from operations 170,805 183,955 44,882 84,781
Income tax paid (18,395) (2,930) 942 77
Net cash generated from operating activities 152,410 181,025 45,824 84,858
Cash flows from investing activities:
Interest income 5,278 3,128 1,609 55
Acquisition of business operations - (17,589) - 83
Acquisition of other investments (310) (63,162) - (2,450)
Recovery of related party advance 60,000 - - -
Purchase of property, plant and equipment 10 (173,966) (190,662) (37,967) (45,137)
Proceeds on disposal of property, plant and equipment 9,973 2,359 6,246 (272)
Purchase of intangible assets 9 (14,393) (11,250) (2,233) 1,385
Proceeds on disposal of intangible assets 256 2,693 256 (498)
Proceeds from held to maturity investments - 245 (1,848) 180
Decrease in long term receivables - 5,000 - 166
Net cash used in investing activities (113,162) (269,238) (33,937) (46,488)
Cash flows from financing activities:
Dividend paid 18 (13,500) (13,500) - (13,500)
Finance costs (64,819) (55,887) (31,199) (32,666)
Issue of subsidiary share capital & equity loans to minorities - 68 - -
Issue of share capital - 22,222 - 22,222
Acquisition of minority interests in foreign operations (35,000) - (31,500) -
Increase in long term loan borrowings 65,263 129,822 66,366 3,259
Net cash (used in) / generated from financing activities (48,056) 82,725 3,667 (20,685)
Net (decrease) / increase in cash and cash equivalents (8,808) (5,488) 15,554 17,685
Cash and cash equivalents at beginning of the period 163,655 152,736 78,372 135,992
Translation of cash with respect to foreign subsidiaries (59,765) 16,407 1,156 9,978
Cash and cash equivalents at end of the period 95,082 163,655 95,082 163,655
Represented by:
Cash and cash equivalents 11 93,275 160,718 93,275 160,718
Restricted cash and cash equivalents 11 1,807 2,937 1,807 2,937
95,082 163,655 95,082 163,655
12 months ended 3 months ended
22
LIQUID TELECOMMUNICATIONS HOLDINGS LIMITED
CONDENSED NOTES TO THE CONSOLIDATED FINANCIAL STATEMENTS
for the 12 months ended 28 February 2019
1. General information
2. Accounting policies
Basis of preparation
Going concern
Impact of IFRS 16 "Leases"
Cash position
On 1 October 2018, the company acquired the remaining shares in Liquid Telecommunications Zambia Limited (previously know as CEC
Liquid Telecommunications Limited) (50%) for a total consideration of USD 35.0 million.
As at 28 February 2019, the group has an unrestricted cash position of USD 93.3 million (28 February 2018: USD 160.7 million). Of this
amount, USD 49.1 million is held in Zimbabwe in RTGS. Following the announcement of the currency changes in Zimbabwe on 22
February 2019, the group has translated the Zimbabwe cash at the balance sheet date at a RTGS:USD exchange rate of 2.5:1. Prior to
this event, the cash balance in Zimbabwe at the balance sheet date would have been equivalent to USD 120.8 million (28 February 2018:
USD 88.3 million translated at RTGS:USD 1:1).
Liquid Telecommunications Holdings Limited is a private company incorporated in Mauritius on 26 January 2007 and is the holder of a
Category 2 – Global Business Licence Company as from 29 January 2007. Its registered office is situated at 10th floor, Standard
Chartered Tower, 19-21 Bank Street, Cybercity, Ebene, Mauritius. The company’s main activity is to carry on the business of a holding
company in respect of subsidiary companies throughout the world, whilst the group's business is to develop a global
telecommunications and technology business with a focus on Africa. This has remained unchanged since the prior period.
The condensed consolidated interim financial statements for the 12 months ended 28 February 2019 have been prepared in accordance
with IAS 34 Interim Financial Reporting.
The going concern assumption is supported by the following key considerations:
These consolidated financial statements are presented in United States Dollars (USD) as this is the currency in which the majority of the
group's transactions are denominated. The functional currencies of the subsidiaries are: United States Dollars, Mauritian Rupee, South
African Rand, Pound Sterling, Zambian Kwacha, Kenyan Shilling, Ugandan Shilling, Rwandan Franc, Botswana Pula, Nigerian Naira,
Tanzanian Shilling, Sudanese Pound and Real Time Gross Settlement (RTGS).
The preparation of consolidated financial statements in conformity with IFRS requires the use of estimates and assumptions that affect
the reported amounts of assets and liabilities at the date of the financial statements and the reported amounts of revenues and
expenses during the reporting period. Although these estimates are based on management’s best knowledge of the amount, event or
actions, actual results ultimately may differ from those estimates.
The directors have reviewed the consolidated cash flow projections of Liquid Telecommunications Holdings Limited (“the group”) for the
twelve months from the date of signing of the consolidated financial statements. Taking into account the available cash position as of 28
February 2019, including the impact of the currency changes in Zimbabwe, the cash flow projections for the period (which include
discretionary capital expenditure), new equity finance, the repayment of existing obligations and loan funding, the directors are satisfied
that the group has access to adequate cash resources to settle obligations as they fall due. They also consider that the operations
provide sufficient financial sustainability to enable the business to continue in existence for the foreseeable future.
Funding facilities
The directors have also considered the impact of the new accounting standard, IFRS 16 "Leases", which is effective for the first time in
financial year 2020 and are of the opinion that it will not have any impact on the going concern of the group.
The group is currently funded from a combination of retained earnings, USD 730.0 million Senior Secured Notes (maturity in July 2022),
USD 73.0 million Revolving Credit Facility ("RCF") (maturity in January 2022) and USD 23.3 million of locally provided Revolving Credit
Facilities (maturity in FY 20 and FY 21) and term loans (maturity in FY 20 to FY 22) in Zambia, of which USD 18.5 million is outstanding at
the balance sheet date. The RCF was fully drawn at the balance sheet date, but was repaid in full in April 2019.
On 28 February 2019, 10,705,789 ordinary shares at par value of USD 0.0297541580 were issued by the company to Econet Wireless
Private Limited (Zimbabwe) in exchange for the acquisition of the remaining shares in Data Control and Systems (1996) (Private) Limited
t/a Liquid Telecom Zimbabwe (51%) for total consideration of USD 135.0 million.
23
LIQUID TELECOMMUNICATIONS HOLDINGS LIMITED
CONDENSED NOTES TO THE CONSOLIDATED FINANCIAL STATEMENTS (CONTINUED)
for the 12 months ended 28 February 2019
2. Accounting policies (continued)
Going concern (continued)
New equity finance
Operational performance
Zimbabwean Real Time Gross Settlement (RTGS)
Statement of financial position
In accordance with the requirements of IAS 21 "The effects of changes in foreign exchange rates", the group considers the effective date
of the functional currency change to be 1 October 2018 and has retrospectively applied the official exchange rate of RTGS:USD 2.5:1 to
its statement of profit and loss for the period of 1 October 2018 to 28 February 2019. With the financial results now reflected in RTGS,
the statement of financial position at 28 February 2019 has been translated to USD presentation currency using an exchange rate of
2.5:1.
On 11 December 2018, CDC Group Plc (“CDC”) agreed to invest USD 180.0 million into the Liquid Telecommunications Group by way of
subscription for convertible preference shares. The equity funds were received in April 2019. The money will be used to invest in capital
expenditure to expand the network footprint and grow EBITDA.
• Following the conversion of the statement of financial position, an immediate assessment of the value of the assets and liabilities was
performed, resulting in an adjustment of USD 93.3 million, included in foreign exchange loss in the consolidated statement of profit or
loss. The adjustment was calculated by identifying the underlying value of each statement of financial position item, by reference to the
original currency and assessing whether the new RTGS value was representative of the realisable value. Had a rate of RTGS:USD 4.0:1
been used, the adjustment would have been USD 116.6 million. In respect of the cash and cash equivalents element, the bank balance of
Data Control and Systems (1996) (Private) Limited t/a Liquid Telecom Zimbabwe group (LTZ), which was previously reflected at USD
120.8 million when the rate was 1:1, was converted at 2.5:1 to give a balance in RTGS. The fair value assessment resulted in an
adjustment of USD 57.9 million to reflect the actual value of the RTGS funds held. This adjustment is included in the USD 93.3 million
foreign exchange loss referenced above. This USD 57.9 million adjustment also forms part of the USD 59.8 million translation of cash
with respect to foreign operations disclosed in the consolidated statement of cash flow.
• Any movements between 1 October 2018 and 28 February 2019 were reviewed to determine the appropriate values at which the
transactions occurred.
• Having arrived at the RTGS statement of financial position on 28 February 2019, the closing exchange rate of RTGS:USD 2.5:1 was
applied to convert all line items on the statement of financial position to the presentation currency, which is USD.
For the year ended 28 February 2019, the group reported an operating profit of USD 81.5 million (2018: 97.0 million) and a net cash
inflow from operating activities of USD 152.4 million (USD 181.0 million). This demonstrates the group's ability to generate sufficient
cash flow to enable it to support its underlying business operations and invest in new projects. Following the currency changes in
Zimbabwe, the proportion of the group's total operating profit for the year and cash balance at the end of the year represented by
Zimbabwe, has reduced compared to the prior year.
For the year under review, judgements have been applied in determining an exchange rates of RTGS:USD of 2.5:1 retrospectively for the
period 1 October 2018 to 28 February 2019. The events taken into account in forming this judgement include the recent announcement
of the Zimbabwean business to increase its prices to customers by a factor of 2.5 as permitted by the Zimbabwean Regulator and the
range of trading rates experienced during the period.
Based on the assessment made and articulated in the reasons set out above, the directors are of the opinions, that the adoption of the
going concern assumption for the preparation of the financial statements as of 28 February 2019 is appropriate.
On 1 October 2018, the Reserve Bank of Zimbabwe (RBZ) directed all banks to ring-fence nostro foreign currency accounts (FCAs) by
separating them into two categories; namely Nostro FCAs and RTGS FCAs. Authorities maintained that the US dollar represented in the
RTGS system was at a 1:1 exchange ratio. On 20 February 2019, the RBZ announced that with effect from 22 February 2019, the RTGS
would be recognised as an official currency and that an interbank foreign exchange market would be established to formalise trading in
RTGS balances with other currencies. The official rate on launch was 2.5 and this was the rate on 28 February 2019.
The impact of the currency changes have been reflected as follows:
• As the change in functional currency was effective from 1 October 2018, the opening statement of financial position at this date was
converted to RTGS using the official rate of RTGS:USD 2.5:1.
24
LIQUID TELECOMMUNICATIONS HOLDINGS LIMITED
CONDENSED NOTES TO THE CONSOLIDATED FINANCIAL STATEMENTS (CONTINUED)
for the 12 months ended 28 February 2019
2. Accounting policies (continued)
Zimbabwean Real Time Gross Settlement (RTGS) (continued)
Statement of profit or loss
Accounting policies
Changes in accounting policies - IFRS 15 “Revenue from Contracts with Customers”
• Over time, in a manner that best reflects the delivery of the company’s performance obligations; or
• At a point in time, when control of the goods or services is transferred to the customer.
• Wholesale data and other services - primarily data services sold to African mobile network operators and international telecom
operators;• Enterprise data and other services - primarily data services sold to medium to large enterprises in Africa; and
1. Identify the contract: the group has contracts in each of the following revenue streams;
IFRS 15 “Revenue from Contracts with Customers”, was mandatorily effective for accounting periods beginning on or after 1 January
2018 and was adopted by the group for the financial year commencing 1 March 2018.
The standard sets out the requirements for recognising revenue from contracts with customers and has impacted how the group
recognises revenue, using a five-step process which is applied below.
• Retail data and other services - primarily data services sold to consumers and small businesses in Africa.
2. Identify the performance obligations: The group identifies deliverables in contracts with customers that qualify as separate
“performance obligations”. Some of the contracts relating to the revenue sources above contain multiple deliverables or performance
obligations. The group assesses whether there are distinct performance obligations at the start of each contract and throughout the
performance of the contracts. The performance obligations identified will depend on the nature of individual customer contracts, which
will typically be the provision of equipment to customers and the delivery of services provided to customers.
• All transactions that were incurred in USD were translated at 2.5:1 to arrive at RTGS equivalent. All transactions incurred in RTGS were
kept at RTGS values.
Revenue is measured based on the consideration to which the group expects to be entitled from a contract with a customer and
excludes amounts collected on behalf of third parties. The group recognises revenue when it transfers control of a product or service to
a customer. Depending on whether certain criteria are met, revenue is recognised:
• Wholesale voice traffic - primarily revenue from international voice interconnects between mobile network operators and
international telecom carriers;
• The impact of the retrospective change in functional currency in Zimbabwe resulted in decreased earnings of USD 29.6 million for the
period from 1 October 2018 to 22 February 2019 translated at a RTGS:USD rate of 2.5:1. Had a rate of RTGS:USD 4.0:1 been used, the
impact would have been USD 52.9 million. Going forward the company plans to mitigate further adverse currency impact in Zimbabwe
by adjusting prices, as and when approved by the Regulator.
The accounting policies applied by the group in the preparation of the condensed consolidated financial statements presented are in
accordance with IFRS and are consistent with those applied by the group in the preparation of the consolidated financial statements for
the year ended 28 February 2018 with the exception of IFRS 15 "Revenue from Contracts with Customers" and IFRS 9 "Financial
Instruments", which were adopted as at 1 March 2018.
The group has applied the modified retrospective approach for the adoption of IFRS 15. The results reported from 1 March 2018, the
date of initial application, will be as if the standard had always been applied. The group has elected to apply IFRS 15 only to contracts
that were not completed contracts at the date of initial application and the comparative periods will not be restated under the new
standard.
• As the currency changes were effective from 1 October 2018, transactions prior to this date have been maintained at a rate of
RTGS:USD 1:1.
• Transactions that took place between 1 October 2018 and 28 February 2019 were analysed and split between USD transactions and
RTGS transactions depending on the underlying currency of the transaction.
25
LIQUID TELECOMMUNICATIONS HOLDINGS LIMITED
CONDENSED NOTES TO THE CONSOLIDATED FINANCIAL STATEMENTS (CONTINUED)
for the 12 months ended 28 February 2019
2. Accounting policies (continued)
Changes in accounting policies - IFRS 15 “Revenue from Contracts with Customers” (continued)
The group accounts for a contract with a customer only when; there is evidence of an arrangement, the group can identify each party’s
rights regarding the goods and services to be transferred, the contract has commercial substance and collectability is reasonably
assured.
5. Recognise revenue as and when the performance obligations are satisfied.
• Retail data and other services: These contracts consist of two parts; firstly the installation of the equipment and/or connection of the
service and secondly the provisioning of monthly services. The installation of equipment performance obligation is satisfied on
completion of installation as ownership is transferred. The provisioning of a monthly service is recognised monthly as the service is
delivered monthly. Unused data cannot be transferred to a following month. The transaction price is determined by the signed contract,
which takes into account equipment and data rates determined at market related prices. Customers are invoiced once for NRR and on a
monthly basis for MRR. A receivable is raised as the service is delivered.
• Wholesale data and other services: The performance obligation relating to these service contracts consists of two parts, firstly the
installation of the equipment and/or connection of the service, the Non-Recurring Revenue (NRR), and secondly the provisioning of
monthly services, the Monthly Recurring Revenue (MRR).
Generally, these contracts only have one performance obligation, the provisioning of a monthly service that is satisfied over time.
Therefore, both the NRR and MRR components of the contract will be recognised over the period of the contract. Transaction prices are
determined based on signed contracts, which take into account equipment and data rates determined at market related prices with the
client for the NRR and MRR components. Deferred revenue is raised for the NRR payment received upfront. Customers are invoiced
once for NRR and on a monthly basis for MRR. A receivable is raised as the service is delivered.
Wholesale data and other services also include the construction and sale of long-haul fibre infrastructure. At the completion of each
stage, control is transferred to the customer once they have accepted this completion of the stage and therefore the performance
obligation is satisfied. There is generally also a maintenance aspect to these contracts, which is recognised over the term of the contract
once obligations are met. Once transferred to the customer and accepted by the customer, revenue is recognised and a receivable is
raised for any outstanding payments. The transaction price is determined by the signed contract.
• Enterprise data and other services: These contracts consist of two parts; firstly the installation of the equipment and/or connection of
the service and secondly the provisioning of monthly services. The installation of equipment performance obligation is satisfied on
completion of installation as ownership is transferred. The provisioning of a monthly service is recognised monthly as the service is
delivered monthly. Unused data cannot be transferred to a following month. The transaction price is determined by the signed contract,
which takes into account equipment and data rates determined at market related prices. Customers are invoiced once for NRR and on a
monthly basis for MRR. A receivable is raised as the service is delivered.
Revenue Recognition is applied to individual contracts with customers. However, the International Accounting Standards Board (IASB)
recognized that there may be situations in which it may be more practical for an entity to combine contracts for revenue recognition
purposes rather than attempt to account for each contract separately.
4. Allocate the transaction price: The transaction price receivable from customers is allocated across the group’s performance
obligations under the contracts on a relative stand-alone selling price basis. Revenue will then be recognised either at a point in time or
over time when the respective performance obligations in a contract are delivered to the customer. Stand-alone selling prices will be
based on observable sales prices and where stand-alone selling prices are not directly observable, estimates of stand-alone selling prices
will be required.
3. Determine the transaction price: The transaction price is measured based on the consideration specified in a contract with a customer
and excludes amounts collected on behalf of third parties. The group recognises revenue when it transfers control of a product or
service to a customer, that is, when the performance obligation is satisfied.
• Wholesale voice traffic: The performance obligation relating to wholesale voice traffic is to provide voice minutes for the duration of
the call until termination. The transaction price is determined based on agreed upon per minute rates and the duration of the call.
Revenue relating to wholesale voice is recognised at the point the call is terminated as this is the point the service is delivered to the
customer. Customers are invoiced monthly based for their voice usage and a receivable is raised as the service has been delivered.
26
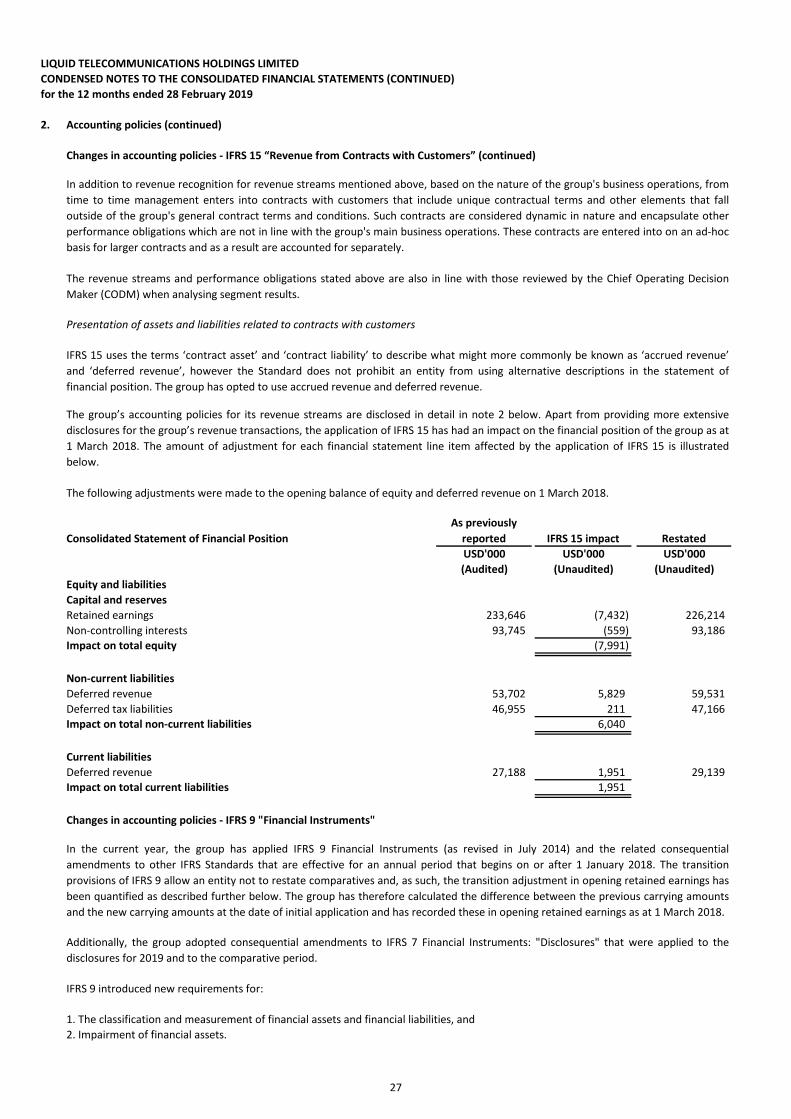
LIQUID TELECOMMUNICATIONS HOLDINGS LIMITED
CONDENSED NOTES TO THE CONSOLIDATED FINANCIAL STATEMENTS (CONTINUED)
for the 12 months ended 28 February 2019
2. Accounting policies (continued)
Changes in accounting policies - IFRS 15 “Revenue from Contracts with Customers” (continued)
Consolidated Statement of Financial Position IFRS 15 impact Restated
USD'000 USD'000 USD'000
(Audited) (Unaudited) (Unaudited)
Equity and liabilities
Capital and reserves
Retained earnings 233,646 (7,432) 226,214
Non-controlling interests 93,745 (559) 93,186
Impact on total equity (7,991)
Non-current liabilities
Deferred revenue 53,702 5,829 59,531
Deferred tax liabilities 46,955 211 47,166
Impact on total non-current liabilities 6,040
Current liabilities
Deferred revenue 27,188 1,951 29,139
Impact on total current liabilities 1,951
Changes in accounting policies - IFRS 9 "Financial Instruments"
Additionally, the group adopted consequential amendments to IFRS 7 Financial Instruments: "Disclosures" that were applied to the
disclosures for 2019 and to the comparative period.
The group’s accounting policies for its revenue streams are disclosed in detail in note 2 below. Apart from providing more extensive
disclosures for the group’s revenue transactions, the application of IFRS 15 has had an impact on the financial position of the group as at
1 March 2018. The amount of adjustment for each financial statement line item affected by the application of IFRS 15 is illustrated
below.
The following adjustments were made to the opening balance of equity and deferred revenue on 1 March 2018.
The revenue streams and performance obligations stated above are also in line with those reviewed by the Chief Operating Decision
Maker (CODM) when analysing segment results.
Presentation of assets and liabilities related to contracts with customers
As previously
reported
IFRS 15 uses the terms ‘contract asset’ and ‘contract liability’ to describe what might more commonly be known as ‘accrued revenue’
and ‘deferred revenue’, however the Standard does not prohibit an entity from using alternative descriptions in the statement of
financial position. The group has opted to use accrued revenue and deferred revenue.
In addition to revenue recognition for revenue streams mentioned above, based on the nature of the group's business operations, from
time to time management enters into contracts with customers that include unique contractual terms and other elements that fall
outside of the group's general contract terms and conditions. Such contracts are considered dynamic in nature and encapsulate other
performance obligations which are not in line with the group's main business operations. These contracts are entered into on an ad-hoc
basis for larger contracts and as a result are accounted for separately.
1. The classification and measurement of financial assets and financial liabilities, and
2. Impairment of financial assets.
IFRS 9 introduced new requirements for:
In the current year, the group has applied IFRS 9 Financial Instruments (as revised in July 2014) and the related consequential
amendments to other IFRS Standards that are effective for an annual period that begins on or after 1 January 2018. The transition
provisions of IFRS 9 allow an entity not to restate comparatives and, as such, the transition adjustment in opening retained earnings has
been quantified as described further below. The group has therefore calculated the difference between the previous carrying amounts
and the new carrying amounts at the date of initial application and has recorded these in opening retained earnings as at 1 March 2018.
27
LIQUID TELECOMMUNICATIONS HOLDINGS LIMITED
CONDENSED NOTES TO THE CONSOLIDATED FINANCIAL STATEMENTS (CONTINUED)
for the 12 months ended 28 February 2019
2. Accounting policies (continued)
Changes in accounting policies - IFRS 9 "Financial Instruments" (continued)
(b) Impairment of financial assets
Specifically, IFRS 9 requires the group to recognise a loss allowance for expected credit losses on trade receivables and other receivables
and contract assets.
• debt instruments that are held within a business model whose objective is to collect the contractual cash flows, and that have
contractual cash flows that are solely payments of principal and interest on the principal amount outstanding, are measured
subsequently at amortised cost;
In relation to the impairment of financial assets, IFRS 9 requires the application of an expected credit loss model (ECL) as opposed to an
incurred credit loss model under IAS 39. The expected credit loss model requires the group to account for expected credit losses and
changes in those expected credit losses at each reporting date to reflect changes in credit risk since initial recognition of the financial
assets. It is, therefore no longer necessary for a credit loss event to have occurred before credit losses are recognised.
The date of initial application (i.e. the date on which the group has assessed its existing financial assets and financial liabilities in terms of
the requirements of IFRS 9) is 1 March 2018. Accordingly, the group has applied the requirements of IFRS 9 to instruments that continue
to be recognised as at 1 March 2018 and has not applied the requirements to instruments that have already been derecognised as at 1
March 2018. Comparative amounts in relation to instruments that continue to be recognised as at 1 March 2018 have not been
restated.
Debt instruments that are measured subsequently at amortised cost or at FVTOCI are subject to impairment.
Despite the aforegoing, the group has made an irrevocable election to present subsequent changes in fair value of an equity investment
that is neither held for trading, nor contingent consideration recognised by an acquirer in a business combination, in other
comprehensive income at its initial recognition.
• Previously, under IAS 39, the investments were classified as 'Available-for-sale' and measured at cost. IFRS 9 observes that in limited
circumstances, cost may provide an appropriate estimate of fair value. This would be the case if insufficient more recent information is
available to measure the fair value. The directors considered the requirements of IFRS 9 and are of the opinion that cost is the best
estimate for fair value and have been designated at FVTOCI. The change in fair value on these equity instruments continues to
accumulate in the investment revaluation reserve.
In the current year, the group has not identified any debt investments that meet the amortised cost or fair value through other
comprehensivce income (FVTOCI) criteria as measured at FVTPL.
Specifically:
(a) Classification and measurement of financial assets
The directors of the company have reviewed and have assessed the group’s and the company's existing financial assets as at 1 March
2018 based on the facts and circumstances that existed at that date and concluded that the initial application of IFRS 9 has had the
following impact on the group’s financial assets as regards to their classification and measurement:
Details of these new requirements as well as their impact on the group’s consolidated financial statements are described below.
All recognised financial assets that are within the scope of IFRS 9 have been measured at amortised cost or fair value based on the
entity’s business model for managing the financial assets and the contractual cash flow characteristics of the financial assets.
• equity investments are measured subsequently at fair value through profit or loss (FVTPL).
• Financial assets classified as held‑to‑maturity and loans and receivables under IAS 39 that were measured at amortised cost continue
to be measured at amortised cost under IFRS 9, as they are held within a business model to collect contractual cash flows and these cash
flows consist solely of payments of principal and interest on the principal amount outstanding.
Apart from the above, the application of IFRS 9 has had no impact on the classification and measurement of the group’s financial assets.
28
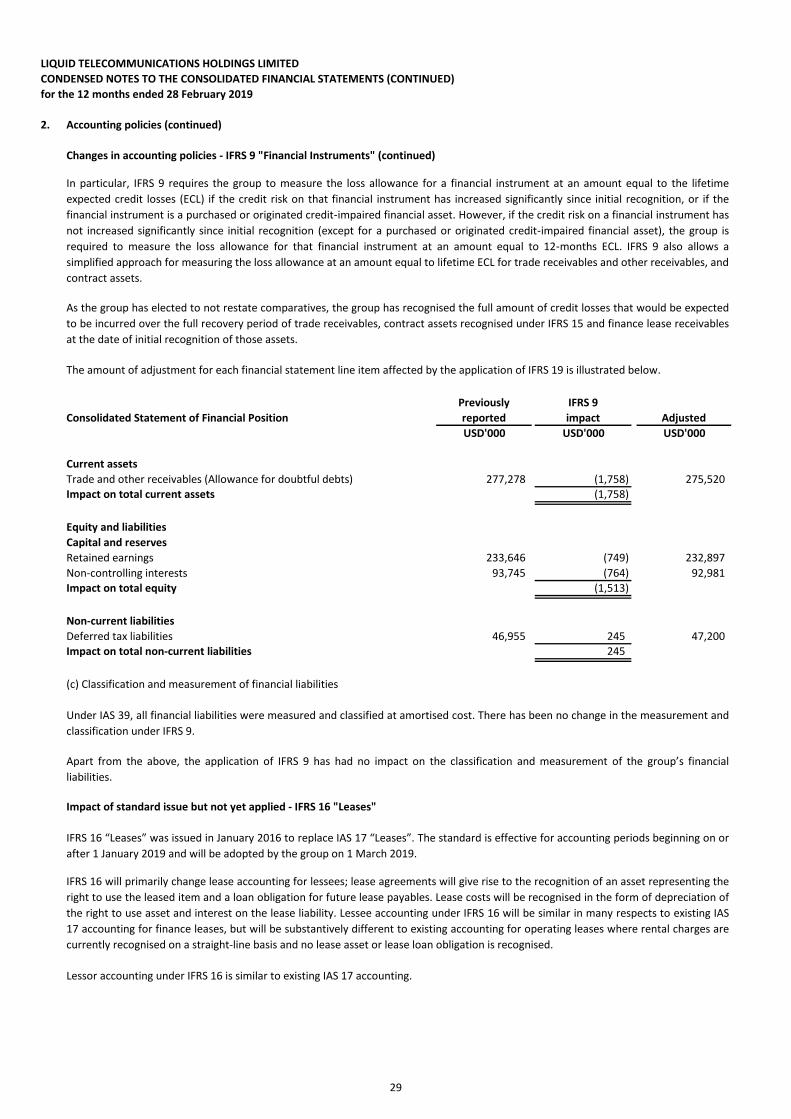
LIQUID TELECOMMUNICATIONS HOLDINGS LIMITED
CONDENSED NOTES TO THE CONSOLIDATED FINANCIAL STATEMENTS (CONTINUED)
for the 12 months ended 28 February 2019
2. Accounting policies (continued)
Changes in accounting policies - IFRS 9 "Financial Instruments" (continued)
Previously IFRS 9
Consolidated Statement of Financial Position reported impact Adjusted
USD'000 USD'000 USD'000
Current assets
Trade and other receivables (Allowance for doubtful debts) 277,278 (1,758) 275,520
Impact on total current assets (1,758)
Equity and liabilities
Capital and reserves
Retained earnings 233,646 (749) 232,897
Non-controlling interests 93,745 (764) 92,981
Impact on total equity (1,513)
Non-current liabilities
Deferred tax liabilities 46,955 245 47,200
Impact on total non-current liabilities 245
Impact of standard issue but not yet applied - IFRS 16 "Leases"
IFRS 16 will primarily change lease accounting for lessees; lease agreements will give rise to the recognition of an asset representing the
right to use the leased item and a loan obligation for future lease payables. Lease costs will be recognised in the form of depreciation of
the right to use asset and interest on the lease liability. Lessee accounting under IFRS 16 will be similar in many respects to existing IAS
17 accounting for finance leases, but will be substantively different to existing accounting for operating leases where rental charges are
currently recognised on a straight-line basis and no lease asset or lease loan obligation is recognised.
Lessor accounting under IFRS 16 is similar to existing IAS 17 accounting.
IFRS 16 “Leases” was issued in January 2016 to replace IAS 17 “Leases”. The standard is effective for accounting periods beginning on or
after 1 January 2019 and will be adopted by the group on 1 March 2019.
(c) Classification and measurement of financial liabilities
Under IAS 39, all financial liabilities were measured and classified at amortised cost. There has been no change in the measurement and
classification under IFRS 9.
Apart from the above, the application of IFRS 9 has had no impact on the classification and measurement of the group’s financial
liabilities.
As the group has elected to not restate comparatives, the group has recognised the full amount of credit losses that would be expected
to be incurred over the full recovery period of trade receivables, contract assets recognised under IFRS 15 and finance lease receivables
at the date of initial recognition of those assets.
In particular, IFRS 9 requires the group to measure the loss allowance for a financial instrument at an amount equal to the lifetime
expected credit losses (ECL) if the credit risk on that financial instrument has increased significantly since initial recognition, or if the
financial instrument is a purchased or originated credit‑impaired financial asset. However, if the credit risk on a financial instrument has
not increased significantly since initial recognition (except for a purchased or originated credit‑impaired financial asset), the group is
required to measure the loss allowance for that financial instrument at an amount equal to 12‑months ECL. IFRS 9 also allows a
simplified approach for measuring the loss allowance at an amount equal to lifetime ECL for trade receivables and other receivables, and
contract assets.
The amount of adjustment for each financial statement line item affected by the application of IFRS 19 is illustrated below.
29
LIQUID TELECOMMUNICATIONS HOLDINGS LIMITED
CONDENSED NOTES TO THE CONSOLIDATED FINANCIAL STATEMENTS (CONTINUED)
for the 12 months ended 28 February 2019
2. Accounting policies (continued)
Critical accounting judgements and key sources of estimation uncertainty
Material judgements
Application of IFRS 15 "Revenue from Contracts with Customers"
The group is assessing the impact of the accounting changes that will arise under IFRS 16; however, the following changes to lessee
accounting will have a material impact as follows:
The directors anticipate that these IFRSs will be applied on their effective dates in the financial statements of future periods. The
directors have not yet assessed the potential impact of the application of these amendments, other than those mentioned above.
The lease payment for the year ended 28 February 2019 was USD 19.7 million (2018: USD 30.0 million).
• Liabilities will be recorded for future lease payments in the group’s consolidated statement of financial position for the “reasonably
certain” period of the lease, which may include future lease periods for which the group has extension options. Currently liabilities are
generally not recorded for future operating lease payments, which are disclosed as commitments. The amount of lease liabilities will not
equal the lease commitments reported on 28 February 2019.
• Lease expenses will be for depreciation of right-of-use assets and interest on lease liabilities; interest will typically be higher in the
early stages of a lease and reduce over the term. Currently operating lease rentals are expensed on a straight-line basis over the lease
term.
• Operating lease cash flows are currently included within operating cash flows in the consolidated statement of cash flows; under IFRS
16 these will be recorded as cash flows from financing activities reflecting the repayment of lease liabilities (borrowings) and related
interest.
• Right-of-use assets will be recorded for assets that are leased by the group; currently no lease assets are included on the group’s
consolidated statement of financial position for operating leases.
In making their judgement, the directors considered the detailed criteria for the recognition of revenue set out in IFRS 15 "Revenue from
Contracts with Customers" and whether the group had transferred control of the goods and rendered the services to the customer,
which would result in the satisfaction of the performance obligation. The directors are satisfied that control has been transferred and
that recognition of the revenue in the current year is appropriate.
Depending on the adoption method that is utilised, certain practical expedients may be applied on adoption. The group plans to apply
the cumulative restropective approach.
A high volume of transactions will be impacted by IFRS 16 and material judgements are required in identifying and accounting for leases.
Therefore, the group is continuing to assess the impact of these and other accounting changes that will arise under IFRS 16 and cannot
reasonably estimate the impact; however, the changes highlighted above will have a material impact on the consolidated income
statement, consolidated statement of financial position and consolidated statement of cash flows after the group’s adoption on 1 March
2019.
When IFRS 16 is adopted, it can be applied either on a fully retrospective basis, requiring the restatement of the comparative periods
presented in the financial statements, or with the cumulative retrospective impact of IFRS 16 applied as an adjustment to equity on the
date of adoption; when the latter approach is applied it is necessary to disclose the impact of IFRS 16 on each line item in the financial
statements in the reporting period.
The significant accounting judgements and critical estimates applied by the group in the preparation of these condensed consolidated
financial statements presented are in accordance with IFRS and are consistent with those applied by the group in the preparation of the
consolidated financial statements for the year ended 28 February 2018. In addition, the following significant accounting judgements and
critical estimates have also been made:
30
LIQUID TELECOMMUNICATIONS HOLDINGS LIMITED
CONDENSED NOTES TO THE CONSOLIDATED FINANCIAL STATEMENTS (CONTINUED)
for the 12 months ended 28 February 2019
2. Accounting policies (continued)
Critical accounting judgements and key sources of estimation uncertainty (continued)
Material judgements (continued)
Application of IFRS 9 "Financial Instruments"
Material estimates
Royal Bafokeng Holdings - On sale agreement
Residual value and useful life
Deferred taxation assets
Impairment of goodwill
The group recognises the net future tax benefit related to deferred tax assets to the extent that it is probable that taxable profit will be
available against which the deductible temporary differences can be utilised. Assessing the recoverability of deferred tax assets requires
the company to make significant estimates related to expectations of future taxable income. Estimates of future taxable income are
based on forecast cash flows from operations and the application of existing tax laws in each jurisdiction. To the extent that future cash
flows and taxable income differ significantly from estimates, the ability of the company to realise the net deferred tax assets recorded at
the reporting date could be impacted. Additionally, future changes in tax laws in the jurisdictions in which the group operates could limit
the ability of the company to obtain tax deductions in future periods.
Determining whether goodwill is impaired requires an estimation of the value in use of the cash-generating units to which the goodwill
has been allocated. The value in use calculation requires the directors to estimate the future cash flows expected to arise from the cash-
generating unit and a suitable discount rate in order to calculate present value of the recoverable amount.
• Classification of financial assets: The group uses judgement in the assessment of the business model within which the non-equity
financial assets are held and assessment of whether the contractual terms of such financial asset are solely payments of principal and
interest on the principal amounts outstanding.
• Valuation of investments: Previously, under IAS 39, the investments were classified as 'Available-for-sale' and measured at cost. As of
1 March 2018, under the new standard, IFRS 9 observes that in limited circumstances, cost may provide an appropriate estimate of fair
value. This would be the case if insufficient more recent information is available to measure the fair value. The directors considered the
requirements of IFRS 9 and are of the opinion that cost is the best estimate for fair value.
• Impairment: The loss allowances for financial assets are based on the use of forward-looking information and on the assumptions
about risk and probability of default and expected loss rates. The group uses judgement and estimates in making these assumptions and
selecting the inputs to the impairment calculation, based on the group’s past history, existing market conditions as well as forward
looking estimates at the end of each reporting period.
The group depreciates its assets over their estimated useful lives taking into account residual values, which, in compliance with of IAS 16
Property, plant and equipment (revised), are re-assessed on an annual basis. The actual lives and residual values of these assets can vary
depending on a variety of factors.
Technological innovation, product life cycles and maintenance programmes all impact the useful lives and residual values of the assets.
Residual value assessments consider issues such as future market conditions, the remaining life of the asset and projected disposal
values.
In October 2017, the company entered into a subscription, a share repurchase agreement and a sale agreement with Royal Bafokeng
Holding Limited (“RBH”). The agreements include an “On-Sale” clause whereby the company will issue additional shares if the price per
share is below an agreed price. Management has carried out an assessment of the current estimated market price compared to the
agreed price and is of the opinion that there is no financial implication as at 28 February 2019. Management have considered a range of
scenarios and as an illustration, should the market price be 5% below the agreed price the prescribed calculations indicate an additional
USD 1.2 million of share value will be issued to RBH and if 10% below the agree price an additional USD 2.2 million of share value will be
issued to RBH.
31
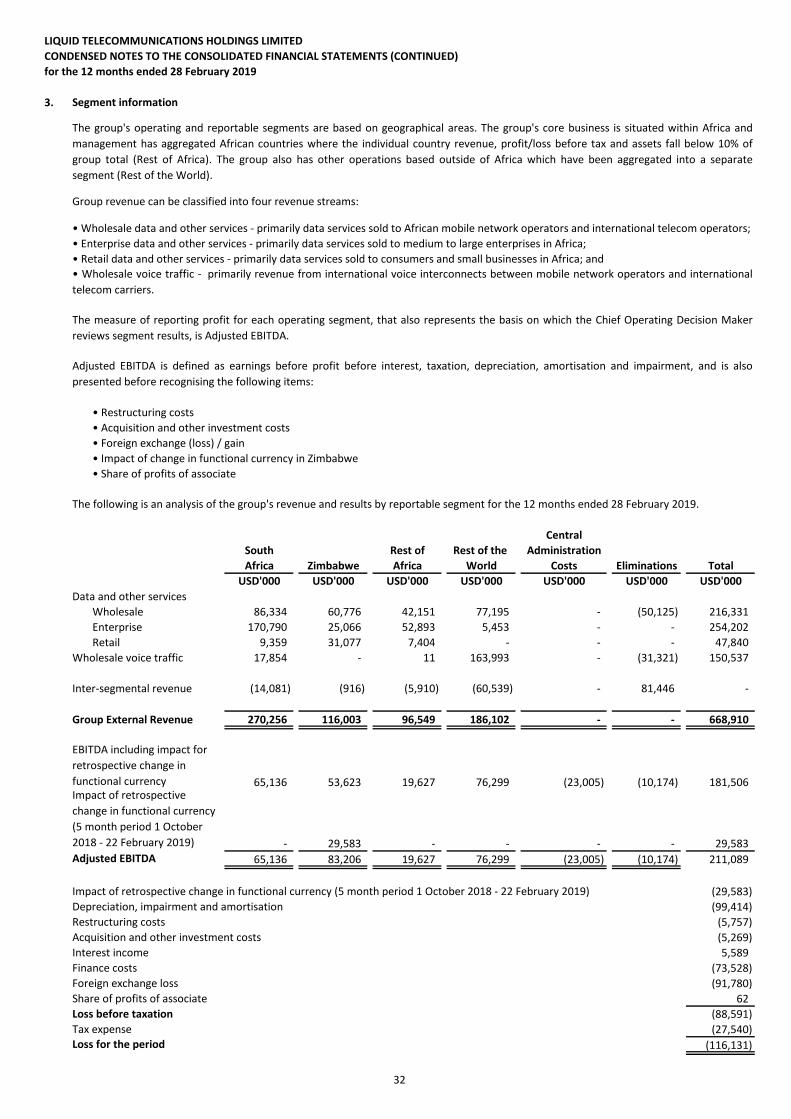
LIQUID TELECOMMUNICATIONS HOLDINGS LIMITED
CONDENSED NOTES TO THE CONSOLIDATED FINANCIAL STATEMENTS (CONTINUED)
for the 12 months ended 28 February 2019
3. Segment information
• Restructuring costs
• Acquisition and other investment costs
• Foreign exchange (loss) / gain
• Impact of change in functional currency in Zimbabwe
• Share of profits of associate
Central
South Rest of Rest of the Administration
Africa Zimbabwe Africa World Costs Eliminations Total
USD'000 USD'000 USD'000 USD'000 USD'000 USD'000 USD'000
Data and other services
Wholesale 86,334 60,776 42,151 77,195 - (50,125) 216,331
Enterprise 170,790 25,066 52,893 5,453 - - 254,202
Retail 9,359 31,077 7,404 - - - 47,840
Wholesale voice traffic 17,854 - 11 163,993 - (31,321) 150,537
Inter-segmental revenue (14,081) (916) (5,910) (60,539) - 81,446 -
Group External Revenue 270,256 116,003 96,549 186,102 - - 668,910
65,136 53,623 19,627 76,299 (23,005) (10,174) 181,506
- 29,583 - - - - 29,583Adjusted EBITDA 65,136 83,206 19,627 76,299 (23,005) (10,174) 211,089
Impact of retrospective change in functional currency (5 month period 1 October 2018 - 22 February 2019) (29,583)
Depreciation, impairment and amortisation (99,414)
Restructuring costs (5,757)
Acquisition and other investment costs (5,269)
Interest income 5,589
Finance costs (73,528)
Foreign exchange loss (91,780)
Share of profits of associate 62
Loss before taxation (88,591)
Tax expense (27,540)Loss for the period (116,131)
• Wholesale voice traffic - primarily revenue from international voice interconnects between mobile network operators and international
telecom carriers.
Group revenue can be classified into four revenue streams:
The measure of reporting profit for each operating segment, that also represents the basis on which the Chief Operating Decision Maker
reviews segment results, is Adjusted EBITDA.
The group's operating and reportable segments are based on geographical areas. The group's core business is situated within Africa and
management has aggregated African countries where the individual country revenue, profit/loss before tax and assets fall below 10% of
group total (Rest of Africa). The group also has other operations based outside of Africa which have been aggregated into a separate
segment (Rest of the World).
The following is an analysis of the group's revenue and results by reportable segment for the 12 months ended 28 February 2019.
Adjusted EBITDA is defined as earnings before profit before interest, taxation, depreciation, amortisation and impairment, and is also
presented before recognising the following items:
EBITDA including impact for
retrospective change in
functional currencyImpact of retrospective
change in functional currency
(5 month period 1 October
2018 - 22 February 2019)
• Wholesale data and other services - primarily data services sold to African mobile network operators and international telecom operators;
• Enterprise data and other services - primarily data services sold to medium to large enterprises in Africa;
• Retail data and other services - primarily data services sold to consumers and small businesses in Africa; and
32
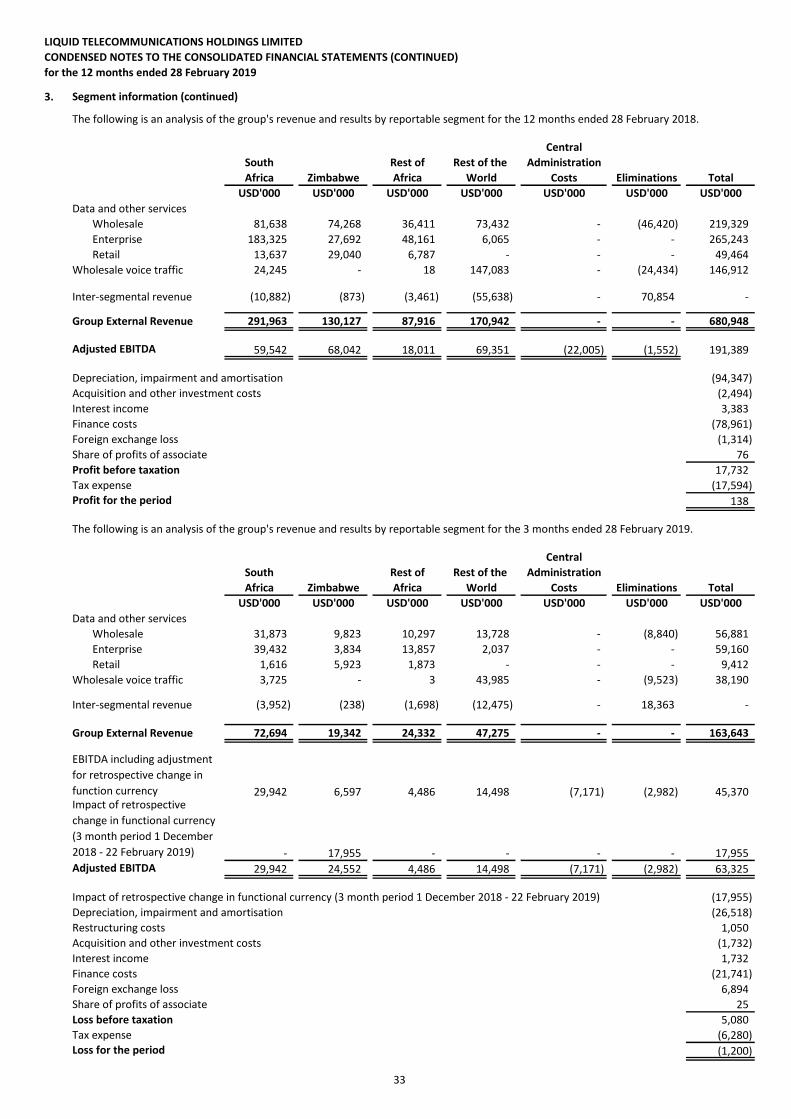
LIQUID TELECOMMUNICATIONS HOLDINGS LIMITED
CONDENSED NOTES TO THE CONSOLIDATED FINANCIAL STATEMENTS (CONTINUED)
for the 12 months ended 28 February 2019
3. Segment information (continued)
Central
South Rest of Rest of the Administration
Africa Zimbabwe Africa World Costs Eliminations Total
USD'000 USD'000 USD'000 USD'000 USD'000 USD'000 USD'000
Data and other services
Wholesale 81,638 74,268 36,411 73,432 - (46,420) 219,329
Enterprise 183,325 27,692 48,161 6,065 - - 265,243
Retail 13,637 29,040 6,787 - - - 49,464
Wholesale voice traffic 24,245 - 18 147,083 - (24,434) 146,912
Inter-segmental revenue (10,882) (873) (3,461) (55,638) - 70,854 -
Group External Revenue 291,963 130,127 87,916 170,942 - - 680,948
Adjusted EBITDA 59,542 68,042 18,011 69,351 (22,005) (1,552) 191,389
Depreciation, impairment and amortisation (94,347)
Acquisition and other investment costs (2,494)
Interest income 3,383
Finance costs (78,961)
Foreign exchange loss (1,314)
Share of profits of associate 76
Profit before taxation 17,732
Tax expense (17,594)Profit for the period 138
Central
South Rest of Rest of the Administration
Africa Zimbabwe Africa World Costs Eliminations Total
USD'000 USD'000 USD'000 USD'000 USD'000 USD'000 USD'000
Data and other services
Wholesale 31,873 9,823 10,297 13,728 - (8,840) 56,881
Enterprise 39,432 3,834 13,857 2,037 - - 59,160
Retail 1,616 5,923 1,873 - - - 9,412
Wholesale voice traffic 3,725 - 3 43,985 - (9,523) 38,190
Inter-segmental revenue (3,952) (238) (1,698) (12,475) - 18,363 -
Group External Revenue 72,694 19,342 24,332 47,275 - - 163,643
29,942 6,597 4,486 14,498 (7,171) (2,982) 45,370
- 17,955 - - - - 17,955Adjusted EBITDA 29,942 24,552 4,486 14,498 (7,171) (2,982) 63,325
Impact of retrospective change in functional currency (3 month period 1 December 2018 - 22 February 2019) (17,955)
Depreciation, impairment and amortisation (26,518)
Restructuring costs 1,050
Acquisition and other investment costs (1,732)
Interest income 1,732
Finance costs (21,741)
Foreign exchange loss 6,894
Share of profits of associate 25
Loss before taxation 5,080
Tax expense (6,280)Loss for the period (1,200)
The following is an analysis of the group's revenue and results by reportable segment for the 3 months ended 28 February 2019.
EBITDA including adjustment
for retrospective change in
function currencyImpact of retrospective
change in functional currency
(3 month period 1 December
2018 - 22 February 2019)
The following is an analysis of the group's revenue and results by reportable segment for the 12 months ended 28 February 2018.
33
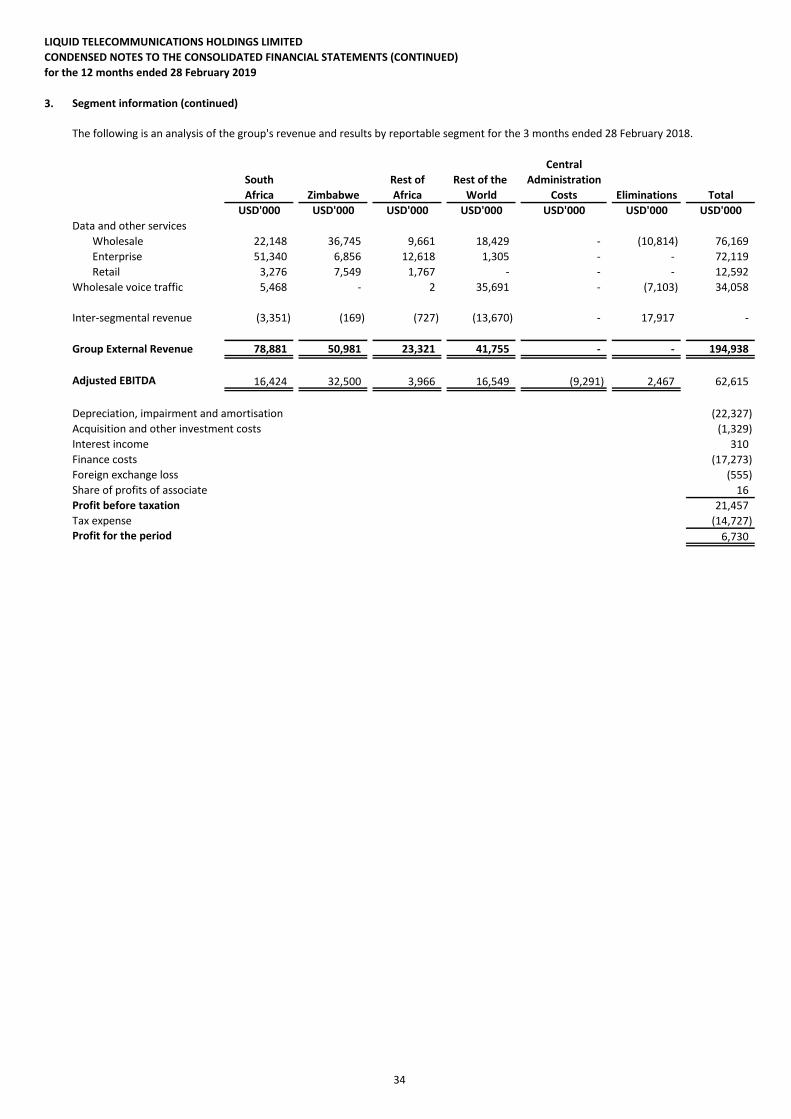
LIQUID TELECOMMUNICATIONS HOLDINGS LIMITED
CONDENSED NOTES TO THE CONSOLIDATED FINANCIAL STATEMENTS (CONTINUED)
for the 12 months ended 28 February 2019
3. Segment information (continued)
Central
South Rest of Rest of the Administration
Africa Zimbabwe Africa World Costs Eliminations Total
USD'000 USD'000 USD'000 USD'000 USD'000 USD'000 USD'000
Data and other services
Wholesale 22,148 36,745 9,661 18,429 - (10,814) 76,169
Enterprise 51,340 6,856 12,618 1,305 - - 72,119
Retail 3,276 7,549 1,767 - - - 12,592
Wholesale voice traffic 5,468 - 2 35,691 - (7,103) 34,058
Inter-segmental revenue (3,351) (169) (727) (13,670) - 17,917 -
Group External Revenue 78,881 50,981 23,321 41,755 - - 194,938
Adjusted EBITDA 16,424 32,500 3,966 16,549 (9,291) 2,467 62,615
Depreciation, impairment and amortisation (22,327)
Acquisition and other investment costs (1,329)
Interest income 310
Finance costs (17,273)
Foreign exchange loss (555)
Share of profits of associate 16
Profit before taxation 21,457
Tax expense (14,727)Profit for the period 6,730
The following is an analysis of the group's revenue and results by reportable segment for the 3 months ended 28 February 2018.
34
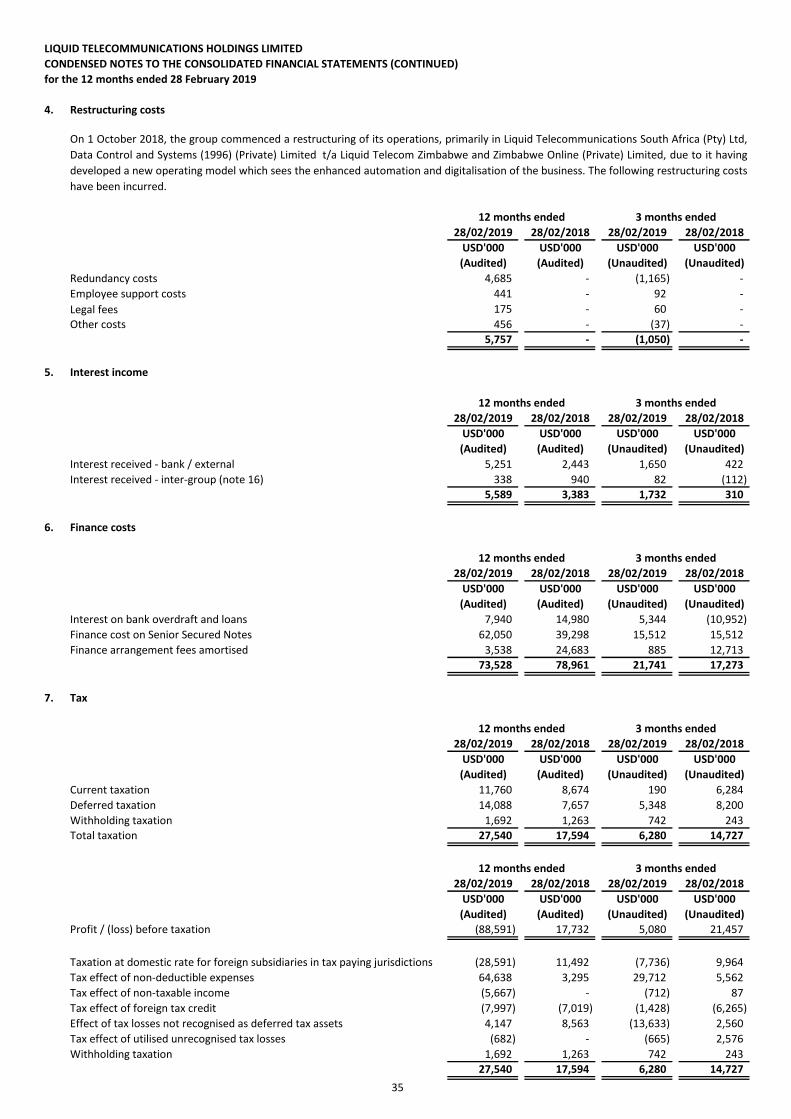
LIQUID TELECOMMUNICATIONS HOLDINGS LIMITED
CONDENSED NOTES TO THE CONSOLIDATED FINANCIAL STATEMENTS (CONTINUED)
for the 12 months ended 28 February 2019
4. Restructuring costs
28/02/2019 28/02/2018 28/02/2019 28/02/2018
USD'000 USD'000 USD'000 USD'000
(Audited) (Audited) (Unaudited) (Unaudited)
Redundancy costs 4,685 - (1,165) -
Employee support costs 441 - 92 -
Legal fees 175 - 60 -
Other costs 456 - (37) -
5,757 - (1,050) -
5. Interest income
28/02/2019 28/02/2018 28/02/2019 28/02/2018
USD'000 USD'000 USD'000 USD'000
(Audited) (Audited) (Unaudited) (Unaudited)
INTRECEXTInterest received - bank / external 5,251 2,443 1,650 422
INTRECICInterest received - inter-group (note 16) 338 940 82 (112)
5,589 3,383 1,732 310
6. Finance costs
28/02/2019 28/02/2018 28/02/2019 28/02/2018
USD'000 USD'000 USD'000 USD'000
(Audited) (Audited) (Unaudited) (Unaudited)
INTPDEXTInterest on bank overdraft and loans 7,940 14,980 5,344 (10,952)
INTPDBONDFinance cost on Senior Secured Notes 62,050 39,298 15,512 15,512
FINCHGWOFFFinance arrangement fees amortised 3,538 24,683 885 12,713
73,528 78,961 21,741 17,273
7. Tax
28/02/2019 28/02/2018 28/02/2019 28/02/2018
USD'000 USD'000 USD'000 USD'000
(Audited) (Audited) (Unaudited) (Unaudited)
CORPTAXCurrent taxation 11,760 8,674 190 6,284
DEFTAXDeferred taxation 14,088 7,657 5,348 8,200
WHTAXWithholding taxation 1,692 1,263 742 243
Total taxation 27,540 17,594 6,280 14,727
28/02/2019 28/02/2018 28/02/2019 28/02/2018
USD'000 USD'000 USD'000 USD'000
(Audited) (Audited) (Unaudited) (Unaudited)
Profit / (loss) before taxation (88,591) 17,732 5,080 21,457
Taxation at domestic rate for foreign subsidiaries in tax paying jurisdictions (28,591) 11,492 (7,736) 9,964
Tax effect of non-deductible expenses 64,638 3,295 29,712 5,562
Tax effect of non-taxable income (5,667) - (712) 87
Tax effect of foreign tax credit (7,997) (7,019) (1,428) (6,265)
Effect of tax losses not recognised as deferred tax assets 4,147 8,563 (13,633) 2,560
Tax effect of utilised unrecognised tax losses (682) - (665) 2,576
Withholding taxation 1,692 1,263 742 243
27,540 17,594 6,280 14,727
12 months ended
12 months ended
12 months ended
12 months ended
3 months ended
12 months ended 3 months ended
On 1 October 2018, the group commenced a restructuring of its operations, primarily in Liquid Telecommunications South Africa (Pty) Ltd,
Data Control and Systems (1996) (Private) Limited t/a Liquid Telecom Zimbabwe and Zimbabwe Online (Private) Limited, due to it having
developed a new operating model which sees the enhanced automation and digitalisation of the business. The following restructuring costs
have been incurred.
3 months ended
3 months ended
3 months ended
35
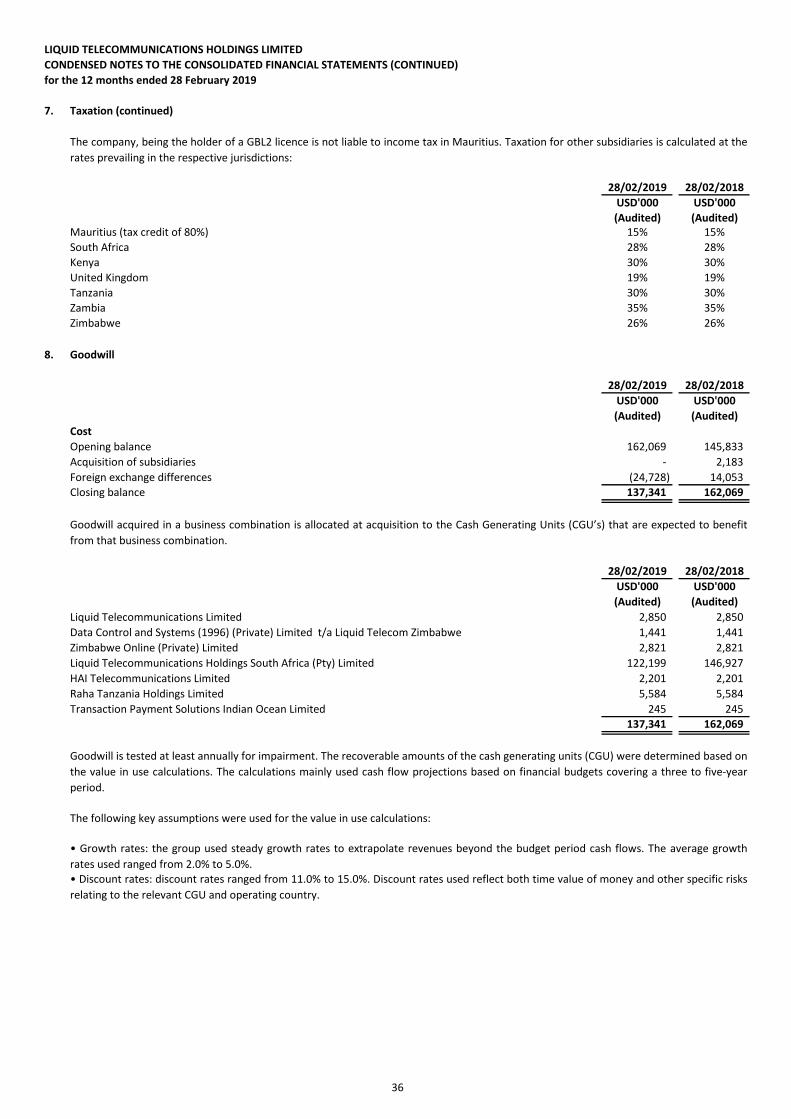
LIQUID TELECOMMUNICATIONS HOLDINGS LIMITED
CONDENSED NOTES TO THE CONSOLIDATED FINANCIAL STATEMENTS (CONTINUED)
for the 12 months ended 28 February 2019
7. Taxation (continued)
28/02/2019 28/02/2018
USD'000 USD'000
(Audited) (Audited)Mauritius (tax credit of 80%) 15% 15%
South Africa 28% 28%
Kenya 30% 30%
United Kingdom 19% 19%
Tanzania 30% 30%
Zambia 35% 35%
Zimbabwe 26% 26%
8.
28/02/2019 28/02/2018
USD'000 USD'000
(Audited) (Audited)
Cost
Opening balance 162,069 145,833
Acquisition of subsidiaries - 2,183
Foreign exchange differences (24,728) 14,053
Closing balance 137,341 162,069
28/02/2019 28/02/2018
USD'000 USD'000
(Audited) (Audited)
GWLTUKLiquid Telecommunications Limited 2,850 2,850
GWLTZData Control and Systems (1996) (Private) Limited t/a Liquid Telecom Zimbabwe 1,441 1,441
GWLTZOLZimbabwe Online (Private) Limited 2,821 2,821
GWNEOLiquid Telecommunications Holdings South Africa (Pty) Limited 122,199 146,927
GWRBSLHAI Telecommunications Limited 2,201 2,201
GWRTHLRaha Tanzania Holdings Limited 5,584 5,584
GWTPSIOTransaction Payment Solutions Indian Ocean Limited 245 245
137,341 162,069
The company, being the holder of a GBL2 licence is not liable to income tax in Mauritius. Taxation for other subsidiaries is calculated at the
rates prevailing in the respective jurisdictions:
• Discount rates: discount rates ranged from 11.0% to 15.0%. Discount rates used reflect both time value of money and other specific risks
relating to the relevant CGU and operating country.
Goodwill
Goodwill acquired in a business combination is allocated at acquisition to the Cash Generating Units (CGU’s) that are expected to benefit
from that business combination.
Goodwill is tested at least annually for impairment. The recoverable amounts of the cash generating units (CGU) were determined based on
the value in use calculations. The calculations mainly used cash flow projections based on financial budgets covering a three to five-year
period.
The following key assumptions were used for the value in use calculations:
• Growth rates: the group used steady growth rates to extrapolate revenues beyond the budget period cash flows. The average growth
rates used ranged from 2.0% to 5.0%.
36
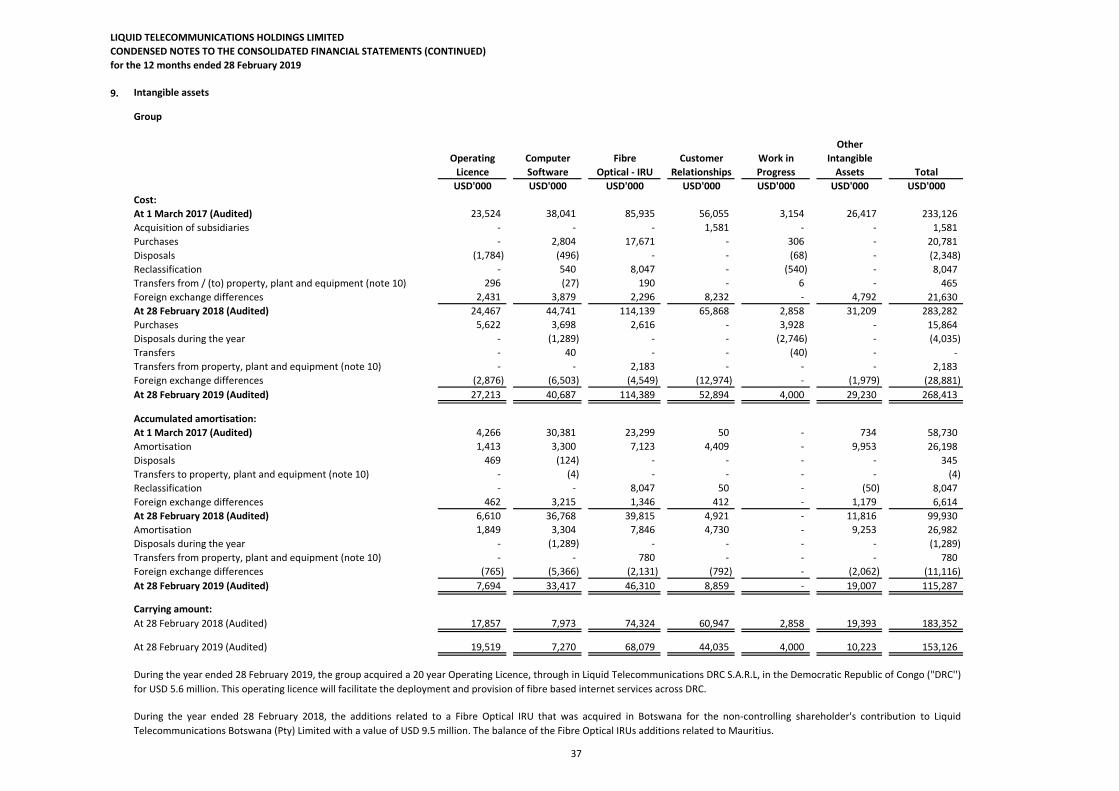
LIQUID TELECOMMUNICATIONS HOLDINGS LIMITED
CONDENSED NOTES TO THE CONSOLIDATED FINANCIAL STATEMENTS (CONTINUED)
for the 12 months ended 28 February 2019
9.
Group
Other
Operating Computer Fibre Customer Work in Intangible
Licence Software Optical - IRU Relationships Progress Assets Total
USD'000 USD'000 USD'000 USD'000 USD'000 USD'000 USD'000
Cost:
At 1 March 2017 (Audited) 23,524 38,041 85,935 56,055 3,154 26,417 233,126
Acquisition of subsidiaries - - - 1,581 - - 1,581
Purchases - 2,804 17,671 - 306 - 20,781
Disposals (1,784) (496) - - (68) - (2,348)
Reclassification - 540 8,047 - (540) - 8,047
Transfers from / (to) property, plant and equipment (note 10) 296 (27) 190 - 6 - 465
Foreign exchange differences 2,431 3,879 2,296 8,232 - 4,792 21,630
At 28 February 2018 (Audited) 24,467 44,741 114,139 65,868 2,858 31,209 283,282
Purchases 5,622 3,698 2,616 - 3,928 - 15,864
Disposals during the year - (1,289) - - (2,746) - (4,035)
Transfers - 40 - - (40) - -
Transfers from property, plant and equipment (note 10) - - 2,183 - - - 2,183
Foreign exchange differences (2,876) (6,503) (4,549) (12,974) - (1,979) (28,881)
At 28 February 2019 (Audited) 27,213 40,687 114,389 52,894 4,000 29,230 268,413
Accumulated amortisation:
At 1 March 2017 (Audited) 4,266 30,381 23,299 50 - 734 58,730
Amortisation 1,413 3,300 7,123 4,409 - 9,953 26,198
Disposals 469 (124) - - - - 345
Transfers to property, plant and equipment (note 10) - (4) - - - - (4)
Reclassification - - 8,047 50 - (50) 8,047
Foreign exchange differences 462 3,215 1,346 412 - 1,179 6,614
At 28 February 2018 (Audited) 6,610 36,768 39,815 4,921 - 11,816 99,930
Amortisation 1,849 3,304 7,846 4,730 - 9,253 26,982
Disposals during the year - (1,289) - - - - (1,289)
Transfers from property, plant and equipment (note 10) - - 780 - - - 780
Foreign exchange differences (765) (5,366) (2,131) (792) - (2,062) (11,116)
At 28 February 2019 (Audited) 7,694 33,417 46,310 8,859 - 19,007 115,287
Carrying amount:
At 28 February 2018 (Audited) 17,857 7,973 74,324 60,947 2,858 19,393 183,352
At 28 February 2019 (Audited) 19,519 7,270 68,079 44,035 4,000 10,223 153,126
Intangible assets
During the year ended 28 February 2019, the group acquired a 20 year Operating Licence, through in Liquid Telecommunications DRC S.A.R.L, in the Democratic Republic of Congo ("DRC'')
for USD 5.6 million. This operating licence will facilitate the deployment and provision of fibre based internet services across DRC.
During the year ended 28 February 2018, the additions related to a Fibre Optical IRU that was acquired in Botswana for the non-controlling shareholder's contribution to Liquid
Telecommunications Botswana (Pty) Limited with a value of USD 9.5 million. The balance of the Fibre Optical IRUs additions related to Mauritius.
37
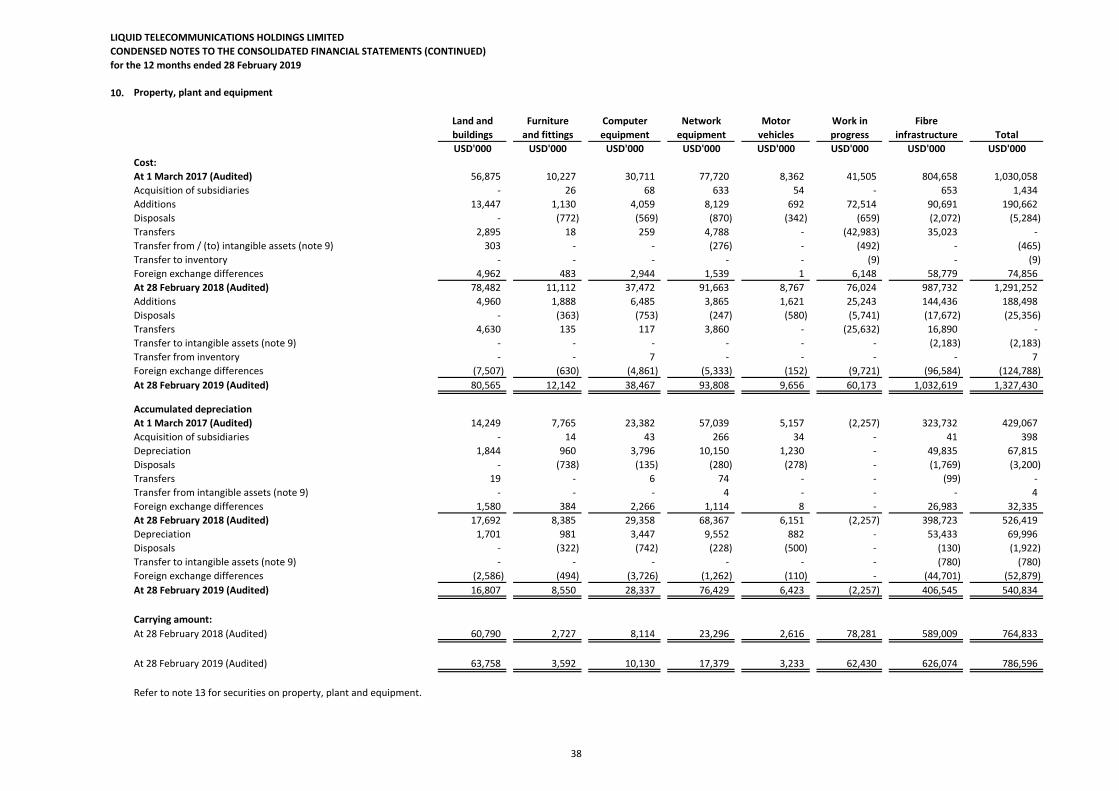
LIQUID TELECOMMUNICATIONS HOLDINGS LIMITED
CONDENSED NOTES TO THE CONSOLIDATED FINANCIAL STATEMENTS (CONTINUED)
for the 12 months ended 28 February 2019
10.
Land and Furniture Computer Network Motor Work in Fibre
buildings and fittings equipment equipment vehicles progress infrastructure Total
USD'000 USD'000 USD'000 USD'000 USD'000 USD'000 USD'000 USD'000
Cost:
At 1 March 2017 (Audited) 56,875 10,227 30,711 77,720 8,362 41,505 804,658 1,030,058
Acquisition of subsidiaries - 26 68 633 54 - 653 1,434
Additions 13,447 1,130 4,059 8,129 692 72,514 90,691 190,662
Disposals - (772) (569) (870) (342) (659) (2,072) (5,284)
Transfers 2,895 18 259 4,788 - (42,983) 35,023 -
Transfer from / (to) intangible assets (note 9) 303 - - (276) - (492) - (465)
Transfer to inventory - - - - - (9) - (9)
Foreign exchange differences 4,962 483 2,944 1,539 1 6,148 58,779 74,856
At 28 February 2018 (Audited) 78,482 11,112 37,472 91,663 8,767 76,024 987,732 1,291,252
Additions 4,960 1,888 6,485 3,865 1,621 25,243 144,436 188,498
Disposals - (363) (753) (247) (580) (5,741) (17,672) (25,356)
Transfers 4,630 135 117 3,860 - (25,632) 16,890 -
Transfer to intangible assets (note 9) - - - - - - (2,183) (2,183)
Transfer from inventory - - 7 - - - - 7
Foreign exchange differences (7,507) (630) (4,861) (5,333) (152) (9,721) (96,584) (124,788)
At 28 February 2019 (Audited) 80,565 12,142 38,467 93,808 9,656 60,173 1,032,619 1,327,430
Accumulated depreciation
At 1 March 2017 (Audited) 14,249 7,765 23,382 57,039 5,157 (2,257) 323,732 429,067
Acquisition of subsidiaries - 14 43 266 34 - 41 398
Depreciation 1,844 960 3,796 10,150 1,230 - 49,835 67,815
Disposals - (738) (135) (280) (278) - (1,769) (3,200)
Transfers 19 - 6 74 - - (99) -
Transfer from intangible assets (note 9) - - - 4 - - - 4
Foreign exchange differences 1,580 384 2,266 1,114 8 - 26,983 32,335
At 28 February 2018 (Audited) 17,692 8,385 29,358 68,367 6,151 (2,257) 398,723 526,419
Depreciation 1,701 981 3,447 9,552 882 - 53,433 69,996
Disposals - (322) (742) (228) (500) - (130) (1,922)
Transfer to intangible assets (note 9) - - - - - - (780) (780)
Foreign exchange differences (2,586) (494) (3,726) (1,262) (110) - (44,701) (52,879)
At 28 February 2019 (Audited) 16,807 8,550 28,337 76,429 6,423 (2,257) 406,545 540,834
Carrying amount:
At 28 February 2018 (Audited) 60,790 2,727 8,114 23,296 2,616 78,281 589,009 764,833
At 28 February 2019 (Audited) 63,758 3,592 10,130 17,379 3,233 62,430 626,074 786,596
Refer to note 13 for securities on property, plant and equipment.
Property, plant and equipment
38
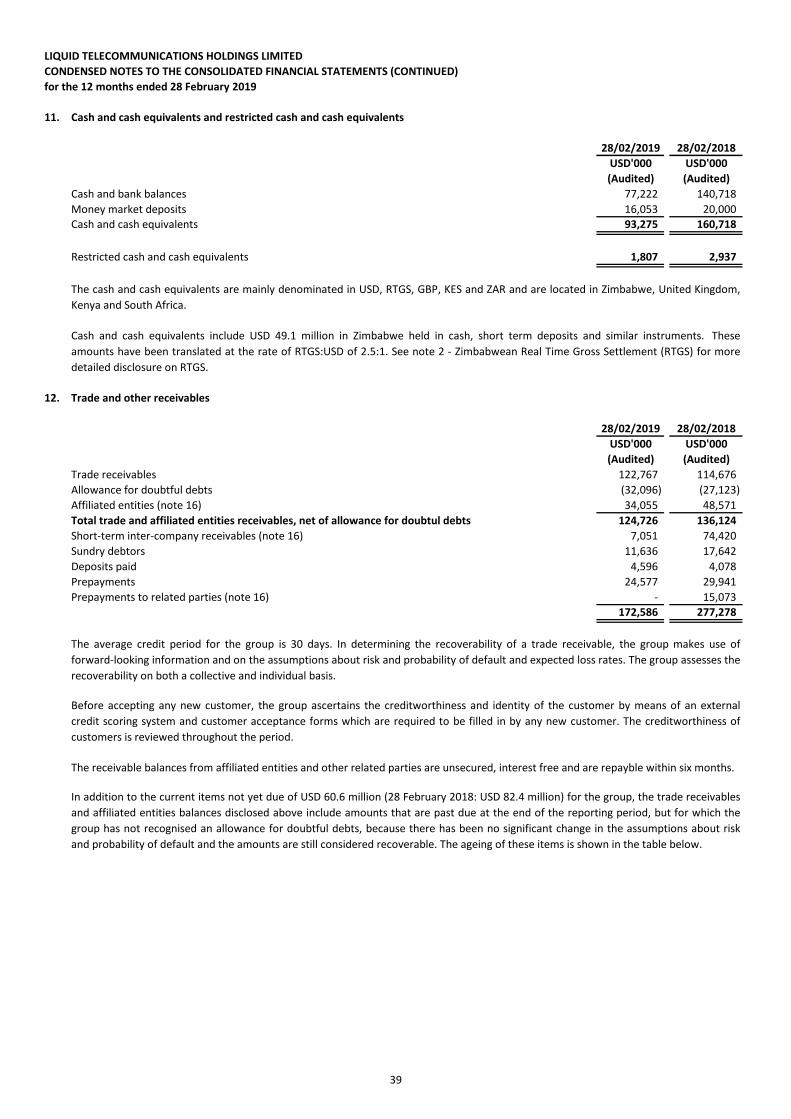
LIQUID TELECOMMUNICATIONS HOLDINGS LIMITED
CONDENSED NOTES TO THE CONSOLIDATED FINANCIAL STATEMENTS (CONTINUED)
for the 12 months ended 28 February 2019
11. Cash and cash equivalents and restricted cash and cash equivalents
28/02/2019 28/02/2018
USD'000 USD'000
(Audited) (Audited)
CASHCash and bank balances 77,222 140,718
Money market deposits 16,053 20,000
Cash and cash equivalents 93,275 160,718
Restricted cash and cash equivalents 1,807 2,937
12. Trade and other receivables
28/02/2019 28/02/2018
USD'000 USD'000
(Audited) (Audited)
TRDRECEXTTrade receivables 122,767 114,676
PROVBDAllowance for doubtful debts (32,096) (27,123)
TRDRECICAffiliated entities (note 16) 34,055 48,571
Total trade and affiliated entities receivables, net of allowance for doubtul debts 124,726 136,124
STLICRECShort-term inter-company receivables (note 16) 7,051 74,420
SUNDRSSundry debtors 11,636 17,642
DEPPDDeposits paid 4,596 4,078
PPMTSPrepayments 24,577 29,941
OTHRECPrepayments to related parties (note 16) - 15,073
172,586 277,278
Cash and cash equivalents include USD 49.1 million in Zimbabwe held in cash, short term deposits and similar instruments. These
amounts have been translated at the rate of RTGS:USD of 2.5:1. See note 2 - Zimbabwean Real Time Gross Settlement (RTGS) for more
detailed disclosure on RTGS.
The cash and cash equivalents are mainly denominated in USD, RTGS, GBP, KES and ZAR and are located in Zimbabwe, United Kingdom,
Kenya and South Africa.
In addition to the current items not yet due of USD 60.6 million (28 February 2018: USD 82.4 million) for the group, the trade receivables
and affiliated entities balances disclosed above include amounts that are past due at the end of the reporting period, but for which the
group has not recognised an allowance for doubtful debts, because there has been no significant change in the assumptions about risk
and probability of default and the amounts are still considered recoverable. The ageing of these items is shown in the table below.
The receivable balances from affiliated entities and other related parties are unsecured, interest free and are repayble within six months.
Before accepting any new customer, the group ascertains the creditworthiness and identity of the customer by means of an external
credit scoring system and customer acceptance forms which are required to be filled in by any new customer. The creditworthiness of
customers is reviewed throughout the period.
The average credit period for the group is 30 days. In determining the recoverability of a trade receivable, the group makes use of
forward-looking information and on the assumptions about risk and probability of default and expected loss rates. The group assesses the
recoverability on both a collective and individual basis.
39
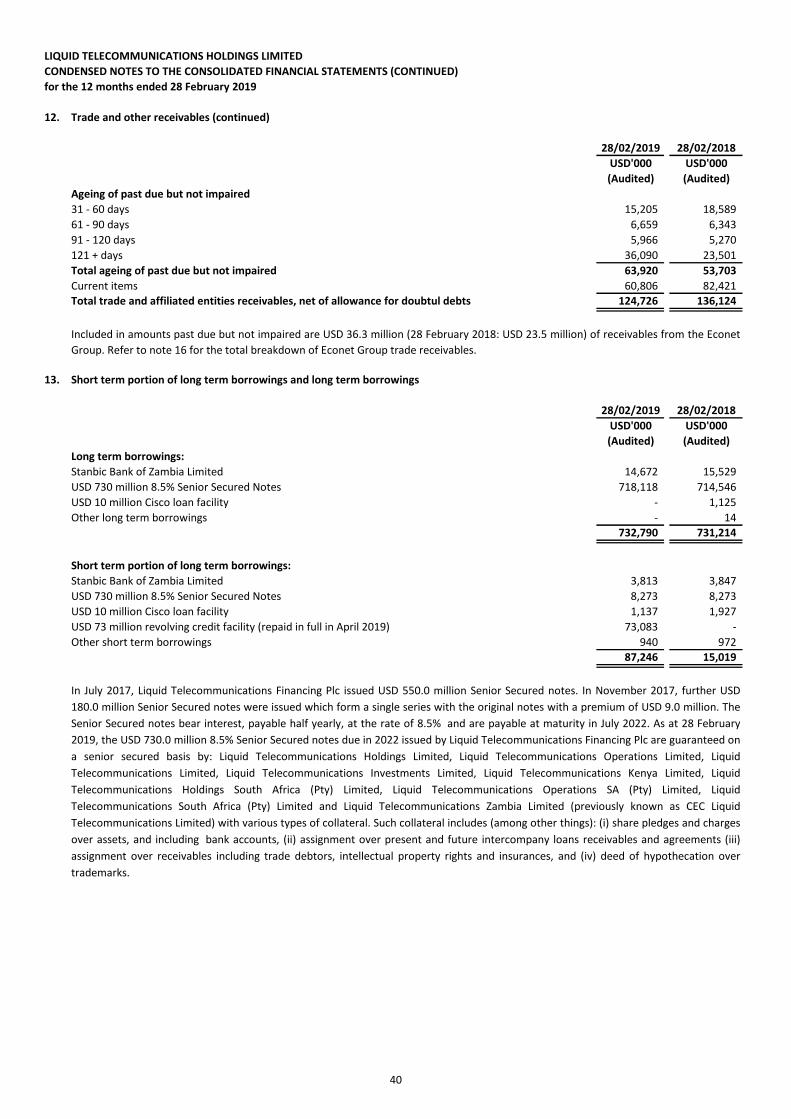
LIQUID TELECOMMUNICATIONS HOLDINGS LIMITED
CONDENSED NOTES TO THE CONSOLIDATED FINANCIAL STATEMENTS (CONTINUED)
for the 12 months ended 28 February 2019
12. Trade and other receivables (continued)
28/02/2019 28/02/2018
USD'000 USD'000
(Audited) (Audited)
Ageing of past due but not impaired
31 - 60 days 15,205 18,589
61 - 90 days 6,659 6,343
91 - 120 days 5,966 5,270
121 + days 36,090 23,501
Total ageing of past due but not impaired 63,920 53,703
Current items 60,806 82,421
Total trade and affiliated entities receivables, net of allowance for doubtul debts 124,726 136,124
13. Short term portion of long term borrowings and long term borrowings
28/02/2019 28/02/2018
USD'000 USD'000
(Audited) (Audited)
Long term borrowings:
LTLSBZStanbic Bank of Zambia Limited 14,672 15,529
LT5YRBONDUSD 730 million 8.5% Senior Secured Notes 718,118 714,546
LTLCISUSD 10 million Cisco loan facility - 1,125
LTOBOther long term borrowings - 14
732,790 731,214
Short term portion of long term borrowings:
STLSBZStanbic Bank of Zambia Limited 3,813 3,847
ST5YRBONDUSD 730 million 8.5% Senior Secured Notes 8,273 8,273
STLCISUSD 10 million Cisco loan facility 1,137 1,927
STLRCFUSD 73 million revolving credit facility (repaid in full in April 2019) 73,083 -
STOBOther short term borrowings 940 972
87,246 15,019
In July 2017, Liquid Telecommunications Financing Plc issued USD 550.0 million Senior Secured notes. In November 2017, further USD
180.0 million Senior Secured notes were issued which form a single series with the original notes with a premium of USD 9.0 million. The
Senior Secured notes bear interest, payable half yearly, at the rate of 8.5% and are payable at maturity in July 2022. As at 28 February
2019, the USD 730.0 million 8.5% Senior Secured notes due in 2022 issued by Liquid Telecommunications Financing Plc are guaranteed on
a senior secured basis by: Liquid Telecommunications Holdings Limited, Liquid Telecommunications Operations Limited, Liquid
Telecommunications Limited, Liquid Telecommunications Investments Limited, Liquid Telecommunications Kenya Limited, Liquid
Telecommunications Holdings South Africa (Pty) Limited, Liquid Telecommunications Operations SA (Pty) Limited, Liquid
Telecommunications South Africa (Pty) Limited and Liquid Telecommunications Zambia Limited (previously known as CEC Liquid
Telecommunications Limited) with various types of collateral. Such collateral includes (among other things): (i) share pledges and charges
over assets, and including bank accounts, (ii) assignment over present and future intercompany loans receivables and agreements (iii)
assignment over receivables including trade debtors, intellectual property rights and insurances, and (iv) deed of hypothecation over
trademarks.
Included in amounts past due but not impaired are USD 36.3 million (28 February 2018: USD 23.5 million) of receivables from the Econet
Group. Refer to note 16 for the total breakdown of Econet Group trade receivables.
40
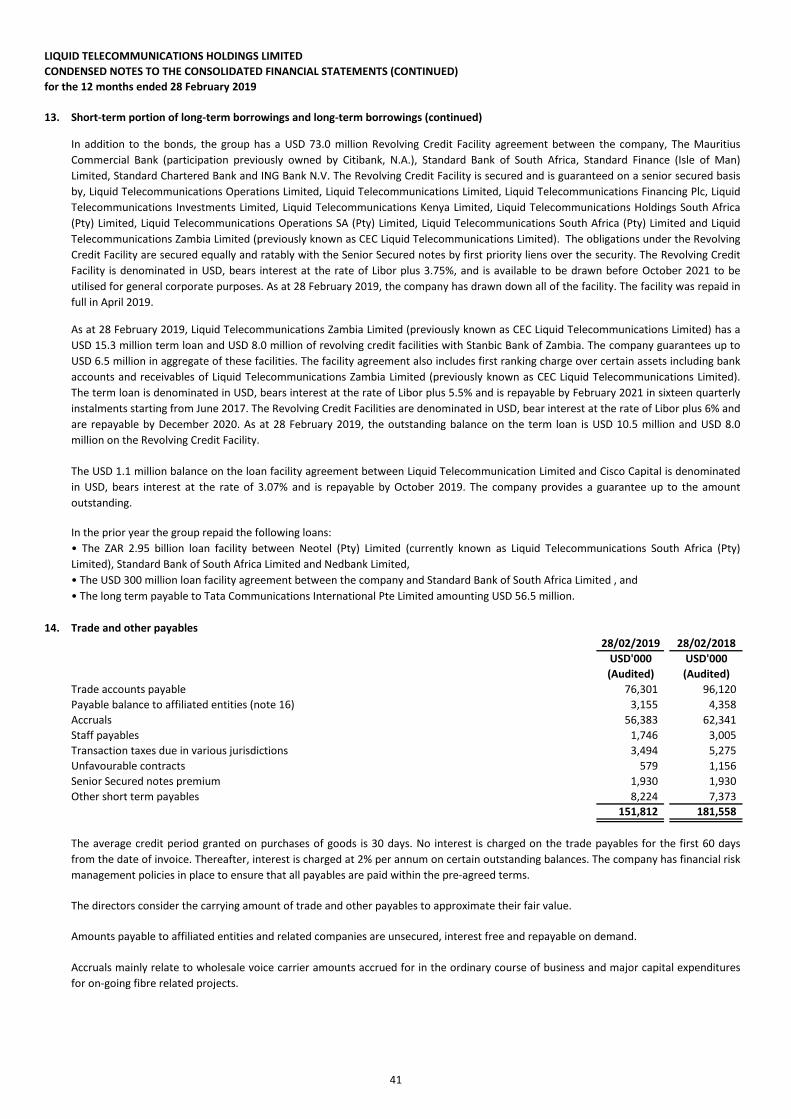
LIQUID TELECOMMUNICATIONS HOLDINGS LIMITED
CONDENSED NOTES TO THE CONSOLIDATED FINANCIAL STATEMENTS (CONTINUED)
for the 12 months ended 28 February 2019
13. Short-term portion of long-term borrowings and long-term borrowings (continued)
14. Trade and other payables
28/02/2019 28/02/2018
USD'000 USD'000
(Audited) (Audited)
TDPAYEXTTrade accounts payable 76,301 96,120
TDPAYICPayable balance to affiliated entities (note 16) 3,155 4,358
ACCRUALSAccruals 56,383 62,341
STAFFPAYStaff payables 1,746 3,005
VAT Transaction taxes due in various jurisdictions 3,494 5,275
STLONEUnfavourable contracts 579 1,156
5YRBPSTSenior Secured notes premium 1,930 1,930
OTHPAYOther short term payables 8,224 7,373
151,812 181,558
Accruals mainly relate to wholesale voice carrier amounts accrued for in the ordinary course of business and major capital expenditures
for on-going fibre related projects.
The average credit period granted on purchases of goods is 30 days. No interest is charged on the trade payables for the first 60 days
from the date of invoice. Thereafter, interest is charged at 2% per annum on certain outstanding balances. The company has financial risk
management policies in place to ensure that all payables are paid within the pre-agreed terms.
The USD 1.1 million balance on the loan facility agreement between Liquid Telecommunication Limited and Cisco Capital is denominated
in USD, bears interest at the rate of 3.07% and is repayable by October 2019. The company provides a guarantee up to the amount
outstanding.
In the prior year the group repaid the following loans:
• The ZAR 2.95 billion loan facility between Neotel (Pty) Limited (currently known as Liquid Telecommunications South Africa (Pty)
Limited), Standard Bank of South Africa Limited and Nedbank Limited,
• The USD 300 million loan facility agreement between the company and Standard Bank of South Africa Limited , and
• The long term payable to Tata Communications International Pte Limited amounting USD 56.5 million.
In addition to the bonds, the group has a USD 73.0 million Revolving Credit Facility agreement between the company, The Mauritius
Commercial Bank (participation previously owned by Citibank, N.A.), Standard Bank of South Africa, Standard Finance (Isle of Man)
Limited, Standard Chartered Bank and ING Bank N.V. The Revolving Credit Facility is secured and is guaranteed on a senior secured basis
by, Liquid Telecommunications Operations Limited, Liquid Telecommunications Limited, Liquid Telecommunications Financing Plc, Liquid
Telecommunications Investments Limited, Liquid Telecommunications Kenya Limited, Liquid Telecommunications Holdings South Africa
(Pty) Limited, Liquid Telecommunications Operations SA (Pty) Limited, Liquid Telecommunications South Africa (Pty) Limited and Liquid
Telecommunications Zambia Limited (previously known as CEC Liquid Telecommunications Limited). The obligations under the Revolving
Credit Facility are secured equally and ratably with the Senior Secured notes by first priority liens over the security. The Revolving Credit
Facility is denominated in USD, bears interest at the rate of Libor plus 3.75%, and is available to be drawn before October 2021 to be
utilised for general corporate purposes. As at 28 February 2019, the company has drawn down all of the facility. The facility was repaid in
full in April 2019.
As at 28 February 2019, Liquid Telecommunications Zambia Limited (previously known as CEC Liquid Telecommunications Limited) has a
USD 15.3 million term loan and USD 8.0 million of revolving credit facilities with Stanbic Bank of Zambia. The company guarantees up to
USD 6.5 million in aggregate of these facilities. The facility agreement also includes first ranking charge over certain assets including bank
accounts and receivables of Liquid Telecommunications Zambia Limited (previously known as CEC Liquid Telecommunications Limited).
The term loan is denominated in USD, bears interest at the rate of Libor plus 5.5% and is repayable by February 2021 in sixteen quarterly
instalments starting from June 2017. The Revolving Credit Facilities are denominated in USD, bear interest at the rate of Libor plus 6% and
are repayable by December 2020. As at 28 February 2019, the outstanding balance on the term loan is USD 10.5 million and USD 8.0
million on the Revolving Credit Facility.
The directors consider the carrying amount of trade and other payables to approximate their fair value.
Amounts payable to affiliated entities and related companies are unsecured, interest free and repayable on demand.
41
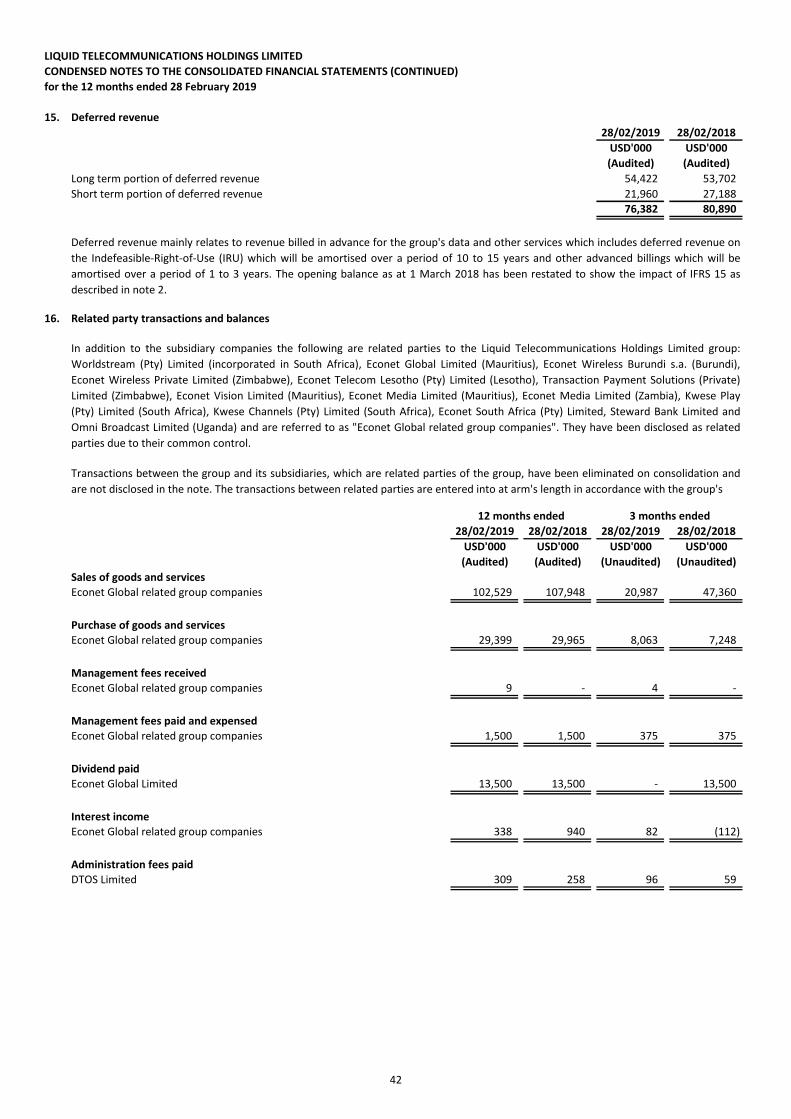
LIQUID TELECOMMUNICATIONS HOLDINGS LIMITED
CONDENSED NOTES TO THE CONSOLIDATED FINANCIAL STATEMENTS (CONTINUED)
for the 12 months ended 28 February 2019
15. Deferred revenue
28/02/2019 28/02/2018
USD'000 USD'000
(Audited) (Audited)
DEFREVLTLong term portion of deferred revenue 54,422 53,702
DEFREVSTShort term portion of deferred revenue 21,960 27,188
76,382 80,890
16. Related party transactions and balances
28/02/2019 28/02/2018 28/02/2019 28/02/2018
USD'000 USD'000 USD'000 USD'000
(Audited) (Audited) (Unaudited) (Unaudited)
Sales of goods and services
ECOREVEconet Global related group companies 102,529 107,948 20,987 47,360
Purchase of goods and services
ECOCOSEconet Global related group companies 29,399 29,965 8,063 7,248
Management fees received
ECOMGTRECEconet Global related group companies 9 - 4 -
Management fees paid and expensed
ECOMGTPDEconet Global related group companies 1,500 1,500 375 375
Dividend paid
EWGDIVPDEconet Global Limited 13,500 13,500 - 13,500
Interest income
ECOINTRECEconet Global related group companies 338 940 82 (112)
Administration fees paid
DTOS Limited 309 258 96 59
3 months ended12 months ended
Deferred revenue mainly relates to revenue billed in advance for the group's data and other services which includes deferred revenue on
the Indefeasible-Right-of-Use (IRU) which will be amortised over a period of 10 to 15 years and other advanced billings which will be
amortised over a period of 1 to 3 years. The opening balance as at 1 March 2018 has been restated to show the impact of IFRS 15 as
described in note 2.
Transactions between the group and its subsidiaries, which are related parties of the group, have been eliminated on consolidation and
are not disclosed in the note. The transactions between related parties are entered into at arm's length in accordance with the group's
In addition to the subsidiary companies the following are related parties to the Liquid Telecommunications Holdings Limited group:
Worldstream (Pty) Limited (incorporated in South Africa), Econet Global Limited (Mauritius), Econet Wireless Burundi s.a. (Burundi),
Econet Wireless Private Limited (Zimbabwe), Econet Telecom Lesotho (Pty) Limited (Lesotho), Transaction Payment Solutions (Private)
Limited (Zimbabwe), Econet Vision Limited (Mauritius), Econet Media Limited (Mauritius), Econet Media Limited (Zambia), Kwese Play
(Pty) Limited (South Africa), Kwese Channels (Pty) Limited (South Africa), Econet South Africa (Pty) Limited, Steward Bank Limited and
Omni Broadcast Limited (Uganda) and are referred to as "Econet Global related group companies". They have been disclosed as related
parties due to their common control.
42
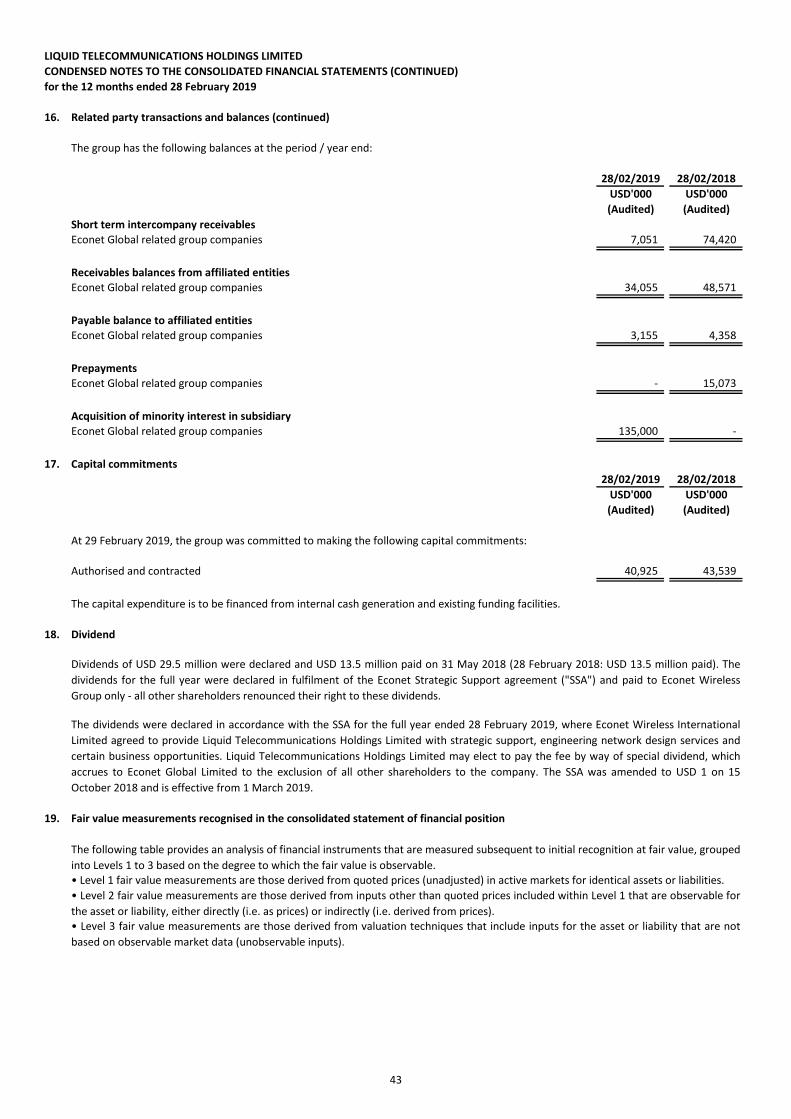
LIQUID TELECOMMUNICATIONS HOLDINGS LIMITED
CONDENSED NOTES TO THE CONSOLIDATED FINANCIAL STATEMENTS (CONTINUED)
for the 12 months ended 28 February 2019
16. Related party transactions and balances (continued)
The group has the following balances at the period / year end:
28/02/2019 28/02/2018
USD'000 USD'000
(Audited) (Audited)
Short term intercompany receivables
ECOSTLRECEconet Global related group companies 7,051 74,420
Receivables balances from affiliated entities
ECOTRDRECEconet Global related group companies 34,055 48,571
Payable balance to affiliated entities
ECOTRDPAYEconet Global related group companies 3,155 4,358
Prepayments
Econet Global related group companies - 15,073
Acquisition of minority interest in subsidiary
Econet Global related group companies 135,000 -
17. Capital commitments
28/02/2019 28/02/2018
USD'000 USD'000
(Audited) (Audited)
Authorised and contracted 40,925 43,539
18. Dividend
19. Fair value measurements recognised in the consolidated statement of financial position
At 29 February 2019, the group was committed to making the following capital commitments:
The capital expenditure is to be financed from internal cash generation and existing funding facilities.
Dividends of USD 29.5 million were declared and USD 13.5 million paid on 31 May 2018 (28 February 2018: USD 13.5 million paid). The
dividends for the full year were declared in fulfilment of the Econet Strategic Support agreement ("SSA") and paid to Econet Wireless
Group only - all other shareholders renounced their right to these dividends.
The following table provides an analysis of financial instruments that are measured subsequent to initial recognition at fair value, grouped
into Levels 1 to 3 based on the degree to which the fair value is observable.
• Level 3 fair value measurements are those derived from valuation techniques that include inputs for the asset or liability that are not
based on observable market data (unobservable inputs).
• Level 2 fair value measurements are those derived from inputs other than quoted prices included within Level 1 that are observable for
the asset or liability, either directly (i.e. as prices) or indirectly (i.e. derived from prices).
The dividends were declared in accordance with the SSA for the full year ended 28 February 2019, where Econet Wireless International
Limited agreed to provide Liquid Telecommunications Holdings Limited with strategic support, engineering network design services and
certain business opportunities. Liquid Telecommunications Holdings Limited may elect to pay the fee by way of special dividend, which
accrues to Econet Global Limited to the exclusion of all other shareholders to the company. The SSA was amended to USD 1 on 15
October 2018 and is effective from 1 March 2019.
• Level 1 fair value measurements are those derived from quoted prices (unadjusted) in active markets for identical assets or liabilities.
43
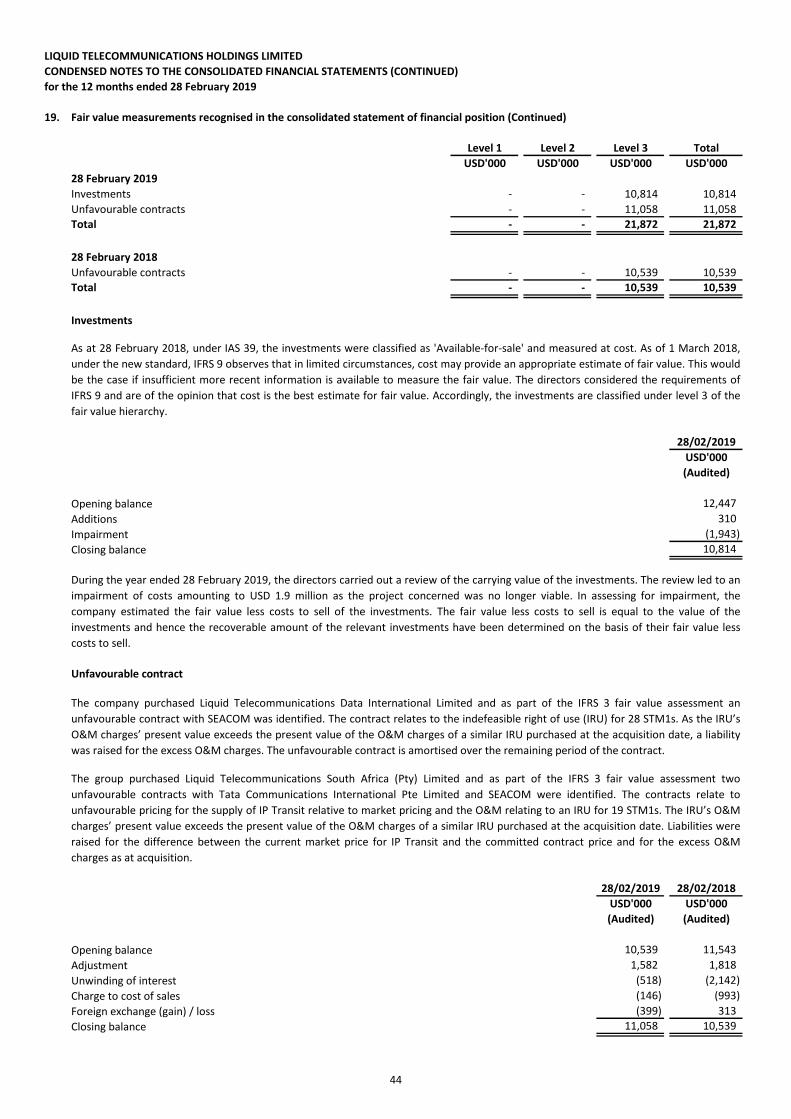
LIQUID TELECOMMUNICATIONS HOLDINGS LIMITED
CONDENSED NOTES TO THE CONSOLIDATED FINANCIAL STATEMENTS (CONTINUED)
for the 12 months ended 28 February 2019
19. Fair value measurements recognised in the consolidated statement of financial position (Continued)
Level 1 Level 2 Level 3 Total
USD'000 USD'000 USD'000 USD'000
28 February 2019
INVT Investments - - 10,814 10,814
UNFCONUnfavourable contracts - - 11,058 11,058
Total - - 21,872 21,872
28 February 2018
UNFCONUnfavourable contracts - - 10,539 10,539
Total - - 10,539 10,539
Investments
28/02/2019
USD'000
(Audited)
Opening balance 12,447
Additions 310
Impairment (1,943)
Closing balance 10,814
Unfavourable contract
28/02/2019 28/02/2018
USD'000 USD'000
(Audited) (Audited)
Opening balance 10,539 11,543
Adjustment 1,582 1,818
Unwinding of interest (518) (2,142)
Charge to cost of sales (146) (993)
Foreign exchange (gain) / loss (399) 313
Closing balance 11,058 10,539
As at 28 February 2018, under IAS 39, the investments were classified as 'Available-for-sale' and measured at cost. As of 1 March 2018,
under the new standard, IFRS 9 observes that in limited circumstances, cost may provide an appropriate estimate of fair value. This would
be the case if insufficient more recent information is available to measure the fair value. The directors considered the requirements of
IFRS 9 and are of the opinion that cost is the best estimate for fair value. Accordingly, the investments are classified under level 3 of the
fair value hierarchy.
The group purchased Liquid Telecommunications South Africa (Pty) Limited and as part of the IFRS 3 fair value assessment two
unfavourable contracts with Tata Communications International Pte Limited and SEACOM were identified. The contracts relate to
unfavourable pricing for the supply of IP Transit relative to market pricing and the O&M relating to an IRU for 19 STM1s. The IRU’s O&M
charges’ present value exceeds the present value of the O&M charges of a similar IRU purchased at the acquisition date. Liabilities were
raised for the difference between the current market price for IP Transit and the committed contract price and for the excess O&M
charges as at acquisition.
The company purchased Liquid Telecommunications Data International Limited and as part of the IFRS 3 fair value assessment an
unfavourable contract with SEACOM was identified. The contract relates to the indefeasible right of use (IRU) for 28 STM1s. As the IRU’s
O&M charges’ present value exceeds the present value of the O&M charges of a similar IRU purchased at the acquisition date, a liability
was raised for the excess O&M charges. The unfavourable contract is amortised over the remaining period of the contract.
During the year ended 28 February 2019, the directors carried out a review of the carrying value of the investments. The review led to an
impairment of costs amounting to USD 1.9 million as the project concerned was no longer viable. In assessing for impairment, the
company estimated the fair value less costs to sell of the investments. The fair value less costs to sell is equal to the value of the
investments and hence the recoverable amount of the relevant investments have been determined on the basis of their fair value less
costs to sell.
44
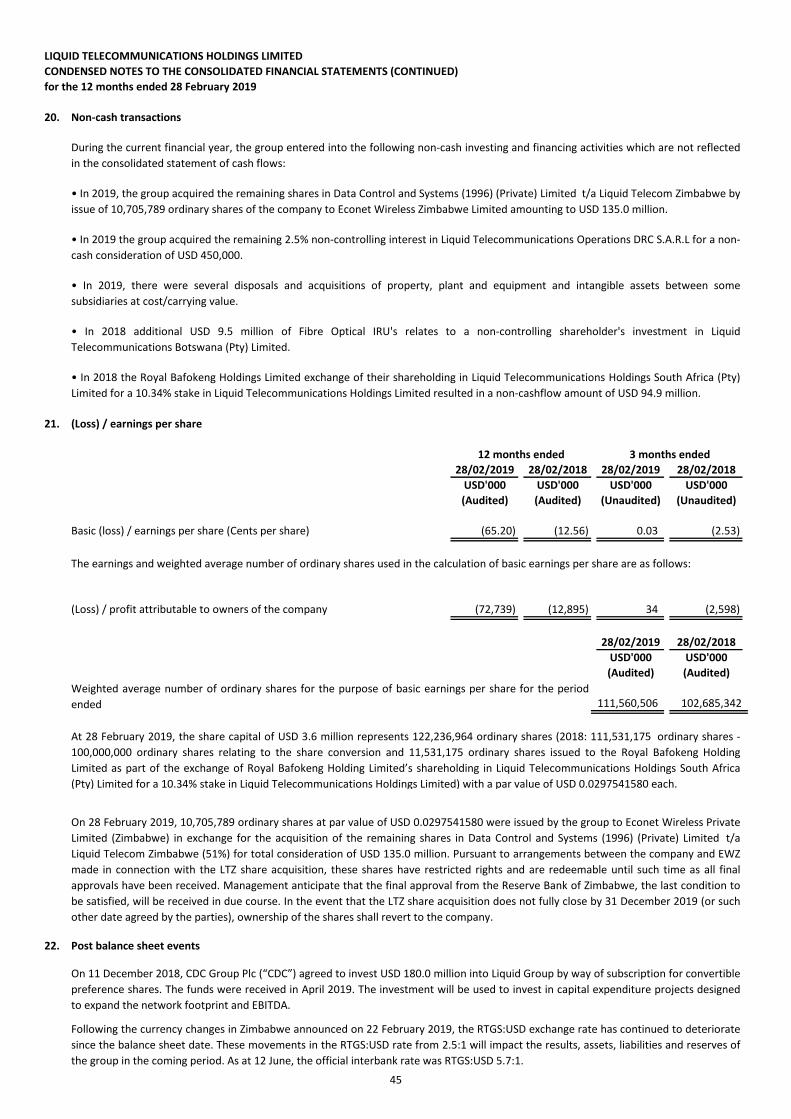
LIQUID TELECOMMUNICATIONS HOLDINGS LIMITED
CONDENSED NOTES TO THE CONSOLIDATED FINANCIAL STATEMENTS (CONTINUED)
for the 12 months ended 28 February 2019
20. Non-cash transactions
21. (Loss) / earnings per share
28/02/2019 28/02/2018 28/02/2019 28/02/2018
USD'000 USD'000 USD'000 USD'000
(Audited) (Audited) (Unaudited) (Unaudited)
Basic (loss) / earnings per share (Cents per share) (65.20) (12.56) 0.03 (2.53)
The earnings and weighted average number of ordinary shares used in the calculation of basic earnings per share are as follows:
(Loss) / profit attributable to owners of the company (72,739) (12,895) 34 (2,598)
28/02/2019 28/02/2018
USD'000 USD'000
(Audited) (Audited)
22. Post balance sheet events
• In 2019 the group acquired the remaining 2.5% non-controlling interest in Liquid Telecommunications Operations DRC S.A.R.L for a non-
cash consideration of USD 450,000.
• In 2019, the group acquired the remaining shares in Data Control and Systems (1996) (Private) Limited t/a Liquid Telecom Zimbabwe by
issue of 10,705,789 ordinary shares of the company to Econet Wireless Zimbabwe Limited amounting to USD 135.0 million.
Following the currency changes in Zimbabwe announced on 22 February 2019, the RTGS:USD exchange rate has continued to deteriorate
since the balance sheet date. These movements in the RTGS:USD rate from 2.5:1 will impact the results, assets, liabilities and reserves of
the group in the coming period. As at 12 June, the official interbank rate was RTGS:USD 5.7:1.
• In 2019, there were several disposals and acquisitions of property, plant and equipment and intangible assets between some
subsidiaries at cost/carrying value.
On 28 February 2019, 10,705,789 ordinary shares at par value of USD 0.0297541580 were issued by the group to Econet Wireless Private
Limited (Zimbabwe) in exchange for the acquisition of the remaining shares in Data Control and Systems (1996) (Private) Limited t/a
Liquid Telecom Zimbabwe (51%) for total consideration of USD 135.0 million. Pursuant to arrangements between the company and EWZ
made in connection with the LTZ share acquisition, these shares have restricted rights and are redeemable until such time as all final
approvals have been received. Management anticipate that the final approval from the Reserve Bank of Zimbabwe, the last condition to
be satisfied, will be received in due course. In the event that the LTZ share acquisition does not fully close by 31 December 2019 (or such
other date agreed by the parties), ownership of the shares shall revert to the company.
Weighted average number of ordinary shares for the purpose of basic earnings per share for the period
ended
12 months ended 3 months ended
• In 2018 additional USD 9.5 million of Fibre Optical IRU's relates to a non-controlling shareholder's investment in Liquid
Telecommunications Botswana (Pty) Limited.
• In 2018 the Royal Bafokeng Holdings Limited exchange of their shareholding in Liquid Telecommunications Holdings South Africa (Pty)
Limited for a 10.34% stake in Liquid Telecommunications Holdings Limited resulted in a non-cashflow amount of USD 94.9 million.
111,560,506 102,685,342
During the current financial year, the group entered into the following non-cash investing and financing activities which are not reflected
in the consolidated statement of cash flows:
At 28 February 2019, the share capital of USD 3.6 million represents 122,236,964 ordinary shares (2018: 111,531,175 ordinary shares -
100,000,000 ordinary shares relating to the share conversion and 11,531,175 ordinary shares issued to the Royal Bafokeng Holding
Limited as part of the exchange of Royal Bafokeng Holding Limited’s shareholding in Liquid Telecommunications Holdings South Africa
(Pty) Limited for a 10.34% stake in Liquid Telecommunications Holdings Limited) with a par value of USD 0.0297541580 each.
On 11 December 2018, CDC Group Plc (“CDC”) agreed to invest USD 180.0 million into Liquid Group by way of subscription for convertible
preference shares. The funds were received in April 2019. The investment will be used to invest in capital expenditure projects designed
to expand the network footprint and EBITDA.
45
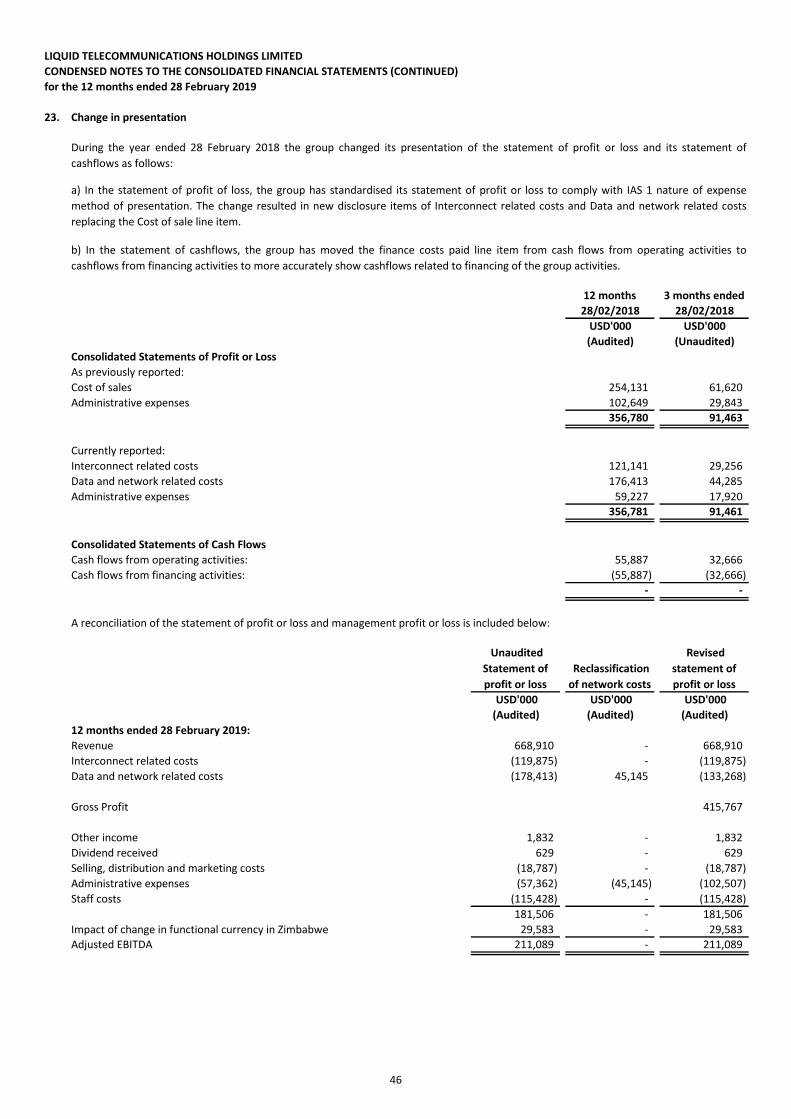
LIQUID TELECOMMUNICATIONS HOLDINGS LIMITED
CONDENSED NOTES TO THE CONSOLIDATED FINANCIAL STATEMENTS (CONTINUED)
for the 12 months ended 28 February 2019
23. Change in presentation
12 months 3 months ended
28/02/2018 28/02/2018
USD'000 USD'000
(Audited) (Unaudited)
Consolidated Statements of Profit or Loss
As previously reported:
Cost of sales 254,131 61,620
Administrative expenses 102,649 29,843
356,780 91,463
Currently reported:
Interconnect related costs 121,141 29,256
Data and network related costs 176,413 44,285
Administrative expenses 59,227 17,920
356,781 91,461
Consolidated Statements of Cash Flows
Cash flows from operating activities: 55,887 32,666
Cash flows from financing activities: (55,887) (32,666)
- -
USD'000 USD'000 USD'000
(Audited) (Audited) (Audited)
12 months ended 28 February 2019:
Revenue 668,910 - 668,910
Interconnect related costs (119,875) - (119,875)
Data and network related costs (178,413) 45,145 (133,268)
Gross Profit 415,767
Other income 1,832 - 1,832
Dividend received 629 - 629
Selling, distribution and marketing costs (18,787) - (18,787)
Administrative expenses (57,362) (45,145) (102,507)
Staff costs (115,428) - (115,428)
181,506 - 181,506
Impact of change in functional currency in Zimbabwe 29,583 - 29,583
Adjusted EBITDA 211,089 - 211,089
During the year ended 28 February 2018 the group changed its presentation of the statement of profit or loss and its statement of
cashflows as follows:
a) In the statement of profit of loss, the group has standardised its statement of profit or loss to comply with IAS 1 nature of expense
method of presentation. The change resulted in new disclosure items of Interconnect related costs and Data and network related costs
replacing the Cost of sale line item.
A reconciliation of the statement of profit or loss and management profit or loss is included below:
Unaudited
Statement of
profit or loss
Revised
statement of
profit or loss
Reclassification
of network costs
b) In the statement of cashflows, the group has moved the finance costs paid line item from cash flows from operating activities to
cashflows from financing activities to more accurately show cashflows related to financing of the group activities.
46
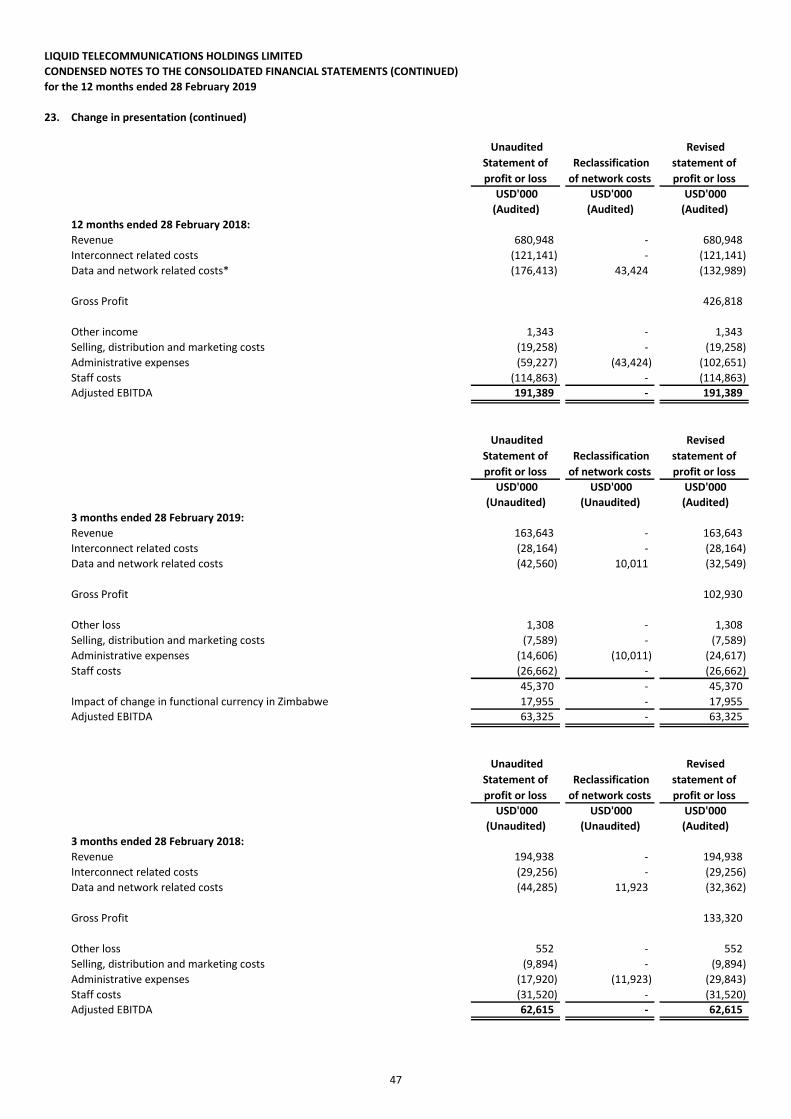
LIQUID TELECOMMUNICATIONS HOLDINGS LIMITED
CONDENSED NOTES TO THE CONSOLIDATED FINANCIAL STATEMENTS (CONTINUED)
for the 12 months ended 28 February 2019
23. Change in presentation (continued)
USD'000 USD'000 USD'000
(Audited) (Audited) (Audited)
12 months ended 28 February 2018:
Revenue 680,948 - 680,948
Interconnect related costs (121,141) - (121,141)
Data and network related costs* (176,413) 43,424 (132,989)
Gross Profit 426,818
Other income 1,343 - 1,343
Selling, distribution and marketing costs (19,258) - (19,258)
Administrative expenses (59,227) (43,424) (102,651)
Staff costs (114,863) - (114,863)
Adjusted EBITDA 191,389 - 191,389
USD'000 USD'000 USD'000
(Unaudited) (Unaudited) (Audited)
3 months ended 28 February 2019:
Revenue 163,643 - 163,643
Interconnect related costs (28,164) - (28,164)
Data and network related costs (42,560) 10,011 (32,549)
Gross Profit 102,930
Other loss 1,308 - 1,308
Selling, distribution and marketing costs (7,589) - (7,589)
Administrative expenses (14,606) (10,011) (24,617)
Staff costs (26,662) - (26,662)
45,370 - 45,370
Impact of change in functional currency in Zimbabwe 17,955 - 17,955
Adjusted EBITDA 63,325 - 63,325
USD'000 USD'000 USD'000
(Unaudited) (Unaudited) (Audited)
3 months ended 28 February 2018:
Revenue 194,938 - 194,938
Interconnect related costs (29,256) - (29,256)
Data and network related costs (44,285) 11,923 (32,362)
Gross Profit 133,320
Other loss 552 - 552
Selling, distribution and marketing costs (9,894) - (9,894)
Administrative expenses (17,920) (11,923) (29,843)
Staff costs (31,520) - (31,520)
Adjusted EBITDA 62,615 - 62,615
Reclassification
of network costs
Unaudited
Statement of
profit or loss
Revised
statement of
profit or loss
Reclassification
of network costs
Unaudited
Statement of
profit or loss
Revised
statement of
profit or loss
Reclassification
of network costs
Unaudited
Statement of
profit or loss
Revised
statement of
profit or loss
47